Roy, NM Map & Demographics
Roy Map
Roy Overview
$107,861
PER CAPITA INCOME
$38,693
AVG HOUSEHOLD INCOME
34.3%
WAGE / INCOME GAP [ % ]
65.7¢/ $1
WAGE / INCOME GAP [ $ ]
0.73
INEQUALITY / GINI INDEX
278
TOTAL POPULATION
134
MALE POPULATION
144
FEMALE POPULATION
93.06
MALES / 100 FEMALES
107.46
FEMALES / 100 MALES
42.9
MEDIAN AGE
3.9
AVG FAMILY SIZE
2.5
AVG HOUSEHOLD SIZE
169
LABOR FORCE [ PEOPLE ]
63.8%
PERCENT IN LABOR FORCE
13.0%
UNEMPLOYMENT RATE
Roy Zip Codes
Roy Area Codes
Income in Roy
Income Overview in Roy
| Characteristic | Number | Measure |
| Per Capita Income | 278 | $107,861 |
| Median Family Income | 54 | $0 |
| Mean Family Income | 54 | $468,350 |
| Median Household Income | 113 | $38,693 |
| Mean Household Income | 113 | $240,211 |
| Income Deficit | 54 | $0 |
| Wage / Income Gap (%) | 278 | 34.28% |
| Wage / Income Gap ($) | 278 | 65.72¢ per $1 |
| Gini / Inequality Index | 278 | 0.73 |
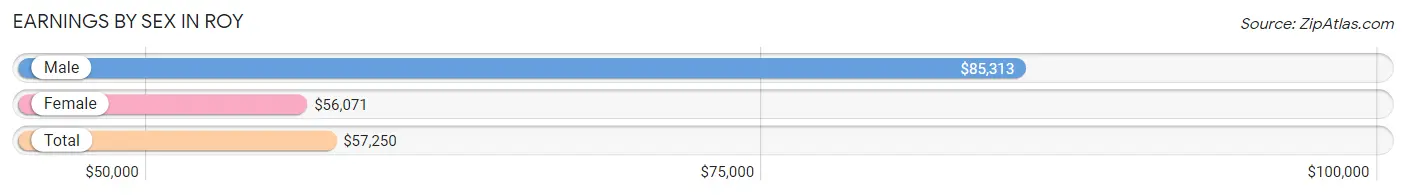
Earnings by Sex in Roy
Average Earnings in Roy are $57,250, $85,313 for men and $56,071 for women, a difference of 34.3%.
| Sex | Number | Average Earnings |
| Male | 76 (45.8%) | $85,313 |
| Female | 90 (54.2%) | $56,071 |
| Total | 166 (100.0%) | $57,250 |
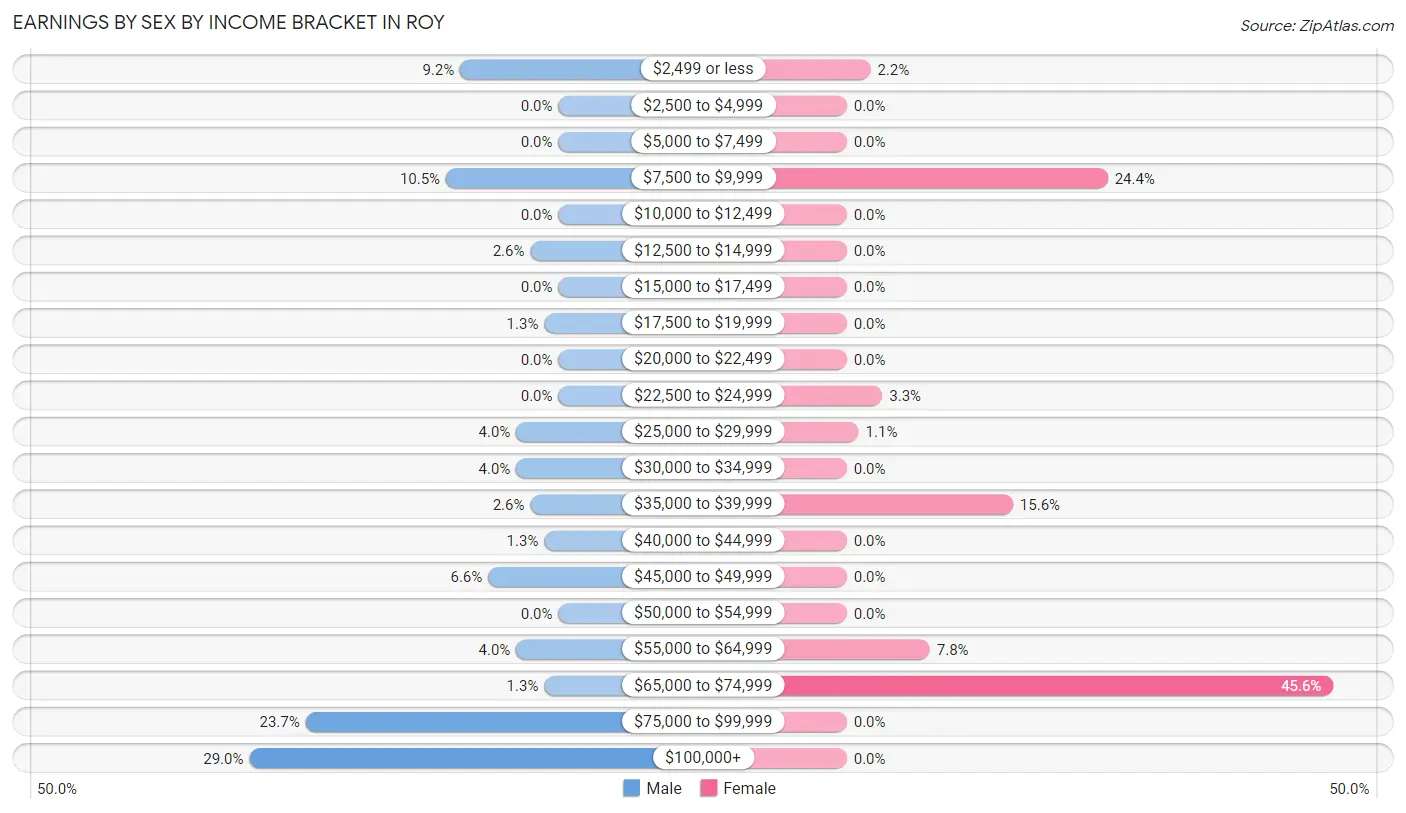
Earnings by Sex by Income Bracket in Roy
The most common earnings brackets in Roy are $100,000+ for men (22 | 28.9%) and $65,000 to $74,999 for women (41 | 45.6%).
| Income | Male | Female |
| $2,499 or less | 7 (9.2%) | 2 (2.2%) |
| $2,500 to $4,999 | 0 (0.0%) | 0 (0.0%) |
| $5,000 to $7,499 | 0 (0.0%) | 0 (0.0%) |
| $7,500 to $9,999 | 8 (10.5%) | 22 (24.4%) |
| $10,000 to $12,499 | 0 (0.0%) | 0 (0.0%) |
| $12,500 to $14,999 | 2 (2.6%) | 0 (0.0%) |
| $15,000 to $17,499 | 0 (0.0%) | 0 (0.0%) |
| $17,500 to $19,999 | 1 (1.3%) | 0 (0.0%) |
| $20,000 to $22,499 | 0 (0.0%) | 0 (0.0%) |
| $22,500 to $24,999 | 0 (0.0%) | 3 (3.3%) |
| $25,000 to $29,999 | 3 (4.0%) | 1 (1.1%) |
| $30,000 to $34,999 | 3 (4.0%) | 0 (0.0%) |
| $35,000 to $39,999 | 2 (2.6%) | 14 (15.6%) |
| $40,000 to $44,999 | 1 (1.3%) | 0 (0.0%) |
| $45,000 to $49,999 | 5 (6.6%) | 0 (0.0%) |
| $50,000 to $54,999 | 0 (0.0%) | 0 (0.0%) |
| $55,000 to $64,999 | 3 (4.0%) | 7 (7.8%) |
| $65,000 to $74,999 | 1 (1.3%) | 41 (45.6%) |
| $75,000 to $99,999 | 18 (23.7%) | 0 (0.0%) |
| $100,000+ | 22 (28.9%) | 0 (0.0%) |
| Total | 76 (100.0%) | 90 (100.0%) |
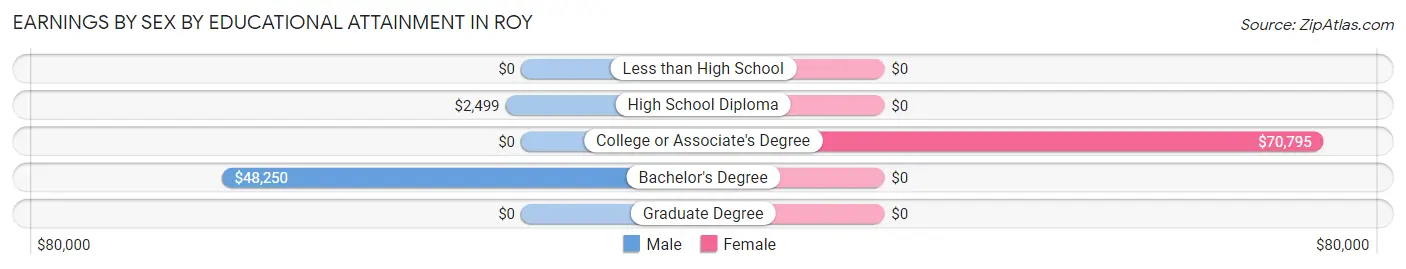
Earnings by Sex by Educational Attainment in Roy
| Educational Attainment | Male Income | Female Income |
| Less than High School | - | - |
| High School Diploma | $2,499 | $0 |
| College or Associate's Degree | - | - |
| Bachelor's Degree | $48,250 | $0 |
| Graduate Degree | - | - |
| Total | - | - |
Family Income in Roy
Family Income Brackets in Roy
According to the Roy family income data, there are 19 families falling into the $200,000+ income range, which is the most common income bracket and makes up 35.2% of all families.
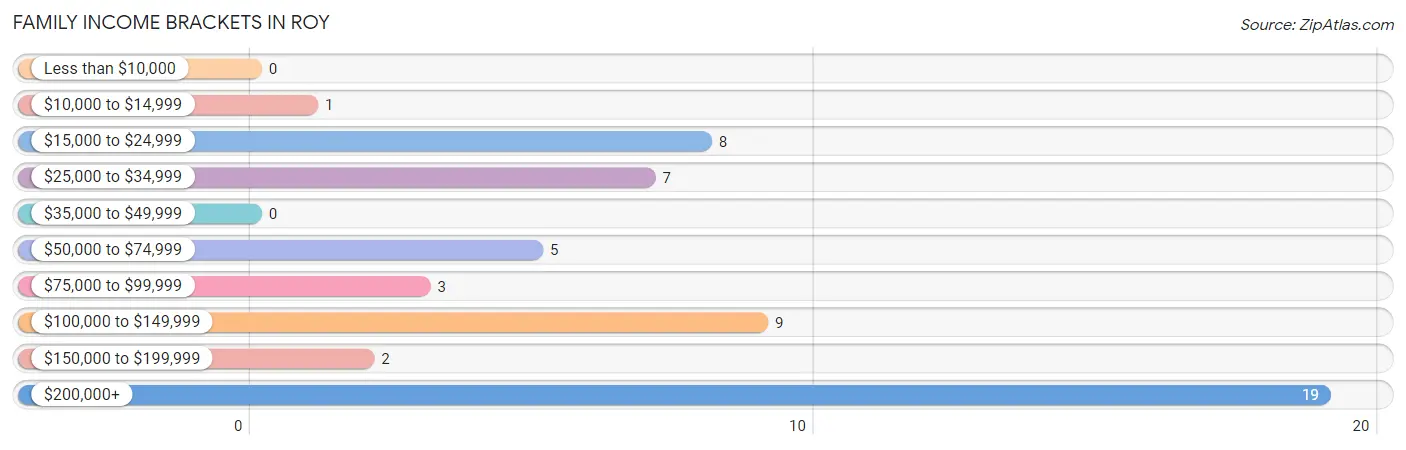
| Income Bracket | # Families | % Families |
| Less than $10,000 | 0 | 0.0% |
| $10,000 to $14,999 | 1 | 1.9% |
| $15,000 to $24,999 | 8 | 14.8% |
| $25,000 to $34,999 | 7 | 13.0% |
| $35,000 to $49,999 | 0 | 0.0% |
| $50,000 to $74,999 | 5 | 9.3% |
| $75,000 to $99,999 | 3 | 5.6% |
| $100,000 to $149,999 | 9 | 16.7% |
| $150,000 to $199,999 | 2 | 3.7% |
| $200,000+ | 19 | 35.2% |
Family Income by Famaliy Size in Roy
3-person families (31 | 57.4%) account for the highest median family income in Roy with $250,001 per family, while 3-person families (31 | 57.4%) have the highest median income of $83,334 per family member.
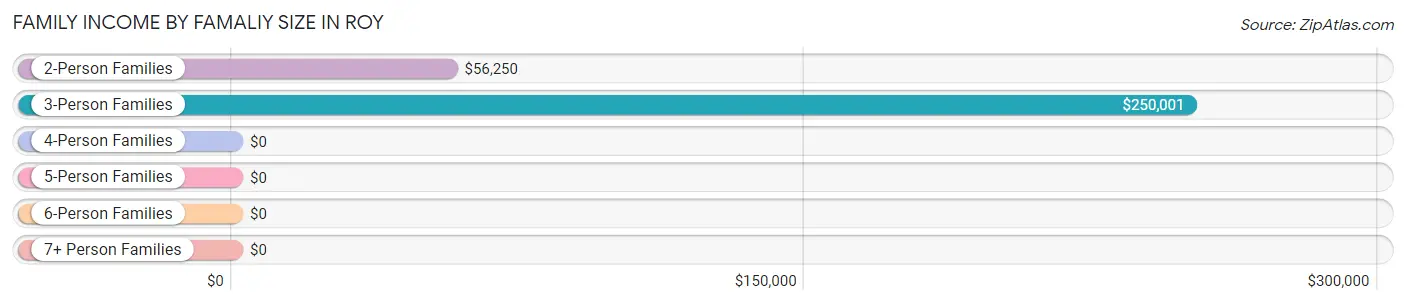
| Income Bracket | # Families | Median Income |
| 2-Person Families | 23 (42.6%) | $56,250 |
| 3-Person Families | 31 (57.4%) | $250,001 |
| 4-Person Families | 0 (0.0%) | $0 |
| 5-Person Families | 0 (0.0%) | $0 |
| 6-Person Families | 0 (0.0%) | $0 |
| 7+ Person Families | 0 (0.0%) | $0 |
| Total | 54 (100.0%) | $0 |
Family Income by Number of Earners in Roy
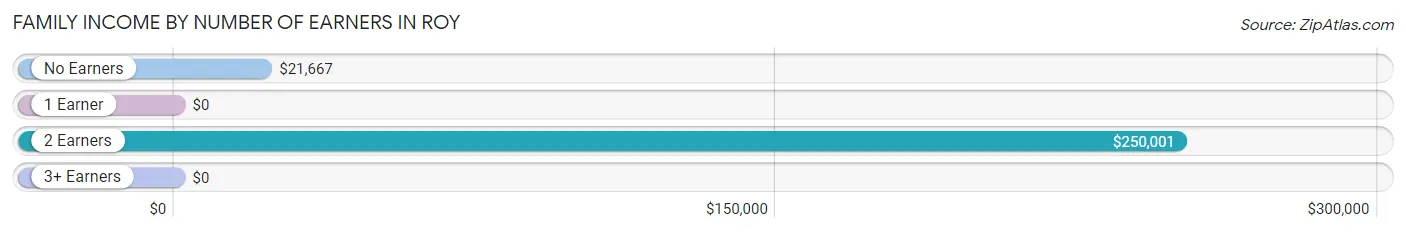
| Number of Earners | # Families | Median Income |
| No Earners | 12 (22.2%) | $21,667 |
| 1 Earner | 13 (24.1%) | $0 |
| 2 Earners | 24 (44.4%) | $250,001 |
| 3+ Earners | 5 (9.3%) | $0 |
| Total | 54 (100.0%) | $0 |
Household Income in Roy
Household Income Brackets in Roy
With 32 households falling in the category, the $35,000 to $49,999 income range is the most frequent in Roy, accounting for 28.3% of all households. In contrast, only 2 households (1.8%) fall into the less than $10,000 income bracket, making it the least populous group.
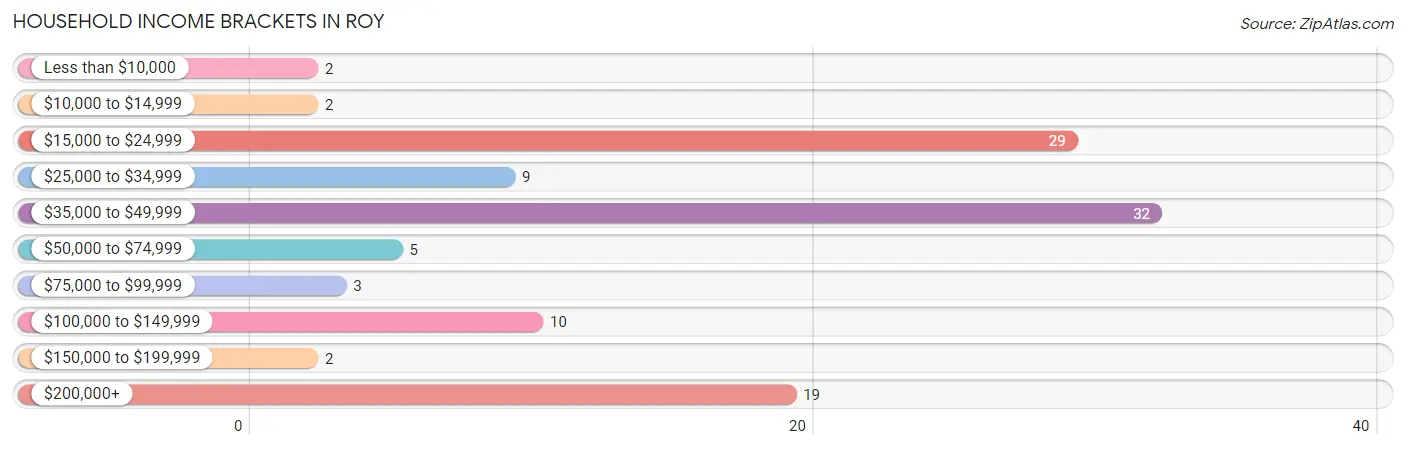
| Income Bracket | # Households | % Households |
| Less than $10,000 | 2 | 1.8% |
| $10,000 to $14,999 | 2 | 1.8% |
| $15,000 to $24,999 | 29 | 25.7% |
| $25,000 to $34,999 | 9 | 8.0% |
| $35,000 to $49,999 | 32 | 28.3% |
| $50,000 to $74,999 | 5 | 4.4% |
| $75,000 to $99,999 | 3 | 2.7% |
| $100,000 to $149,999 | 10 | 8.8% |
| $150,000 to $199,999 | 2 | 1.8% |
| $200,000+ | 19 | 16.8% |
Household Income by Householder Age in Roy
The median household income in Roy is $38,693, with the highest median household income of $250,001 found in the 25 to 44 years age bracket for the primary householder. A total of 30 households (26.6%) fall into this category.
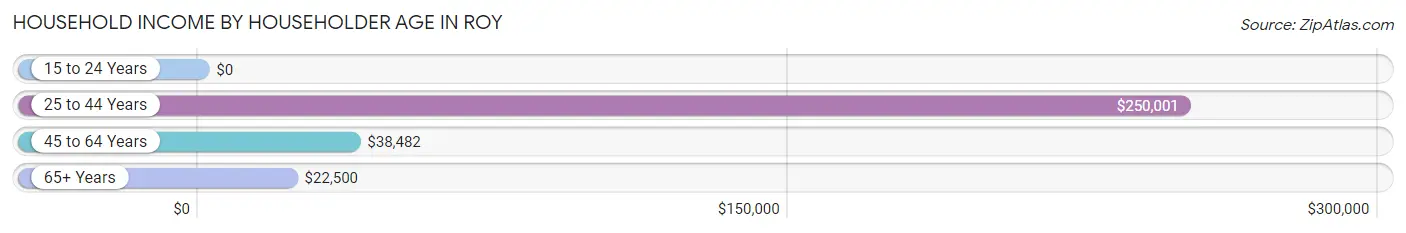
| Income Bracket | # Households | Median Income |
| 15 to 24 Years | 0 (0.0%) | $0 |
| 25 to 44 Years | 30 (26.6%) | $250,001 |
| 45 to 64 Years | 45 (39.8%) | $38,482 |
| 65+ Years | 38 (33.6%) | $22,500 |
| Total | 113 (100.0%) | $38,693 |
Poverty in Roy
Income Below Poverty by Sex and Age in Roy
With 24.6% poverty level for males and 11.8% for females among the residents of Roy, 45 to 54 year old males and 6 to 11 year old females are the most vulnerable to poverty, with 16 males (100.0%) and 10 females (100.0%) in their respective age groups living below the poverty level.
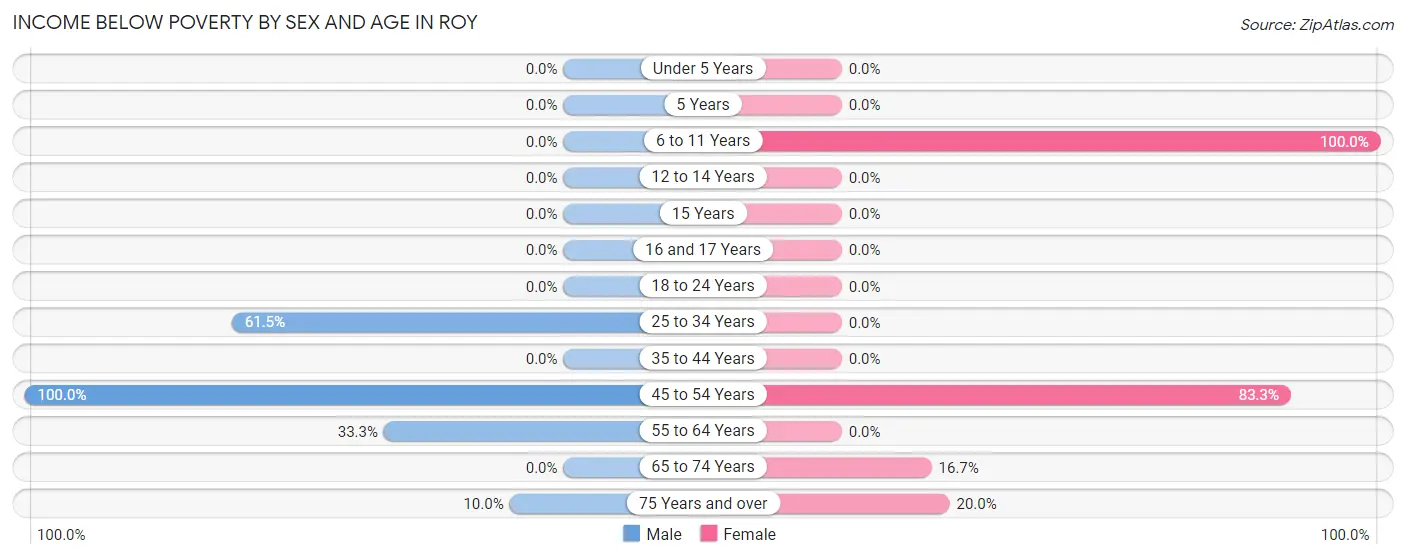
| Age Bracket | Male | Female |
| Under 5 Years | 0 (0.0%) | 0 (0.0%) |
| 5 Years | 0 (0.0%) | 0 (0.0%) |
| 6 to 11 Years | 0 (0.0%) | 10 (100.0%) |
| 12 to 14 Years | 0 (0.0%) | 0 (0.0%) |
| 15 Years | 0 (0.0%) | 0 (0.0%) |
| 16 and 17 Years | 0 (0.0%) | 0 (0.0%) |
| 18 to 24 Years | 0 (0.0%) | 0 (0.0%) |
| 25 to 34 Years | 8 (61.5%) | 0 (0.0%) |
| 35 to 44 Years | 0 (0.0%) | 0 (0.0%) |
| 45 to 54 Years | 16 (100.0%) | 5 (83.3%) |
| 55 to 64 Years | 8 (33.3%) | 0 (0.0%) |
| 65 to 74 Years | 0 (0.0%) | 1 (16.7%) |
| 75 Years and over | 1 (10.0%) | 1 (20.0%) |
| Total | 33 (24.6%) | 17 (11.8%) |
Income Above Poverty by Sex and Age in Roy
According to the poverty statistics in Roy, males aged 12 to 14 years and females aged 18 to 24 years are the age groups that are most secure financially, with 100.0% of males and 100.0% of females in these age groups living above the poverty line.
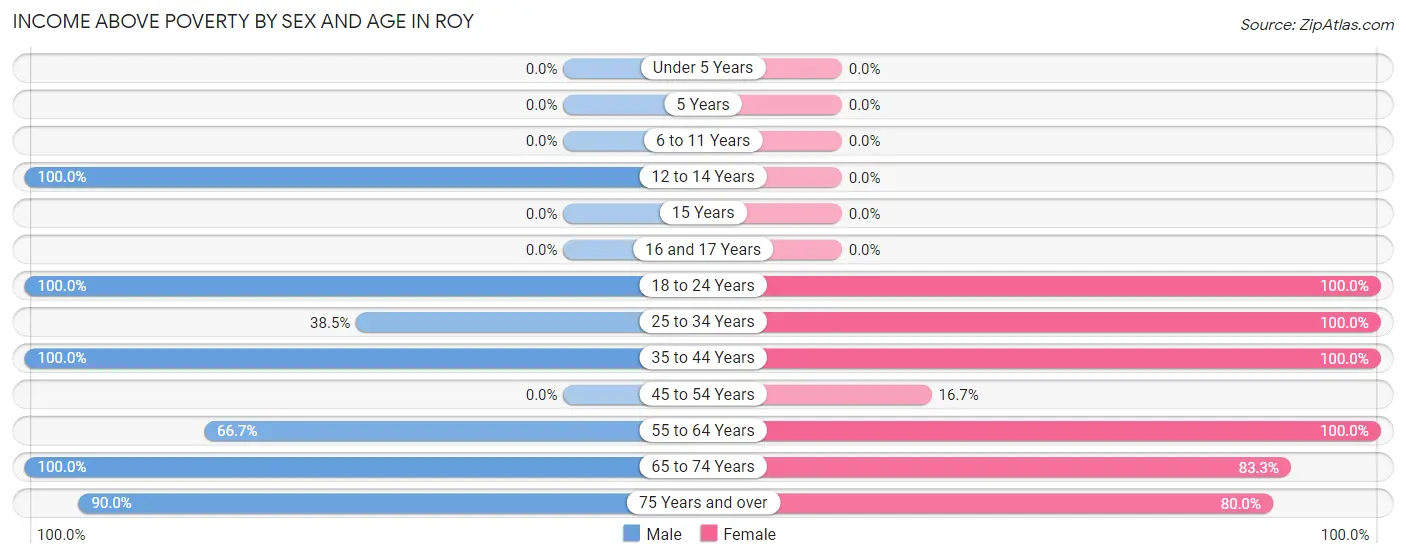
| Age Bracket | Male | Female |
| Under 5 Years | 0 (0.0%) | 0 (0.0%) |
| 5 Years | 0 (0.0%) | 0 (0.0%) |
| 6 to 11 Years | 0 (0.0%) | 0 (0.0%) |
| 12 to 14 Years | 3 (100.0%) | 0 (0.0%) |
| 15 Years | 0 (0.0%) | 0 (0.0%) |
| 16 and 17 Years | 0 (0.0%) | 0 (0.0%) |
| 18 to 24 Years | 14 (100.0%) | 35 (100.0%) |
| 25 to 34 Years | 5 (38.5%) | 11 (100.0%) |
| 35 to 44 Years | 25 (100.0%) | 30 (100.0%) |
| 45 to 54 Years | 0 (0.0%) | 1 (16.7%) |
| 55 to 64 Years | 16 (66.7%) | 41 (100.0%) |
| 65 to 74 Years | 29 (100.0%) | 5 (83.3%) |
| 75 Years and over | 9 (90.0%) | 4 (80.0%) |
| Total | 101 (75.4%) | 127 (88.2%) |
Income Below Poverty Among Married-Couple Families in Roy
The poverty statistics for married-couple families in Roy show that 2.0% or 1 of the total 49 families live below the poverty line. Families with 1 or 2 children have the highest poverty rate of 100.0%, comprising of 1 families. On the other hand, families with no children have the lowest poverty rate of 0.0%, which includes 0 families.
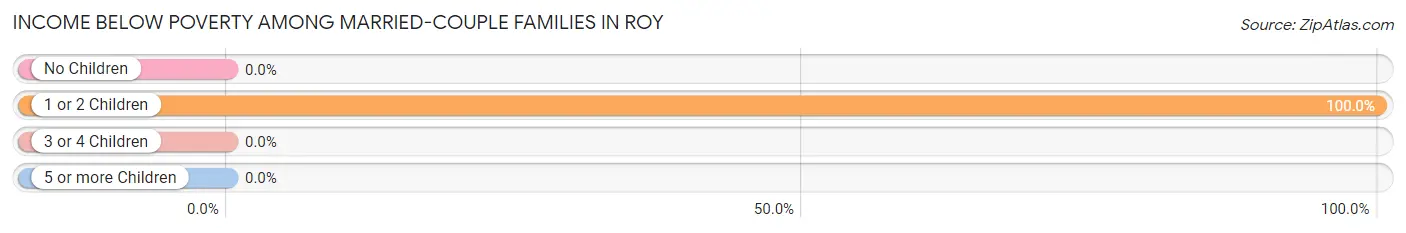
| Children | Above Poverty | Below Poverty |
| No Children | 48 (100.0%) | 0 (0.0%) |
| 1 or 2 Children | 0 (0.0%) | 1 (100.0%) |
| 3 or 4 Children | 0 (0.0%) | 0 (0.0%) |
| 5 or more Children | 0 (0.0%) | 0 (0.0%) |
| Total | 48 (98.0%) | 1 (2.0%) |
Income Below Poverty Among Single-Parent Households in Roy
According to the poverty data in Roy, 25.0% or 1 single-father households and 100.0% or 1 single-mother households are living below the poverty line. Among single-father households, those with no children have the highest poverty rate, with 1 households (100.0%) experiencing poverty. Likewise, among single-mother households, those with no children have the highest poverty rate, with 1 households (100.0%) falling below the poverty line.
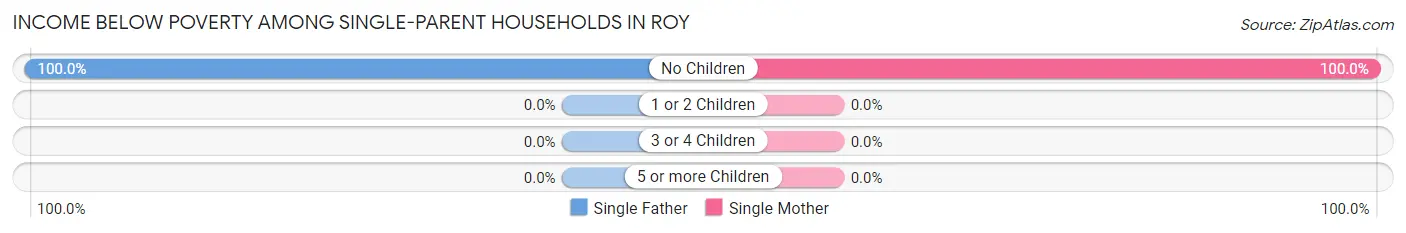
| Children | Single Father | Single Mother |
| No Children | 1 (100.0%) | 1 (100.0%) |
| 1 or 2 Children | 0 (0.0%) | 0 (0.0%) |
| 3 or 4 Children | 0 (0.0%) | 0 (0.0%) |
| 5 or more Children | 0 (0.0%) | 0 (0.0%) |
| Total | 1 (25.0%) | 1 (100.0%) |
Income Below Poverty Among Married-Couple vs Single-Parent Households in Roy
The poverty data for Roy shows that 1 of the married-couple family households (2.0%) and 2 of the single-parent households (40.0%) are living below the poverty level. Within the married-couple family households, those with 1 or 2 children have the highest poverty rate, with 1 households (100.0%) falling below the poverty line. Among the single-parent households, those with no children have the highest poverty rate, with 2 household (100.0%) living below poverty.
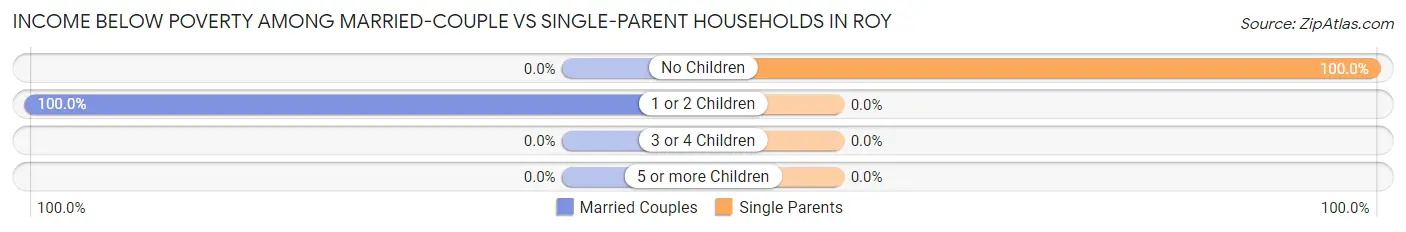
| Children | Married-Couple Families | Single-Parent Households |
| No Children | 0 (0.0%) | 2 (100.0%) |
| 1 or 2 Children | 1 (100.0%) | 0 (0.0%) |
| 3 or 4 Children | 0 (0.0%) | 0 (0.0%) |
| 5 or more Children | 0 (0.0%) | 0 (0.0%) |
| Total | 1 (2.0%) | 2 (40.0%) |
Race in Roy
The most populous races in Roy are Some other Race (165 | 59.4%), Hispanic or Latino (160 | 57.6%), and White / Caucasian (78 | 28.1%).
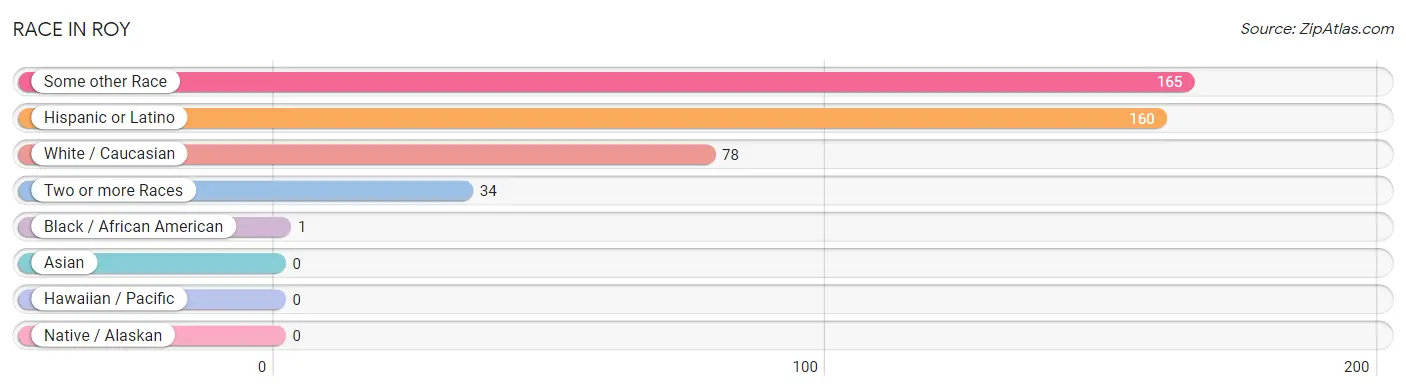
| Race | # Population | % Population |
| Asian | 0 | 0.0% |
| Black / African American | 1 | 0.4% |
| Hawaiian / Pacific | 0 | 0.0% |
| Hispanic or Latino | 160 | 57.6% |
| Native / Alaskan | 0 | 0.0% |
| White / Caucasian | 78 | 28.1% |
| Two or more Races | 34 | 12.2% |
| Some other Race | 165 | 59.4% |
| Total | 278 | 100.0% |
Ancestry in Roy
The most populous ancestries reported in Roy are Mexican (44 | 15.8%), American (10 | 3.6%), Spanish (10 | 3.6%), German (8 | 2.9%), and English (7 | 2.5%), together accounting for 28.4% of all Roy residents.
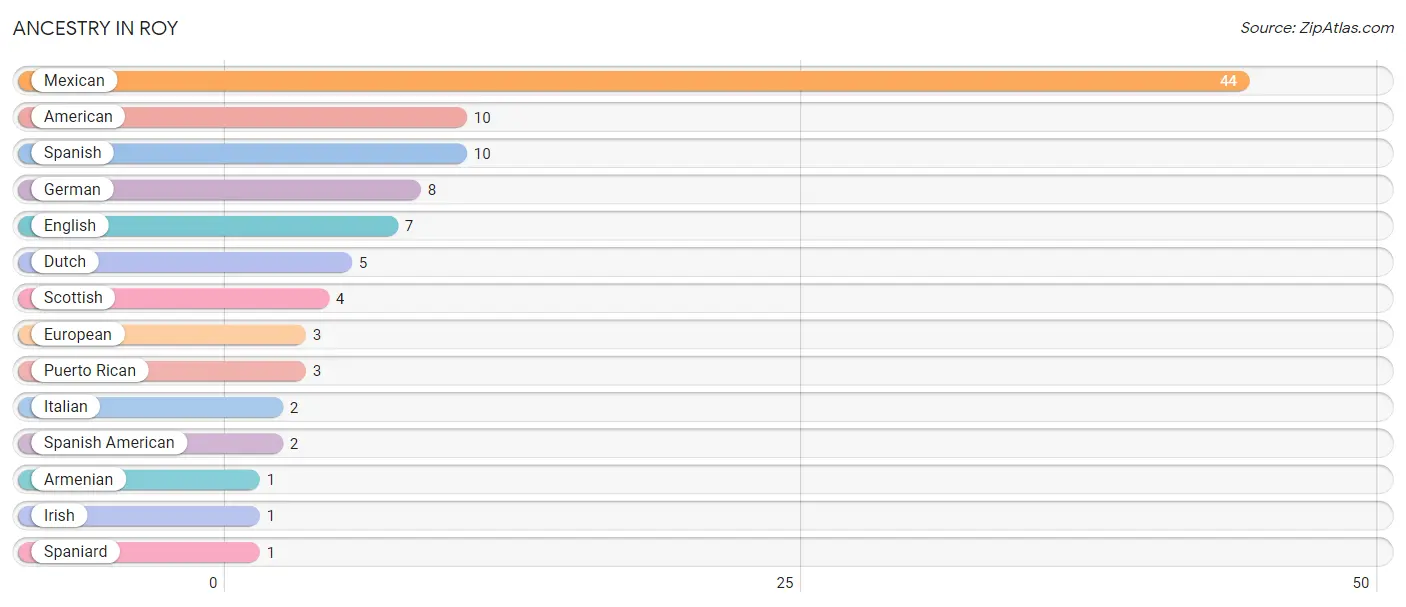
| Ancestry | # Population | % Population |
| American | 10 | 3.6% |
| Armenian | 1 | 0.4% |
| Dutch | 5 | 1.8% |
| English | 7 | 2.5% |
| European | 3 | 1.1% |
| German | 8 | 2.9% |
| Irish | 1 | 0.4% |
| Italian | 2 | 0.7% |
| Mexican | 44 | 15.8% |
| Puerto Rican | 3 | 1.1% |
| Scottish | 4 | 1.4% |
| Spaniard | 1 | 0.4% |
| Spanish | 10 | 3.6% |
| Spanish American | 2 | 0.7% | View All 14 Rows |
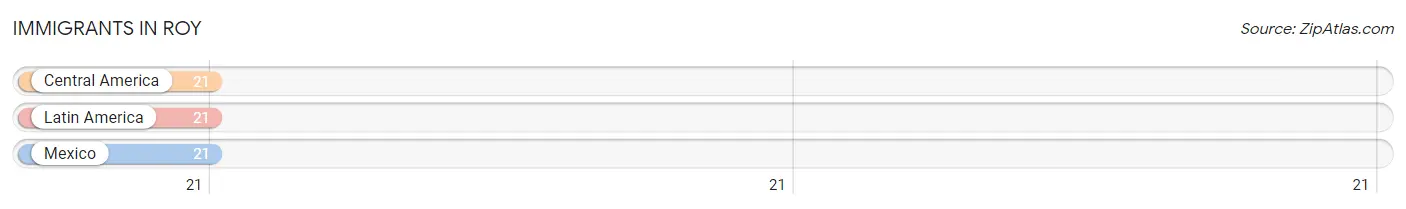
Immigrants in Roy
The most numerous immigrant groups reported in Roy came from Central America (21 | 7.5%), Latin America (21 | 7.5%), and Mexico (21 | 7.5%), together accounting for 22.6% of all Roy residents.
| Immigration Origin | # Population | % Population |
| Central America | 21 | 7.5% |
| Latin America | 21 | 7.5% |
| Mexico | 21 | 7.5% | View All 3 Rows |
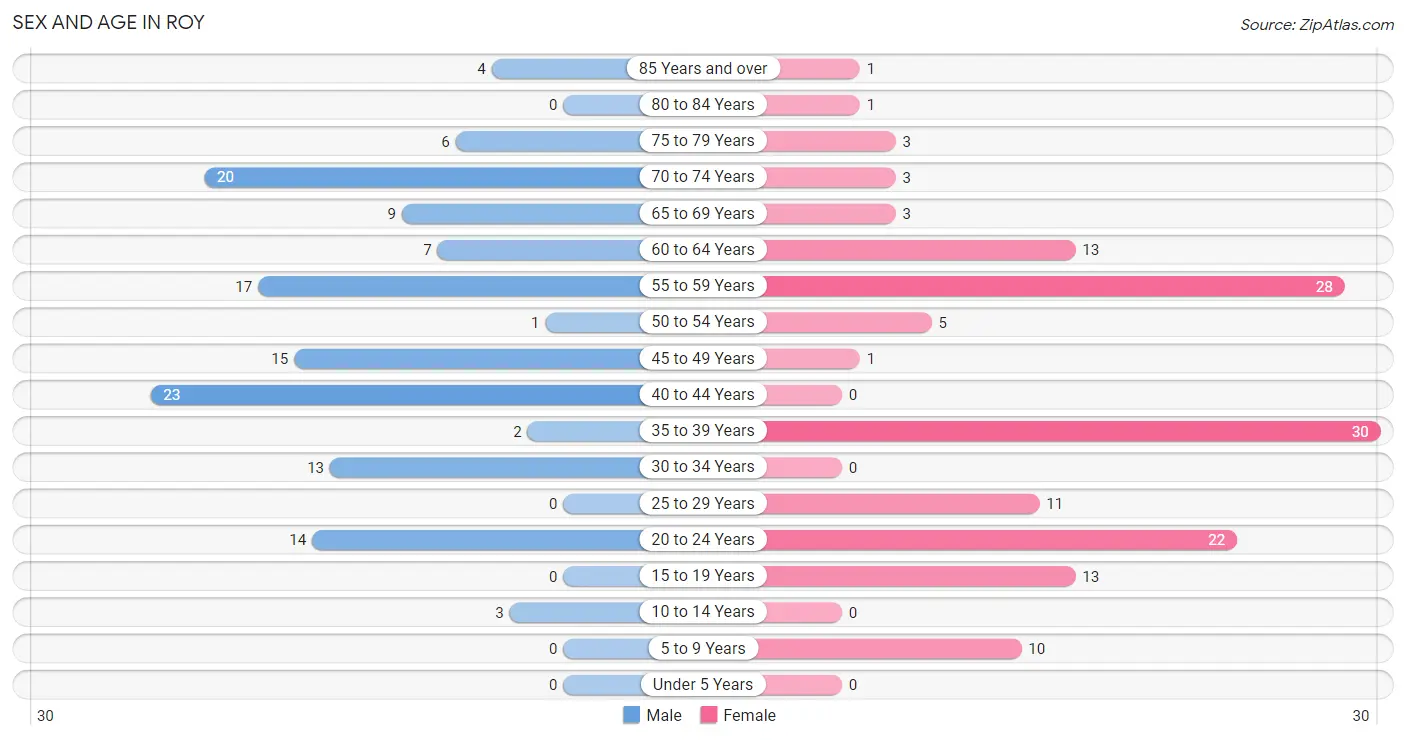
Sex and Age in Roy
Sex and Age in Roy
The most populous age groups in Roy are 40 to 44 Years (23 | 17.2%) for men and 35 to 39 Years (30 | 20.8%) for women.
| Age Bracket | Male | Female |
| Under 5 Years | 0 (0.0%) | 0 (0.0%) |
| 5 to 9 Years | 0 (0.0%) | 10 (6.9%) |
| 10 to 14 Years | 3 (2.2%) | 0 (0.0%) |
| 15 to 19 Years | 0 (0.0%) | 13 (9.0%) |
| 20 to 24 Years | 14 (10.4%) | 22 (15.3%) |
| 25 to 29 Years | 0 (0.0%) | 11 (7.6%) |
| 30 to 34 Years | 13 (9.7%) | 0 (0.0%) |
| 35 to 39 Years | 2 (1.5%) | 30 (20.8%) |
| 40 to 44 Years | 23 (17.2%) | 0 (0.0%) |
| 45 to 49 Years | 15 (11.2%) | 1 (0.7%) |
| 50 to 54 Years | 1 (0.7%) | 5 (3.5%) |
| 55 to 59 Years | 17 (12.7%) | 28 (19.4%) |
| 60 to 64 Years | 7 (5.2%) | 13 (9.0%) |
| 65 to 69 Years | 9 (6.7%) | 3 (2.1%) |
| 70 to 74 Years | 20 (14.9%) | 3 (2.1%) |
| 75 to 79 Years | 6 (4.5%) | 3 (2.1%) |
| 80 to 84 Years | 0 (0.0%) | 1 (0.7%) |
| 85 Years and over | 4 (3.0%) | 1 (0.7%) |
| Total | 134 (100.0%) | 144 (100.0%) |
Families and Households in Roy
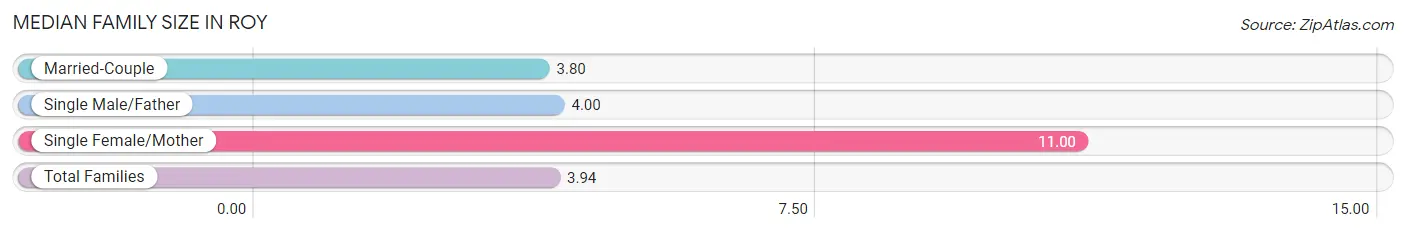
Median Family Size in Roy
The median family size in Roy is 3.94 persons per family, with single female/mother families (1 | 1.8%) accounting for the largest median family size of 11 persons per family. On the other hand, married-couple families (49 | 90.7%) represent the smallest median family size with 3.80 persons per family.
| Family Type | # Families | Family Size |
| Married-Couple | 49 (90.7%) | 3.80 |
| Single Male/Father | 4 (7.4%) | 4.00 |
| Single Female/Mother | 1 (1.8%) | 11.00 |
| Total Families | 54 (100.0%) | 3.94 |
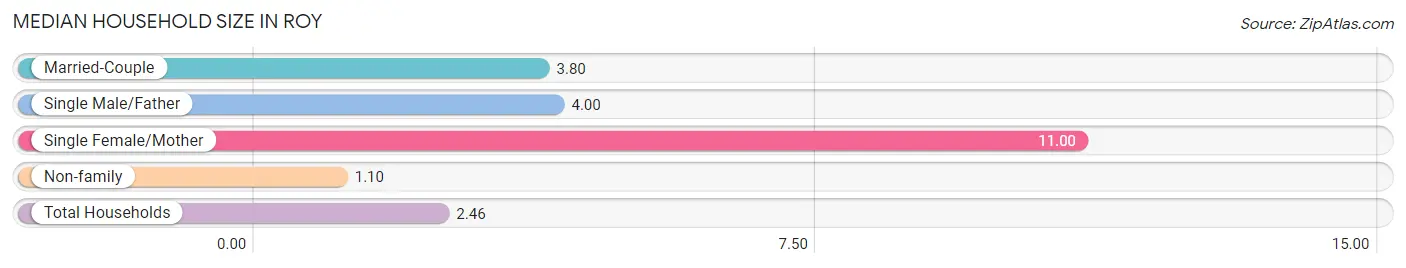
Median Household Size in Roy
The median household size in Roy is 2.46 persons per household, with single female/mother households (1 | 0.9%) accounting for the largest median household size of 11 persons per household. non-family households (59 | 52.2%) represent the smallest median household size with 1.10 persons per household.
| Household Type | # Households | Household Size |
| Married-Couple | 49 (43.4%) | 3.80 |
| Single Male/Father | 4 (3.5%) | 4.00 |
| Single Female/Mother | 1 (0.9%) | 11.00 |
| Non-family | 59 (52.2%) | 1.10 |
| Total Households | 113 (100.0%) | 2.46 |
Household Size by Marriage Status in Roy
Out of a total of 113 households in Roy, 54 (47.8%) are family households, while 59 (52.2%) are nonfamily households. The most numerous type of family households are 3-person households, comprising 31, and the most common type of nonfamily households are 1-person households, comprising 52.
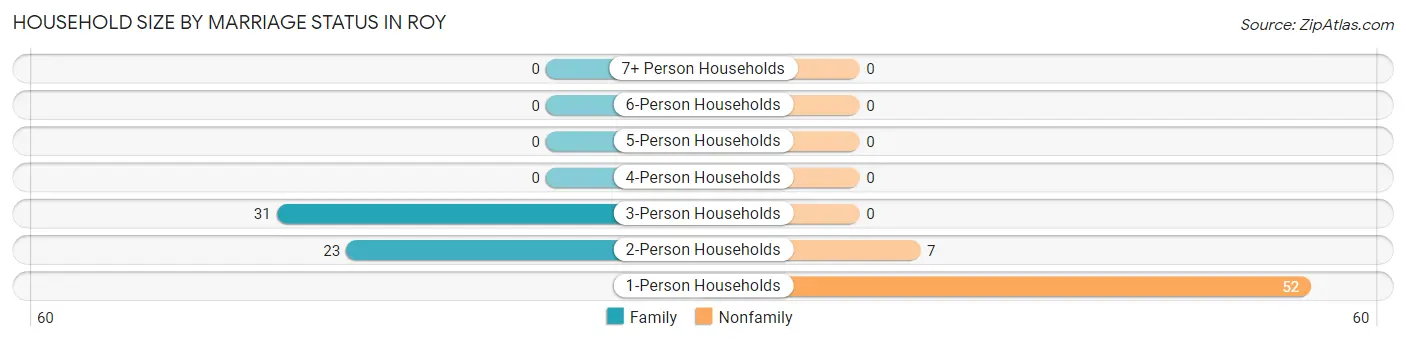
| Household Size | Family Households | Nonfamily Households |
| 1-Person Households | - | 52 (46.0%) |
| 2-Person Households | 23 (20.3%) | 7 (6.2%) |
| 3-Person Households | 31 (27.4%) | 0 (0.0%) |
| 4-Person Households | 0 (0.0%) | 0 (0.0%) |
| 5-Person Households | 0 (0.0%) | 0 (0.0%) |
| 6-Person Households | 0 (0.0%) | 0 (0.0%) |
| 7+ Person Households | 0 (0.0%) | 0 (0.0%) |
| Total | 54 (47.8%) | 59 (52.2%) |
Female Fertility in Roy
Fertility by Age in Roy
| Age Bracket | Women with Births | Births / 1,000 Women |
| 15 to 19 years | 0 (0.0%) | 0.0 |
| 20 to 34 years | 0 (0.0%) | 0.0 |
| 35 to 50 years | 0 (0.0%) | 0.0 |
| Total | 0 (0.0%) | 0.0 |
Fertility by Age by Marriage Status in Roy
| Age Bracket | Married | Unmarried |
| 15 to 19 years | 0 (0.0%) | 0 (0.0%) |
| 20 to 34 years | 0 (0.0%) | 0 (0.0%) |
| 35 to 50 years | 0 (0.0%) | 0 (0.0%) |
| Total | 0 (0.0%) | 0 (0.0%) |
Fertility by Education in Roy
| Educational Attainment | Women with Births | Births / 1,000 Women |
| Less than High School | 0 (0.0%) | 0.0 |
| High School Diploma | 0 (0.0%) | 0.0 |
| College or Associate's Degree | 0 (0.0%) | 0.0 |
| Bachelor's Degree | 0 (0.0%) | 0.0 |
| Graduate Degree | 0 (0.0%) | 0.0 |
| Total | 0 (0.0%) | 0.0 |
Fertility by Education by Marriage Status in Roy
| Educational Attainment | Married | Unmarried |
| Less than High School | 0 (0.0%) | 0 (0.0%) |
| High School Diploma | 0 (0.0%) | 0 (0.0%) |
| College or Associate's Degree | 0 (0.0%) | 0 (0.0%) |
| Bachelor's Degree | 0 (0.0%) | 0 (0.0%) |
| Graduate Degree | 0 (0.0%) | 0 (0.0%) |
| Total | 0 (0.0%) | 0 (0.0%) |
Employment Characteristics in Roy
Employment by Class of Employer in Roy
Among the 147 employed individuals in Roy, local government employees (54 | 36.7%), private company employees (47 | 32.0%), and self-employed (not incorporated) (19 | 12.9%) make up the most common classes of employment.
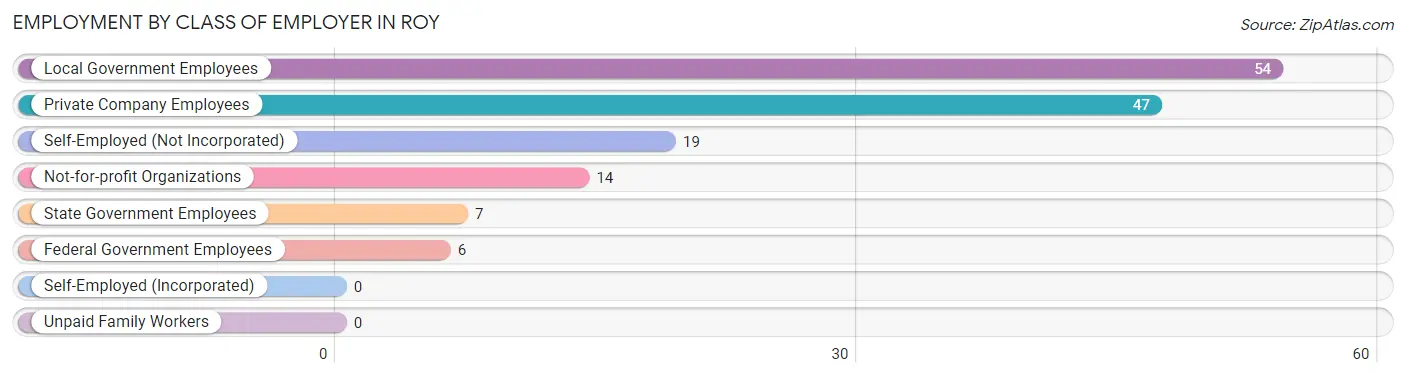
| Employer Class | # Employees | % Employees |
| Private Company Employees | 47 | 32.0% |
| Self-Employed (Incorporated) | 0 | 0.0% |
| Self-Employed (Not Incorporated) | 19 | 12.9% |
| Not-for-profit Organizations | 14 | 9.5% |
| Local Government Employees | 54 | 36.7% |
| State Government Employees | 7 | 4.8% |
| Federal Government Employees | 6 | 4.1% |
| Unpaid Family Workers | 0 | 0.0% |
| Total | 147 | 100.0% |
Employment Status by Age in Roy
According to the labor force statistics for Roy, out of the total population over 16 years of age (265), 63.8% or 169 individuals are in the labor force, with 13.0% or 22 of them unemployed. The age group with the highest labor force participation rate is 16 to 19 years, with 100.0% or 13 individuals in the labor force. Within the labor force, the 16 to 19 years age range has the highest percentage of unemployed individuals, with 100.0% or 13 of them being unemployed.
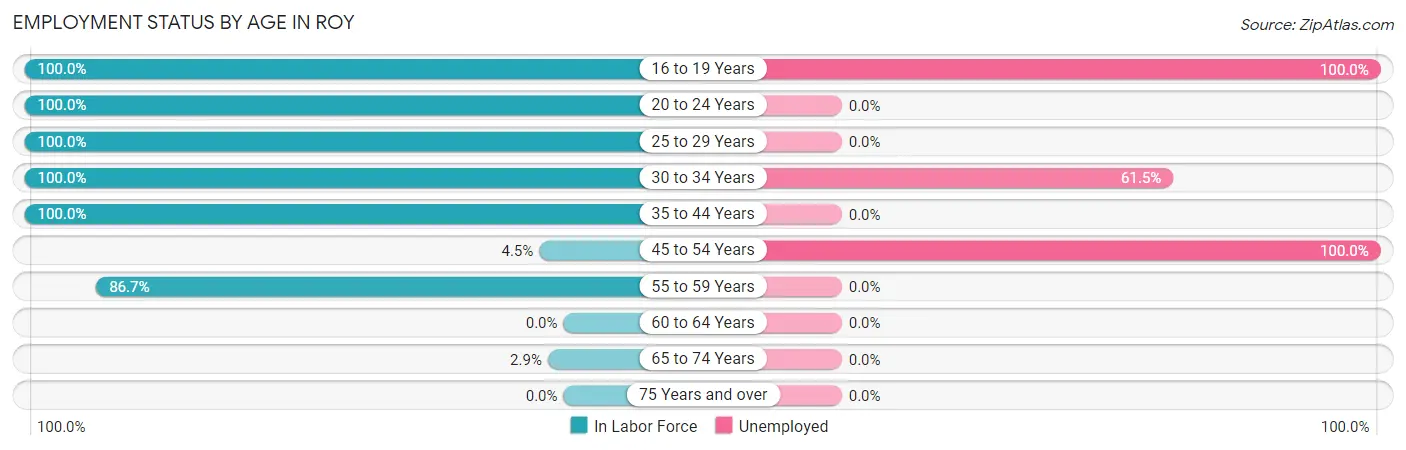
| Age Bracket | In Labor Force | Unemployed |
| 16 to 19 Years | 13 (100.0%) | 13 (100.0%) |
| 20 to 24 Years | 36 (100.0%) | 0 (0.0%) |
| 25 to 29 Years | 11 (100.0%) | 0 (0.0%) |
| 30 to 34 Years | 13 (100.0%) | 8 (61.5%) |
| 35 to 44 Years | 55 (100.0%) | 0 (0.0%) |
| 45 to 54 Years | 1 (4.5%) | 1 (100.0%) |
| 55 to 59 Years | 39 (86.7%) | 0 (0.0%) |
| 60 to 64 Years | 0 (0.0%) | 0 (0.0%) |
| 65 to 74 Years | 1 (2.9%) | 0 (0.0%) |
| 75 Years and over | 0 (0.0%) | 0 (0.0%) |
| Total | 169 (63.8%) | 22 (13.0%) |
Employment Status by Educational Attainment in Roy
According to labor force statistics for Roy, 71.7% of individuals (119) out of the total population between 25 and 64 years of age (166) are in the labor force, with 7.6% or 9 of them being unemployed. The group with the highest labor force participation rate are those with the educational attainment of bachelor's degree or higher, with 92.6% or 63 individuals in the labor force. Within the labor force, individuals with less than high school education have the highest percentage of unemployment, with 53.3% or 8 of them being unemployed.
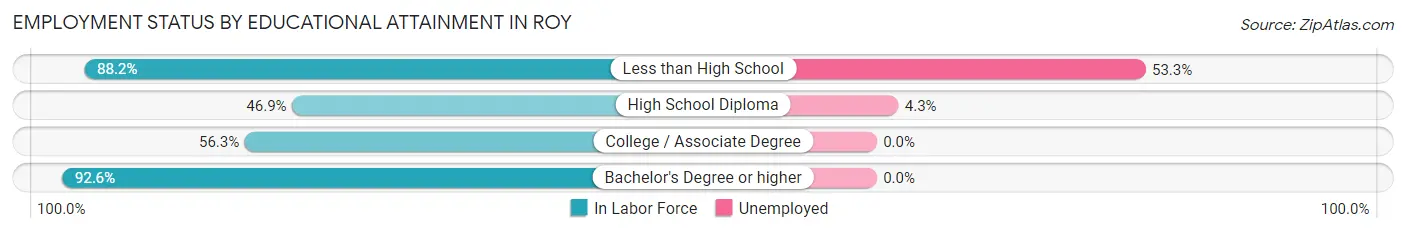
| Educational Attainment | In Labor Force | Unemployed |
| Less than High School | 15 (88.2%) | 9 (53.3%) |
| High School Diploma | 23 (46.9%) | 2 (4.3%) |
| College / Associate Degree | 18 (56.3%) | 0 (0.0%) |
| Bachelor's Degree or higher | 63 (92.6%) | 0 (0.0%) |
| Total | 119 (71.7%) | 13 (7.6%) |
Employment Occupations by Sex in Roy
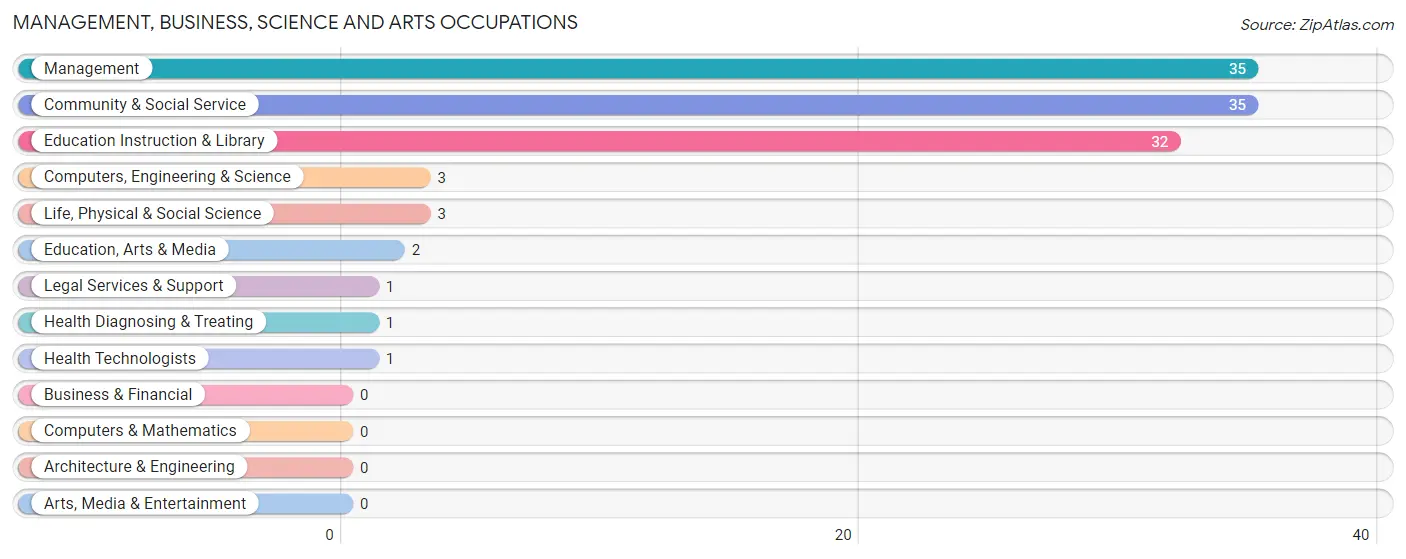
Management, Business, Science and Arts Occupations
The most common Management, Business, Science and Arts occupations in Roy are Management (35 | 23.8%), Community & Social Service (35 | 23.8%), Education Instruction & Library (32 | 21.8%), Computers, Engineering & Science (3 | 2.0%), and Life, Physical & Social Science (3 | 2.0%).
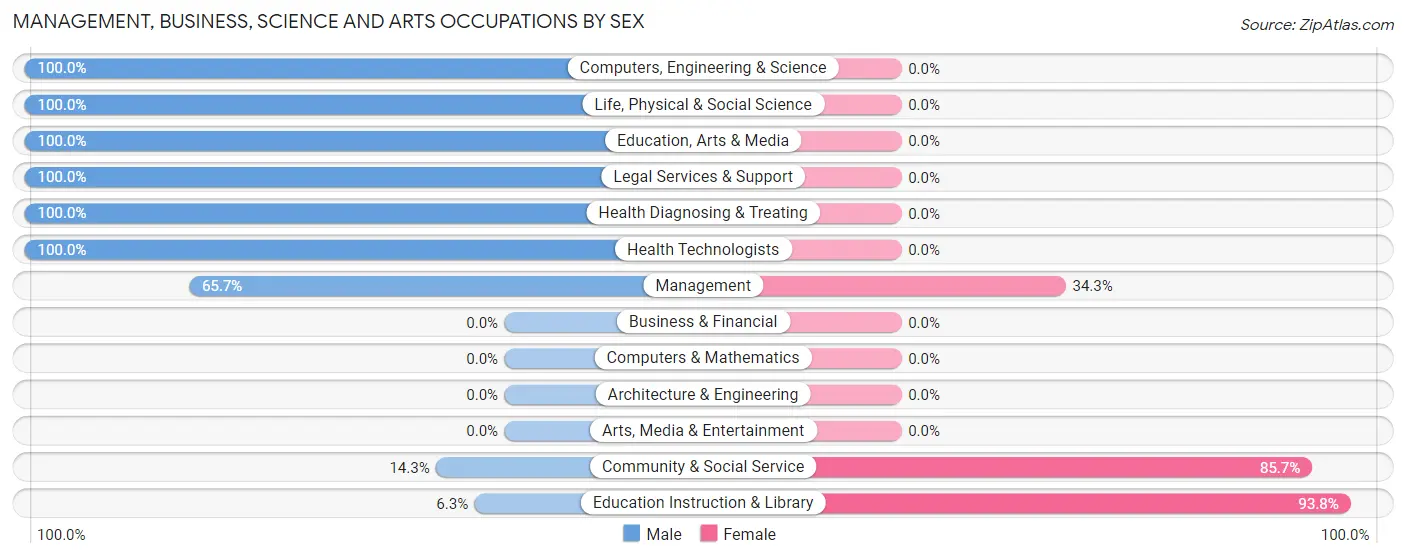
Management, Business, Science and Arts Occupations by Sex
Within the Management, Business, Science and Arts occupations in Roy, the most male-oriented occupations are Computers, Engineering & Science (100.0%), Life, Physical & Social Science (100.0%), and Education, Arts & Media (100.0%), while the most female-oriented occupations are Education Instruction & Library (93.8%), Community & Social Service (85.7%), and Management (34.3%).
| Occupation | Male | Female |
| Management | 23 (65.7%) | 12 (34.3%) |
| Business & Financial | 0 (0.0%) | 0 (0.0%) |
| Computers, Engineering & Science | 3 (100.0%) | 0 (0.0%) |
| Computers & Mathematics | 0 (0.0%) | 0 (0.0%) |
| Architecture & Engineering | 0 (0.0%) | 0 (0.0%) |
| Life, Physical & Social Science | 3 (100.0%) | 0 (0.0%) |
| Community & Social Service | 5 (14.3%) | 30 (85.7%) |
| Education, Arts & Media | 2 (100.0%) | 0 (0.0%) |
| Legal Services & Support | 1 (100.0%) | 0 (0.0%) |
| Education Instruction & Library | 2 (6.2%) | 30 (93.8%) |
| Arts, Media & Entertainment | 0 (0.0%) | 0 (0.0%) |
| Health Diagnosing & Treating | 1 (100.0%) | 0 (0.0%) |
| Health Technologists | 1 (100.0%) | 0 (0.0%) |
| Total (Category) | 32 (43.2%) | 42 (56.8%) |
| Total (Overall) | 60 (40.8%) | 87 (59.2%) |
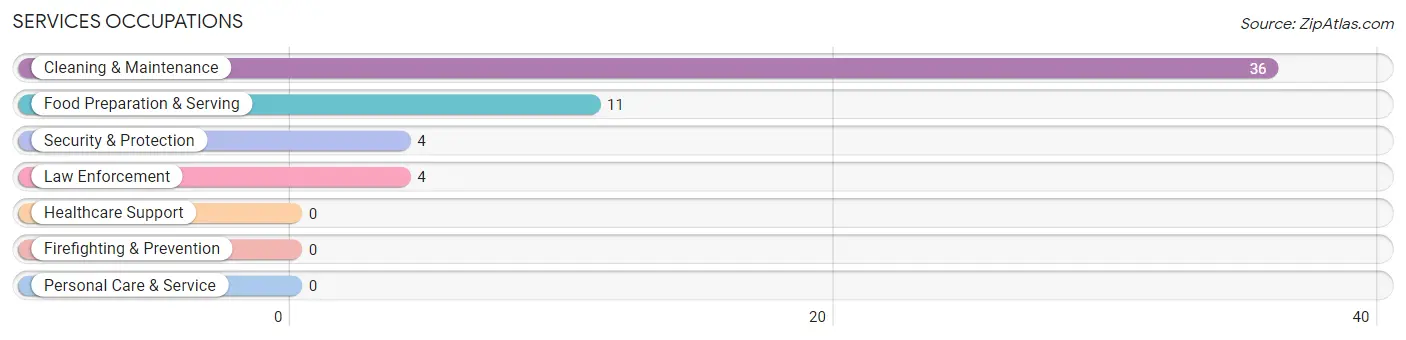
Services Occupations
The most common Services occupations in Roy are Cleaning & Maintenance (36 | 24.5%), Food Preparation & Serving (11 | 7.5%), Security & Protection (4 | 2.7%), and Law Enforcement (4 | 2.7%).
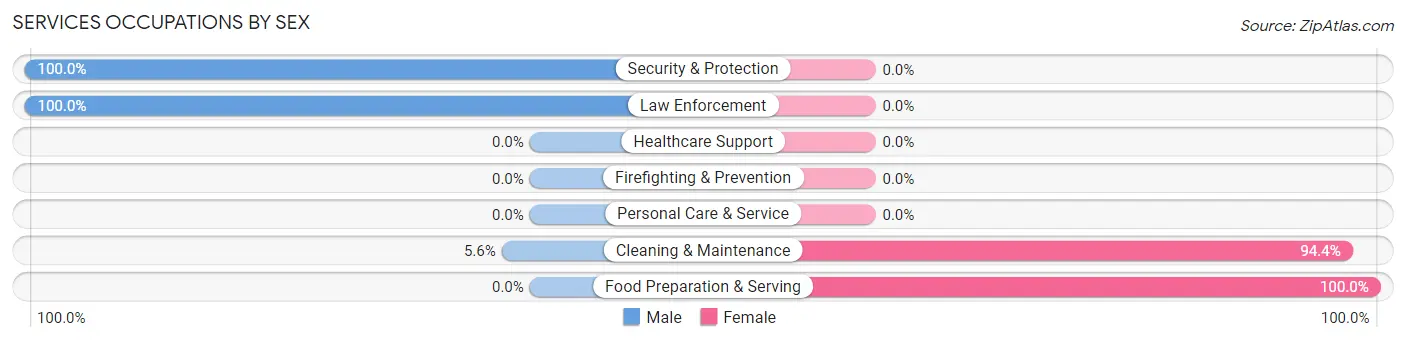
Services Occupations by Sex
Within the Services occupations in Roy, the most male-oriented occupations are Security & Protection (100.0%), Law Enforcement (100.0%), and Cleaning & Maintenance (5.6%), while the most female-oriented occupations are Food Preparation & Serving (100.0%), and Cleaning & Maintenance (94.4%).
| Occupation | Male | Female |
| Healthcare Support | 0 (0.0%) | 0 (0.0%) |
| Security & Protection | 4 (100.0%) | 0 (0.0%) |
| Firefighting & Prevention | 0 (0.0%) | 0 (0.0%) |
| Law Enforcement | 4 (100.0%) | 0 (0.0%) |
| Food Preparation & Serving | 0 (0.0%) | 11 (100.0%) |
| Cleaning & Maintenance | 2 (5.6%) | 34 (94.4%) |
| Personal Care & Service | 0 (0.0%) | 0 (0.0%) |
| Total (Category) | 6 (11.8%) | 45 (88.2%) |
| Total (Overall) | 60 (40.8%) | 87 (59.2%) |
Sales and Office Occupations
Sales and Office Occupations by Sex
| Occupation | Male | Female |
| Sales & Related | 0 (0.0%) | 0 (0.0%) |
| Office & Administration | 0 (0.0%) | 0 (0.0%) |
| Total (Category) | 0 (0.0%) | 0 (0.0%) |
| Total (Overall) | 60 (40.8%) | 87 (59.2%) |
Natural Resources, Construction and Maintenance Occupations
The most common Natural Resources, Construction and Maintenance occupations in Roy are , and Construction & Extraction (17 | 11.6%).
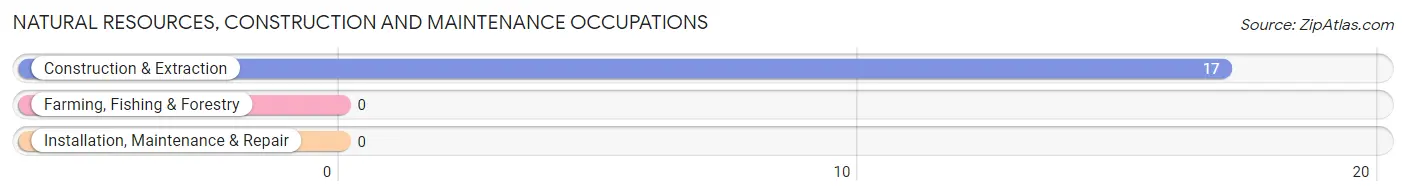
Natural Resources, Construction and Maintenance Occupations by Sex
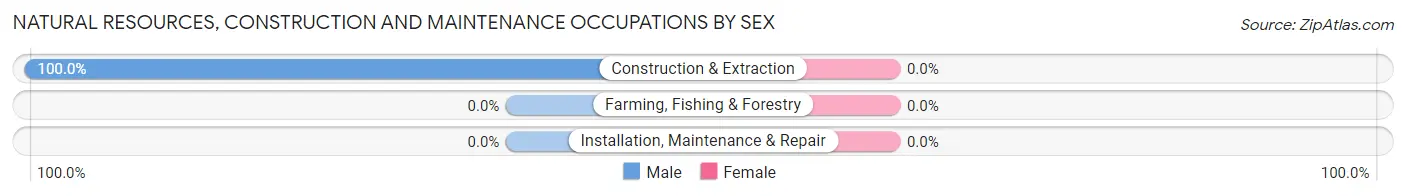
| Occupation | Male | Female |
| Farming, Fishing & Forestry | 0 (0.0%) | 0 (0.0%) |
| Construction & Extraction | 17 (100.0%) | 0 (0.0%) |
| Installation, Maintenance & Repair | 0 (0.0%) | 0 (0.0%) |
| Total (Category) | 17 (100.0%) | 0 (0.0%) |
| Total (Overall) | 60 (40.8%) | 87 (59.2%) |
Production, Transportation and Moving Occupations
The most common Production, Transportation and Moving occupations in Roy are , and Material Moving (5 | 3.4%).
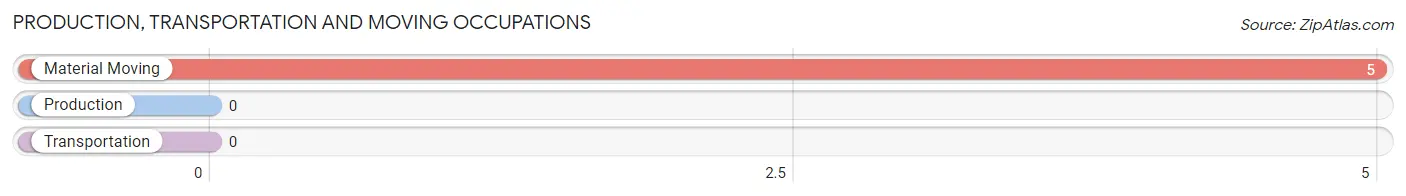
Production, Transportation and Moving Occupations by Sex
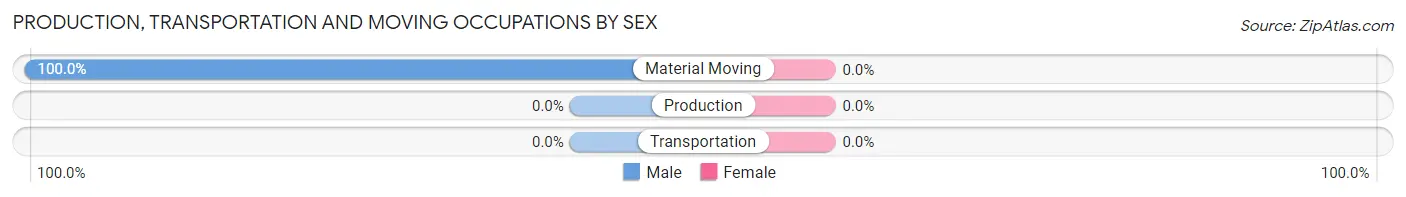
| Occupation | Male | Female |
| Production | 0 (0.0%) | 0 (0.0%) |
| Transportation | 0 (0.0%) | 0 (0.0%) |
| Material Moving | 5 (100.0%) | 0 (0.0%) |
| Total (Category) | 5 (100.0%) | 0 (0.0%) |
| Total (Overall) | 60 (40.8%) | 87 (59.2%) |
Employment Industries by Sex in Roy
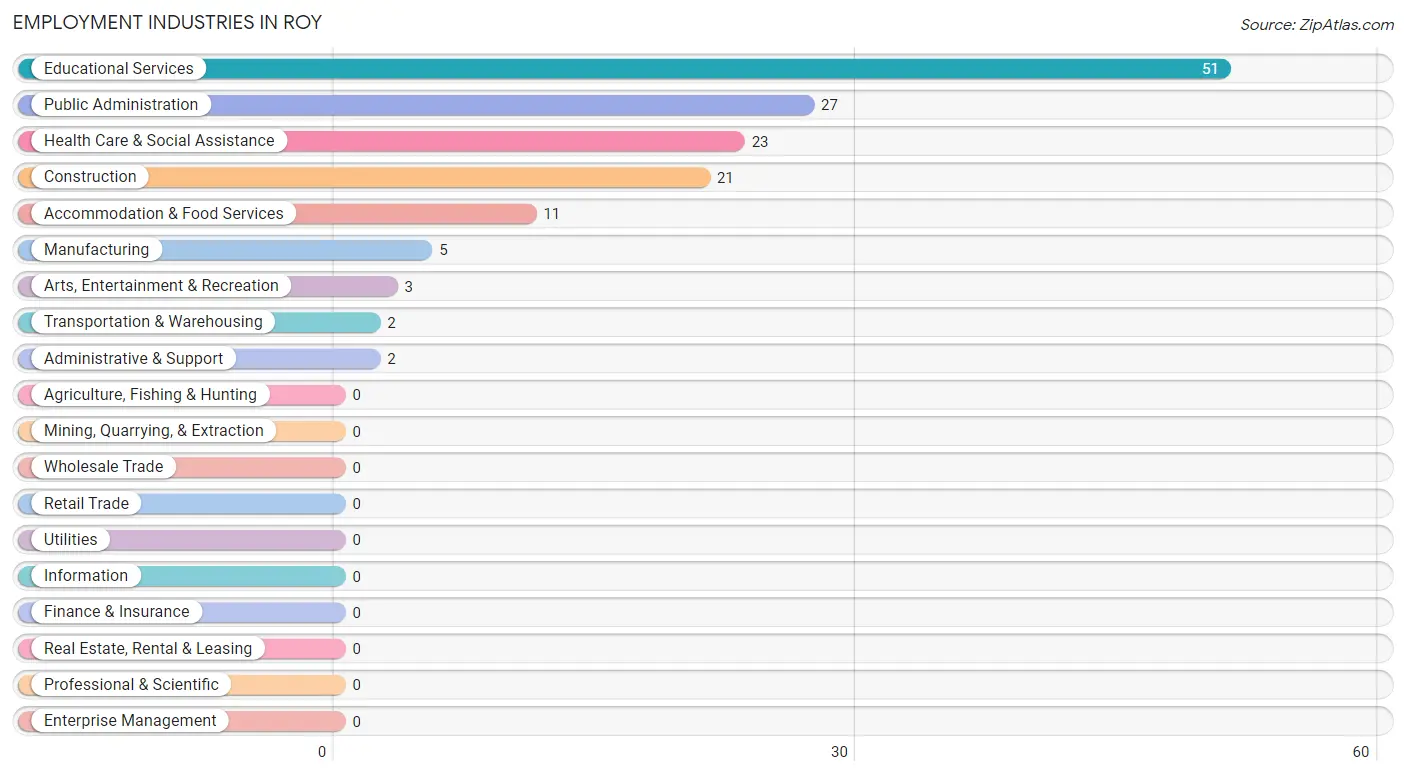
Employment Industries in Roy
The major employment industries in Roy include Educational Services (51 | 34.7%), Public Administration (27 | 18.4%), Health Care & Social Assistance (23 | 15.7%), Construction (21 | 14.3%), and Accommodation & Food Services (11 | 7.5%).
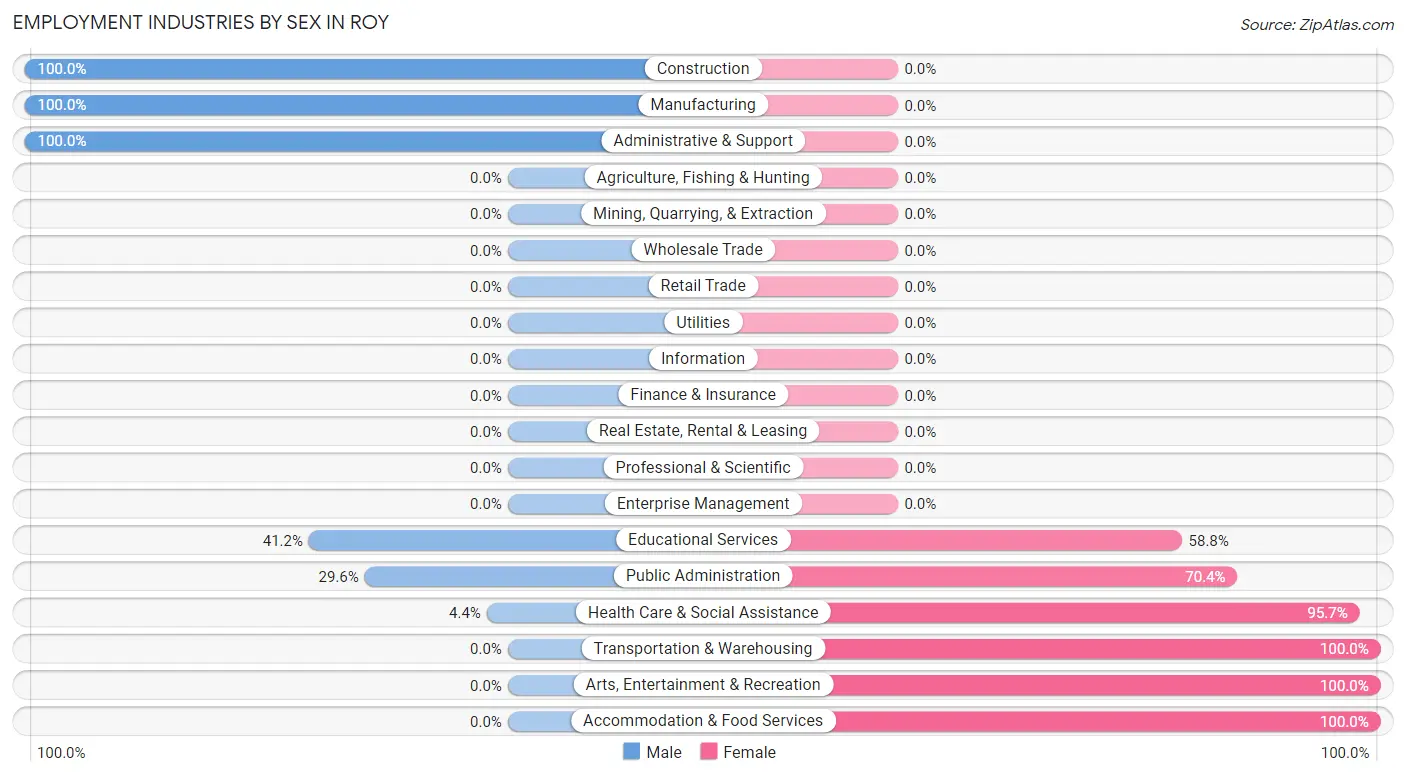
Employment Industries by Sex in Roy
The Roy industries that see more men than women are Construction (100.0%), Manufacturing (100.0%), and Administrative & Support (100.0%), whereas the industries that tend to have a higher number of women are Transportation & Warehousing (100.0%), Arts, Entertainment & Recreation (100.0%), and Accommodation & Food Services (100.0%).
| Industry | Male | Female |
| Agriculture, Fishing & Hunting | 0 (0.0%) | 0 (0.0%) |
| Mining, Quarrying, & Extraction | 0 (0.0%) | 0 (0.0%) |
| Construction | 21 (100.0%) | 0 (0.0%) |
| Manufacturing | 5 (100.0%) | 0 (0.0%) |
| Wholesale Trade | 0 (0.0%) | 0 (0.0%) |
| Retail Trade | 0 (0.0%) | 0 (0.0%) |
| Transportation & Warehousing | 0 (0.0%) | 2 (100.0%) |
| Utilities | 0 (0.0%) | 0 (0.0%) |
| Information | 0 (0.0%) | 0 (0.0%) |
| Finance & Insurance | 0 (0.0%) | 0 (0.0%) |
| Real Estate, Rental & Leasing | 0 (0.0%) | 0 (0.0%) |
| Professional & Scientific | 0 (0.0%) | 0 (0.0%) |
| Enterprise Management | 0 (0.0%) | 0 (0.0%) |
| Administrative & Support | 2 (100.0%) | 0 (0.0%) |
| Educational Services | 21 (41.2%) | 30 (58.8%) |
| Health Care & Social Assistance | 1 (4.3%) | 22 (95.7%) |
| Arts, Entertainment & Recreation | 0 (0.0%) | 3 (100.0%) |
| Accommodation & Food Services | 0 (0.0%) | 11 (100.0%) |
| Public Administration | 8 (29.6%) | 19 (70.4%) |
| Total | 60 (40.8%) | 87 (59.2%) |
Education in Roy
School Enrollment in Roy
The most common levels of schooling among the 48 students in Roy are college / undergraduate (22 | 45.8%), high school (13 | 27.1%), and elementary school (10 | 20.8%).
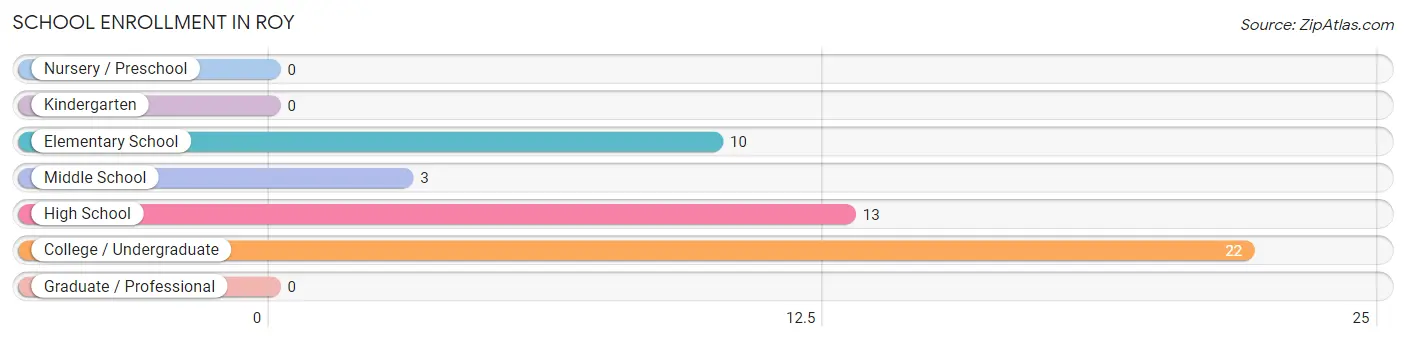
| School Level | # Students | % Students |
| Nursery / Preschool | 0 | 0.0% |
| Kindergarten | 0 | 0.0% |
| Elementary School | 10 | 20.8% |
| Middle School | 3 | 6.2% |
| High School | 13 | 27.1% |
| College / Undergraduate | 22 | 45.8% |
| Graduate / Professional | 0 | 0.0% |
| Total | 48 | 100.0% |
School Enrollment by Age by Funding Source in Roy
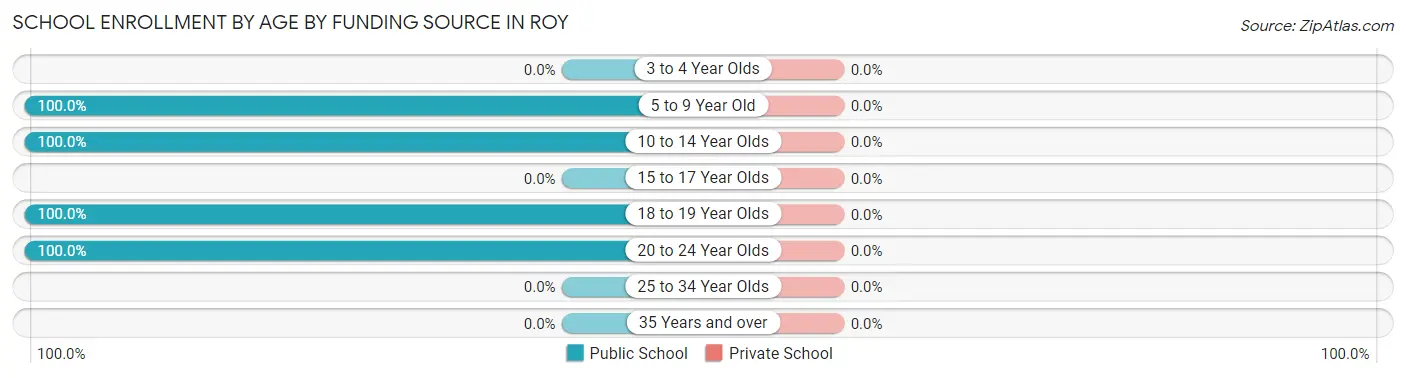
| Age Bracket | Public School | Private School |
| 3 to 4 Year Olds | 0 (0.0%) | 0 (0.0%) |
| 5 to 9 Year Old | 10 (100.0%) | 0 (0.0%) |
| 10 to 14 Year Olds | 3 (100.0%) | 0 (0.0%) |
| 15 to 17 Year Olds | 0 (0.0%) | 0 (0.0%) |
| 18 to 19 Year Olds | 13 (100.0%) | 0 (0.0%) |
| 20 to 24 Year Olds | 22 (100.0%) | 0 (0.0%) |
| 25 to 34 Year Olds | 0 (0.0%) | 0 (0.0%) |
| 35 Years and over | 0 (0.0%) | 0 (0.0%) |
| Total | 48 (100.0%) | 0 (0.0%) |
Educational Attainment by Field of Study in Roy
Arts & humanities (31 | 40.8%), education (24 | 31.6%), social sciences (5 | 6.6%), business (5 | 6.6%), and computers & mathematics (4 | 5.3%) are the most common fields of study among 76 individuals in Roy who have obtained a bachelor's degree or higher.
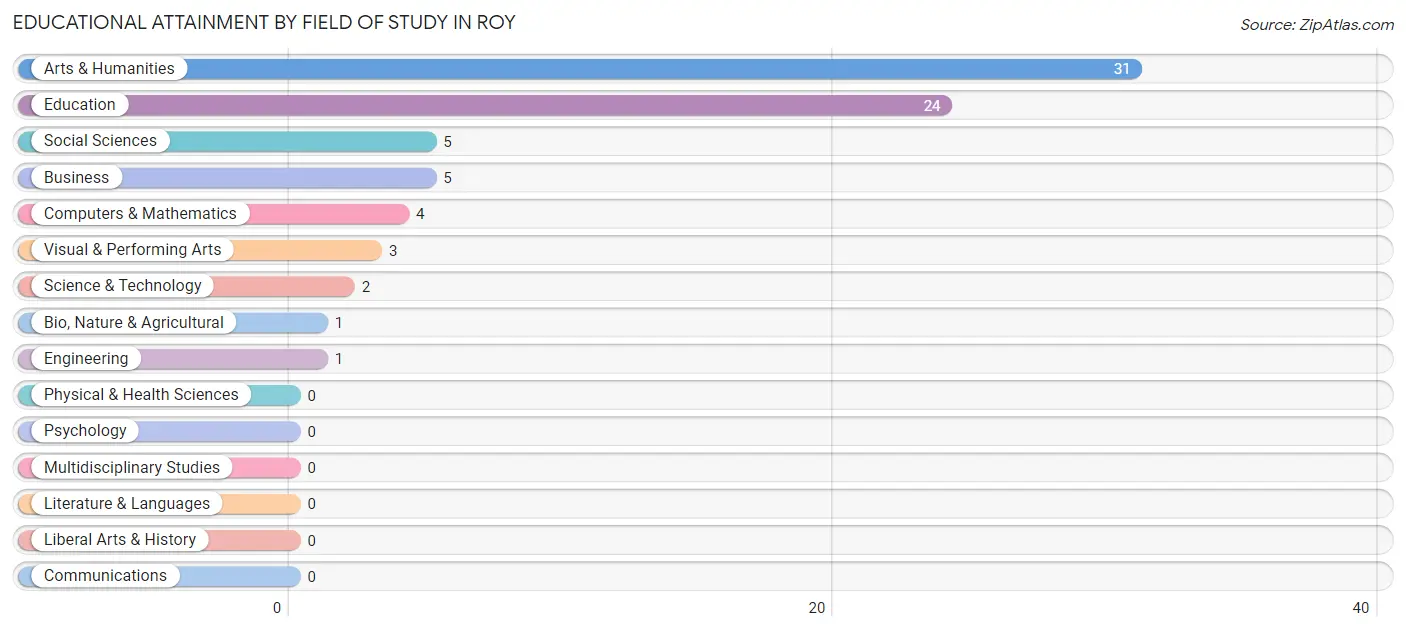
| Field of Study | # Graduates | % Graduates |
| Computers & Mathematics | 4 | 5.3% |
| Bio, Nature & Agricultural | 1 | 1.3% |
| Physical & Health Sciences | 0 | 0.0% |
| Psychology | 0 | 0.0% |
| Social Sciences | 5 | 6.6% |
| Engineering | 1 | 1.3% |
| Multidisciplinary Studies | 0 | 0.0% |
| Science & Technology | 2 | 2.6% |
| Business | 5 | 6.6% |
| Education | 24 | 31.6% |
| Literature & Languages | 0 | 0.0% |
| Liberal Arts & History | 0 | 0.0% |
| Visual & Performing Arts | 3 | 4.0% |
| Communications | 0 | 0.0% |
| Arts & Humanities | 31 | 40.8% |
| Total | 76 | 100.0% |
Transportation & Commute in Roy
Vehicle Availability by Sex in Roy
The most prevalent vehicle ownership categories in Roy are males with 3 vehicles (25, accounting for 41.7%) and females with 3 vehicles (29, making up 28.7%).
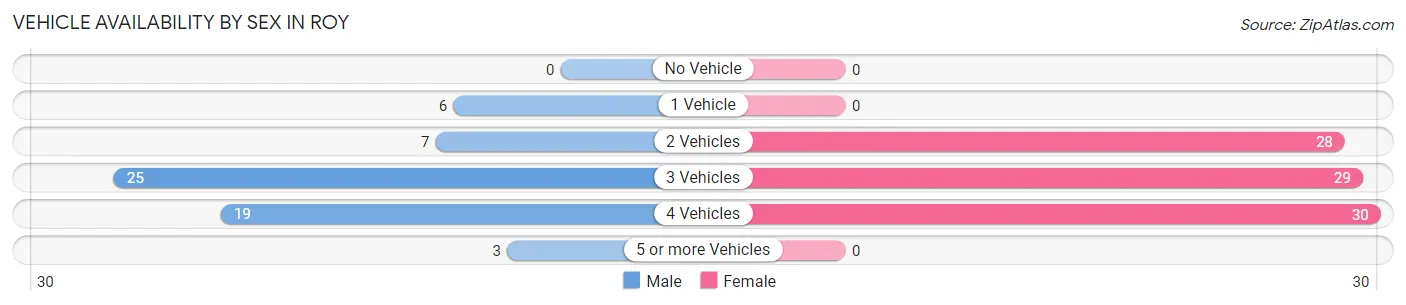
| Vehicles Available | Male | Female |
| No Vehicle | 0 (0.0%) | 0 (0.0%) |
| 1 Vehicle | 6 (10.0%) | 0 (0.0%) |
| 2 Vehicles | 7 (11.7%) | 28 (32.2%) |
| 3 Vehicles | 25 (41.7%) | 29 (33.3%) |
| 4 Vehicles | 19 (31.7%) | 30 (34.5%) |
| 5 or more Vehicles | 3 (5.0%) | 0 (0.0%) |
| Total | 60 (100.0%) | 87 (100.0%) |
Commute Time in Roy
The most frequently occuring commute durations in Roy are 45 to 59 minutes (35 commuters, 24.0%), less than 5 minutes (33 commuters, 22.6%), and 60 to 89 minutes (29 commuters, 19.9%).
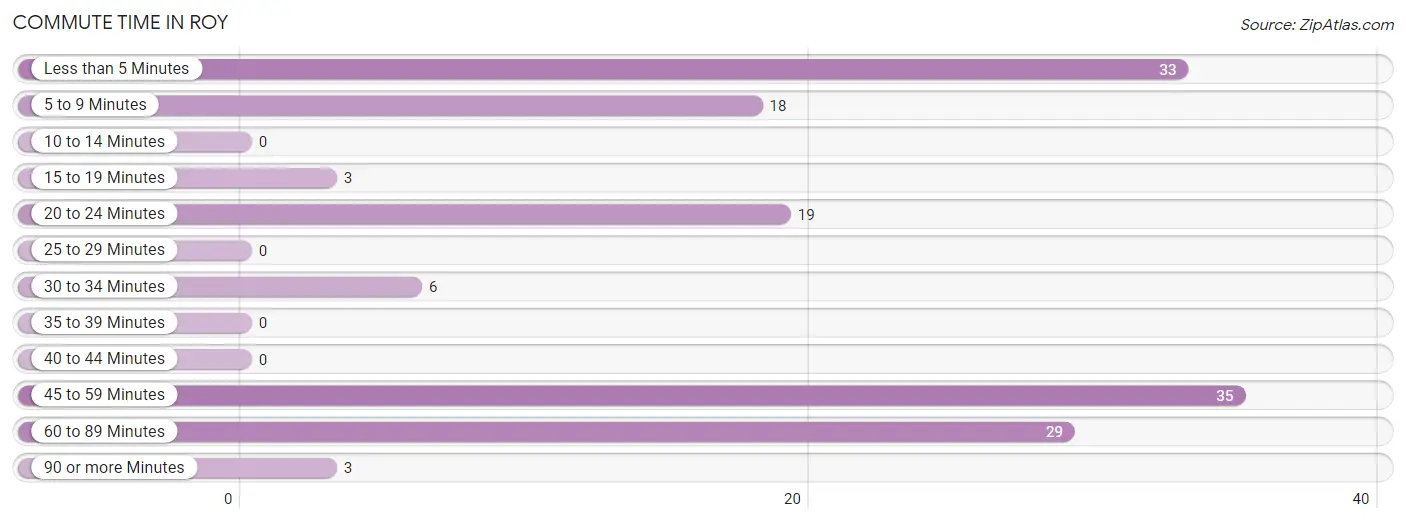
| Commute Time | # Commuters | % Commuters |
| Less than 5 Minutes | 33 | 22.6% |
| 5 to 9 Minutes | 18 | 12.3% |
| 10 to 14 Minutes | 0 | 0.0% |
| 15 to 19 Minutes | 3 | 2.1% |
| 20 to 24 Minutes | 19 | 13.0% |
| 25 to 29 Minutes | 0 | 0.0% |
| 30 to 34 Minutes | 6 | 4.1% |
| 35 to 39 Minutes | 0 | 0.0% |
| 40 to 44 Minutes | 0 | 0.0% |
| 45 to 59 Minutes | 35 | 24.0% |
| 60 to 89 Minutes | 29 | 19.9% |
| 90 or more Minutes | 3 | 2.1% |
Commute Time by Sex in Roy
The most common commute times in Roy are less than 5 minutes (21 commuters, 35.6%) for males and 45 to 59 minutes (30 commuters, 34.5%) for females.
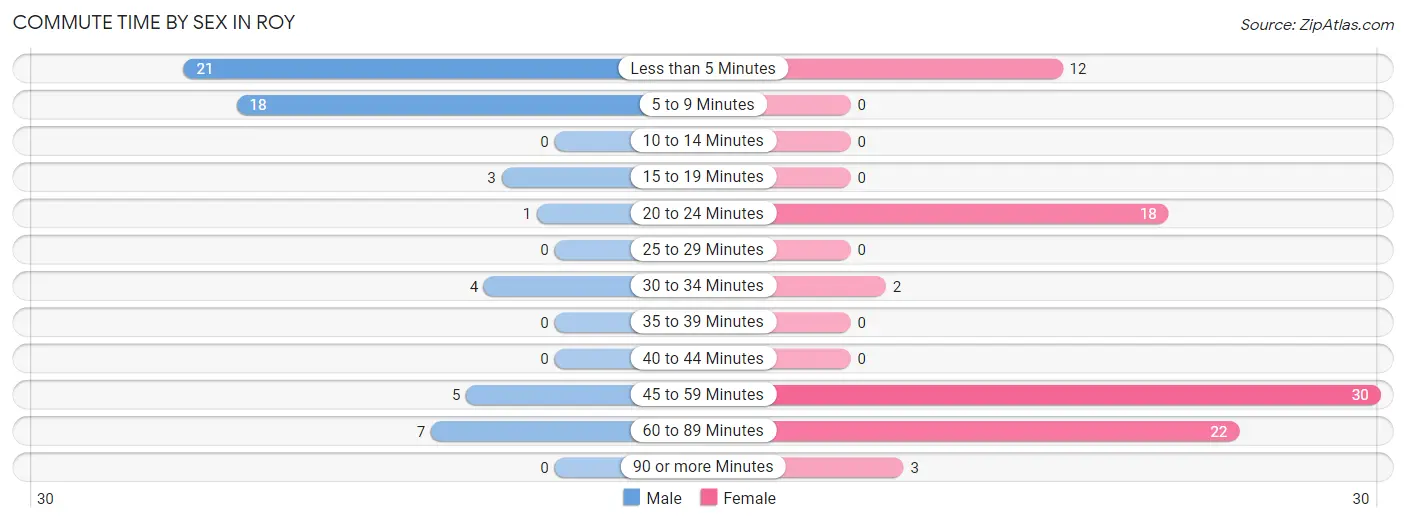
| Commute Time | Male | Female |
| Less than 5 Minutes | 21 (35.6%) | 12 (13.8%) |
| 5 to 9 Minutes | 18 (30.5%) | 0 (0.0%) |
| 10 to 14 Minutes | 0 (0.0%) | 0 (0.0%) |
| 15 to 19 Minutes | 3 (5.1%) | 0 (0.0%) |
| 20 to 24 Minutes | 1 (1.7%) | 18 (20.7%) |
| 25 to 29 Minutes | 0 (0.0%) | 0 (0.0%) |
| 30 to 34 Minutes | 4 (6.8%) | 2 (2.3%) |
| 35 to 39 Minutes | 0 (0.0%) | 0 (0.0%) |
| 40 to 44 Minutes | 0 (0.0%) | 0 (0.0%) |
| 45 to 59 Minutes | 5 (8.5%) | 30 (34.5%) |
| 60 to 89 Minutes | 7 (11.9%) | 22 (25.3%) |
| 90 or more Minutes | 0 (0.0%) | 3 (3.5%) |
Time of Departure to Work by Sex in Roy
The most frequent times of departure to work in Roy are 7:00 AM to 7:29 AM (19, 32.2%) for males and 7:00 AM to 7:29 AM (33, 37.9%) for females.
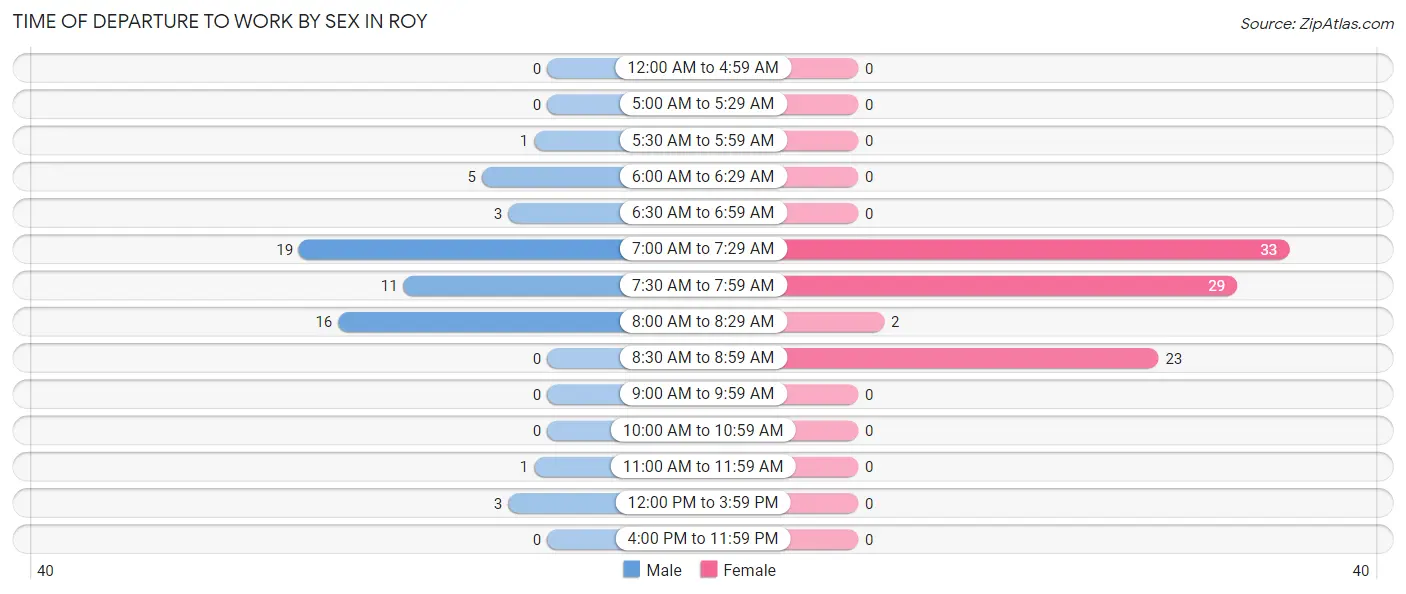
| Time of Departure | Male | Female |
| 12:00 AM to 4:59 AM | 0 (0.0%) | 0 (0.0%) |
| 5:00 AM to 5:29 AM | 0 (0.0%) | 0 (0.0%) |
| 5:30 AM to 5:59 AM | 1 (1.7%) | 0 (0.0%) |
| 6:00 AM to 6:29 AM | 5 (8.5%) | 0 (0.0%) |
| 6:30 AM to 6:59 AM | 3 (5.1%) | 0 (0.0%) |
| 7:00 AM to 7:29 AM | 19 (32.2%) | 33 (37.9%) |
| 7:30 AM to 7:59 AM | 11 (18.6%) | 29 (33.3%) |
| 8:00 AM to 8:29 AM | 16 (27.1%) | 2 (2.3%) |
| 8:30 AM to 8:59 AM | 0 (0.0%) | 23 (26.4%) |
| 9:00 AM to 9:59 AM | 0 (0.0%) | 0 (0.0%) |
| 10:00 AM to 10:59 AM | 0 (0.0%) | 0 (0.0%) |
| 11:00 AM to 11:59 AM | 1 (1.7%) | 0 (0.0%) |
| 12:00 PM to 3:59 PM | 3 (5.1%) | 0 (0.0%) |
| 4:00 PM to 11:59 PM | 0 (0.0%) | 0 (0.0%) |
| Total | 59 (100.0%) | 87 (100.0%) |
Housing Occupancy in Roy
Occupancy by Ownership in Roy
Of the total 113 dwellings in Roy, owner-occupied units account for 68 (60.2%), while renter-occupied units make up 45 (39.8%).
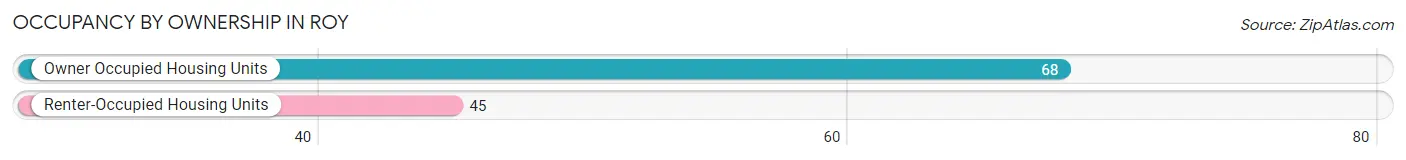
| Occupancy | # Housing Units | % Housing Units |
| Owner Occupied Housing Units | 68 | 60.2% |
| Renter-Occupied Housing Units | 45 | 39.8% |
| Total Occupied Housing Units | 113 | 100.0% |
Occupancy by Household Size in Roy
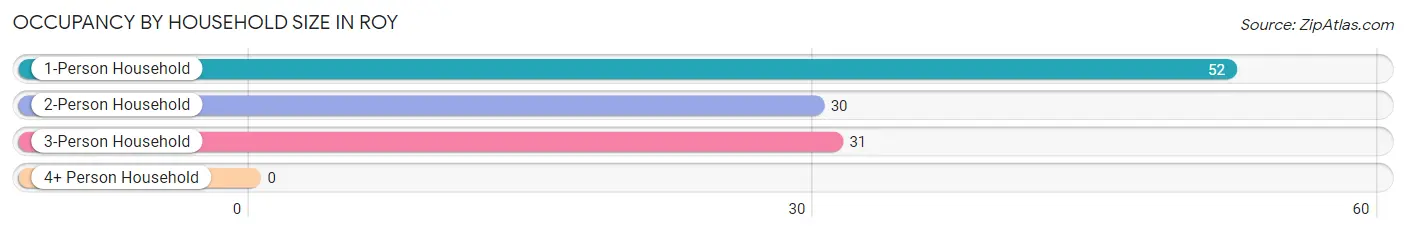
| Household Size | # Housing Units | % Housing Units |
| 1-Person Household | 52 | 46.0% |
| 2-Person Household | 30 | 26.6% |
| 3-Person Household | 31 | 27.4% |
| 4+ Person Household | 0 | 0.0% |
| Total Housing Units | 113 | 100.0% |
Occupancy by Ownership by Household Size in Roy
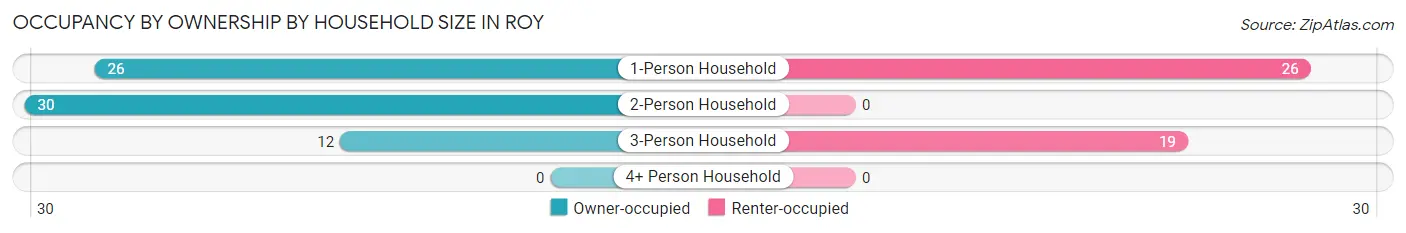
| Household Size | Owner-occupied | Renter-occupied |
| 1-Person Household | 26 (50.0%) | 26 (50.0%) |
| 2-Person Household | 30 (100.0%) | 0 (0.0%) |
| 3-Person Household | 12 (38.7%) | 19 (61.3%) |
| 4+ Person Household | 0 (0.0%) | 0 (0.0%) |
| Total Housing Units | 68 (60.2%) | 45 (39.8%) |
Occupancy by Educational Attainment in Roy
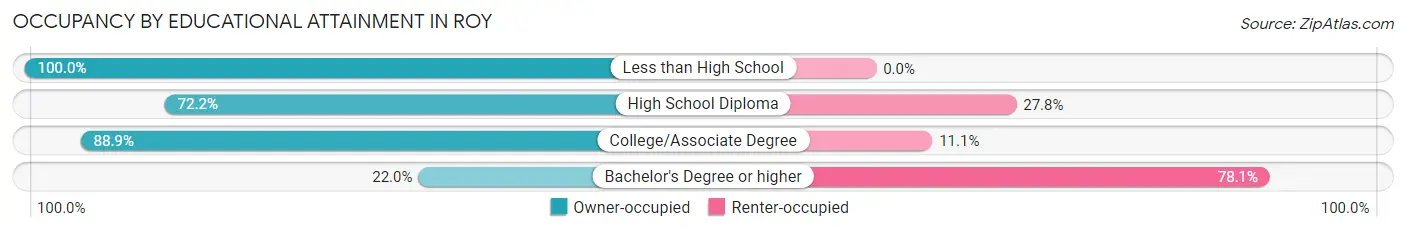
| Household Size | Owner-occupied | Renter-occupied |
| Less than High School | 9 (100.0%) | 0 (0.0%) |
| High School Diploma | 26 (72.2%) | 10 (27.8%) |
| College/Associate Degree | 24 (88.9%) | 3 (11.1%) |
| Bachelor's Degree or higher | 9 (22.0%) | 32 (78.0%) |
Occupancy by Age of Householder in Roy
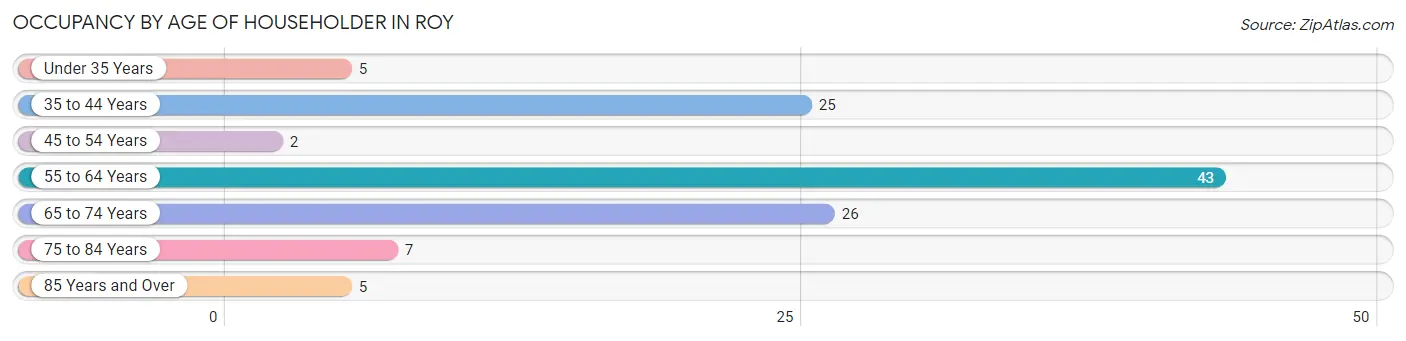
| Age Bracket | # Households | % Households |
| Under 35 Years | 5 | 4.4% |
| 35 to 44 Years | 25 | 22.1% |
| 45 to 54 Years | 2 | 1.8% |
| 55 to 64 Years | 43 | 38.1% |
| 65 to 74 Years | 26 | 23.0% |
| 75 to 84 Years | 7 | 6.2% |
| 85 Years and Over | 5 | 4.4% |
| Total | 113 | 100.0% |
Housing Finances in Roy
Median Income by Occupancy in Roy
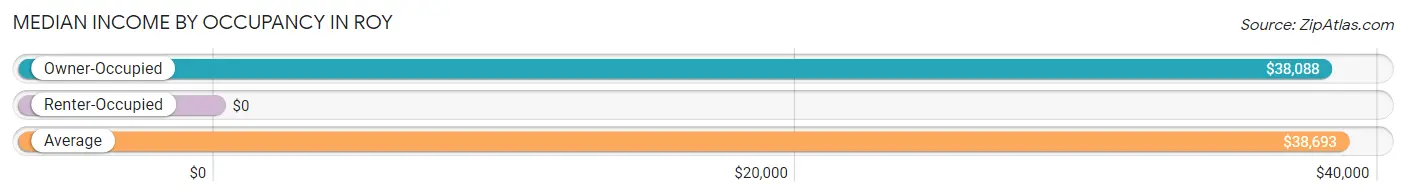
| Occupancy Type | # Households | Median Income |
| Owner-Occupied | 68 (60.2%) | $38,088 |
| Renter-Occupied | 45 (39.8%) | $0 |
| Average | 113 (100.0%) | $38,693 |
Occupancy by Householder Income Bracket in Roy
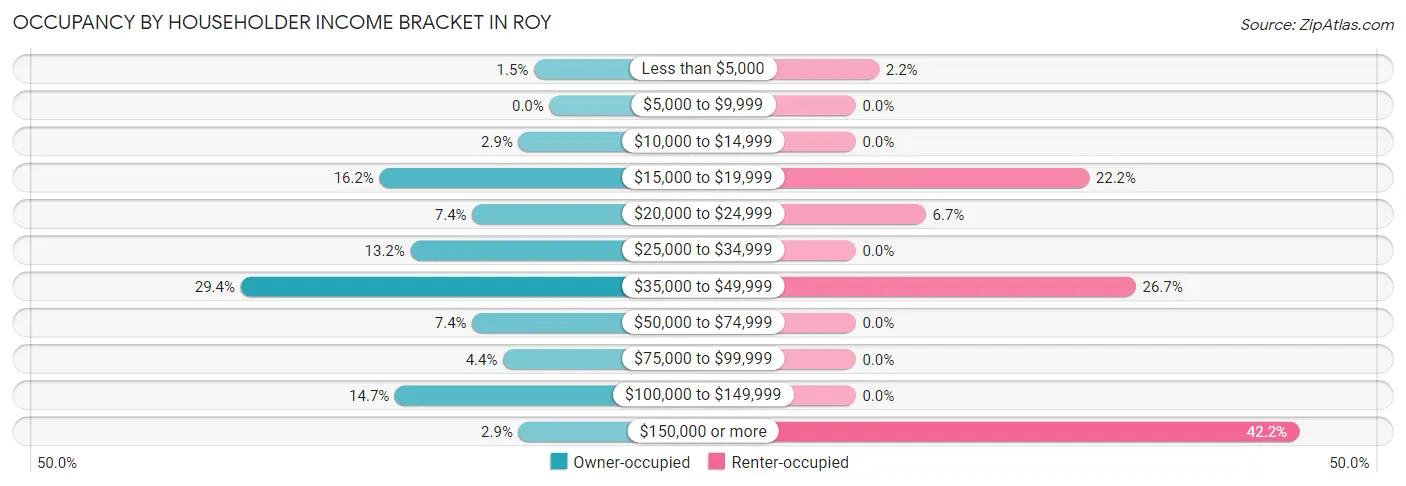
| Income Bracket | Owner-occupied | Renter-occupied |
| Less than $5,000 | 1 (1.5%) | 1 (2.2%) |
| $5,000 to $9,999 | 0 (0.0%) | 0 (0.0%) |
| $10,000 to $14,999 | 2 (2.9%) | 0 (0.0%) |
| $15,000 to $19,999 | 11 (16.2%) | 10 (22.2%) |
| $20,000 to $24,999 | 5 (7.3%) | 3 (6.7%) |
| $25,000 to $34,999 | 9 (13.2%) | 0 (0.0%) |
| $35,000 to $49,999 | 20 (29.4%) | 12 (26.7%) |
| $50,000 to $74,999 | 5 (7.3%) | 0 (0.0%) |
| $75,000 to $99,999 | 3 (4.4%) | 0 (0.0%) |
| $100,000 to $149,999 | 10 (14.7%) | 0 (0.0%) |
| $150,000 or more | 2 (2.9%) | 19 (42.2%) |
| Total | 68 (100.0%) | 45 (100.0%) |
Monthly Housing Cost Tiers in Roy
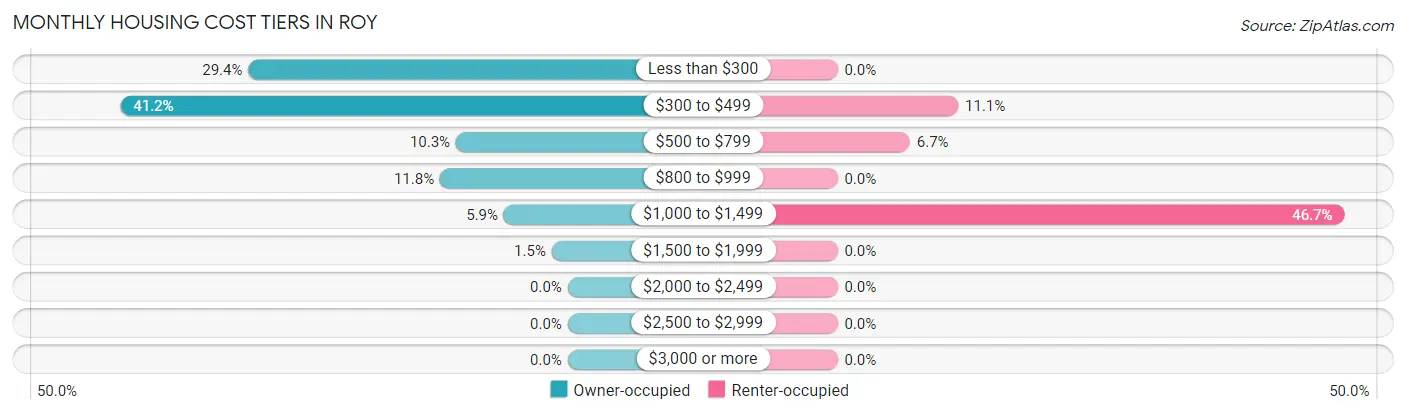
| Monthly Cost | Owner-occupied | Renter-occupied |
| Less than $300 | 20 (29.4%) | 0 (0.0%) |
| $300 to $499 | 28 (41.2%) | 5 (11.1%) |
| $500 to $799 | 7 (10.3%) | 3 (6.7%) |
| $800 to $999 | 8 (11.8%) | 0 (0.0%) |
| $1,000 to $1,499 | 4 (5.9%) | 21 (46.7%) |
| $1,500 to $1,999 | 1 (1.5%) | 0 (0.0%) |
| $2,000 to $2,499 | 0 (0.0%) | 0 (0.0%) |
| $2,500 to $2,999 | 0 (0.0%) | 0 (0.0%) |
| $3,000 or more | 0 (0.0%) | 0 (0.0%) |
| Total | 68 (100.0%) | 45 (100.0%) |
Physical Housing Characteristics in Roy
Housing Structures in Roy
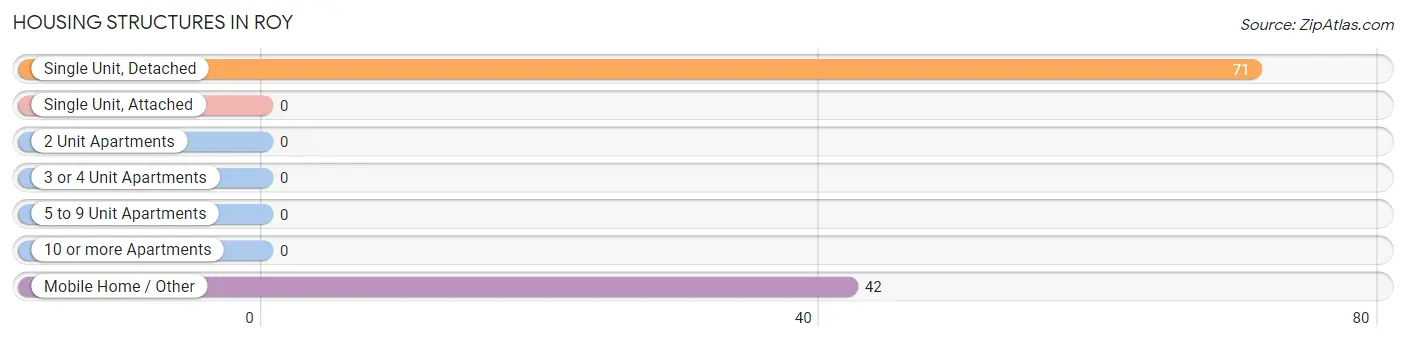
| Structure Type | # Housing Units | % Housing Units |
| Single Unit, Detached | 71 | 62.8% |
| Single Unit, Attached | 0 | 0.0% |
| 2 Unit Apartments | 0 | 0.0% |
| 3 or 4 Unit Apartments | 0 | 0.0% |
| 5 to 9 Unit Apartments | 0 | 0.0% |
| 10 or more Apartments | 0 | 0.0% |
| Mobile Home / Other | 42 | 37.2% |
| Total | 113 | 100.0% |
Housing Structures by Occupancy in Roy
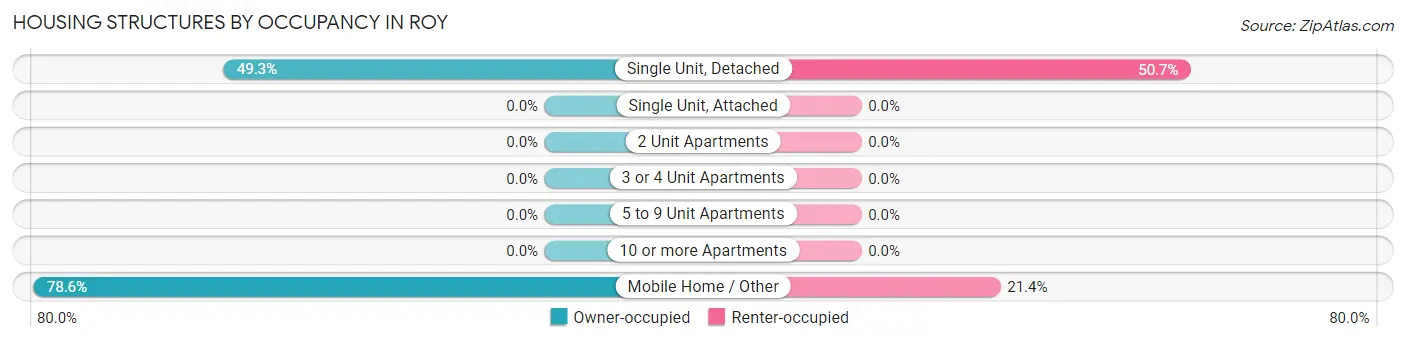
| Structure Type | Owner-occupied | Renter-occupied |
| Single Unit, Detached | 35 (49.3%) | 36 (50.7%) |
| Single Unit, Attached | 0 (0.0%) | 0 (0.0%) |
| 2 Unit Apartments | 0 (0.0%) | 0 (0.0%) |
| 3 or 4 Unit Apartments | 0 (0.0%) | 0 (0.0%) |
| 5 to 9 Unit Apartments | 0 (0.0%) | 0 (0.0%) |
| 10 or more Apartments | 0 (0.0%) | 0 (0.0%) |
| Mobile Home / Other | 33 (78.6%) | 9 (21.4%) |
| Total | 68 (60.2%) | 45 (39.8%) |
Housing Structures by Number of Rooms in Roy
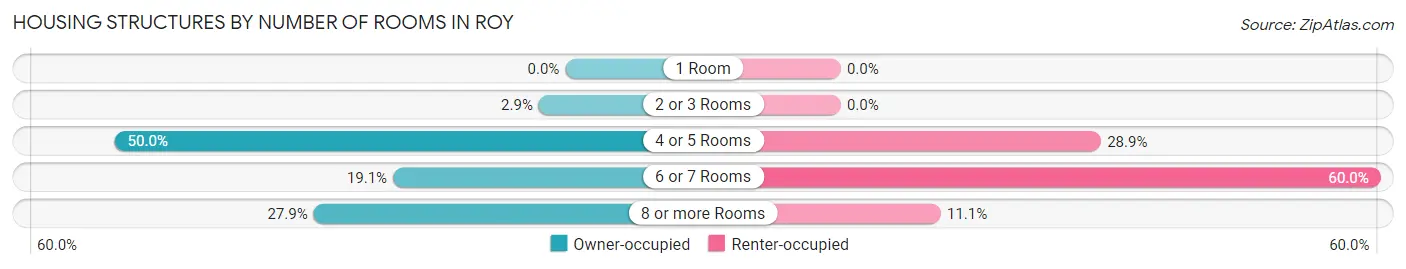
| Number of Rooms | Owner-occupied | Renter-occupied |
| 1 Room | 0 (0.0%) | 0 (0.0%) |
| 2 or 3 Rooms | 2 (2.9%) | 0 (0.0%) |
| 4 or 5 Rooms | 34 (50.0%) | 13 (28.9%) |
| 6 or 7 Rooms | 13 (19.1%) | 27 (60.0%) |
| 8 or more Rooms | 19 (27.9%) | 5 (11.1%) |
| Total | 68 (100.0%) | 45 (100.0%) |
Housing Structure by Heating Type in Roy
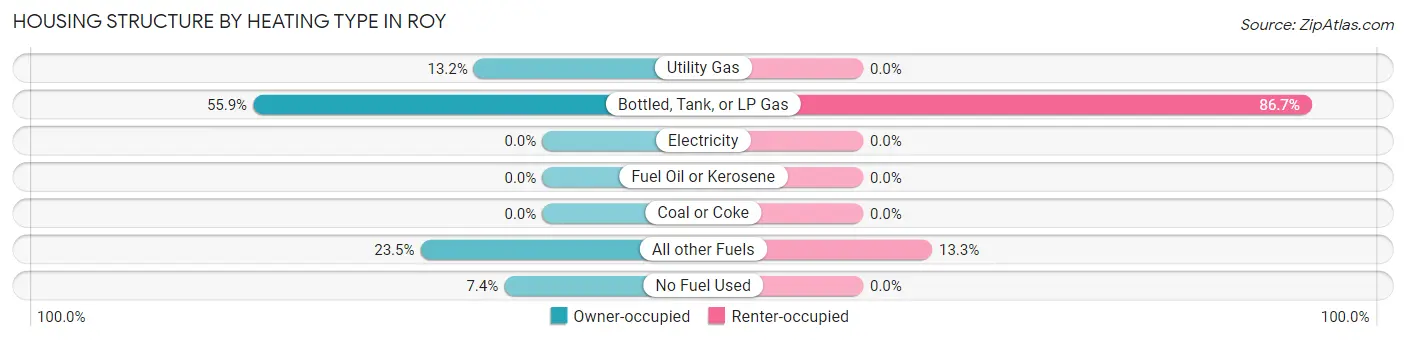
| Heating Type | Owner-occupied | Renter-occupied |
| Utility Gas | 9 (13.2%) | 0 (0.0%) |
| Bottled, Tank, or LP Gas | 38 (55.9%) | 39 (86.7%) |
| Electricity | 0 (0.0%) | 0 (0.0%) |
| Fuel Oil or Kerosene | 0 (0.0%) | 0 (0.0%) |
| Coal or Coke | 0 (0.0%) | 0 (0.0%) |
| All other Fuels | 16 (23.5%) | 6 (13.3%) |
| No Fuel Used | 5 (7.3%) | 0 (0.0%) |
| Total | 68 (100.0%) | 45 (100.0%) |
Household Vehicle Usage in Roy
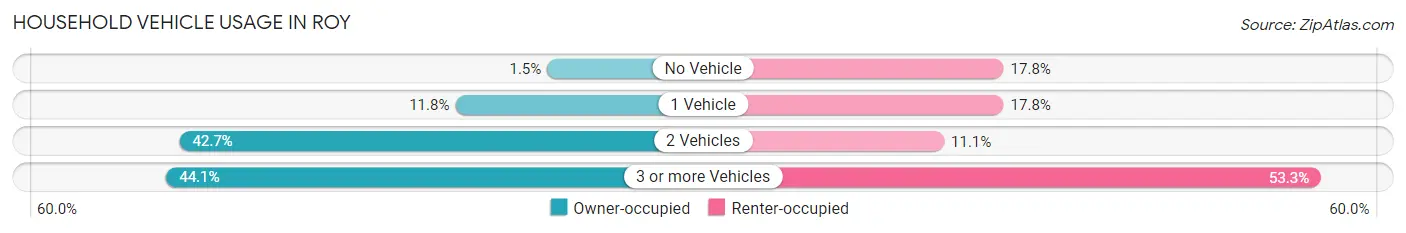
| Vehicles per Household | Owner-occupied | Renter-occupied |
| No Vehicle | 1 (1.5%) | 8 (17.8%) |
| 1 Vehicle | 8 (11.8%) | 8 (17.8%) |
| 2 Vehicles | 29 (42.6%) | 5 (11.1%) |
| 3 or more Vehicles | 30 (44.1%) | 24 (53.3%) |
| Total | 68 (100.0%) | 45 (100.0%) |
Real Estate & Mortgages in Roy
Real Estate and Mortgage Overview in Roy
| Characteristic | Without Mortgage | With Mortgage |
| Housing Units | 61 | 7 |
| Median Property Value | - | - |
| Median Household Income | $37,721 | $2 |
| Monthly Housing Costs | $423 | $0 |
| Real Estate Taxes | $217 | $0 |
Property Value by Mortgage Status in Roy
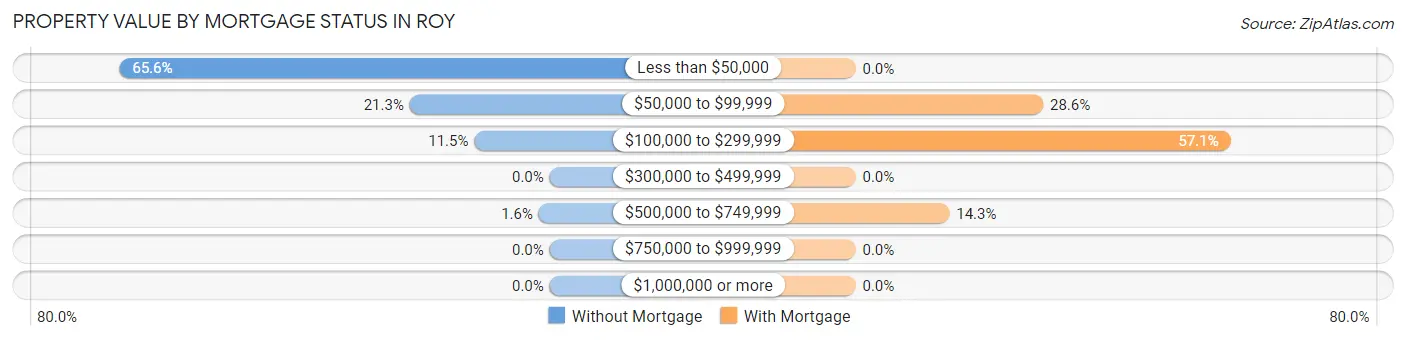
| Property Value | Without Mortgage | With Mortgage |
| Less than $50,000 | 40 (65.6%) | 0 (0.0%) |
| $50,000 to $99,999 | 13 (21.3%) | 2 (28.6%) |
| $100,000 to $299,999 | 7 (11.5%) | 4 (57.1%) |
| $300,000 to $499,999 | 0 (0.0%) | 0 (0.0%) |
| $500,000 to $749,999 | 1 (1.6%) | 1 (14.3%) |
| $750,000 to $999,999 | 0 (0.0%) | 0 (0.0%) |
| $1,000,000 or more | 0 (0.0%) | 0 (0.0%) |
| Total | 61 (100.0%) | 7 (100.0%) |
Household Income by Mortgage Status in Roy
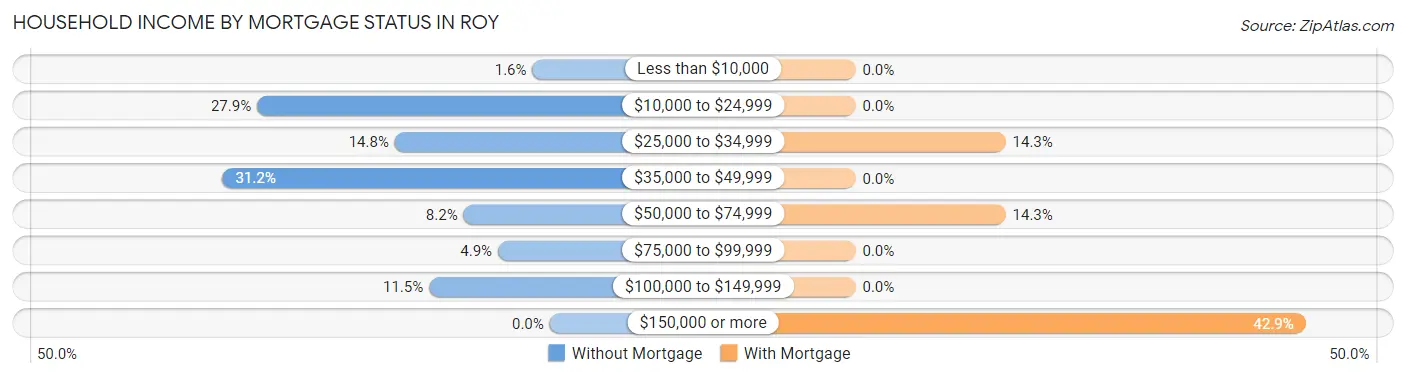
| Household Income | Without Mortgage | With Mortgage |
| Less than $10,000 | 1 (1.6%) | 0 (0.0%) |
| $10,000 to $24,999 | 17 (27.9%) | 0 (0.0%) |
| $25,000 to $34,999 | 9 (14.7%) | 1 (14.3%) |
| $35,000 to $49,999 | 19 (31.1%) | 0 (0.0%) |
| $50,000 to $74,999 | 5 (8.2%) | 1 (14.3%) |
| $75,000 to $99,999 | 3 (4.9%) | 0 (0.0%) |
| $100,000 to $149,999 | 7 (11.5%) | 0 (0.0%) |
| $150,000 or more | 0 (0.0%) | 3 (42.9%) |
| Total | 61 (100.0%) | 7 (100.0%) |
Property Value to Household Income Ratio in Roy
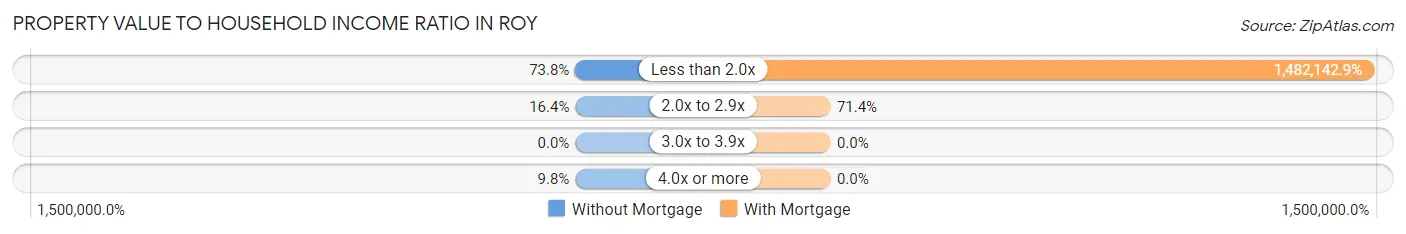
| Value-to-Income Ratio | Without Mortgage | With Mortgage |
| Less than 2.0x | 45 (73.8%) | 103,750 (1,482,142.9%) |
| 2.0x to 2.9x | 10 (16.4%) | 5 (71.4%) |
| 3.0x to 3.9x | 0 (0.0%) | 0 (0.0%) |
| 4.0x or more | 6 (9.8%) | 0 (0.0%) |
| Total | 61 (100.0%) | 7 (100.0%) |
Real Estate Taxes by Mortgage Status in Roy
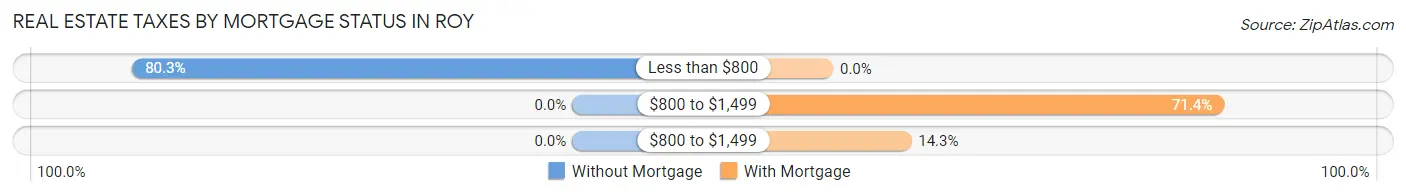
| Property Taxes | Without Mortgage | With Mortgage |
| Less than $800 | 49 (80.3%) | 0 (0.0%) |
| $800 to $1,499 | 0 (0.0%) | 5 (71.4%) |
| $800 to $1,499 | 0 (0.0%) | 1 (14.3%) |
| Total | 61 (100.0%) | 7 (100.0%) |
Health & Disability in Roy
Health Insurance Coverage by Age in Roy
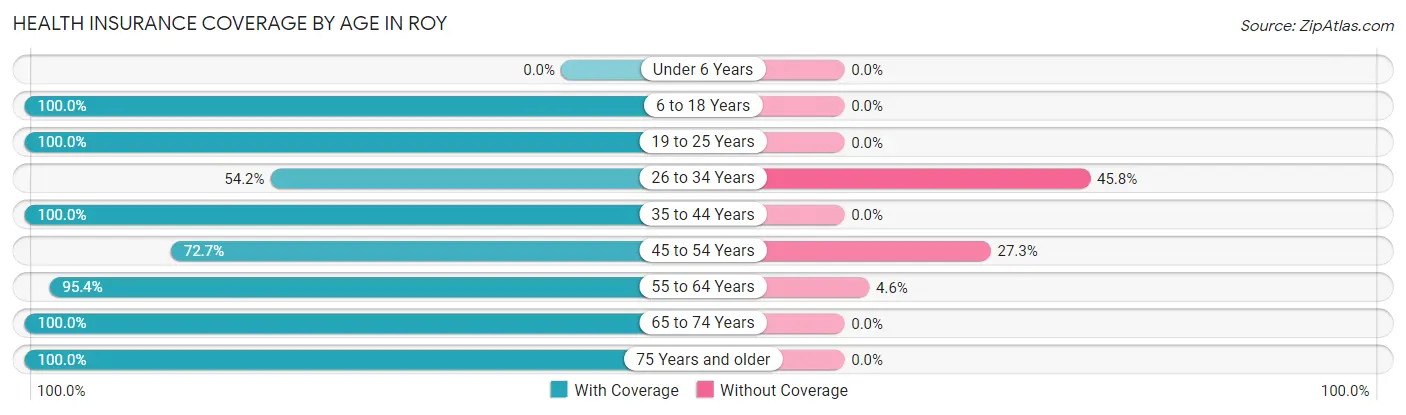
| Age Bracket | With Coverage | Without Coverage |
| Under 6 Years | 0 (0.0%) | 0 (0.0%) |
| 6 to 18 Years | 26 (100.0%) | 0 (0.0%) |
| 19 to 25 Years | 36 (100.0%) | 0 (0.0%) |
| 26 to 34 Years | 13 (54.2%) | 11 (45.8%) |
| 35 to 44 Years | 55 (100.0%) | 0 (0.0%) |
| 45 to 54 Years | 16 (72.7%) | 6 (27.3%) |
| 55 to 64 Years | 62 (95.4%) | 3 (4.6%) |
| 65 to 74 Years | 35 (100.0%) | 0 (0.0%) |
| 75 Years and older | 15 (100.0%) | 0 (0.0%) |
| Total | 258 (92.8%) | 20 (7.2%) |
Health Insurance Coverage by Citizenship Status in Roy
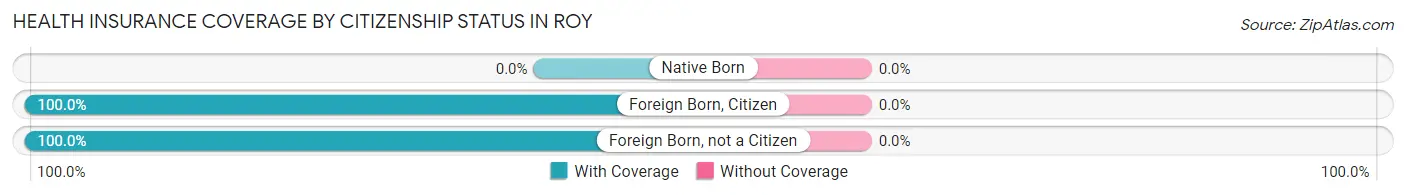
| Citizenship Status | With Coverage | Without Coverage |
| Native Born | 0 (0.0%) | 0 (0.0%) |
| Foreign Born, Citizen | 26 (100.0%) | 0 (0.0%) |
| Foreign Born, not a Citizen | 36 (100.0%) | 0 (0.0%) |
Health Insurance Coverage by Household Income in Roy
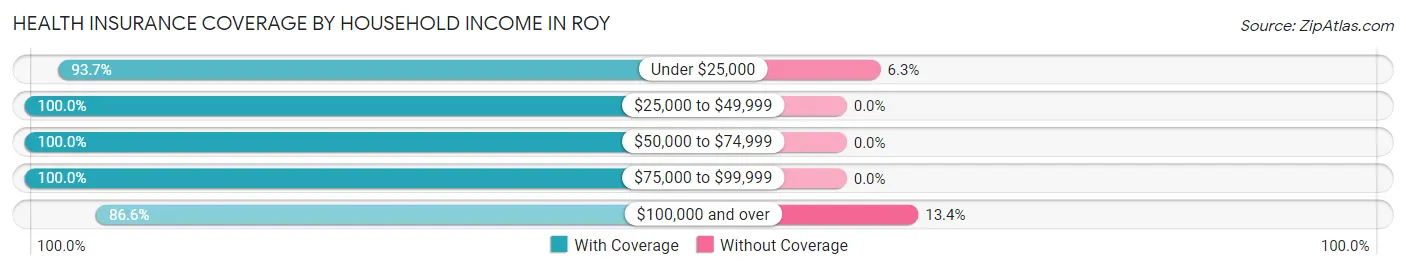
| Household Income | With Coverage | Without Coverage |
| Under $25,000 | 74 (93.7%) | 5 (6.3%) |
| $25,000 to $49,999 | 70 (100.0%) | 0 (0.0%) |
| $50,000 to $74,999 | 10 (100.0%) | 0 (0.0%) |
| $75,000 to $99,999 | 7 (100.0%) | 0 (0.0%) |
| $100,000 and over | 97 (86.6%) | 15 (13.4%) |
Public vs Private Health Insurance Coverage by Age in Roy
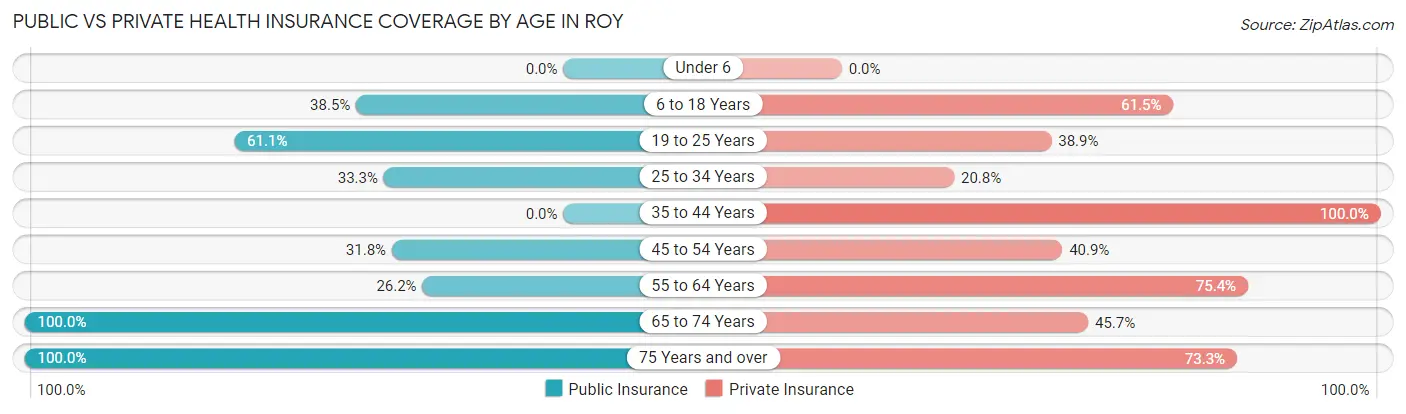
| Age Bracket | Public Insurance | Private Insurance |
| Under 6 | 0 (0.0%) | 0 (0.0%) |
| 6 to 18 Years | 10 (38.5%) | 16 (61.5%) |
| 19 to 25 Years | 22 (61.1%) | 14 (38.9%) |
| 25 to 34 Years | 8 (33.3%) | 5 (20.8%) |
| 35 to 44 Years | 0 (0.0%) | 55 (100.0%) |
| 45 to 54 Years | 7 (31.8%) | 9 (40.9%) |
| 55 to 64 Years | 17 (26.2%) | 49 (75.4%) |
| 65 to 74 Years | 35 (100.0%) | 16 (45.7%) |
| 75 Years and over | 15 (100.0%) | 11 (73.3%) |
| Total | 114 (41.0%) | 175 (62.9%) |
Disability Status by Sex by Age in Roy
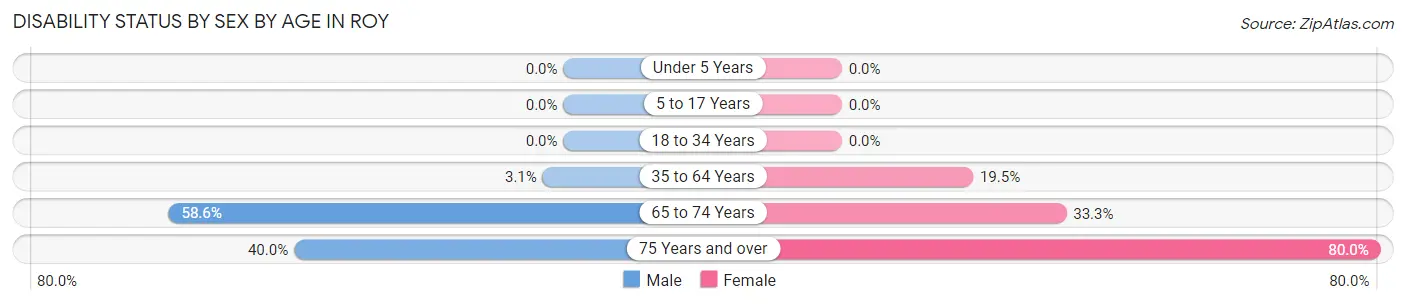
| Age Bracket | Male | Female |
| Under 5 Years | 0 (0.0%) | 0 (0.0%) |
| 5 to 17 Years | 0 (0.0%) | 0 (0.0%) |
| 18 to 34 Years | 0 (0.0%) | 0 (0.0%) |
| 35 to 64 Years | 2 (3.1%) | 15 (19.5%) |
| 65 to 74 Years | 17 (58.6%) | 2 (33.3%) |
| 75 Years and over | 4 (40.0%) | 4 (80.0%) |
Disability Class by Sex by Age in Roy
Disability Class: Hearing Difficulty
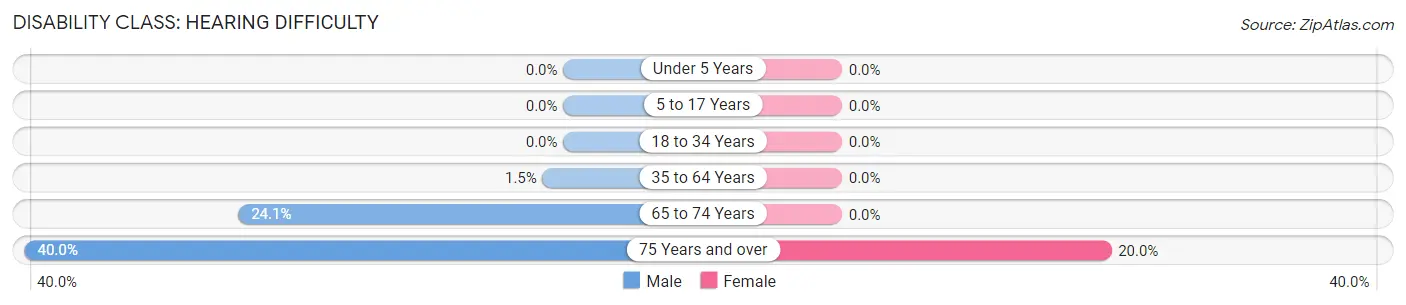
| Age Bracket | Male | Female |
| Under 5 Years | 0 (0.0%) | 0 (0.0%) |
| 5 to 17 Years | 0 (0.0%) | 0 (0.0%) |
| 18 to 34 Years | 0 (0.0%) | 0 (0.0%) |
| 35 to 64 Years | 1 (1.5%) | 0 (0.0%) |
| 65 to 74 Years | 7 (24.1%) | 0 (0.0%) |
| 75 Years and over | 4 (40.0%) | 1 (20.0%) |
Disability Class: Vision Difficulty
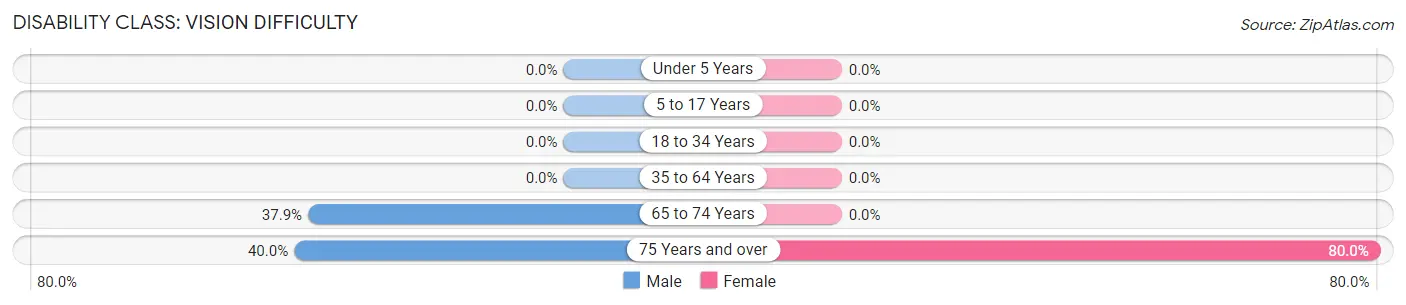
| Age Bracket | Male | Female |
| Under 5 Years | 0 (0.0%) | 0 (0.0%) |
| 5 to 17 Years | 0 (0.0%) | 0 (0.0%) |
| 18 to 34 Years | 0 (0.0%) | 0 (0.0%) |
| 35 to 64 Years | 0 (0.0%) | 0 (0.0%) |
| 65 to 74 Years | 11 (37.9%) | 0 (0.0%) |
| 75 Years and over | 4 (40.0%) | 4 (80.0%) |
Disability Class: Cognitive Difficulty
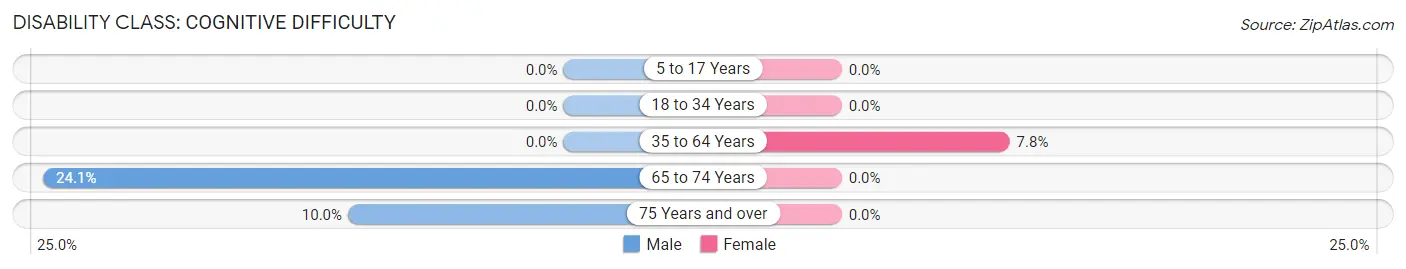
| Age Bracket | Male | Female |
| 5 to 17 Years | 0 (0.0%) | 0 (0.0%) |
| 18 to 34 Years | 0 (0.0%) | 0 (0.0%) |
| 35 to 64 Years | 0 (0.0%) | 6 (7.8%) |
| 65 to 74 Years | 7 (24.1%) | 0 (0.0%) |
| 75 Years and over | 1 (10.0%) | 0 (0.0%) |
Disability Class: Ambulatory Difficulty
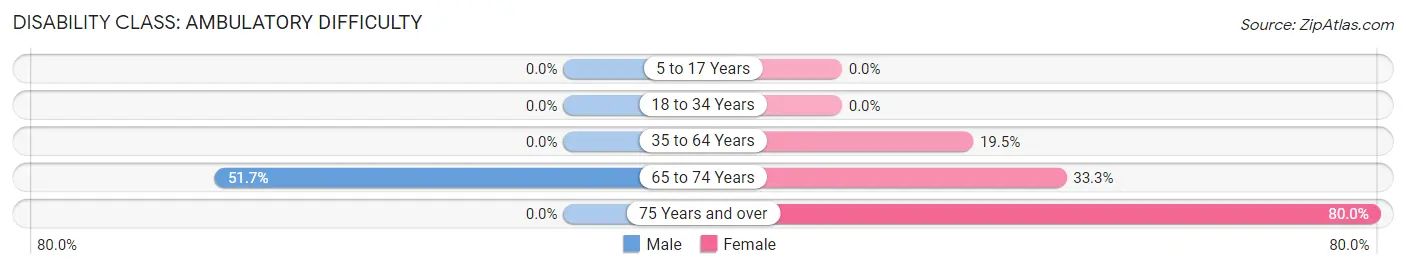
| Age Bracket | Male | Female |
| 5 to 17 Years | 0 (0.0%) | 0 (0.0%) |
| 18 to 34 Years | 0 (0.0%) | 0 (0.0%) |
| 35 to 64 Years | 0 (0.0%) | 15 (19.5%) |
| 65 to 74 Years | 15 (51.7%) | 2 (33.3%) |
| 75 Years and over | 0 (0.0%) | 4 (80.0%) |
Disability Class: Self-Care Difficulty
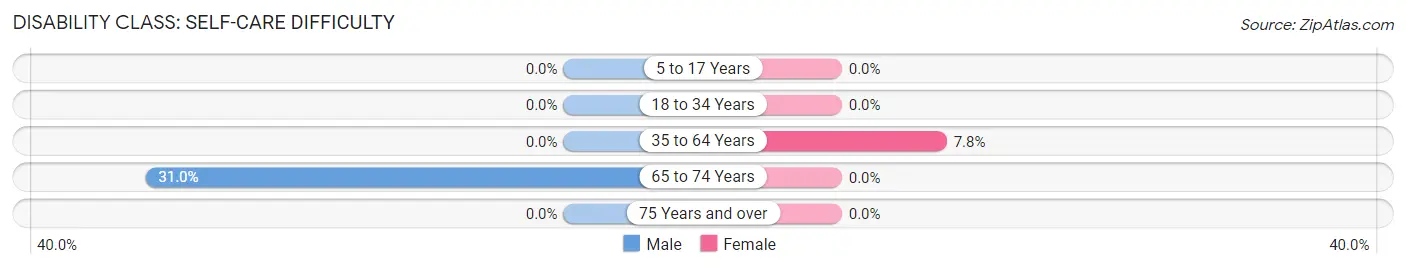
| Age Bracket | Male | Female |
| 5 to 17 Years | 0 (0.0%) | 0 (0.0%) |
| 18 to 34 Years | 0 (0.0%) | 0 (0.0%) |
| 35 to 64 Years | 0 (0.0%) | 6 (7.8%) |
| 65 to 74 Years | 9 (31.0%) | 0 (0.0%) |
| 75 Years and over | 0 (0.0%) | 0 (0.0%) |
Technology Access in Roy
Computing Device Access in Roy
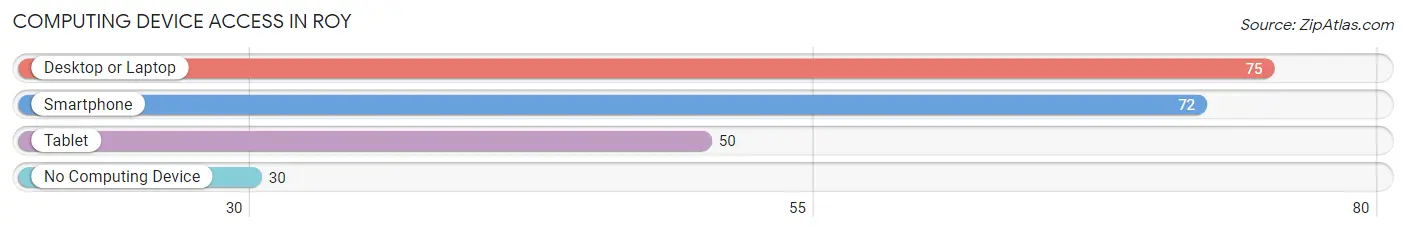
| Device Type | # Households | % Households |
| Desktop or Laptop | 75 | 66.4% |
| Smartphone | 72 | 63.7% |
| Tablet | 50 | 44.3% |
| No Computing Device | 30 | 26.6% |
| Total | 113 | 100.0% |
Internet Access in Roy
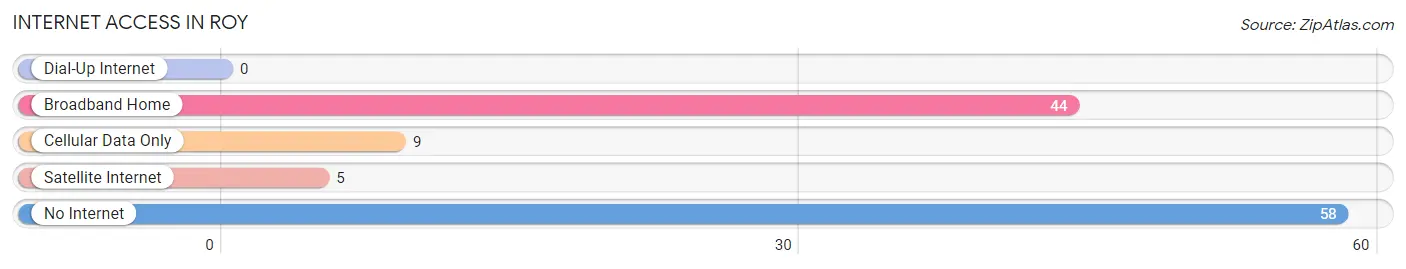
| Internet Type | # Households | % Households |
| Dial-Up Internet | 0 | 0.0% |
| Broadband Home | 44 | 38.9% |
| Cellular Data Only | 9 | 8.0% |
| Satellite Internet | 5 | 4.4% |
| No Internet | 58 | 51.3% |
| Total | 113 | 100.0% |
Roy Summary
NM History
New Mexico is a state located in the southwestern region of the United States. It is the fifth-largest state in the country and the 36th most populous. The state was admitted to the Union in 1912 as the 47th state. The area has a long and varied history, beginning with the Native American tribes that inhabited the area for centuries before the arrival of Europeans. The Spanish were the first Europeans to explore the area, and they established a number of settlements in the region. The area was part of Mexico until 1848, when it was ceded to the United States as part of the Treaty of Guadalupe Hidalgo. The area was then organized as the New Mexico Territory in 1850.
The area has a rich cultural history, with a mix of Native American, Spanish, and Mexican influences. The state is home to a number of Native American tribes, including the Navajo, Apache, and Pueblo peoples. The state also has a large Hispanic population, with many people of Mexican descent.
Geography
New Mexico is located in the southwestern United States, bordered by Arizona to the west, Colorado to the north, Oklahoma to the northeast, and Texas to the east. The state has a total area of 121,590 square miles, making it the fifth-largest state in the country. The state is divided into 33 counties and has a population of 2,085,538 as of the 2020 census.
The state is home to a variety of landscapes, from the high desert of the Chihuahuan Desert in the south to the Rocky Mountains in the north. The Rio Grande, the longest river in the state, runs through the center of the state. The state also has a number of national parks, including Carlsbad Caverns National Park, White Sands National Monument, and Bandelier National Monument.
Economy
New Mexico has a diverse economy, with a mix of industries including agriculture, manufacturing, energy, and tourism. The state is the largest producer of chile peppers in the United States, and is also a major producer of pecans, onions, and other agricultural products. The state is also home to a number of manufacturing industries, including electronics, aerospace, and food processing.
The state is also a major producer of energy, with oil and natural gas being the primary sources of energy production. The state is also home to a number of renewable energy sources, including solar, wind, and geothermal.
The state’s tourism industry is also a major contributor to the economy, with visitors coming to the state to experience its unique culture, landscapes, and attractions.
Demographics
As of the 2020 census, New Mexico had a population of 2,085,538. The state has a diverse population, with a mix of Native American, Hispanic, and White populations. The state has a large Hispanic population, with 44.7% of the population identifying as Hispanic or Latino. The state also has a large Native American population, with 10.9% of the population identifying as Native American. The state also has a large White population, with 37.2% of the population identifying as White.
The state also has a large immigrant population, with 8.3% of the population identifying as foreign-born. The largest immigrant groups in the state are from Mexico, India, and El Salvador.
Conclusion
New Mexico is a state located in the southwestern United States. It has a long and varied history, with a mix of Native American, Spanish, and Mexican influences. The state has a diverse geography, with a mix of high desert, mountains, and rivers. The state has a diverse economy, with a mix of industries including agriculture, manufacturing, energy, and tourism. The state also has a diverse population, with a mix of Native American, Hispanic, and White populations.
Common Questions
What is Per Capita Income in Roy?
Per Capita income in Roy is $107,861.
What is the Median Household income in Roy?
Median Household Income in Roy is $38,693.
What is Income or Wage Gap in Roy?
Income or Wage Gap in Roy is 34.3%.
Women in Roy earn 65.7 cents for every dollar earned by a man.
What is Inequality or Gini Index in Roy?
Inequality or Gini Index in Roy is 0.73.
What is the Total Population of Roy?
Total Population of Roy is 278.
What is the Total Male Population of Roy?
Total Male Population of Roy is 134.
What is the Total Female Population of Roy?
Total Female Population of Roy is 144.
What is the Ratio of Males per 100 Females in Roy?
There are 93.06 Males per 100 Females in Roy.
What is the Ratio of Females per 100 Males in Roy?
There are 107.46 Females per 100 Males in Roy.
What is the Median Population Age in Roy?
Median Population Age in Roy is 42.9 Years.
What is the Average Family Size in Roy
Average Family Size in Roy is 3.9 People.
What is the Average Household Size in Roy
Average Household Size in Roy is 2.5 People.
How Large is the Labor Force in Roy?
There are 169 People in the Labor Forcein in Roy.
What is the Percentage of People in the Labor Force in Roy?
63.8% of People are in the Labor Force in Roy.
What is the Unemployment Rate in Roy?
Unemployment Rate in Roy is 13.0%.