Belfry, MT Map & Demographics
Belfry Map
Belfry Overview
$53,733
PER CAPITA INCOME
$95,625
AVG FAMILY INCOME
$43,250
AVG HOUSEHOLD INCOME
0.69
INEQUALITY / GINI INDEX
178
TOTAL POPULATION
88
MALE POPULATION
90
FEMALE POPULATION
97.78
MALES / 100 FEMALES
102.27
FEMALES / 100 MALES
47.6
MEDIAN AGE
3.7
AVG FAMILY SIZE
2.4
AVG HOUSEHOLD SIZE
78
LABOR FORCE [ PEOPLE ]
48.1%
PERCENT IN LABOR FORCE
Belfry Zip Codes
Belfry Area Codes
Income in Belfry
Income Overview in Belfry
Per Capita Income in Belfry is $53,733, while median incomes of families and households are $95,625 and $43,250 respectively.
| Characteristic | Number | Measure |
| Per Capita Income | 178 | $53,733 |
| Median Family Income | 39 | $95,625 |
| Mean Family Income | 39 | $194,905 |
| Median Household Income | 73 | $43,250 |
| Mean Household Income | 73 | $115,371 |
| Income Deficit | 39 | $0 |
| Wage / Income Gap (%) | 178 | 0.00% |
| Wage / Income Gap ($) | 178 | 100.00¢ per $1 |
| Gini / Inequality Index | 178 | 0.69 |
Earnings by Sex in Belfry
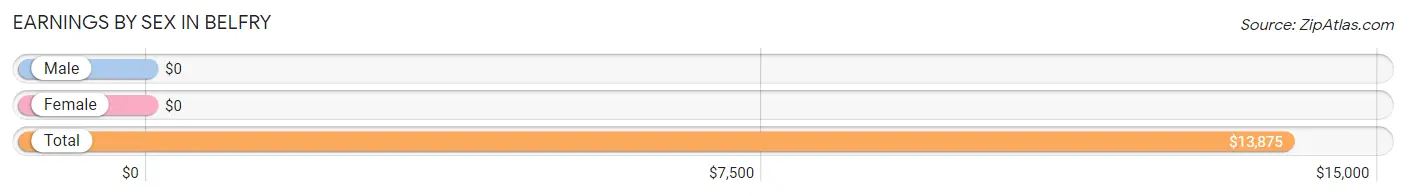
| Sex | Number | Average Earnings |
| Male | 56 (59.0%) | $0 |
| Female | 39 (41.0%) | $0 |
| Total | 95 (100.0%) | $13,875 |
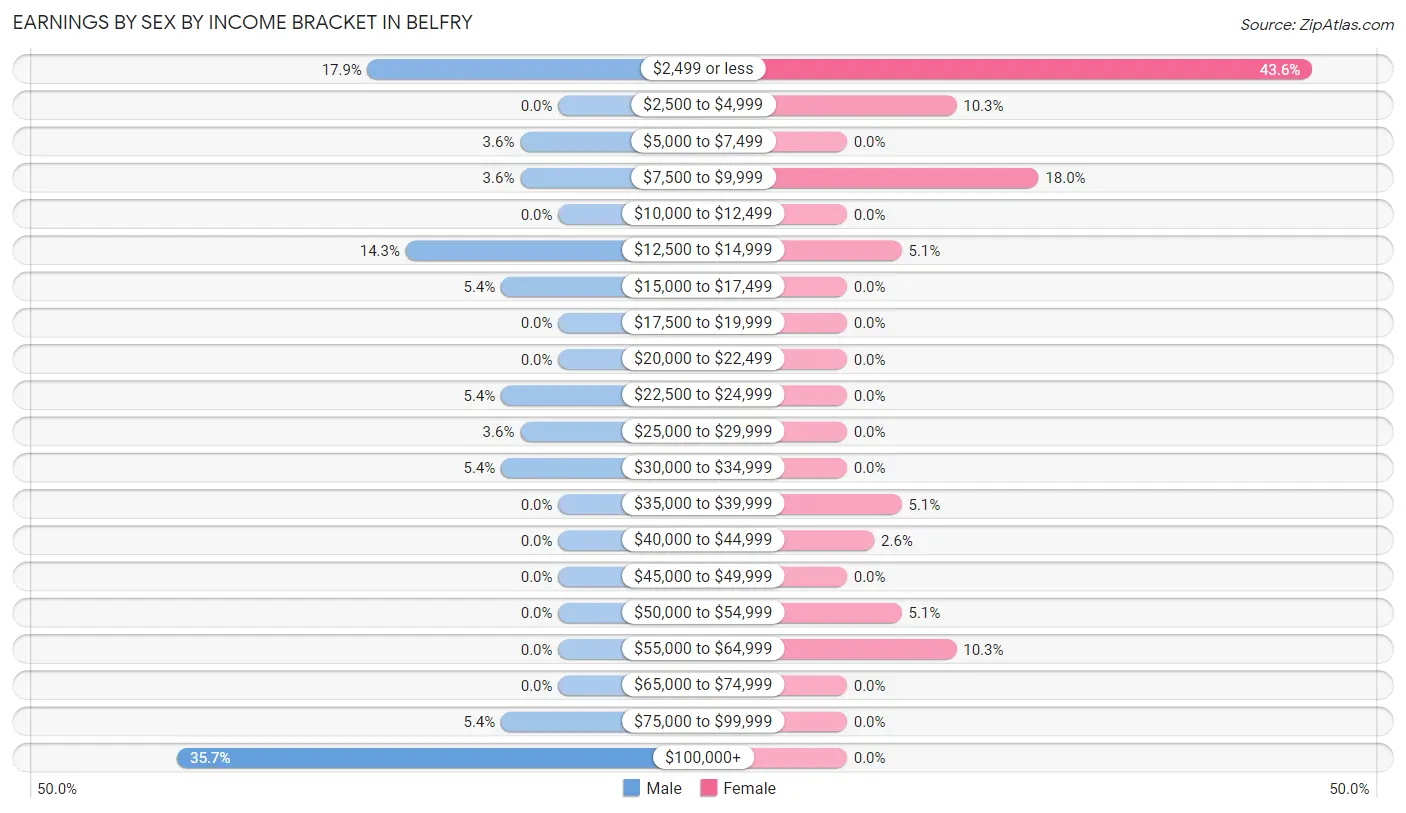
Earnings by Sex by Income Bracket in Belfry
The most common earnings brackets in Belfry are $100,000+ for men (20 | 35.7%) and $2,499 or less for women (17 | 43.6%).
| Income | Male | Female |
| $2,499 or less | 10 (17.9%) | 17 (43.6%) |
| $2,500 to $4,999 | 0 (0.0%) | 4 (10.3%) |
| $5,000 to $7,499 | 2 (3.6%) | 0 (0.0%) |
| $7,500 to $9,999 | 2 (3.6%) | 7 (17.9%) |
| $10,000 to $12,499 | 0 (0.0%) | 0 (0.0%) |
| $12,500 to $14,999 | 8 (14.3%) | 2 (5.1%) |
| $15,000 to $17,499 | 3 (5.4%) | 0 (0.0%) |
| $17,500 to $19,999 | 0 (0.0%) | 0 (0.0%) |
| $20,000 to $22,499 | 0 (0.0%) | 0 (0.0%) |
| $22,500 to $24,999 | 3 (5.4%) | 0 (0.0%) |
| $25,000 to $29,999 | 2 (3.6%) | 0 (0.0%) |
| $30,000 to $34,999 | 3 (5.4%) | 0 (0.0%) |
| $35,000 to $39,999 | 0 (0.0%) | 2 (5.1%) |
| $40,000 to $44,999 | 0 (0.0%) | 1 (2.6%) |
| $45,000 to $49,999 | 0 (0.0%) | 0 (0.0%) |
| $50,000 to $54,999 | 0 (0.0%) | 2 (5.1%) |
| $55,000 to $64,999 | 0 (0.0%) | 4 (10.3%) |
| $65,000 to $74,999 | 0 (0.0%) | 0 (0.0%) |
| $75,000 to $99,999 | 3 (5.4%) | 0 (0.0%) |
| $100,000+ | 20 (35.7%) | 0 (0.0%) |
| Total | 56 (100.0%) | 39 (100.0%) |
Earnings by Sex by Educational Attainment in Belfry
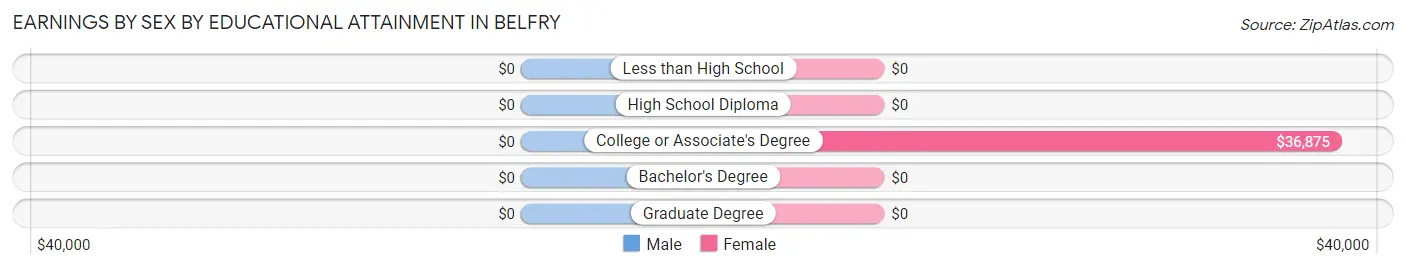
| Educational Attainment | Male Income | Female Income |
| Less than High School | - | - |
| High School Diploma | - | - |
| College or Associate's Degree | - | - |
| Bachelor's Degree | - | - |
| Graduate Degree | - | - |
| Total | - | - |
Family Income in Belfry
Family Income Brackets in Belfry
According to the Belfry family income data, there are 11 families falling into the $100,000 to $149,999 income range, which is the most common income bracket and makes up 28.2% of all families.
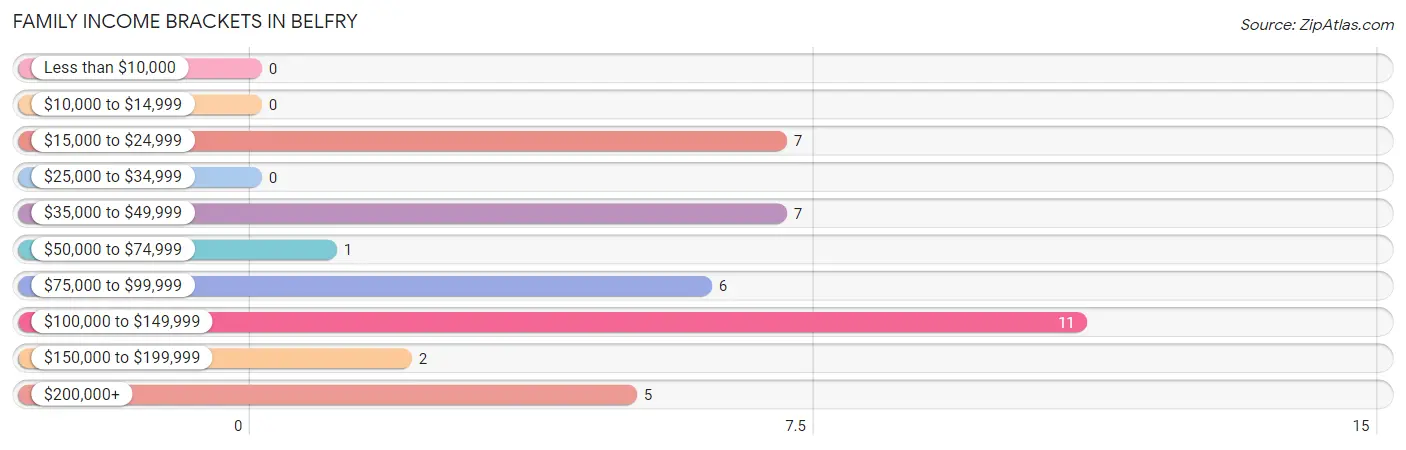
| Income Bracket | # Families | % Families |
| Less than $10,000 | 0 | 0.0% |
| $10,000 to $14,999 | 0 | 0.0% |
| $15,000 to $24,999 | 7 | 17.9% |
| $25,000 to $34,999 | 0 | 0.0% |
| $35,000 to $49,999 | 7 | 17.9% |
| $50,000 to $74,999 | 1 | 2.6% |
| $75,000 to $99,999 | 6 | 15.4% |
| $100,000 to $149,999 | 11 | 28.2% |
| $150,000 to $199,999 | 2 | 5.1% |
| $200,000+ | 5 | 12.8% |
Family Income by Famaliy Size in Belfry
2-person families (15 | 38.5%) account for the highest median family income in Belfry with $77,917 per family, while 2-person families (15 | 38.5%) have the highest median income of $38,958 per family member.
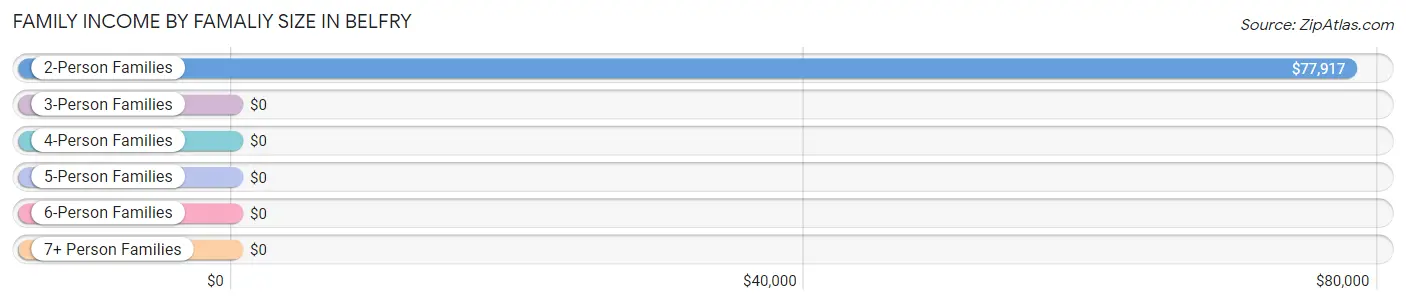
| Income Bracket | # Families | Median Income |
| 2-Person Families | 15 (38.5%) | $77,917 |
| 3-Person Families | 10 (25.6%) | $0 |
| 4-Person Families | 11 (28.2%) | $0 |
| 5-Person Families | 0 (0.0%) | $0 |
| 6-Person Families | 3 (7.7%) | $0 |
| 7+ Person Families | 0 (0.0%) | $0 |
| Total | 39 (100.0%) | $95,625 |
Family Income by Number of Earners in Belfry
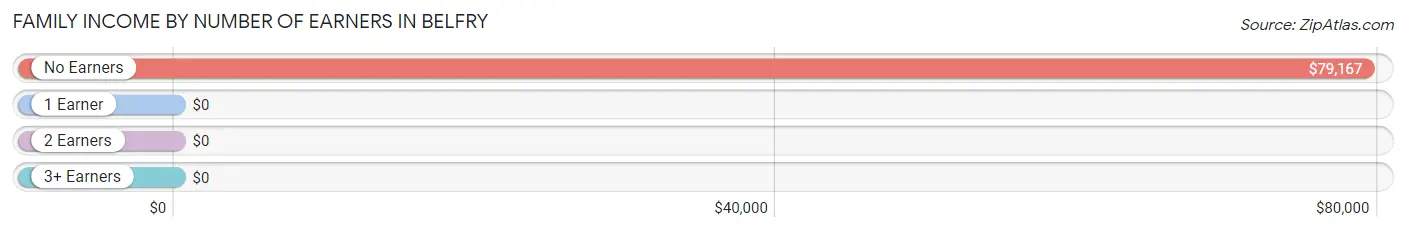
| Number of Earners | # Families | Median Income |
| No Earners | 8 (20.5%) | $79,167 |
| 1 Earner | 5 (12.8%) | $0 |
| 2 Earners | 19 (48.7%) | $0 |
| 3+ Earners | 7 (17.9%) | $0 |
| Total | 39 (100.0%) | $95,625 |
Household Income in Belfry
Household Income Brackets in Belfry
With 19 households falling in the category, the $10,000 to $14,999 income range is the most frequent in Belfry, accounting for 26.0% of all households.
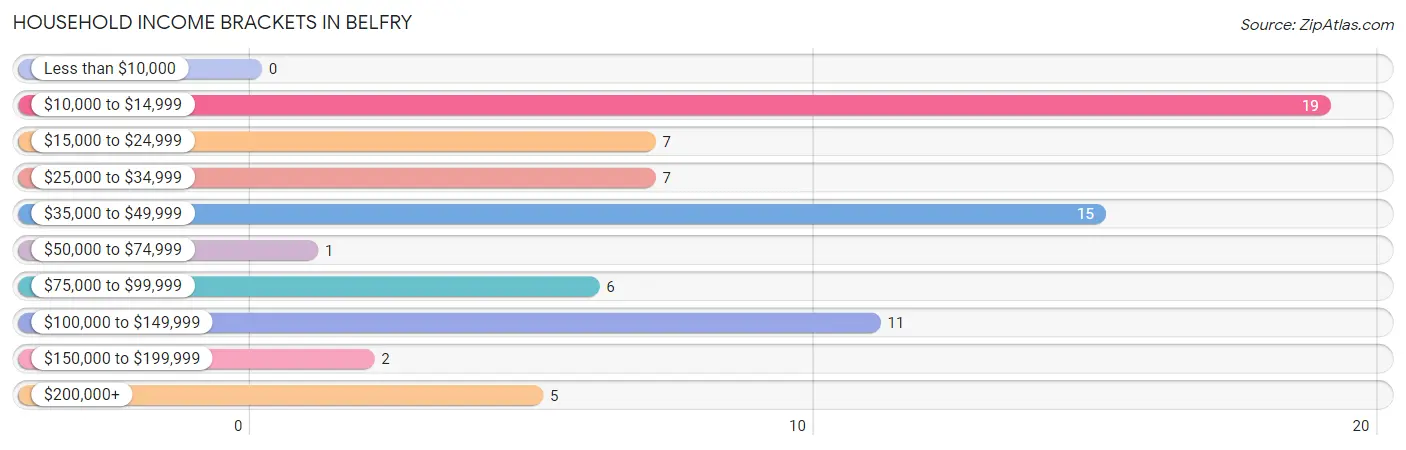
| Income Bracket | # Households | % Households |
| Less than $10,000 | 0 | 0.0% |
| $10,000 to $14,999 | 19 | 26.0% |
| $15,000 to $24,999 | 7 | 9.6% |
| $25,000 to $34,999 | 7 | 9.6% |
| $35,000 to $49,999 | 15 | 20.5% |
| $50,000 to $74,999 | 1 | 1.4% |
| $75,000 to $99,999 | 6 | 8.2% |
| $100,000 to $149,999 | 11 | 15.1% |
| $150,000 to $199,999 | 2 | 2.7% |
| $200,000+ | 5 | 6.8% |
Household Income by Householder Age in Belfry
The median household income in Belfry is $43,250, with the highest median household income of $138,438 found in the 25 to 44 years age bracket for the primary householder. A total of 11 households (15.1%) fall into this category.
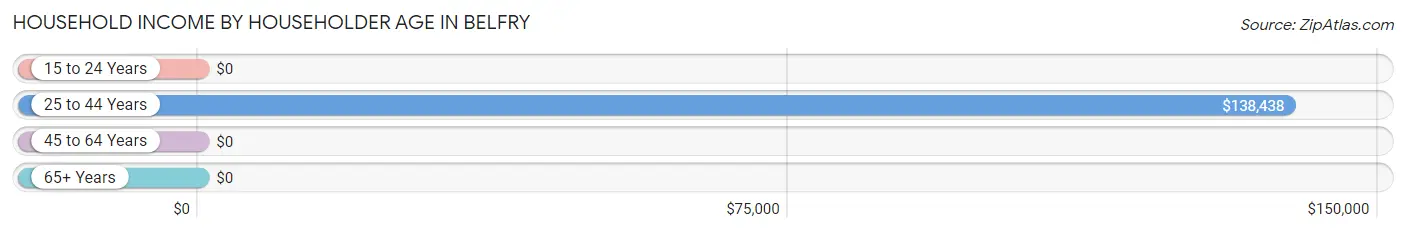
| Income Bracket | # Households | Median Income |
| 15 to 24 Years | 0 (0.0%) | $0 |
| 25 to 44 Years | 11 (15.1%) | $138,438 |
| 45 to 64 Years | 31 (42.5%) | $0 |
| 65+ Years | 31 (42.5%) | $0 |
| Total | 73 (100.0%) | $43,250 |
Poverty in Belfry
Income Below Poverty by Sex and Age in Belfry
With 21.6% poverty level for males and 16.7% for females among the residents of Belfry, 16 and 17 year old males and 45 to 54 year old females are the most vulnerable to poverty, with 3 males (100.0%) and 5 females (41.7%) in their respective age groups living below the poverty level.
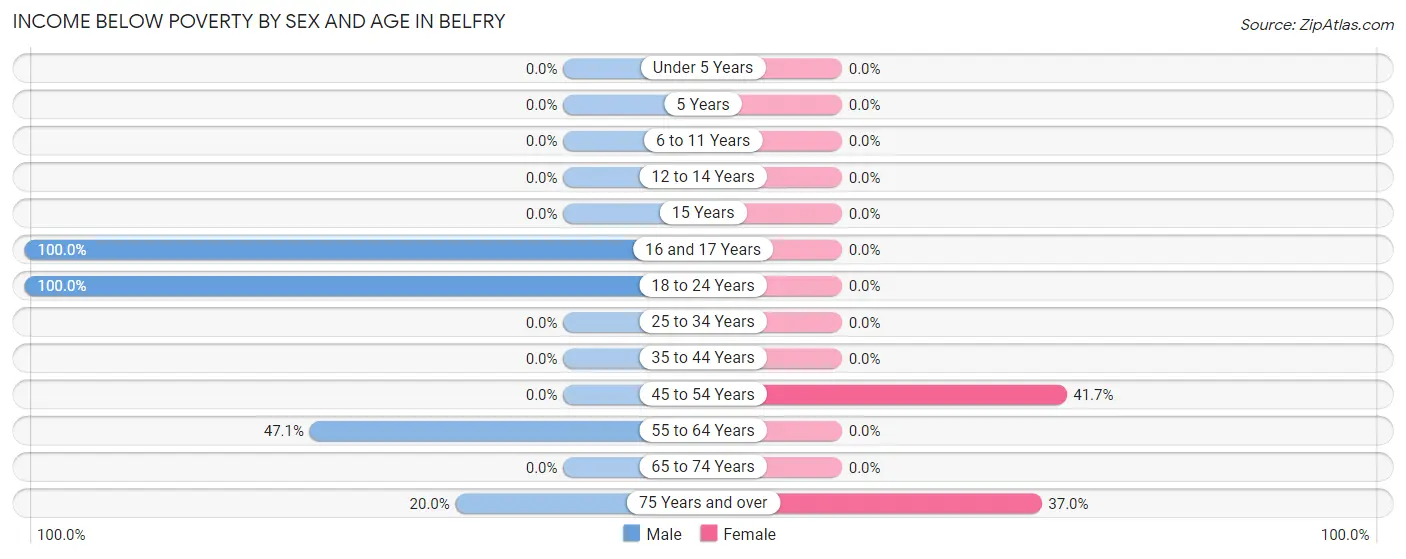
| Age Bracket | Male | Female |
| Under 5 Years | 0 (0.0%) | 0 (0.0%) |
| 5 Years | 0 (0.0%) | 0 (0.0%) |
| 6 to 11 Years | 0 (0.0%) | 0 (0.0%) |
| 12 to 14 Years | 0 (0.0%) | 0 (0.0%) |
| 15 Years | 0 (0.0%) | 0 (0.0%) |
| 16 and 17 Years | 3 (100.0%) | 0 (0.0%) |
| 18 to 24 Years | 7 (100.0%) | 0 (0.0%) |
| 25 to 34 Years | 0 (0.0%) | 0 (0.0%) |
| 35 to 44 Years | 0 (0.0%) | 0 (0.0%) |
| 45 to 54 Years | 0 (0.0%) | 5 (41.7%) |
| 55 to 64 Years | 8 (47.1%) | 0 (0.0%) |
| 65 to 74 Years | 0 (0.0%) | 0 (0.0%) |
| 75 Years and over | 1 (20.0%) | 10 (37.0%) |
| Total | 19 (21.6%) | 15 (16.7%) |
Income Above Poverty by Sex and Age in Belfry
According to the poverty statistics in Belfry, males aged 6 to 11 years and females aged 6 to 11 years are the age groups that are most secure financially, with 100.0% of males and 100.0% of females in these age groups living above the poverty line.
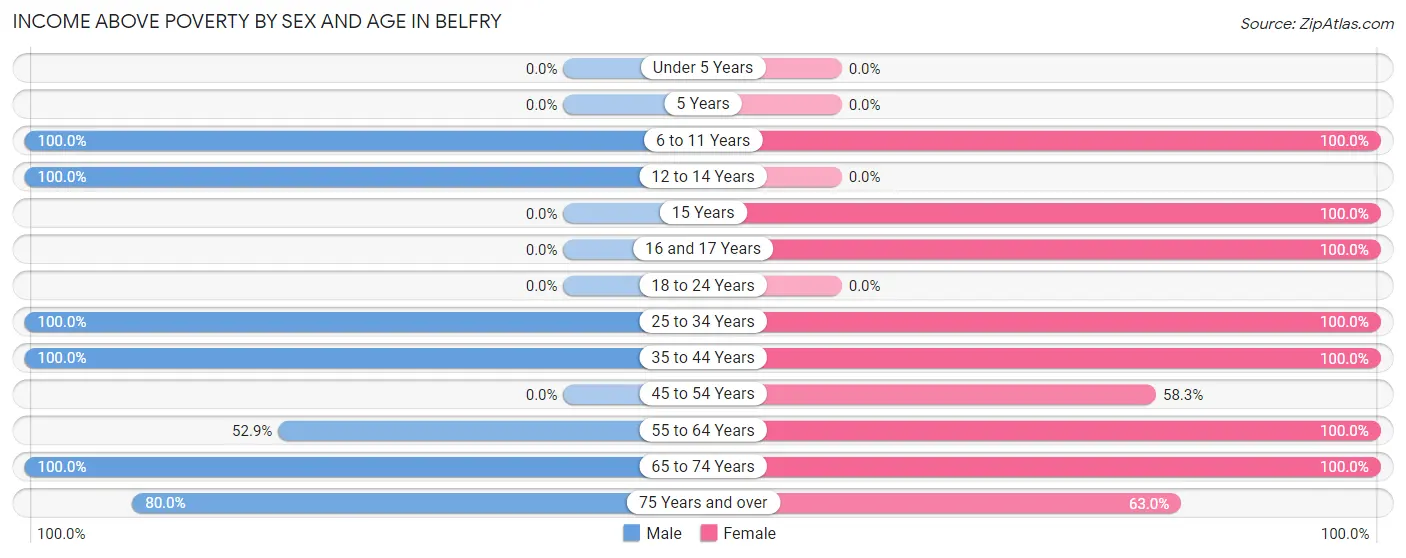
| Age Bracket | Male | Female |
| Under 5 Years | 0 (0.0%) | 0 (0.0%) |
| 5 Years | 0 (0.0%) | 0 (0.0%) |
| 6 to 11 Years | 2 (100.0%) | 6 (100.0%) |
| 12 to 14 Years | 4 (100.0%) | 0 (0.0%) |
| 15 Years | 0 (0.0%) | 4 (100.0%) |
| 16 and 17 Years | 0 (0.0%) | 4 (100.0%) |
| 18 to 24 Years | 0 (0.0%) | 0 (0.0%) |
| 25 to 34 Years | 15 (100.0%) | 21 (100.0%) |
| 35 to 44 Years | 16 (100.0%) | 4 (100.0%) |
| 45 to 54 Years | 0 (0.0%) | 7 (58.3%) |
| 55 to 64 Years | 9 (52.9%) | 6 (100.0%) |
| 65 to 74 Years | 19 (100.0%) | 6 (100.0%) |
| 75 Years and over | 4 (80.0%) | 17 (63.0%) |
| Total | 69 (78.4%) | 75 (83.3%) |
Income Below Poverty Among Married-Couple Families in Belfry
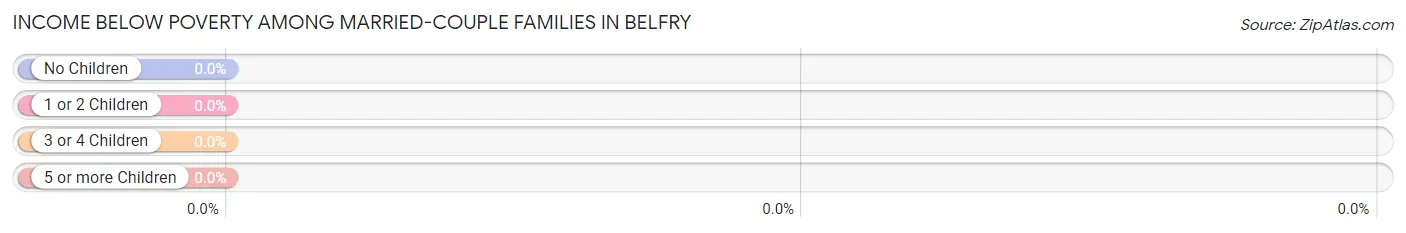
| Children | Above Poverty | Below Poverty |
| No Children | 16 (100.0%) | 0 (0.0%) |
| 1 or 2 Children | 6 (100.0%) | 0 (0.0%) |
| 3 or 4 Children | 3 (100.0%) | 0 (0.0%) |
| 5 or more Children | 0 (0.0%) | 0 (0.0%) |
| Total | 25 (100.0%) | 0 (0.0%) |
Income Below Poverty Among Single-Parent Households in Belfry
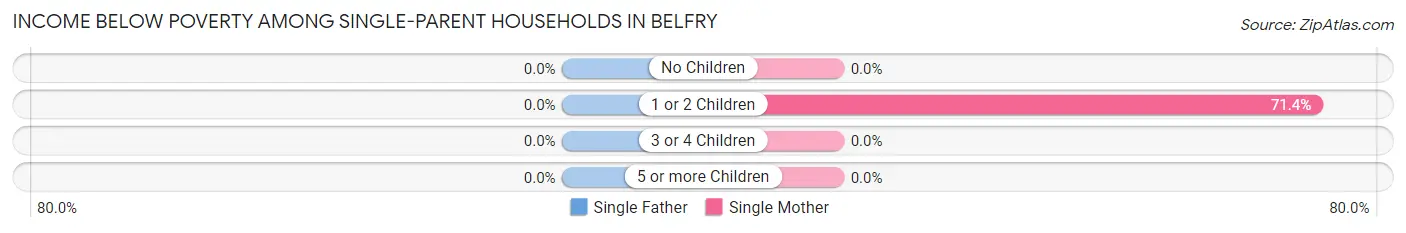
| Children | Single Father | Single Mother |
| No Children | 0 (0.0%) | 0 (0.0%) |
| 1 or 2 Children | 0 (0.0%) | 5 (71.4%) |
| 3 or 4 Children | 0 (0.0%) | 0 (0.0%) |
| 5 or more Children | 0 (0.0%) | 0 (0.0%) |
| Total | 0 (0.0%) | 5 (35.7%) |
Income Below Poverty Among Married-Couple vs Single-Parent Households in Belfry
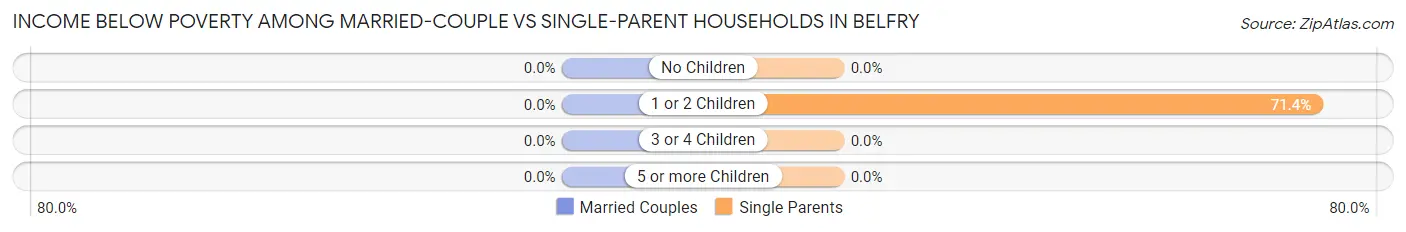
| Children | Married-Couple Families | Single-Parent Households |
| No Children | 0 (0.0%) | 0 (0.0%) |
| 1 or 2 Children | 0 (0.0%) | 5 (71.4%) |
| 3 or 4 Children | 0 (0.0%) | 0 (0.0%) |
| 5 or more Children | 0 (0.0%) | 0 (0.0%) |
| Total | 0 (0.0%) | 5 (35.7%) |
Race in Belfry
The most populous races in Belfry are White / Caucasian (167 | 93.8%), Hispanic or Latino (32 | 18.0%), and Two or more Races (8 | 4.5%).
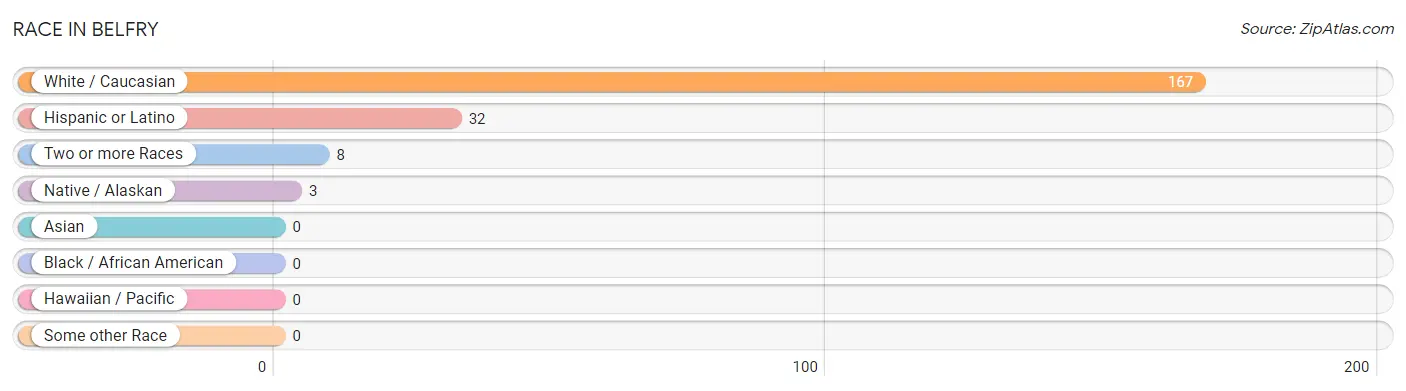
| Race | # Population | % Population |
| Asian | 0 | 0.0% |
| Black / African American | 0 | 0.0% |
| Hawaiian / Pacific | 0 | 0.0% |
| Hispanic or Latino | 32 | 18.0% |
| Native / Alaskan | 3 | 1.7% |
| White / Caucasian | 167 | 93.8% |
| Two or more Races | 8 | 4.5% |
| Some other Race | 0 | 0.0% |
| Total | 178 | 100.0% |
Ancestry in Belfry
The most populous ancestries reported in Belfry are German (49 | 27.5%), Mexican (32 | 18.0%), English (20 | 11.2%), Scandinavian (11 | 6.2%), and Croatian (8 | 4.5%), together accounting for 67.4% of all Belfry residents.
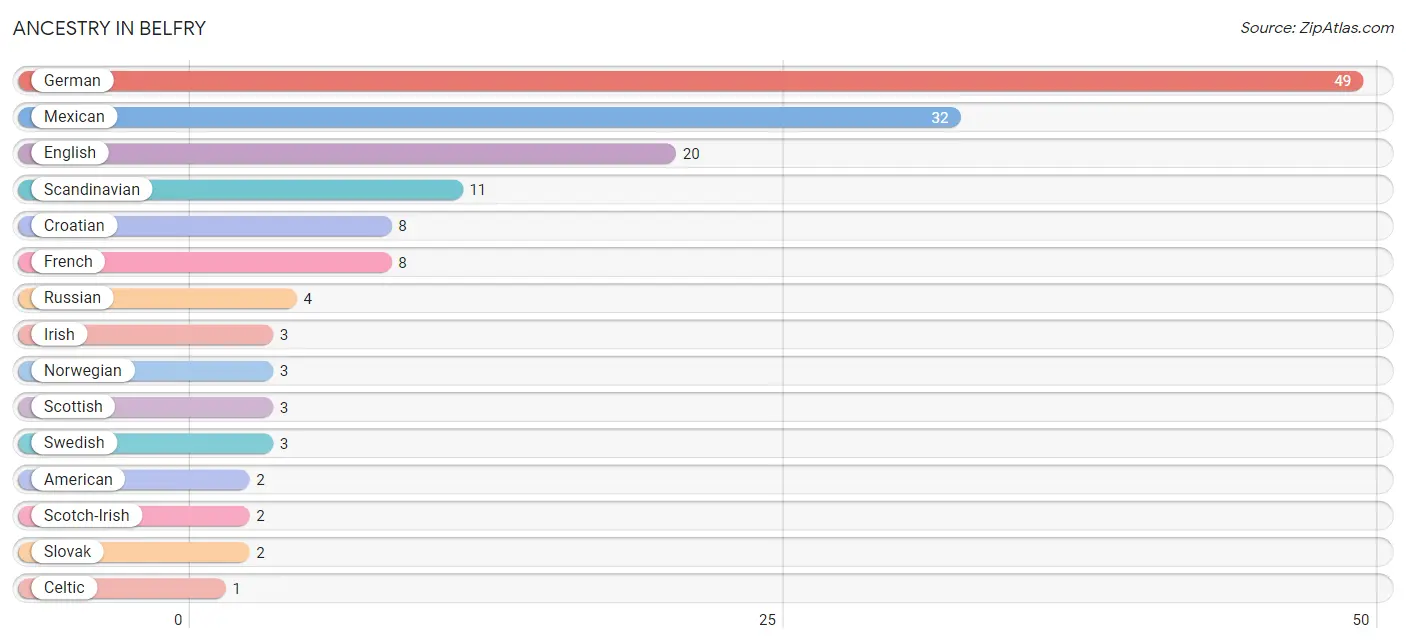
| Ancestry | # Population | % Population |
| American | 2 | 1.1% |
| Celtic | 1 | 0.6% |
| Croatian | 8 | 4.5% |
| English | 20 | 11.2% |
| French | 8 | 4.5% |
| German | 49 | 27.5% |
| Irish | 3 | 1.7% |
| Mexican | 32 | 18.0% |
| Norwegian | 3 | 1.7% |
| Russian | 4 | 2.2% |
| Scandinavian | 11 | 6.2% |
| Scotch-Irish | 2 | 1.1% |
| Scottish | 3 | 1.7% |
| Slovak | 2 | 1.1% |
| Swedish | 3 | 1.7% | View All 15 Rows |
Immigrants in Belfry

| Immigration Origin | # Population | % Population | View All 0 Rows |
Sex and Age in Belfry
Sex and Age in Belfry
The most populous age groups in Belfry are 25 to 29 Years (15 | 17.1%) for men and 25 to 29 Years (17 | 18.9%) for women.
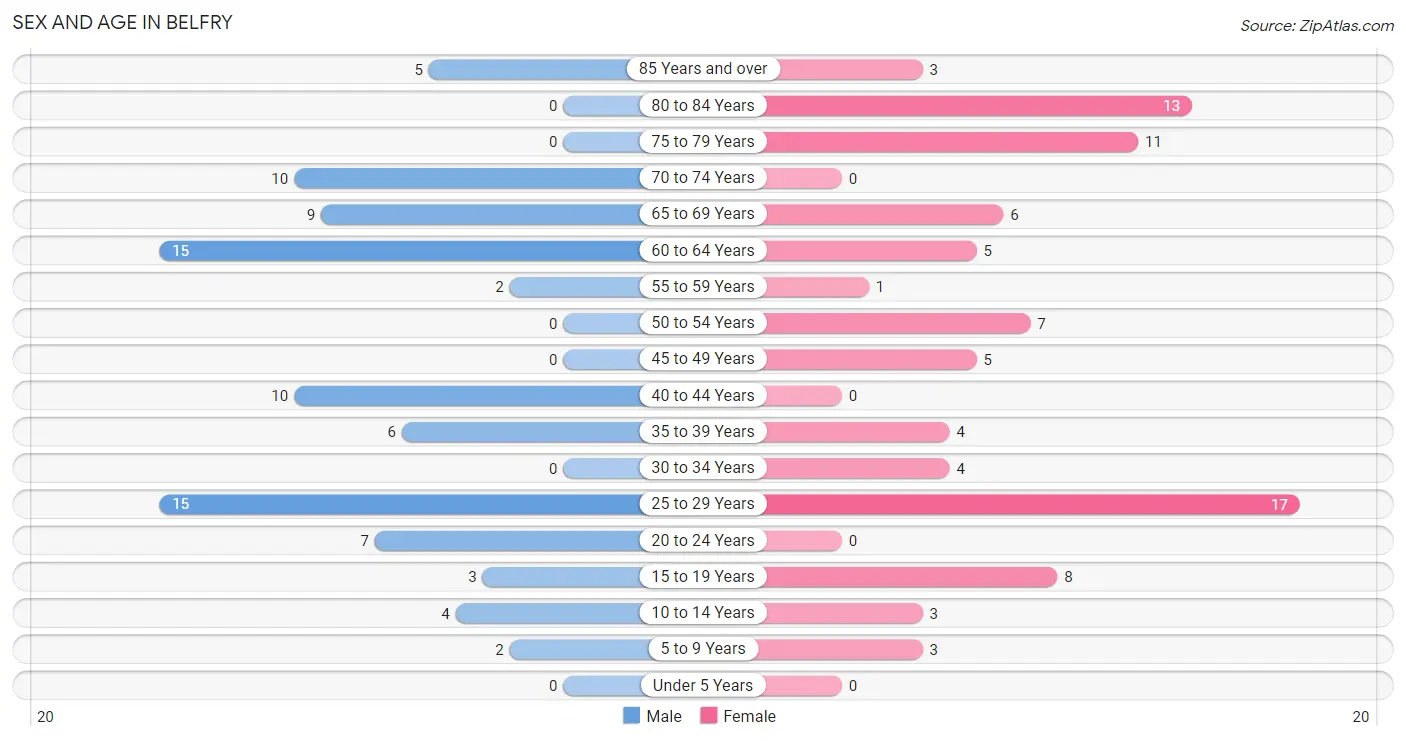
| Age Bracket | Male | Female |
| Under 5 Years | 0 (0.0%) | 0 (0.0%) |
| 5 to 9 Years | 2 (2.3%) | 3 (3.3%) |
| 10 to 14 Years | 4 (4.5%) | 3 (3.3%) |
| 15 to 19 Years | 3 (3.4%) | 8 (8.9%) |
| 20 to 24 Years | 7 (8.0%) | 0 (0.0%) |
| 25 to 29 Years | 15 (17.1%) | 17 (18.9%) |
| 30 to 34 Years | 0 (0.0%) | 4 (4.4%) |
| 35 to 39 Years | 6 (6.8%) | 4 (4.4%) |
| 40 to 44 Years | 10 (11.4%) | 0 (0.0%) |
| 45 to 49 Years | 0 (0.0%) | 5 (5.6%) |
| 50 to 54 Years | 0 (0.0%) | 7 (7.8%) |
| 55 to 59 Years | 2 (2.3%) | 1 (1.1%) |
| 60 to 64 Years | 15 (17.1%) | 5 (5.6%) |
| 65 to 69 Years | 9 (10.2%) | 6 (6.7%) |
| 70 to 74 Years | 10 (11.4%) | 0 (0.0%) |
| 75 to 79 Years | 0 (0.0%) | 11 (12.2%) |
| 80 to 84 Years | 0 (0.0%) | 13 (14.4%) |
| 85 Years and over | 5 (5.7%) | 3 (3.3%) |
| Total | 88 (100.0%) | 90 (100.0%) |
Families and Households in Belfry
Median Family Size in Belfry
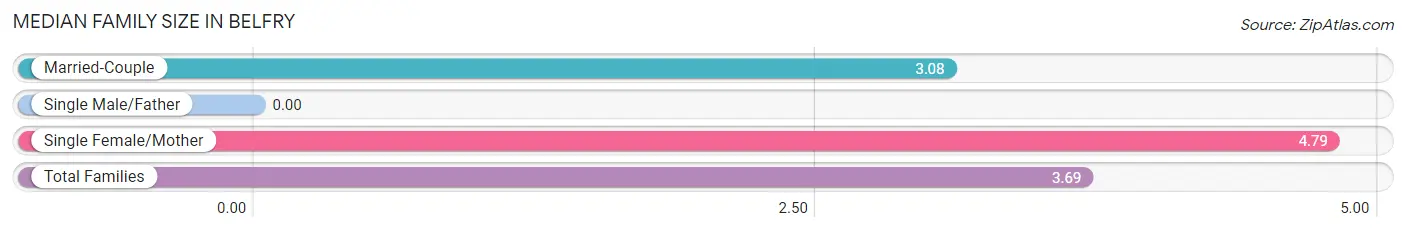
| Family Type | # Families | Family Size |
| Married-Couple | 25 (64.1%) | 3.08 |
| Single Male/Father | 0 (0.0%) | - |
| Single Female/Mother | 14 (35.9%) | 4.79 |
| Total Families | 39 (100.0%) | 3.69 |
Median Household Size in Belfry
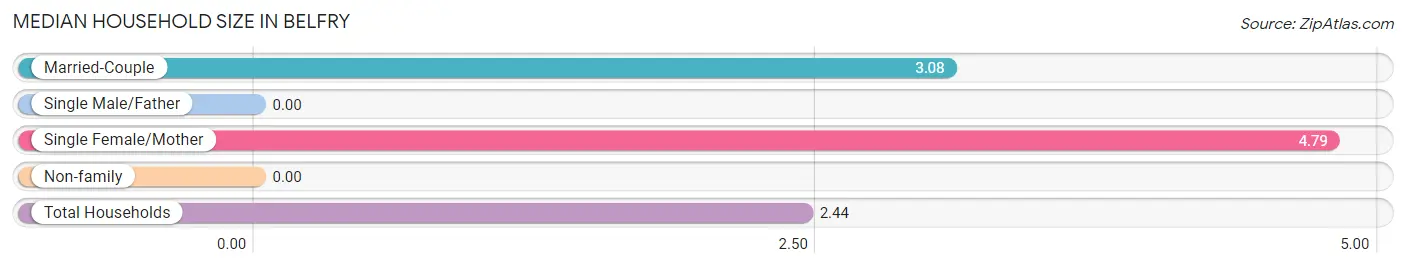
| Household Type | # Households | Household Size |
| Married-Couple | 25 (34.3%) | 3.08 |
| Single Male/Father | 0 (0.0%) | - |
| Single Female/Mother | 14 (19.2%) | 4.79 |
| Non-family | 34 (46.6%) | - |
| Total Households | 73 (100.0%) | 2.44 |
Household Size by Marriage Status in Belfry
Out of a total of 73 households in Belfry, 39 (53.4%) are family households, while 34 (46.6%) are nonfamily households. The most numerous type of family households are 2-person households, comprising 15, and the most common type of nonfamily households are 1-person households, comprising 34.
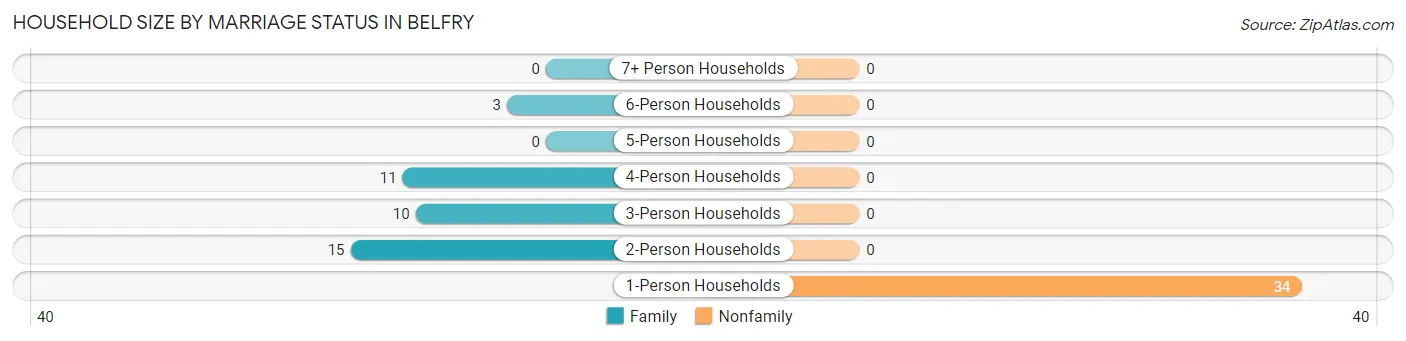
| Household Size | Family Households | Nonfamily Households |
| 1-Person Households | - | 34 (46.6%) |
| 2-Person Households | 15 (20.5%) | 0 (0.0%) |
| 3-Person Households | 10 (13.7%) | 0 (0.0%) |
| 4-Person Households | 11 (15.1%) | 0 (0.0%) |
| 5-Person Households | 0 (0.0%) | 0 (0.0%) |
| 6-Person Households | 3 (4.1%) | 0 (0.0%) |
| 7+ Person Households | 0 (0.0%) | 0 (0.0%) |
| Total | 39 (53.4%) | 34 (46.6%) |
Female Fertility in Belfry
Fertility by Age in Belfry
| Age Bracket | Women with Births | Births / 1,000 Women |
| 15 to 19 years | 0 (0.0%) | 0.0 |
| 20 to 34 years | 0 (0.0%) | 0.0 |
| 35 to 50 years | 0 (0.0%) | 0.0 |
| Total | 0 (0.0%) | 0.0 |
Fertility by Age by Marriage Status in Belfry
| Age Bracket | Married | Unmarried |
| 15 to 19 years | 0 (0.0%) | 0 (0.0%) |
| 20 to 34 years | 0 (0.0%) | 0 (0.0%) |
| 35 to 50 years | 0 (0.0%) | 0 (0.0%) |
| Total | 0 (0.0%) | 0 (0.0%) |
Fertility by Education in Belfry
| Educational Attainment | Women with Births | Births / 1,000 Women |
| Less than High School | 0 (0.0%) | 0.0 |
| High School Diploma | 0 (0.0%) | 0.0 |
| College or Associate's Degree | 0 (0.0%) | 0.0 |
| Bachelor's Degree | 0 (0.0%) | 0.0 |
| Graduate Degree | 0 (0.0%) | 0.0 |
| Total | 0 (0.0%) | 0.0 |
Fertility by Education by Marriage Status in Belfry
| Educational Attainment | Married | Unmarried |
| Less than High School | 0 (0.0%) | 0 (0.0%) |
| High School Diploma | 0 (0.0%) | 0 (0.0%) |
| College or Associate's Degree | 0 (0.0%) | 0 (0.0%) |
| Bachelor's Degree | 0 (0.0%) | 0 (0.0%) |
| Graduate Degree | 0 (0.0%) | 0 (0.0%) |
| Total | 0 (0.0%) | 0 (0.0%) |
Employment Characteristics in Belfry
Employment by Class of Employer in Belfry
Among the 78 employed individuals in Belfry, private company employees (22 | 28.2%), self-employed (not incorporated) (20 | 25.6%), and federal government employees (15 | 19.2%) make up the most common classes of employment.
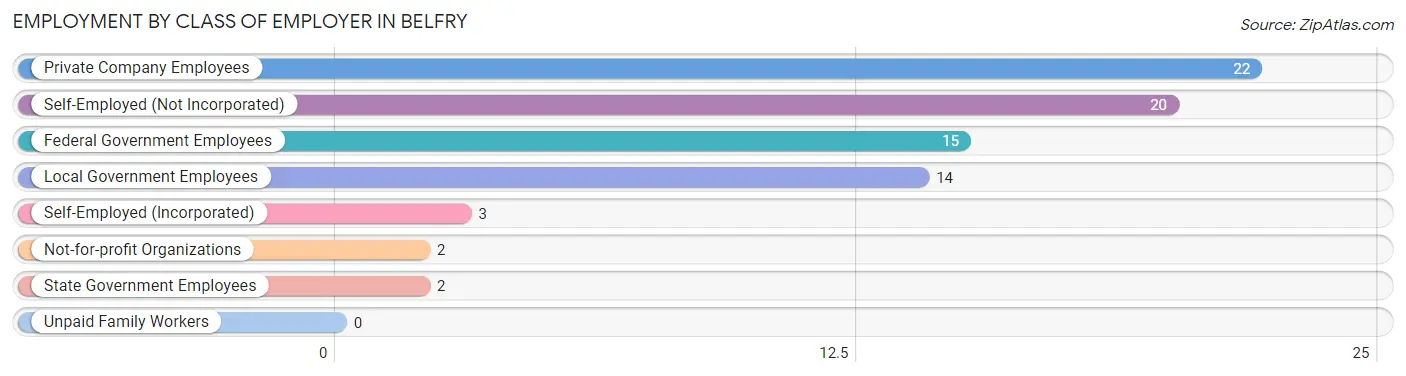
| Employer Class | # Employees | % Employees |
| Private Company Employees | 22 | 28.2% |
| Self-Employed (Incorporated) | 3 | 3.8% |
| Self-Employed (Not Incorporated) | 20 | 25.6% |
| Not-for-profit Organizations | 2 | 2.6% |
| Local Government Employees | 14 | 17.9% |
| State Government Employees | 2 | 2.6% |
| Federal Government Employees | 15 | 19.2% |
| Unpaid Family Workers | 0 | 0.0% |
| Total | 78 | 100.0% |
Employment Status by Age in Belfry
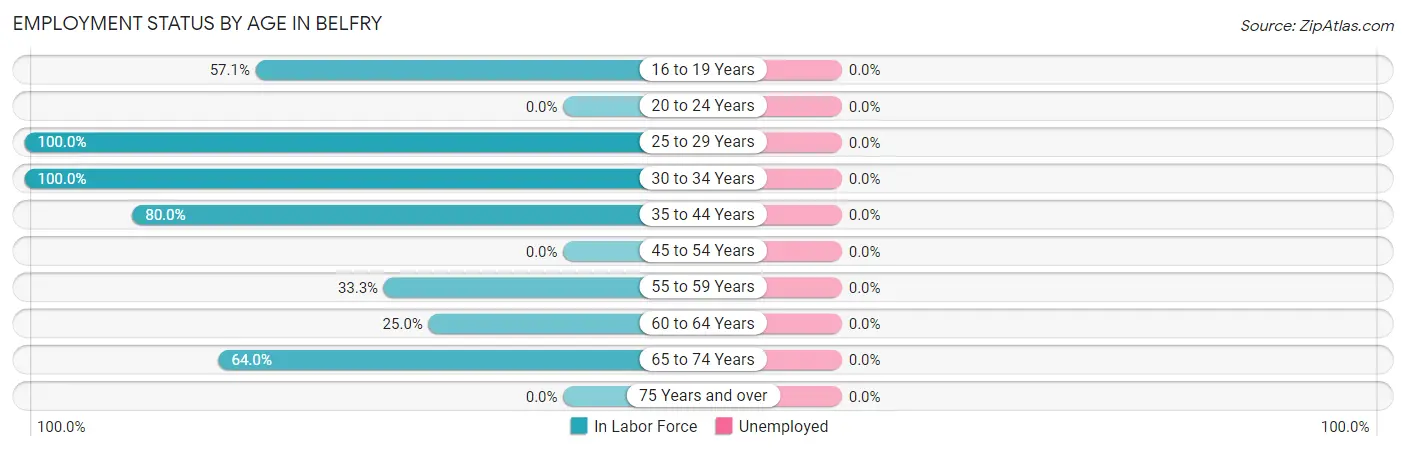
| Age Bracket | In Labor Force | Unemployed |
| 16 to 19 Years | 4 (57.1%) | 0 (0.0%) |
| 20 to 24 Years | 0 (0.0%) | 0 (0.0%) |
| 25 to 29 Years | 32 (100.0%) | 0 (0.0%) |
| 30 to 34 Years | 4 (100.0%) | 0 (0.0%) |
| 35 to 44 Years | 16 (80.0%) | 0 (0.0%) |
| 45 to 54 Years | 0 (0.0%) | 0 (0.0%) |
| 55 to 59 Years | 1 (33.3%) | 0 (0.0%) |
| 60 to 64 Years | 5 (25.0%) | 0 (0.0%) |
| 65 to 74 Years | 16 (64.0%) | 0 (0.0%) |
| 75 Years and over | 0 (0.0%) | 0 (0.0%) |
| Total | 78 (48.1%) | 0 (0.0%) |
Employment Status by Educational Attainment in Belfry
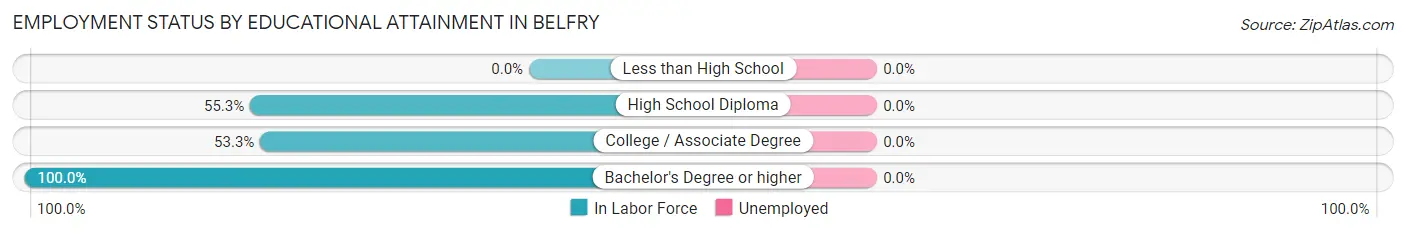
| Educational Attainment | In Labor Force | Unemployed |
| Less than High School | 0 (0.0%) | 0 (0.0%) |
| High School Diploma | 26 (55.3%) | 0 (0.0%) |
| College / Associate Degree | 8 (53.3%) | 0 (0.0%) |
| Bachelor's Degree or higher | 24 (100.0%) | 0 (0.0%) |
| Total | 58 (63.7%) | 0 (0.0%) |
Employment Occupations by Sex in Belfry
Management, Business, Science and Arts Occupations
The most common Management, Business, Science and Arts occupations in Belfry are Business & Financial (15 | 19.2%), Management (9 | 11.5%), Community & Social Service (6 | 7.7%), Education Instruction & Library (6 | 7.7%), and Computers, Engineering & Science (2 | 2.6%).
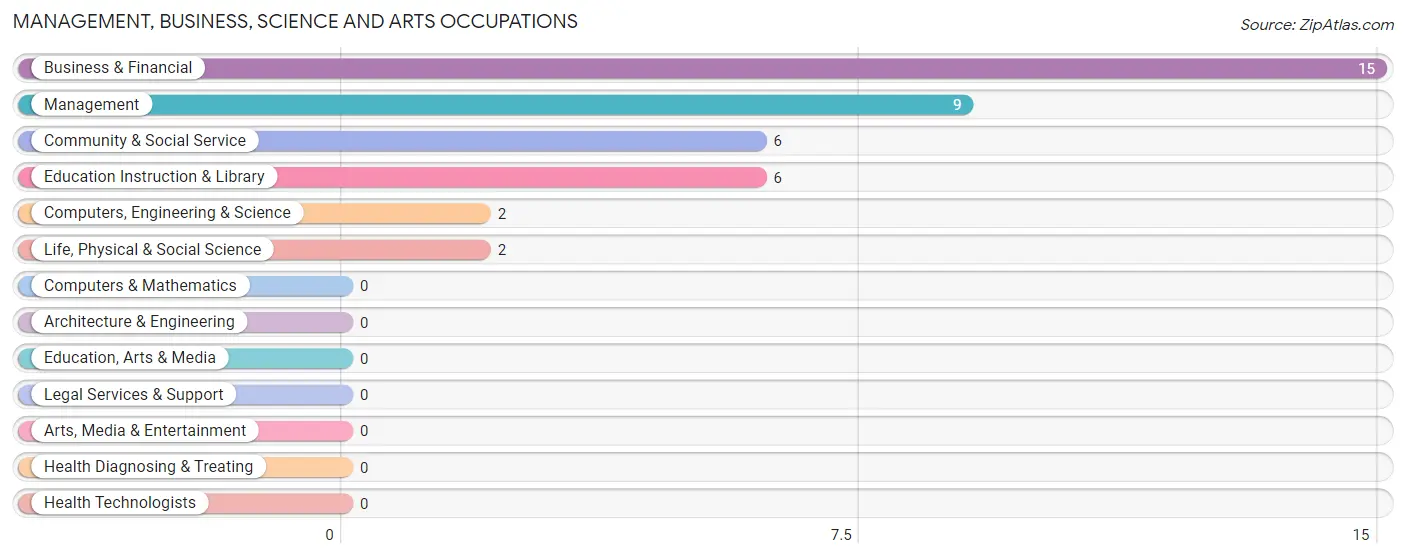
Management, Business, Science and Arts Occupations by Sex
Within the Management, Business, Science and Arts occupations in Belfry, the most male-oriented occupations are Management (100.0%), Business & Financial (100.0%), and Computers, Engineering & Science (100.0%), while the most female-oriented occupations are Community & Social Service (100.0%), and Education Instruction & Library (100.0%).
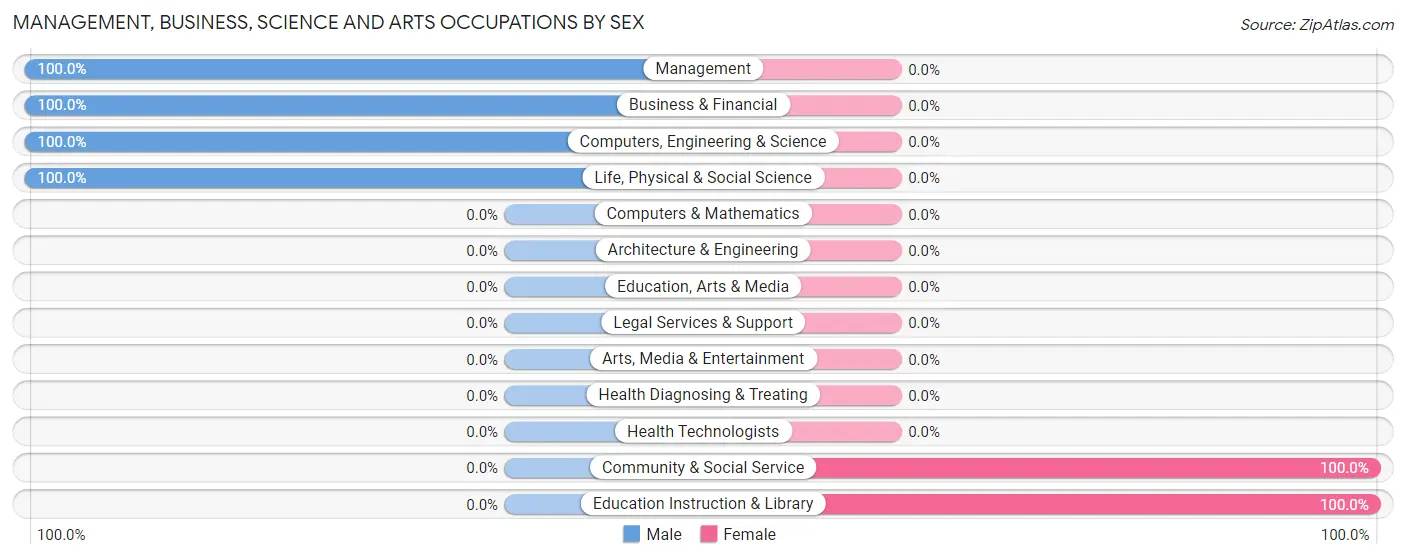
| Occupation | Male | Female |
| Management | 9 (100.0%) | 0 (0.0%) |
| Business & Financial | 15 (100.0%) | 0 (0.0%) |
| Computers, Engineering & Science | 2 (100.0%) | 0 (0.0%) |
| Computers & Mathematics | 0 (0.0%) | 0 (0.0%) |
| Architecture & Engineering | 0 (0.0%) | 0 (0.0%) |
| Life, Physical & Social Science | 2 (100.0%) | 0 (0.0%) |
| Community & Social Service | 0 (0.0%) | 6 (100.0%) |
| Education, Arts & Media | 0 (0.0%) | 0 (0.0%) |
| Legal Services & Support | 0 (0.0%) | 0 (0.0%) |
| Education Instruction & Library | 0 (0.0%) | 6 (100.0%) |
| Arts, Media & Entertainment | 0 (0.0%) | 0 (0.0%) |
| Health Diagnosing & Treating | 0 (0.0%) | 0 (0.0%) |
| Health Technologists | 0 (0.0%) | 0 (0.0%) |
| Total (Category) | 26 (81.2%) | 6 (18.8%) |
| Total (Overall) | 46 (59.0%) | 32 (41.0%) |
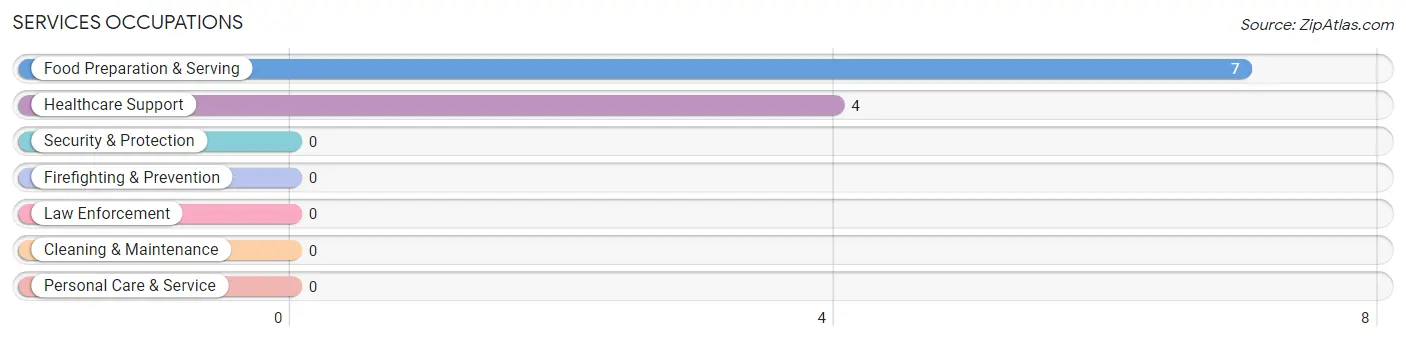
Services Occupations
The most common Services occupations in Belfry are Food Preparation & Serving (7 | 9.0%), and Healthcare Support (4 | 5.1%).
Services Occupations by Sex
Within the Services occupations in Belfry, the most male-oriented occupations are Healthcare Support (50.0%), and Food Preparation & Serving (42.9%), while the most female-oriented occupations are Food Preparation & Serving (57.1%), and Healthcare Support (50.0%).
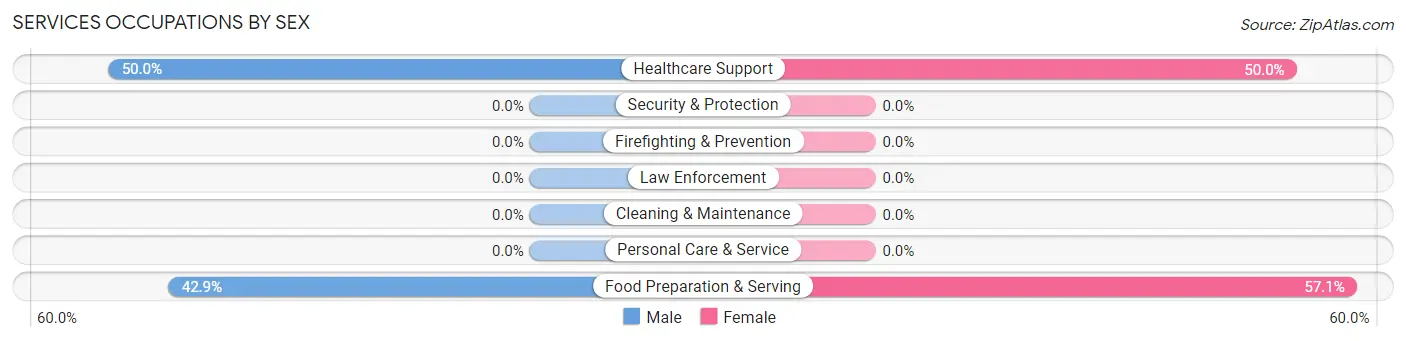
| Occupation | Male | Female |
| Healthcare Support | 2 (50.0%) | 2 (50.0%) |
| Security & Protection | 0 (0.0%) | 0 (0.0%) |
| Firefighting & Prevention | 0 (0.0%) | 0 (0.0%) |
| Law Enforcement | 0 (0.0%) | 0 (0.0%) |
| Food Preparation & Serving | 3 (42.9%) | 4 (57.1%) |
| Cleaning & Maintenance | 0 (0.0%) | 0 (0.0%) |
| Personal Care & Service | 0 (0.0%) | 0 (0.0%) |
| Total (Category) | 5 (45.5%) | 6 (54.5%) |
| Total (Overall) | 46 (59.0%) | 32 (41.0%) |
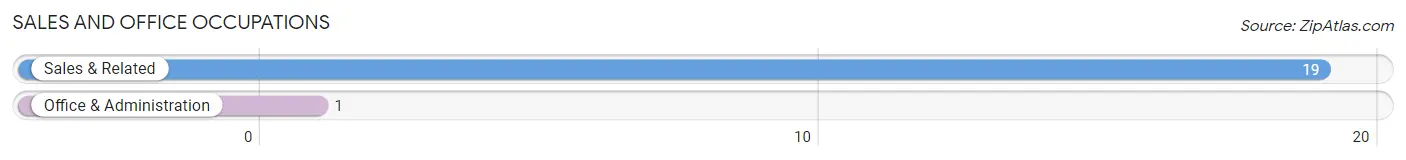
Sales and Office Occupations
The most common Sales and Office occupations in Belfry are Sales & Related (19 | 24.4%), and Office & Administration (1 | 1.3%).
Sales and Office Occupations by Sex

| Occupation | Male | Female |
| Sales & Related | 0 (0.0%) | 19 (100.0%) |
| Office & Administration | 0 (0.0%) | 1 (100.0%) |
| Total (Category) | 0 (0.0%) | 20 (100.0%) |
| Total (Overall) | 46 (59.0%) | 32 (41.0%) |
Natural Resources, Construction and Maintenance Occupations
The most common Natural Resources, Construction and Maintenance occupations in Belfry are , and Farming, Fishing & Forestry (2 | 2.6%).
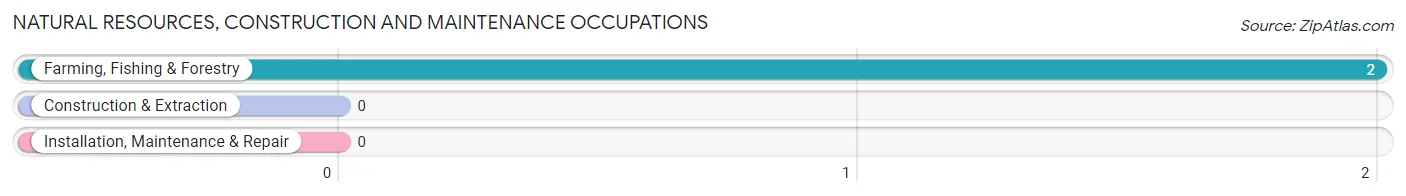
Natural Resources, Construction and Maintenance Occupations by Sex
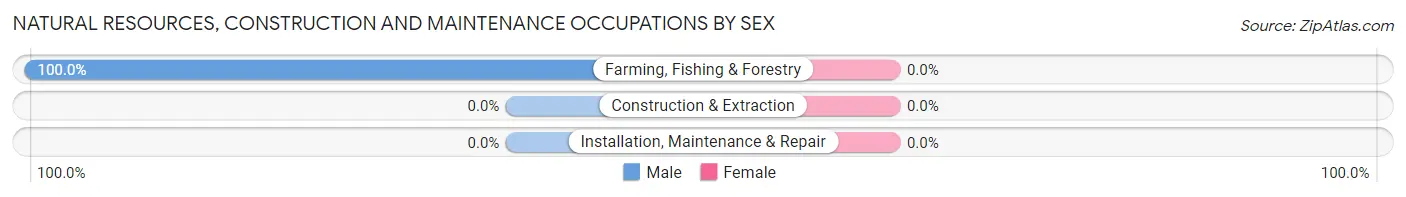
| Occupation | Male | Female |
| Farming, Fishing & Forestry | 2 (100.0%) | 0 (0.0%) |
| Construction & Extraction | 0 (0.0%) | 0 (0.0%) |
| Installation, Maintenance & Repair | 0 (0.0%) | 0 (0.0%) |
| Total (Category) | 2 (100.0%) | 0 (0.0%) |
| Total (Overall) | 46 (59.0%) | 32 (41.0%) |
Production, Transportation and Moving Occupations
The most common Production, Transportation and Moving occupations in Belfry are Transportation (8 | 10.3%), and Production (5 | 6.4%).
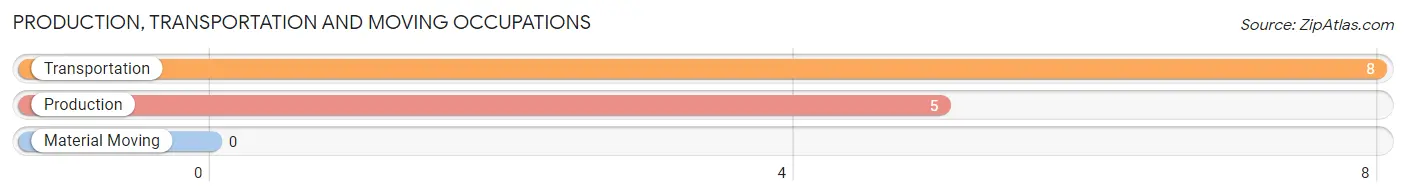
Production, Transportation and Moving Occupations by Sex
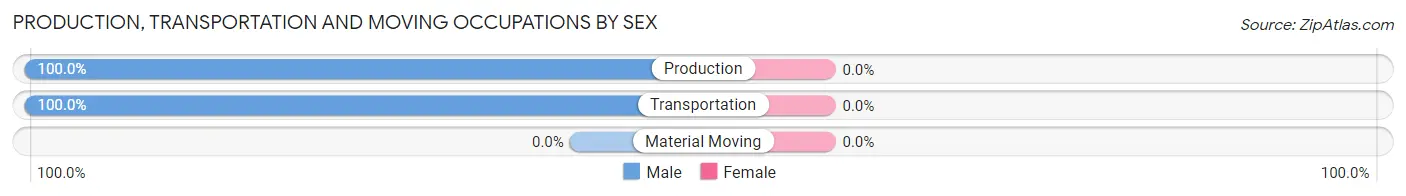
| Occupation | Male | Female |
| Production | 5 (100.0%) | 0 (0.0%) |
| Transportation | 8 (100.0%) | 0 (0.0%) |
| Material Moving | 0 (0.0%) | 0 (0.0%) |
| Total (Category) | 13 (100.0%) | 0 (0.0%) |
| Total (Overall) | 46 (59.0%) | 32 (41.0%) |
Employment Industries by Sex in Belfry
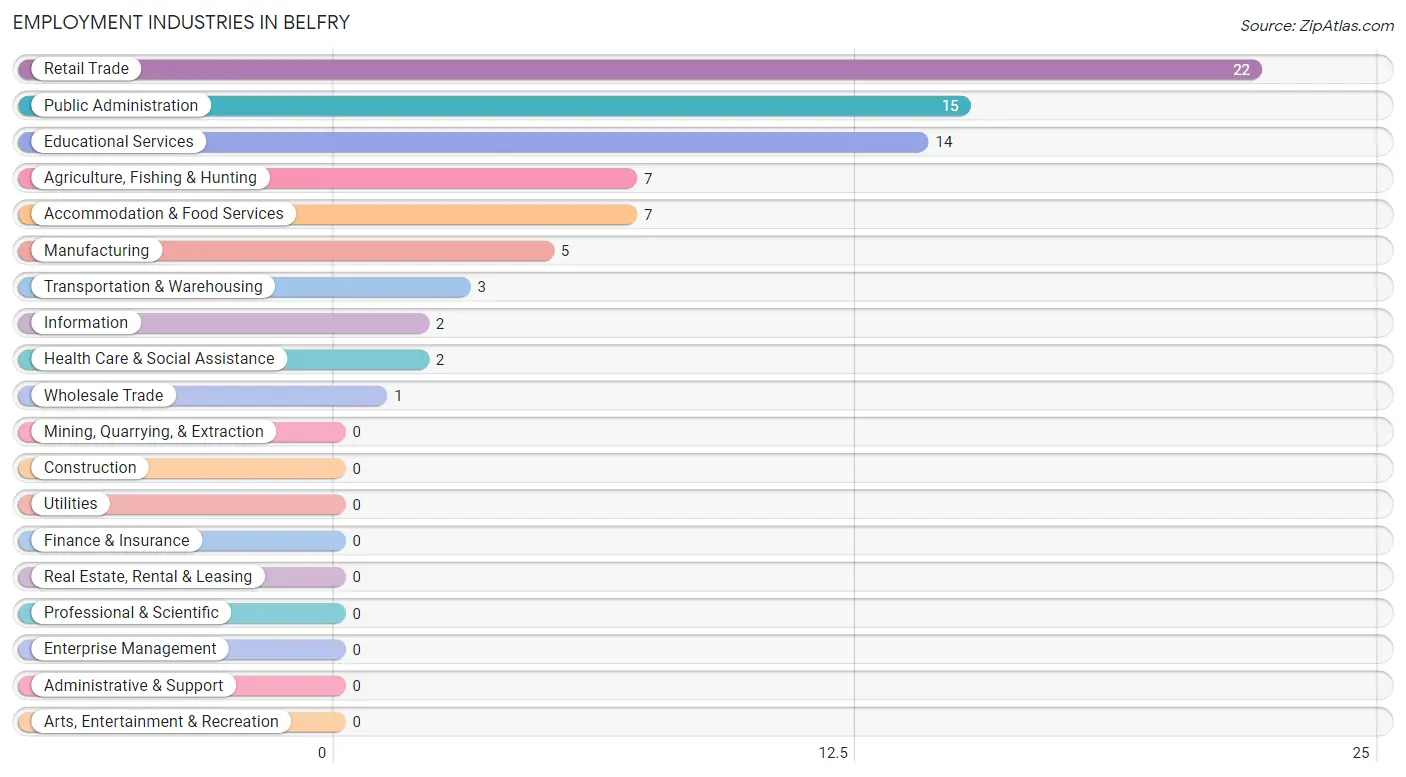
Employment Industries in Belfry
The major employment industries in Belfry include Retail Trade (22 | 28.2%), Public Administration (15 | 19.2%), Educational Services (14 | 17.9%), Agriculture, Fishing & Hunting (7 | 9.0%), and Accommodation & Food Services (7 | 9.0%).
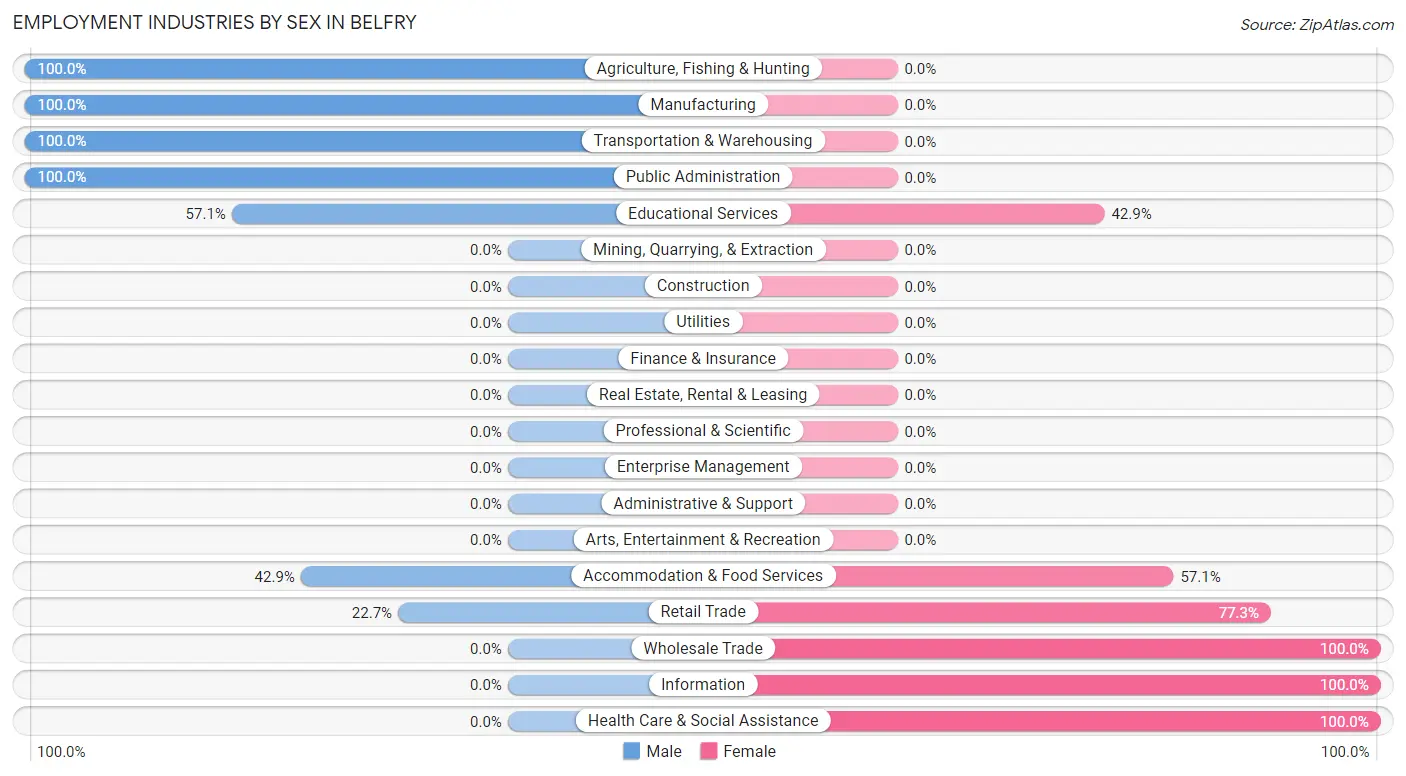
Employment Industries by Sex in Belfry
The Belfry industries that see more men than women are Agriculture, Fishing & Hunting (100.0%), Manufacturing (100.0%), and Transportation & Warehousing (100.0%), whereas the industries that tend to have a higher number of women are Wholesale Trade (100.0%), Information (100.0%), and Health Care & Social Assistance (100.0%).
| Industry | Male | Female |
| Agriculture, Fishing & Hunting | 7 (100.0%) | 0 (0.0%) |
| Mining, Quarrying, & Extraction | 0 (0.0%) | 0 (0.0%) |
| Construction | 0 (0.0%) | 0 (0.0%) |
| Manufacturing | 5 (100.0%) | 0 (0.0%) |
| Wholesale Trade | 0 (0.0%) | 1 (100.0%) |
| Retail Trade | 5 (22.7%) | 17 (77.3%) |
| Transportation & Warehousing | 3 (100.0%) | 0 (0.0%) |
| Utilities | 0 (0.0%) | 0 (0.0%) |
| Information | 0 (0.0%) | 2 (100.0%) |
| Finance & Insurance | 0 (0.0%) | 0 (0.0%) |
| Real Estate, Rental & Leasing | 0 (0.0%) | 0 (0.0%) |
| Professional & Scientific | 0 (0.0%) | 0 (0.0%) |
| Enterprise Management | 0 (0.0%) | 0 (0.0%) |
| Administrative & Support | 0 (0.0%) | 0 (0.0%) |
| Educational Services | 8 (57.1%) | 6 (42.9%) |
| Health Care & Social Assistance | 0 (0.0%) | 2 (100.0%) |
| Arts, Entertainment & Recreation | 0 (0.0%) | 0 (0.0%) |
| Accommodation & Food Services | 3 (42.9%) | 4 (57.1%) |
| Public Administration | 15 (100.0%) | 0 (0.0%) |
| Total | 46 (59.0%) | 32 (41.0%) |
Education in Belfry
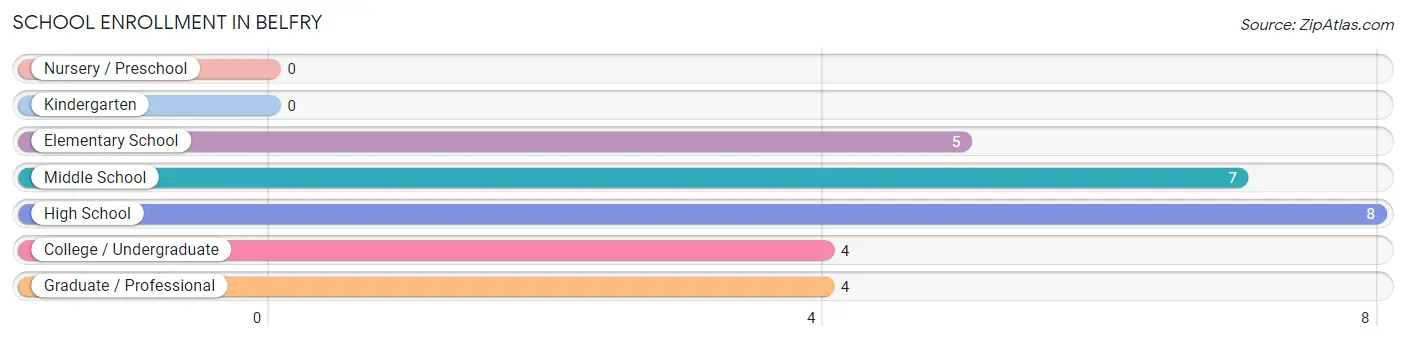
School Enrollment in Belfry
The most common levels of schooling among the 28 students in Belfry are high school (8 | 28.6%), middle school (7 | 25.0%), and elementary school (5 | 17.9%).
| School Level | # Students | % Students |
| Nursery / Preschool | 0 | 0.0% |
| Kindergarten | 0 | 0.0% |
| Elementary School | 5 | 17.9% |
| Middle School | 7 | 25.0% |
| High School | 8 | 28.6% |
| College / Undergraduate | 4 | 14.3% |
| Graduate / Professional | 4 | 14.3% |
| Total | 28 | 100.0% |
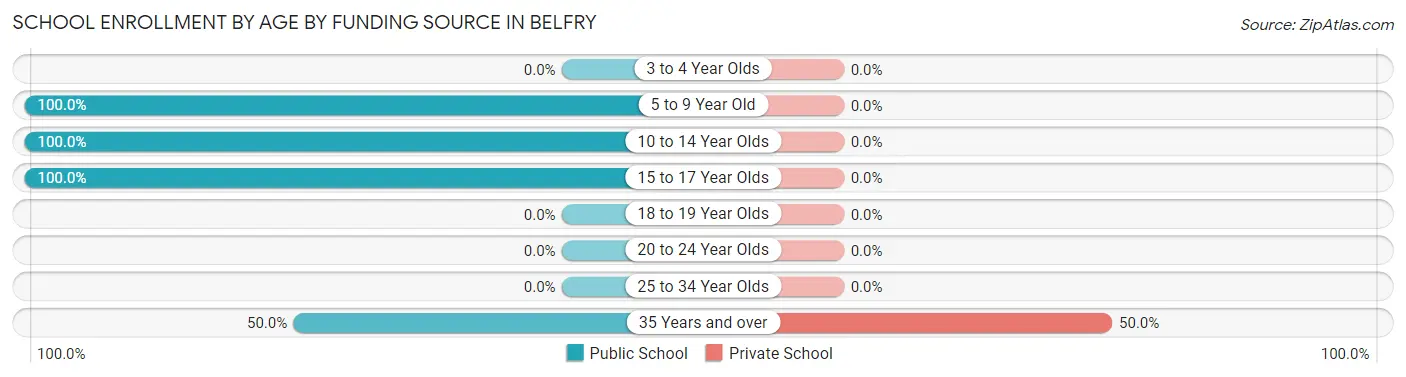
School Enrollment by Age by Funding Source in Belfry
Out of a total of 28 students who are enrolled in schools in Belfry, 4 (14.3%) attend a private institution, while the remaining 24 (85.7%) are enrolled in public schools. The age group of 35 years and over has the highest likelihood of being enrolled in private schools, with 4 (50.0% in the age bracket) enrolled. Conversely, the age group of 5 to 9 year old has the lowest likelihood of being enrolled in a private school, with 5 (100.0% in the age bracket) attending a public institution.
| Age Bracket | Public School | Private School |
| 3 to 4 Year Olds | 0 (0.0%) | 0 (0.0%) |
| 5 to 9 Year Old | 5 (100.0%) | 0 (0.0%) |
| 10 to 14 Year Olds | 7 (100.0%) | 0 (0.0%) |
| 15 to 17 Year Olds | 8 (100.0%) | 0 (0.0%) |
| 18 to 19 Year Olds | 0 (0.0%) | 0 (0.0%) |
| 20 to 24 Year Olds | 0 (0.0%) | 0 (0.0%) |
| 25 to 34 Year Olds | 0 (0.0%) | 0 (0.0%) |
| 35 Years and over | 4 (50.0%) | 4 (50.0%) |
| Total | 24 (85.7%) | 4 (14.3%) |
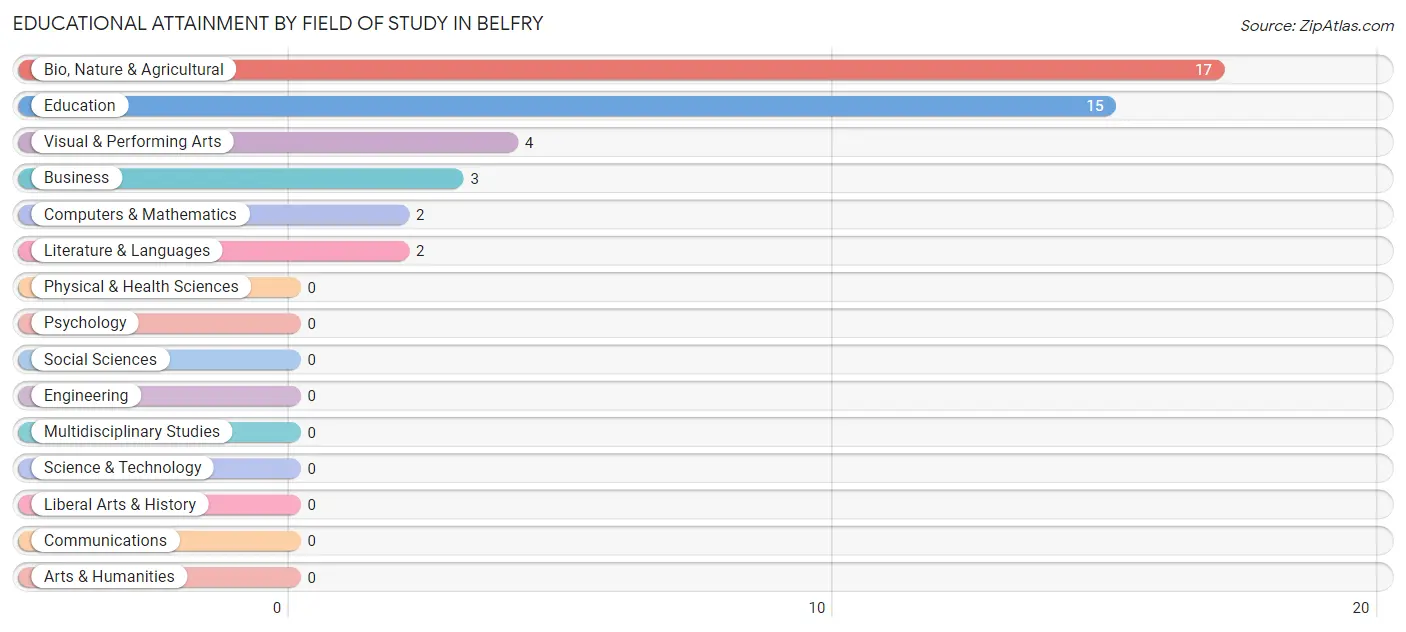
Educational Attainment by Field of Study in Belfry
Bio, nature & agricultural (17 | 39.5%), education (15 | 34.9%), visual & performing arts (4 | 9.3%), business (3 | 7.0%), and computers & mathematics (2 | 4.6%) are the most common fields of study among 43 individuals in Belfry who have obtained a bachelor's degree or higher.
| Field of Study | # Graduates | % Graduates |
| Computers & Mathematics | 2 | 4.6% |
| Bio, Nature & Agricultural | 17 | 39.5% |
| Physical & Health Sciences | 0 | 0.0% |
| Psychology | 0 | 0.0% |
| Social Sciences | 0 | 0.0% |
| Engineering | 0 | 0.0% |
| Multidisciplinary Studies | 0 | 0.0% |
| Science & Technology | 0 | 0.0% |
| Business | 3 | 7.0% |
| Education | 15 | 34.9% |
| Literature & Languages | 2 | 4.6% |
| Liberal Arts & History | 0 | 0.0% |
| Visual & Performing Arts | 4 | 9.3% |
| Communications | 0 | 0.0% |
| Arts & Humanities | 0 | 0.0% |
| Total | 43 | 100.0% |
Transportation & Commute in Belfry
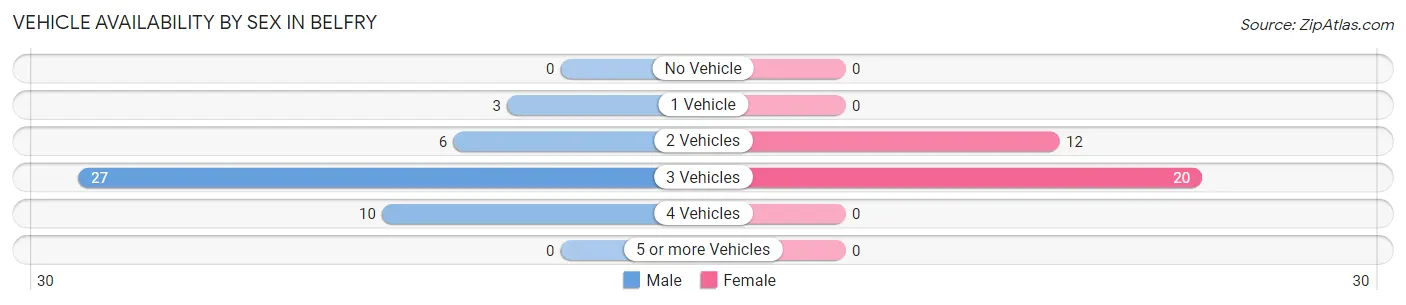
Vehicle Availability by Sex in Belfry
The most prevalent vehicle ownership categories in Belfry are males with 3 vehicles (27, accounting for 58.7%) and females with 3 vehicles (20, making up 84.4%).
| Vehicles Available | Male | Female |
| No Vehicle | 0 (0.0%) | 0 (0.0%) |
| 1 Vehicle | 3 (6.5%) | 0 (0.0%) |
| 2 Vehicles | 6 (13.0%) | 12 (37.5%) |
| 3 Vehicles | 27 (58.7%) | 20 (62.5%) |
| 4 Vehicles | 10 (21.7%) | 0 (0.0%) |
| 5 or more Vehicles | 0 (0.0%) | 0 (0.0%) |
| Total | 46 (100.0%) | 32 (100.0%) |
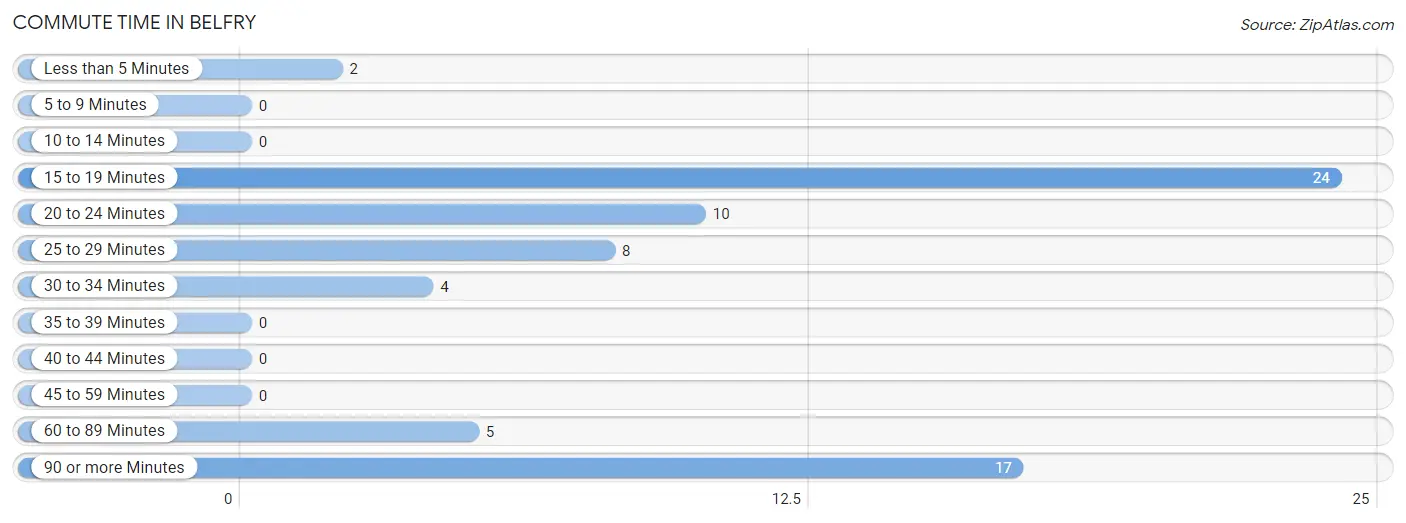
Commute Time in Belfry
The most frequently occuring commute durations in Belfry are 15 to 19 minutes (24 commuters, 34.3%), 90 or more minutes (17 commuters, 24.3%), and 20 to 24 minutes (10 commuters, 14.3%).
| Commute Time | # Commuters | % Commuters |
| Less than 5 Minutes | 2 | 2.9% |
| 5 to 9 Minutes | 0 | 0.0% |
| 10 to 14 Minutes | 0 | 0.0% |
| 15 to 19 Minutes | 24 | 34.3% |
| 20 to 24 Minutes | 10 | 14.3% |
| 25 to 29 Minutes | 8 | 11.4% |
| 30 to 34 Minutes | 4 | 5.7% |
| 35 to 39 Minutes | 0 | 0.0% |
| 40 to 44 Minutes | 0 | 0.0% |
| 45 to 59 Minutes | 0 | 0.0% |
| 60 to 89 Minutes | 5 | 7.1% |
| 90 or more Minutes | 17 | 24.3% |
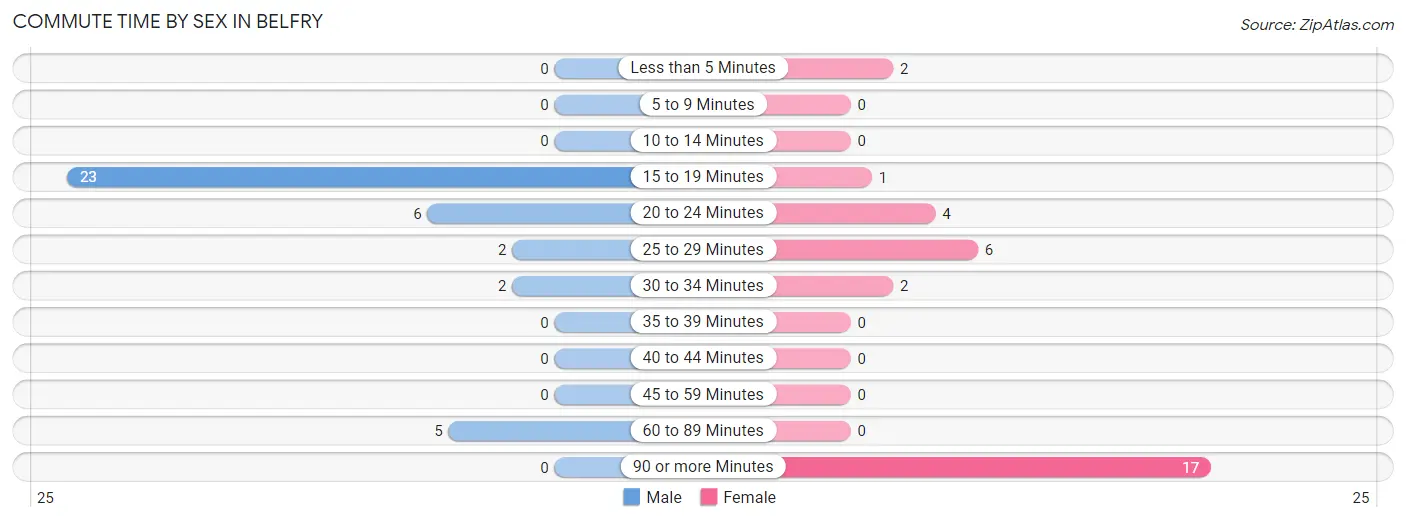
Commute Time by Sex in Belfry
The most common commute times in Belfry are 15 to 19 minutes (23 commuters, 60.5%) for males and 90 or more minutes (17 commuters, 53.1%) for females.
| Commute Time | Male | Female |
| Less than 5 Minutes | 0 (0.0%) | 2 (6.2%) |
| 5 to 9 Minutes | 0 (0.0%) | 0 (0.0%) |
| 10 to 14 Minutes | 0 (0.0%) | 0 (0.0%) |
| 15 to 19 Minutes | 23 (60.5%) | 1 (3.1%) |
| 20 to 24 Minutes | 6 (15.8%) | 4 (12.5%) |
| 25 to 29 Minutes | 2 (5.3%) | 6 (18.8%) |
| 30 to 34 Minutes | 2 (5.3%) | 2 (6.2%) |
| 35 to 39 Minutes | 0 (0.0%) | 0 (0.0%) |
| 40 to 44 Minutes | 0 (0.0%) | 0 (0.0%) |
| 45 to 59 Minutes | 0 (0.0%) | 0 (0.0%) |
| 60 to 89 Minutes | 5 (13.2%) | 0 (0.0%) |
| 90 or more Minutes | 0 (0.0%) | 17 (53.1%) |
Time of Departure to Work by Sex in Belfry
The most frequent times of departure to work in Belfry are 11:00 AM to 11:59 AM (15, 39.5%) for males and 4:00 PM to 11:59 PM (17, 53.1%) for females.
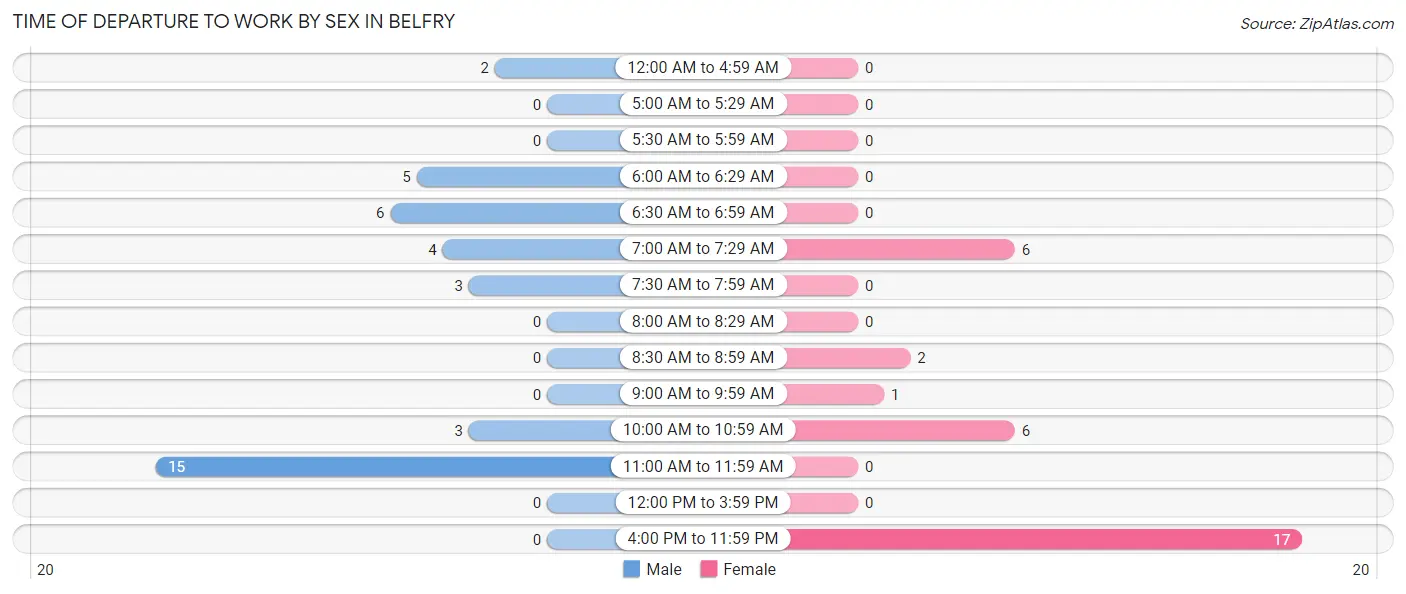
| Time of Departure | Male | Female |
| 12:00 AM to 4:59 AM | 2 (5.3%) | 0 (0.0%) |
| 5:00 AM to 5:29 AM | 0 (0.0%) | 0 (0.0%) |
| 5:30 AM to 5:59 AM | 0 (0.0%) | 0 (0.0%) |
| 6:00 AM to 6:29 AM | 5 (13.2%) | 0 (0.0%) |
| 6:30 AM to 6:59 AM | 6 (15.8%) | 0 (0.0%) |
| 7:00 AM to 7:29 AM | 4 (10.5%) | 6 (18.8%) |
| 7:30 AM to 7:59 AM | 3 (7.9%) | 0 (0.0%) |
| 8:00 AM to 8:29 AM | 0 (0.0%) | 0 (0.0%) |
| 8:30 AM to 8:59 AM | 0 (0.0%) | 2 (6.2%) |
| 9:00 AM to 9:59 AM | 0 (0.0%) | 1 (3.1%) |
| 10:00 AM to 10:59 AM | 3 (7.9%) | 6 (18.8%) |
| 11:00 AM to 11:59 AM | 15 (39.5%) | 0 (0.0%) |
| 12:00 PM to 3:59 PM | 0 (0.0%) | 0 (0.0%) |
| 4:00 PM to 11:59 PM | 0 (0.0%) | 17 (53.1%) |
| Total | 38 (100.0%) | 32 (100.0%) |
Housing Occupancy in Belfry
Occupancy by Ownership in Belfry
Of the total 73 dwellings in Belfry, owner-occupied units account for 54 (74.0%), while renter-occupied units make up 19 (26.0%).
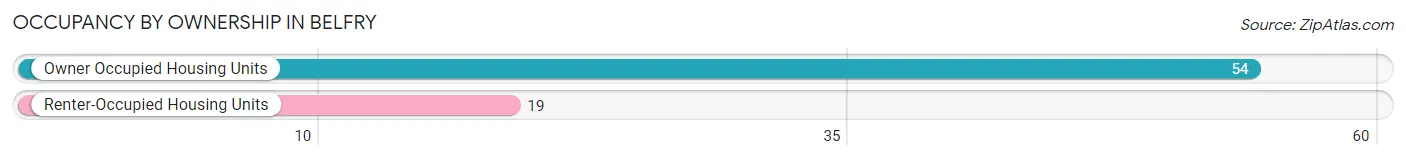
| Occupancy | # Housing Units | % Housing Units |
| Owner Occupied Housing Units | 54 | 74.0% |
| Renter-Occupied Housing Units | 19 | 26.0% |
| Total Occupied Housing Units | 73 | 100.0% |
Occupancy by Household Size in Belfry
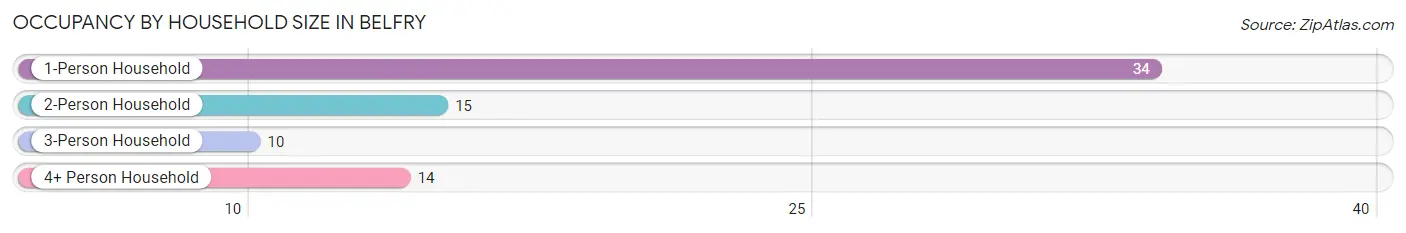
| Household Size | # Housing Units | % Housing Units |
| 1-Person Household | 34 | 46.6% |
| 2-Person Household | 15 | 20.5% |
| 3-Person Household | 10 | 13.7% |
| 4+ Person Household | 14 | 19.2% |
| Total Housing Units | 73 | 100.0% |
Occupancy by Ownership by Household Size in Belfry
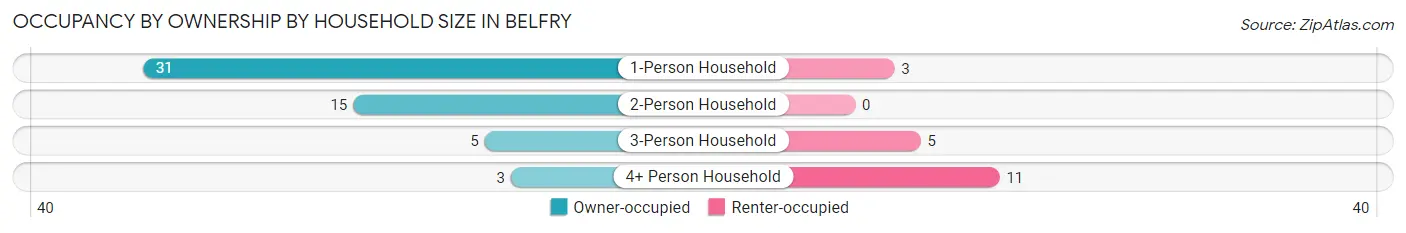
| Household Size | Owner-occupied | Renter-occupied |
| 1-Person Household | 31 (91.2%) | 3 (8.8%) |
| 2-Person Household | 15 (100.0%) | 0 (0.0%) |
| 3-Person Household | 5 (50.0%) | 5 (50.0%) |
| 4+ Person Household | 3 (21.4%) | 11 (78.6%) |
| Total Housing Units | 54 (74.0%) | 19 (26.0%) |
Occupancy by Educational Attainment in Belfry
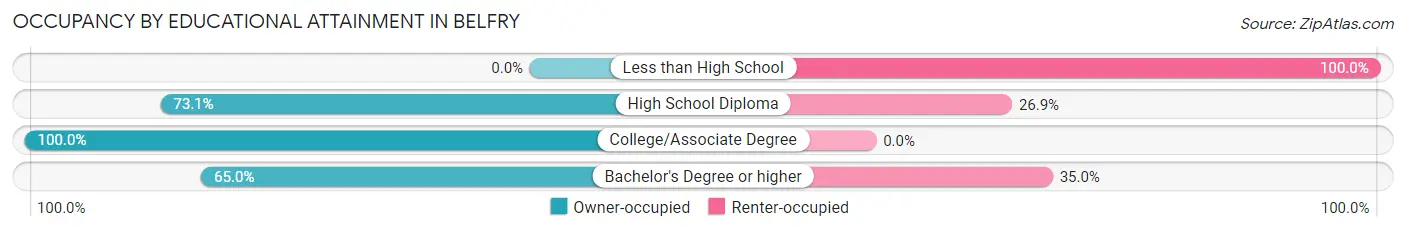
| Household Size | Owner-occupied | Renter-occupied |
| Less than High School | 0 (0.0%) | 5 (100.0%) |
| High School Diploma | 19 (73.1%) | 7 (26.9%) |
| College/Associate Degree | 22 (100.0%) | 0 (0.0%) |
| Bachelor's Degree or higher | 13 (65.0%) | 7 (35.0%) |
Occupancy by Age of Householder in Belfry
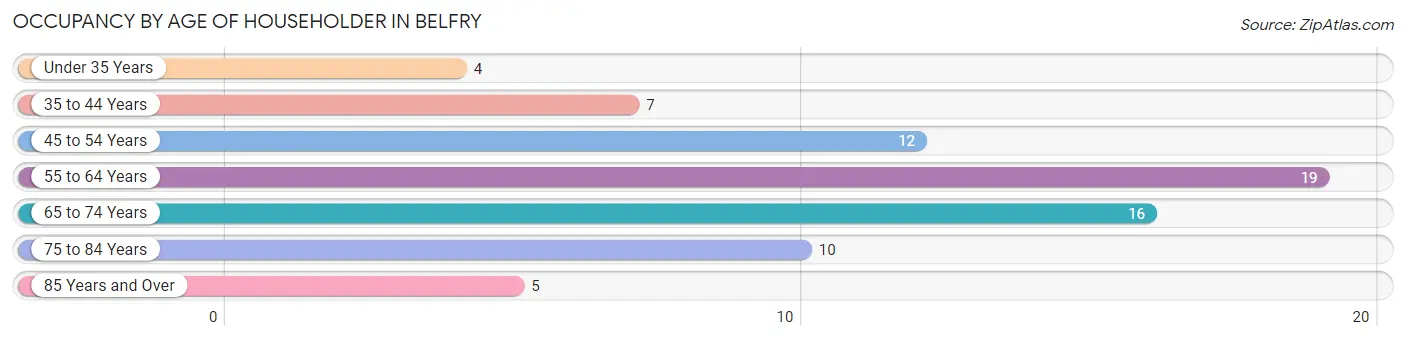
| Age Bracket | # Households | % Households |
| Under 35 Years | 4 | 5.5% |
| 35 to 44 Years | 7 | 9.6% |
| 45 to 54 Years | 12 | 16.4% |
| 55 to 64 Years | 19 | 26.0% |
| 65 to 74 Years | 16 | 21.9% |
| 75 to 84 Years | 10 | 13.7% |
| 85 Years and Over | 5 | 6.9% |
| Total | 73 | 100.0% |
Housing Finances in Belfry
Median Income by Occupancy in Belfry
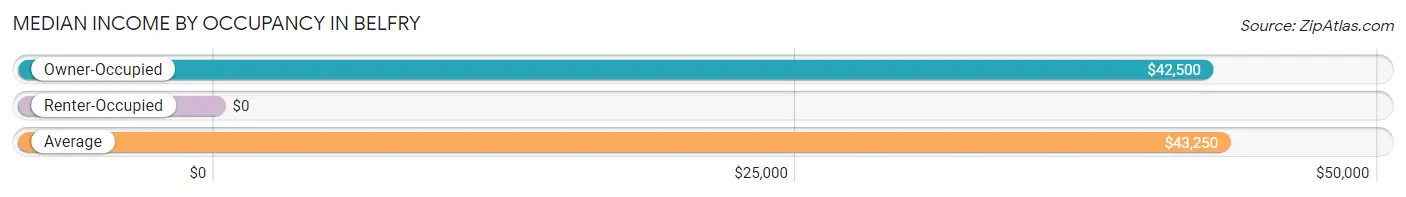
| Occupancy Type | # Households | Median Income |
| Owner-Occupied | 54 (74.0%) | $42,500 |
| Renter-Occupied | 19 (26.0%) | $0 |
| Average | 73 (100.0%) | $43,250 |
Occupancy by Householder Income Bracket in Belfry
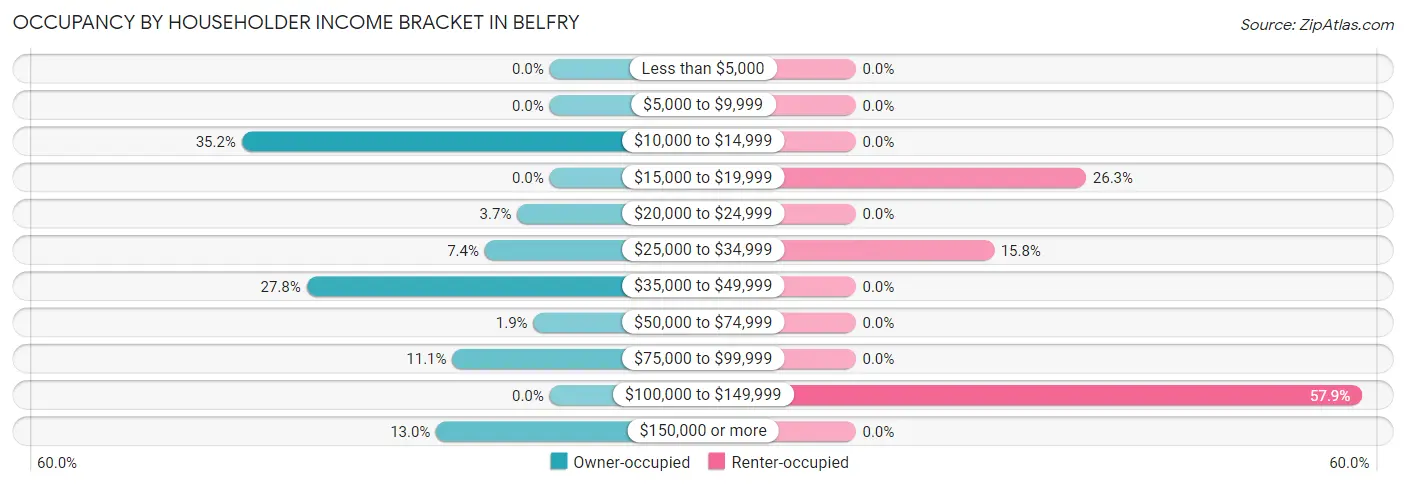
| Income Bracket | Owner-occupied | Renter-occupied |
| Less than $5,000 | 0 (0.0%) | 0 (0.0%) |
| $5,000 to $9,999 | 0 (0.0%) | 0 (0.0%) |
| $10,000 to $14,999 | 19 (35.2%) | 0 (0.0%) |
| $15,000 to $19,999 | 0 (0.0%) | 5 (26.3%) |
| $20,000 to $24,999 | 2 (3.7%) | 0 (0.0%) |
| $25,000 to $34,999 | 4 (7.4%) | 3 (15.8%) |
| $35,000 to $49,999 | 15 (27.8%) | 0 (0.0%) |
| $50,000 to $74,999 | 1 (1.8%) | 0 (0.0%) |
| $75,000 to $99,999 | 6 (11.1%) | 0 (0.0%) |
| $100,000 to $149,999 | 0 (0.0%) | 11 (57.9%) |
| $150,000 or more | 7 (13.0%) | 0 (0.0%) |
| Total | 54 (100.0%) | 19 (100.0%) |
Monthly Housing Cost Tiers in Belfry
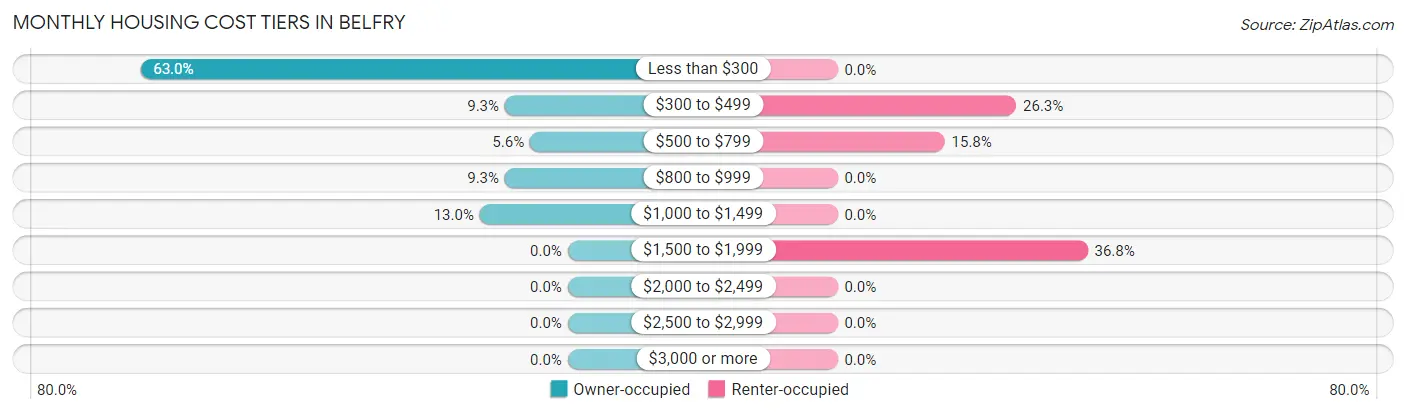
| Monthly Cost | Owner-occupied | Renter-occupied |
| Less than $300 | 34 (63.0%) | 0 (0.0%) |
| $300 to $499 | 5 (9.3%) | 5 (26.3%) |
| $500 to $799 | 3 (5.6%) | 3 (15.8%) |
| $800 to $999 | 5 (9.3%) | 0 (0.0%) |
| $1,000 to $1,499 | 7 (13.0%) | 0 (0.0%) |
| $1,500 to $1,999 | 0 (0.0%) | 7 (36.8%) |
| $2,000 to $2,499 | 0 (0.0%) | 0 (0.0%) |
| $2,500 to $2,999 | 0 (0.0%) | 0 (0.0%) |
| $3,000 or more | 0 (0.0%) | 0 (0.0%) |
| Total | 54 (100.0%) | 19 (100.0%) |
Physical Housing Characteristics in Belfry
Housing Structures in Belfry
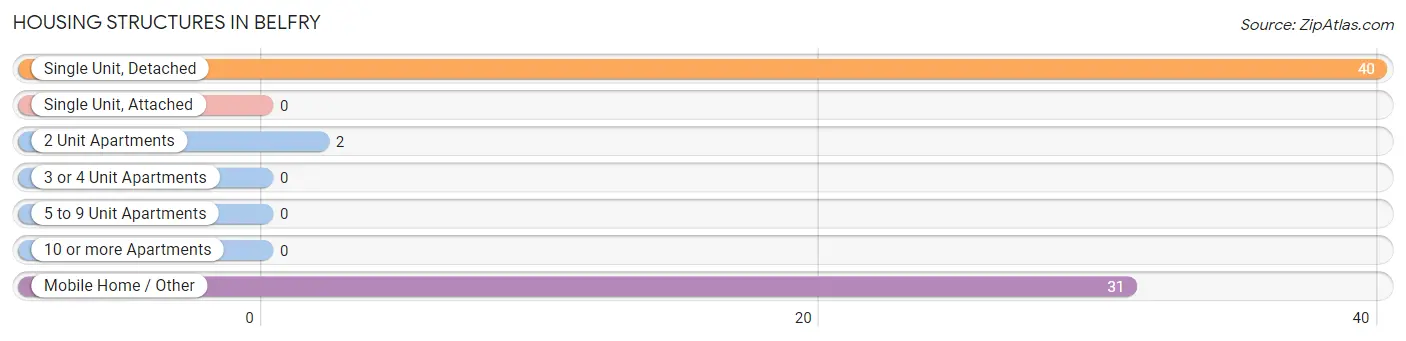
| Structure Type | # Housing Units | % Housing Units |
| Single Unit, Detached | 40 | 54.8% |
| Single Unit, Attached | 0 | 0.0% |
| 2 Unit Apartments | 2 | 2.7% |
| 3 or 4 Unit Apartments | 0 | 0.0% |
| 5 to 9 Unit Apartments | 0 | 0.0% |
| 10 or more Apartments | 0 | 0.0% |
| Mobile Home / Other | 31 | 42.5% |
| Total | 73 | 100.0% |
Housing Structures by Occupancy in Belfry
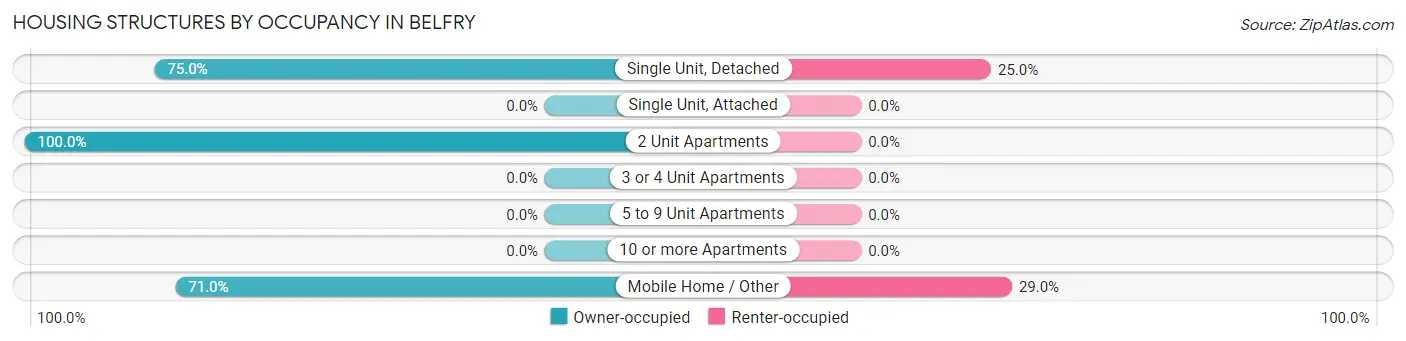
| Structure Type | Owner-occupied | Renter-occupied |
| Single Unit, Detached | 30 (75.0%) | 10 (25.0%) |
| Single Unit, Attached | 0 (0.0%) | 0 (0.0%) |
| 2 Unit Apartments | 2 (100.0%) | 0 (0.0%) |
| 3 or 4 Unit Apartments | 0 (0.0%) | 0 (0.0%) |
| 5 to 9 Unit Apartments | 0 (0.0%) | 0 (0.0%) |
| 10 or more Apartments | 0 (0.0%) | 0 (0.0%) |
| Mobile Home / Other | 22 (71.0%) | 9 (29.0%) |
| Total | 54 (74.0%) | 19 (26.0%) |
Housing Structures by Number of Rooms in Belfry
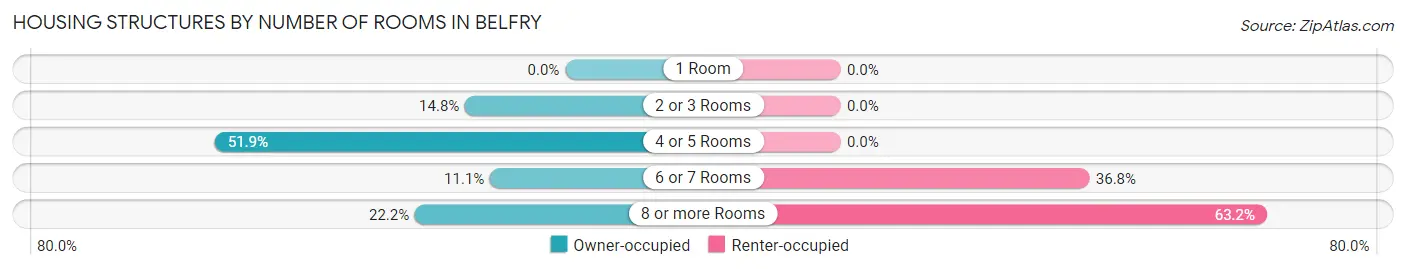
| Number of Rooms | Owner-occupied | Renter-occupied |
| 1 Room | 0 (0.0%) | 0 (0.0%) |
| 2 or 3 Rooms | 8 (14.8%) | 0 (0.0%) |
| 4 or 5 Rooms | 28 (51.8%) | 0 (0.0%) |
| 6 or 7 Rooms | 6 (11.1%) | 7 (36.8%) |
| 8 or more Rooms | 12 (22.2%) | 12 (63.2%) |
| Total | 54 (100.0%) | 19 (100.0%) |
Housing Structure by Heating Type in Belfry
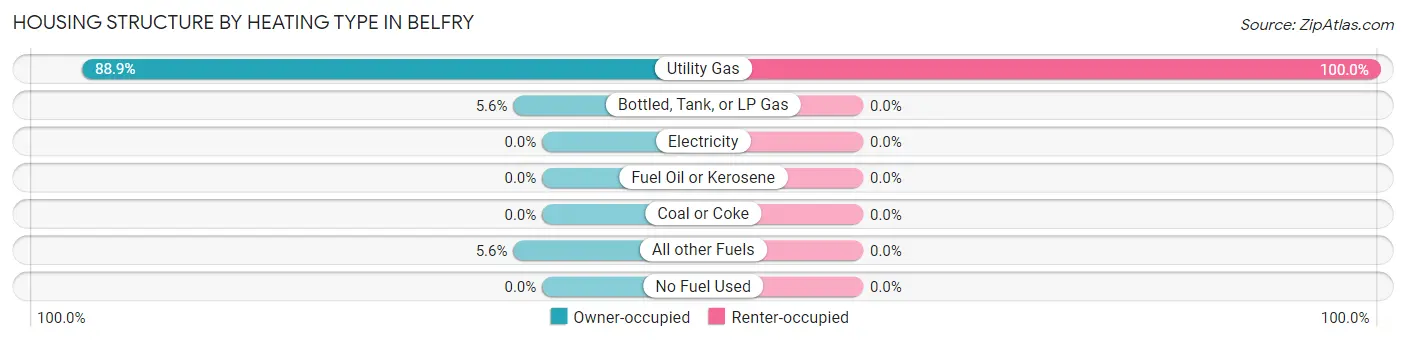
| Heating Type | Owner-occupied | Renter-occupied |
| Utility Gas | 48 (88.9%) | 19 (100.0%) |
| Bottled, Tank, or LP Gas | 3 (5.6%) | 0 (0.0%) |
| Electricity | 0 (0.0%) | 0 (0.0%) |
| Fuel Oil or Kerosene | 0 (0.0%) | 0 (0.0%) |
| Coal or Coke | 0 (0.0%) | 0 (0.0%) |
| All other Fuels | 3 (5.6%) | 0 (0.0%) |
| No Fuel Used | 0 (0.0%) | 0 (0.0%) |
| Total | 54 (100.0%) | 19 (100.0%) |
Household Vehicle Usage in Belfry
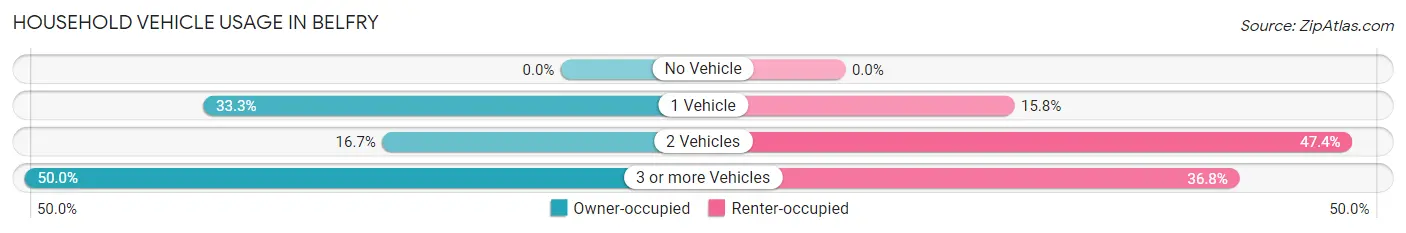
| Vehicles per Household | Owner-occupied | Renter-occupied |
| No Vehicle | 0 (0.0%) | 0 (0.0%) |
| 1 Vehicle | 18 (33.3%) | 3 (15.8%) |
| 2 Vehicles | 9 (16.7%) | 9 (47.4%) |
| 3 or more Vehicles | 27 (50.0%) | 7 (36.8%) |
| Total | 54 (100.0%) | 19 (100.0%) |
Real Estate & Mortgages in Belfry
Real Estate and Mortgage Overview in Belfry
| Characteristic | Without Mortgage | With Mortgage |
| Housing Units | 42 | 12 |
| Median Property Value | - | - |
| Median Household Income | - | - |
| Monthly Housing Costs | $200 | $0 |
| Real Estate Taxes | $733 | $0 |
Property Value by Mortgage Status in Belfry
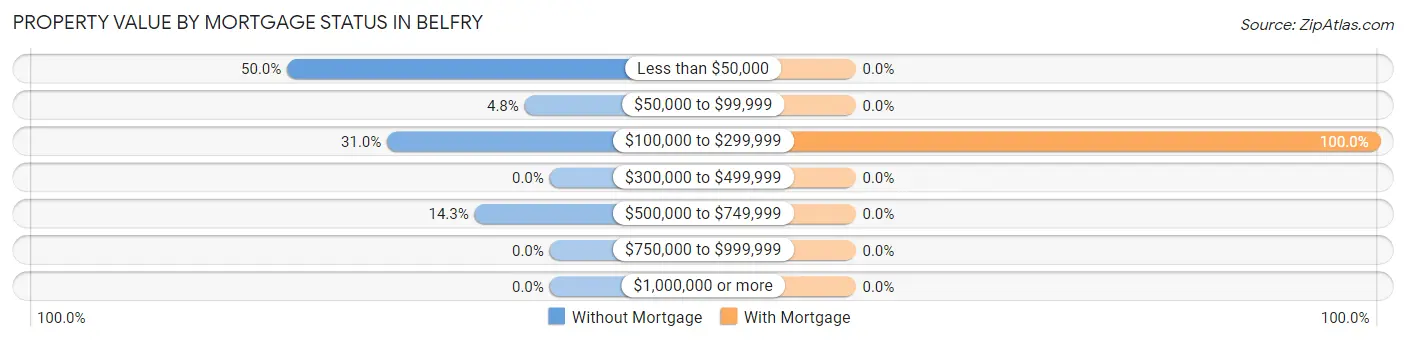
| Property Value | Without Mortgage | With Mortgage |
| Less than $50,000 | 21 (50.0%) | 0 (0.0%) |
| $50,000 to $99,999 | 2 (4.8%) | 0 (0.0%) |
| $100,000 to $299,999 | 13 (30.9%) | 12 (100.0%) |
| $300,000 to $499,999 | 0 (0.0%) | 0 (0.0%) |
| $500,000 to $749,999 | 6 (14.3%) | 0 (0.0%) |
| $750,000 to $999,999 | 0 (0.0%) | 0 (0.0%) |
| $1,000,000 or more | 0 (0.0%) | 0 (0.0%) |
| Total | 42 (100.0%) | 12 (100.0%) |
Household Income by Mortgage Status in Belfry
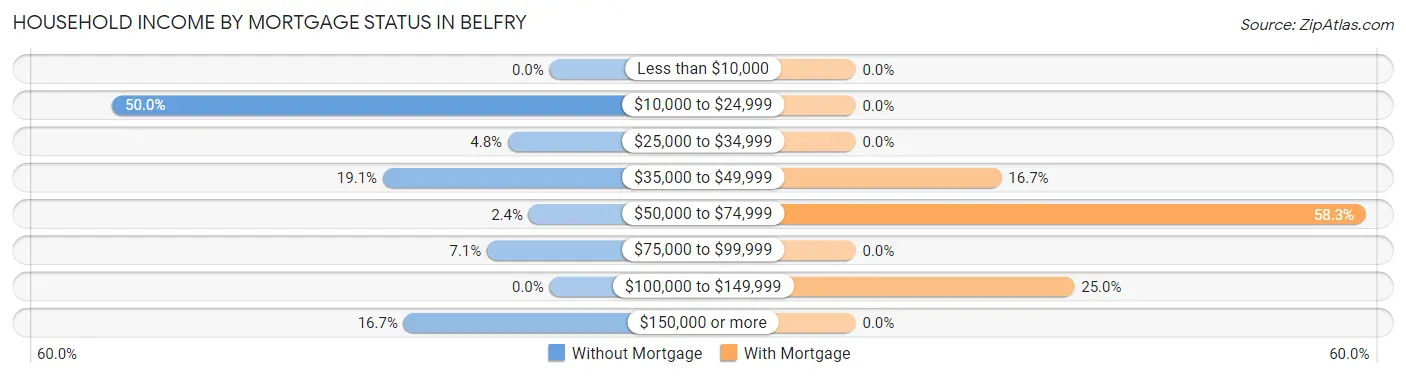
| Household Income | Without Mortgage | With Mortgage |
| Less than $10,000 | 0 (0.0%) | 0 (0.0%) |
| $10,000 to $24,999 | 21 (50.0%) | 0 (0.0%) |
| $25,000 to $34,999 | 2 (4.8%) | 0 (0.0%) |
| $35,000 to $49,999 | 8 (19.1%) | 2 (16.7%) |
| $50,000 to $74,999 | 1 (2.4%) | 7 (58.3%) |
| $75,000 to $99,999 | 3 (7.1%) | 0 (0.0%) |
| $100,000 to $149,999 | 0 (0.0%) | 3 (25.0%) |
| $150,000 or more | 7 (16.7%) | 0 (0.0%) |
| Total | 42 (100.0%) | 12 (100.0%) |
Property Value to Household Income Ratio in Belfry
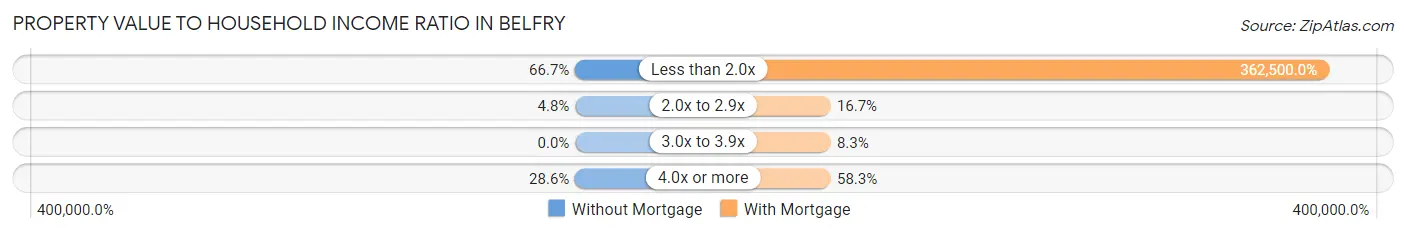
| Value-to-Income Ratio | Without Mortgage | With Mortgage |
| Less than 2.0x | 28 (66.7%) | 43,500 (362,500.0%) |
| 2.0x to 2.9x | 2 (4.8%) | 2 (16.7%) |
| 3.0x to 3.9x | 0 (0.0%) | 1 (8.3%) |
| 4.0x or more | 12 (28.6%) | 7 (58.3%) |
| Total | 42 (100.0%) | 12 (100.0%) |
Real Estate Taxes by Mortgage Status in Belfry
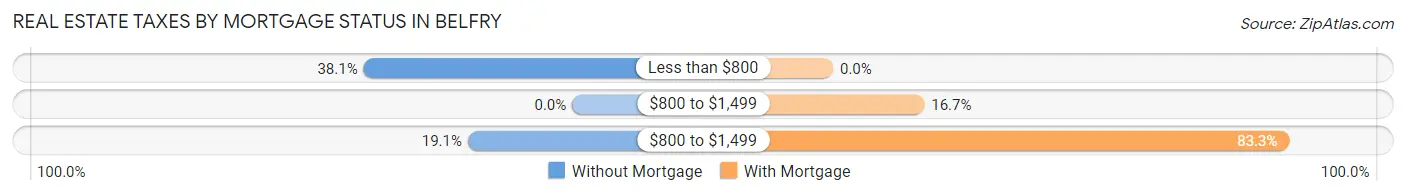
| Property Taxes | Without Mortgage | With Mortgage |
| Less than $800 | 16 (38.1%) | 0 (0.0%) |
| $800 to $1,499 | 0 (0.0%) | 2 (16.7%) |
| $800 to $1,499 | 8 (19.1%) | 10 (83.3%) |
| Total | 42 (100.0%) | 12 (100.0%) |
Health & Disability in Belfry
Health Insurance Coverage by Age in Belfry
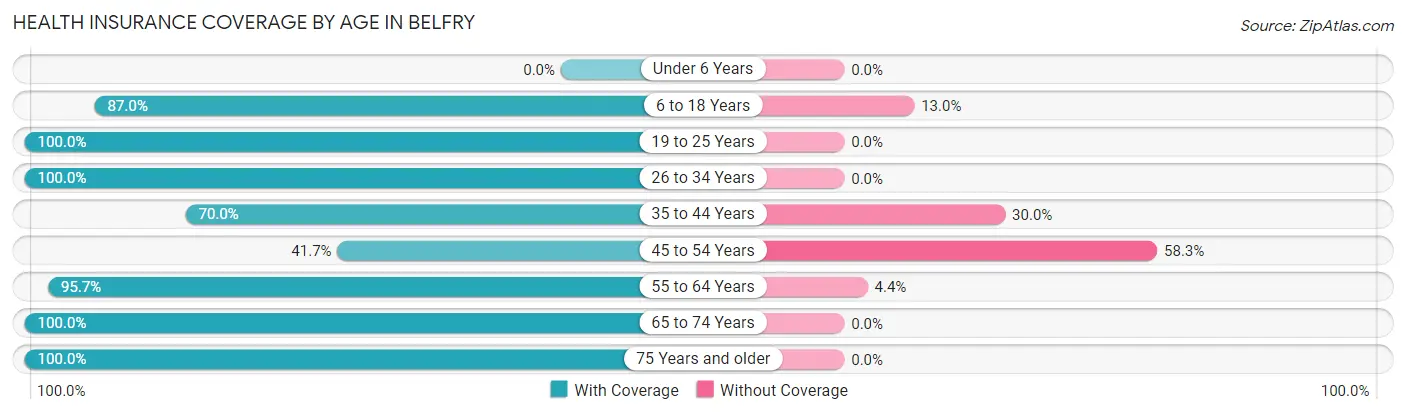
| Age Bracket | With Coverage | Without Coverage |
| Under 6 Years | 0 (0.0%) | 0 (0.0%) |
| 6 to 18 Years | 20 (87.0%) | 3 (13.0%) |
| 19 to 25 Years | 22 (100.0%) | 0 (0.0%) |
| 26 to 34 Years | 21 (100.0%) | 0 (0.0%) |
| 35 to 44 Years | 14 (70.0%) | 6 (30.0%) |
| 45 to 54 Years | 5 (41.7%) | 7 (58.3%) |
| 55 to 64 Years | 22 (95.7%) | 1 (4.3%) |
| 65 to 74 Years | 25 (100.0%) | 0 (0.0%) |
| 75 Years and older | 32 (100.0%) | 0 (0.0%) |
| Total | 161 (90.4%) | 17 (9.6%) |
Health Insurance Coverage by Citizenship Status in Belfry
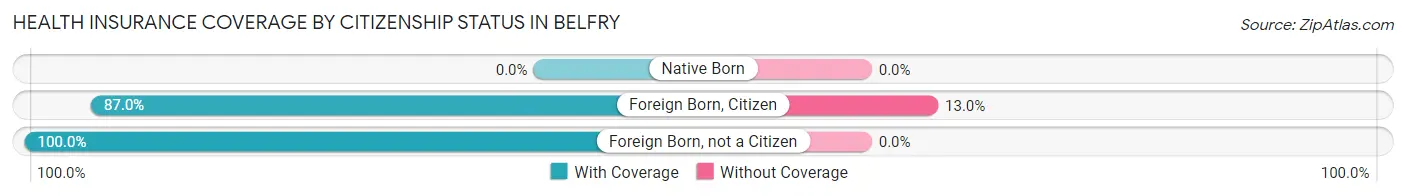
| Citizenship Status | With Coverage | Without Coverage |
| Native Born | 0 (0.0%) | 0 (0.0%) |
| Foreign Born, Citizen | 20 (87.0%) | 3 (13.0%) |
| Foreign Born, not a Citizen | 22 (100.0%) | 0 (0.0%) |
Health Insurance Coverage by Household Income in Belfry
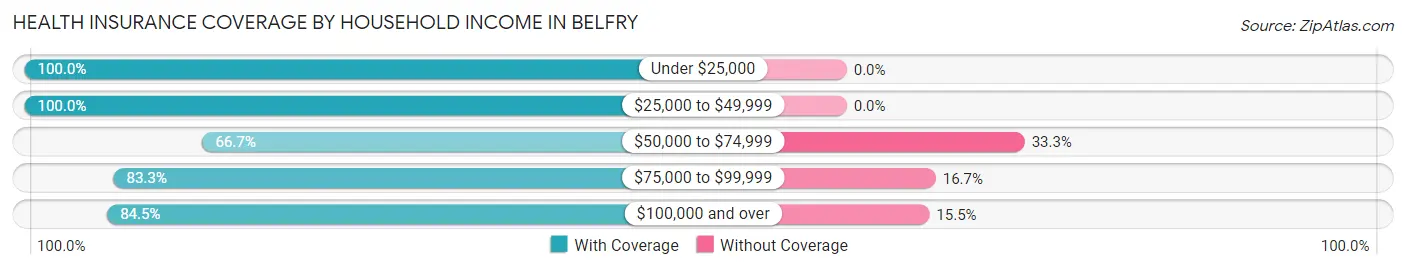
| Household Income | With Coverage | Without Coverage |
| Under $25,000 | 39 (100.0%) | 0 (0.0%) |
| $25,000 to $49,999 | 34 (100.0%) | 0 (0.0%) |
| $50,000 to $74,999 | 2 (66.7%) | 1 (33.3%) |
| $75,000 to $99,999 | 15 (83.3%) | 3 (16.7%) |
| $100,000 and over | 71 (84.5%) | 13 (15.5%) |
Public vs Private Health Insurance Coverage by Age in Belfry
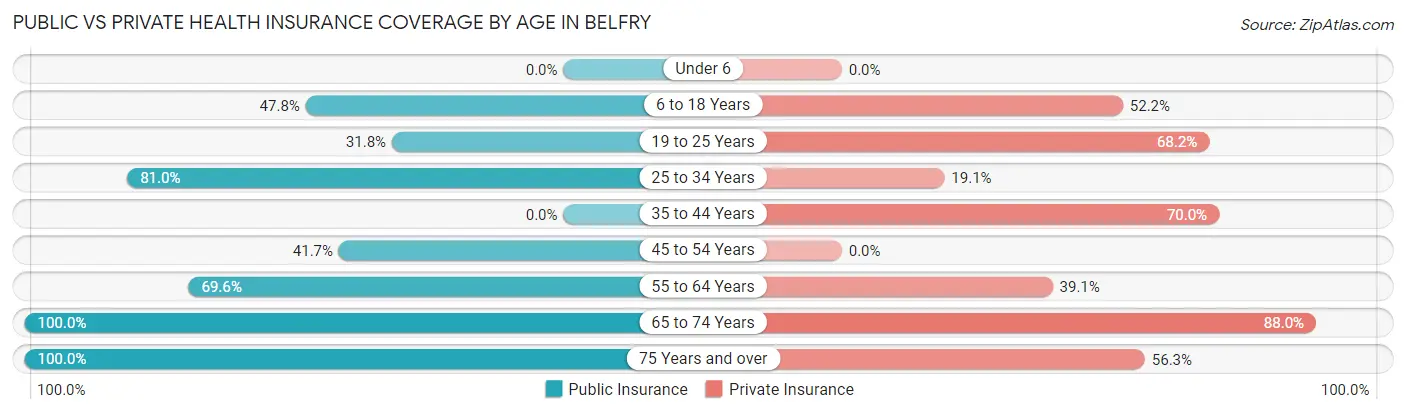
| Age Bracket | Public Insurance | Private Insurance |
| Under 6 | 0 (0.0%) | 0 (0.0%) |
| 6 to 18 Years | 11 (47.8%) | 12 (52.2%) |
| 19 to 25 Years | 7 (31.8%) | 15 (68.2%) |
| 25 to 34 Years | 17 (80.9%) | 4 (19.1%) |
| 35 to 44 Years | 0 (0.0%) | 14 (70.0%) |
| 45 to 54 Years | 5 (41.7%) | 0 (0.0%) |
| 55 to 64 Years | 16 (69.6%) | 9 (39.1%) |
| 65 to 74 Years | 25 (100.0%) | 22 (88.0%) |
| 75 Years and over | 32 (100.0%) | 18 (56.2%) |
| Total | 113 (63.5%) | 94 (52.8%) |
Disability Status by Sex by Age in Belfry
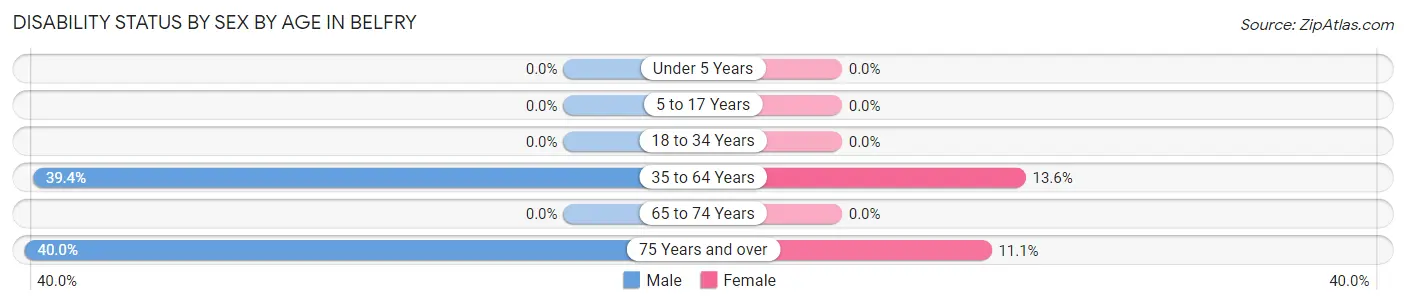
| Age Bracket | Male | Female |
| Under 5 Years | 0 (0.0%) | 0 (0.0%) |
| 5 to 17 Years | 0 (0.0%) | 0 (0.0%) |
| 18 to 34 Years | 0 (0.0%) | 0 (0.0%) |
| 35 to 64 Years | 13 (39.4%) | 3 (13.6%) |
| 65 to 74 Years | 0 (0.0%) | 0 (0.0%) |
| 75 Years and over | 2 (40.0%) | 3 (11.1%) |
Disability Class by Sex by Age in Belfry
Disability Class: Hearing Difficulty
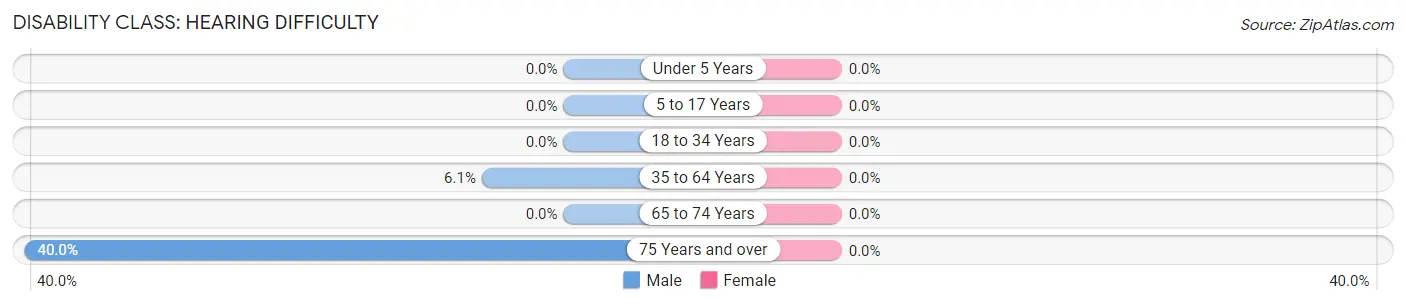
| Age Bracket | Male | Female |
| Under 5 Years | 0 (0.0%) | 0 (0.0%) |
| 5 to 17 Years | 0 (0.0%) | 0 (0.0%) |
| 18 to 34 Years | 0 (0.0%) | 0 (0.0%) |
| 35 to 64 Years | 2 (6.1%) | 0 (0.0%) |
| 65 to 74 Years | 0 (0.0%) | 0 (0.0%) |
| 75 Years and over | 2 (40.0%) | 0 (0.0%) |
Disability Class: Vision Difficulty
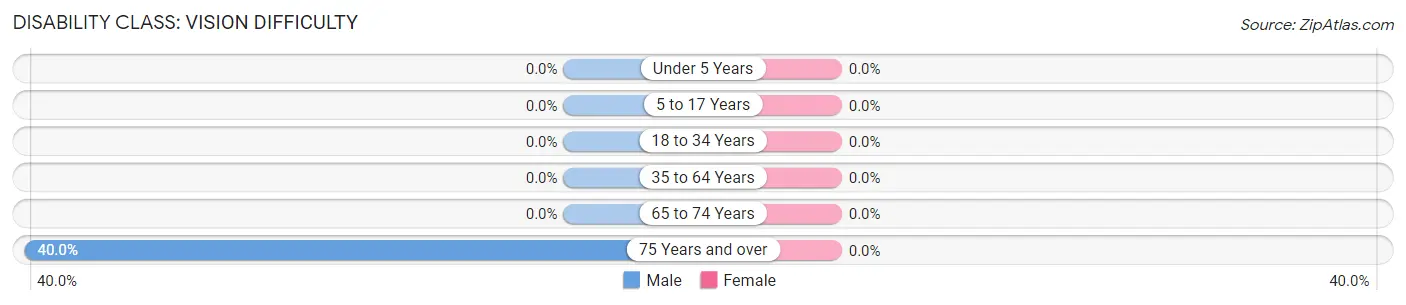
| Age Bracket | Male | Female |
| Under 5 Years | 0 (0.0%) | 0 (0.0%) |
| 5 to 17 Years | 0 (0.0%) | 0 (0.0%) |
| 18 to 34 Years | 0 (0.0%) | 0 (0.0%) |
| 35 to 64 Years | 0 (0.0%) | 0 (0.0%) |
| 65 to 74 Years | 0 (0.0%) | 0 (0.0%) |
| 75 Years and over | 2 (40.0%) | 0 (0.0%) |
Disability Class: Cognitive Difficulty
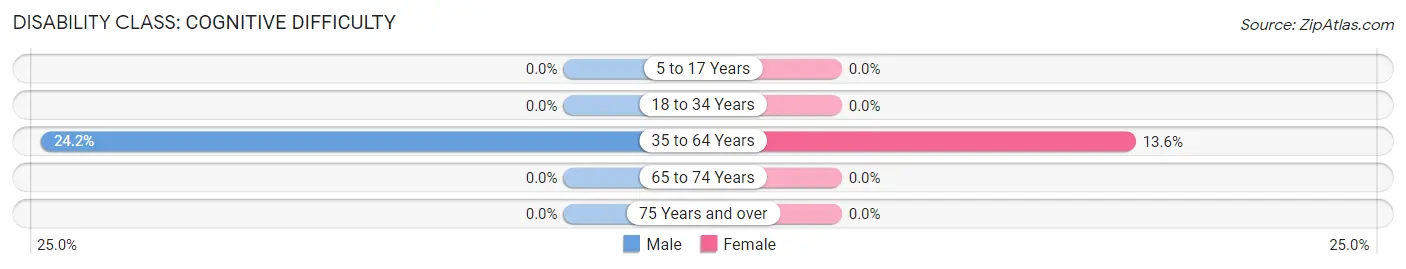
| Age Bracket | Male | Female |
| 5 to 17 Years | 0 (0.0%) | 0 (0.0%) |
| 18 to 34 Years | 0 (0.0%) | 0 (0.0%) |
| 35 to 64 Years | 8 (24.2%) | 3 (13.6%) |
| 65 to 74 Years | 0 (0.0%) | 0 (0.0%) |
| 75 Years and over | 0 (0.0%) | 0 (0.0%) |
Disability Class: Ambulatory Difficulty
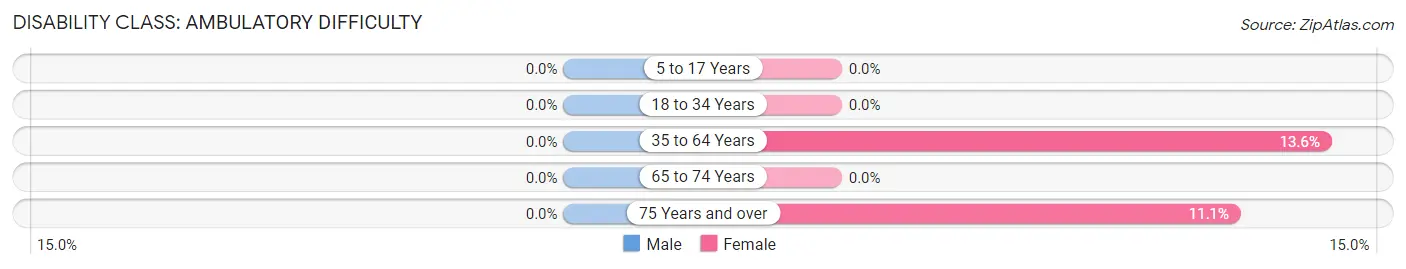
| Age Bracket | Male | Female |
| 5 to 17 Years | 0 (0.0%) | 0 (0.0%) |
| 18 to 34 Years | 0 (0.0%) | 0 (0.0%) |
| 35 to 64 Years | 0 (0.0%) | 3 (13.6%) |
| 65 to 74 Years | 0 (0.0%) | 0 (0.0%) |
| 75 Years and over | 0 (0.0%) | 3 (11.1%) |
Disability Class: Self-Care Difficulty
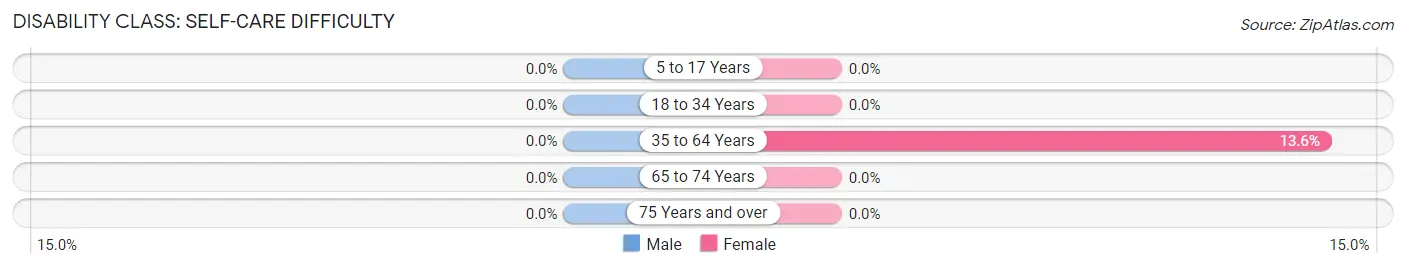
| Age Bracket | Male | Female |
| 5 to 17 Years | 0 (0.0%) | 0 (0.0%) |
| 18 to 34 Years | 0 (0.0%) | 0 (0.0%) |
| 35 to 64 Years | 0 (0.0%) | 3 (13.6%) |
| 65 to 74 Years | 0 (0.0%) | 0 (0.0%) |
| 75 Years and over | 0 (0.0%) | 0 (0.0%) |
Technology Access in Belfry
Computing Device Access in Belfry
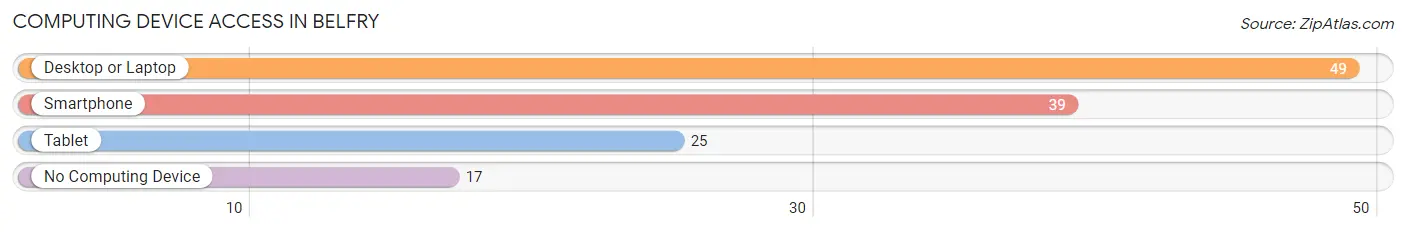
| Device Type | # Households | % Households |
| Desktop or Laptop | 49 | 67.1% |
| Smartphone | 39 | 53.4% |
| Tablet | 25 | 34.3% |
| No Computing Device | 17 | 23.3% |
| Total | 73 | 100.0% |
Internet Access in Belfry
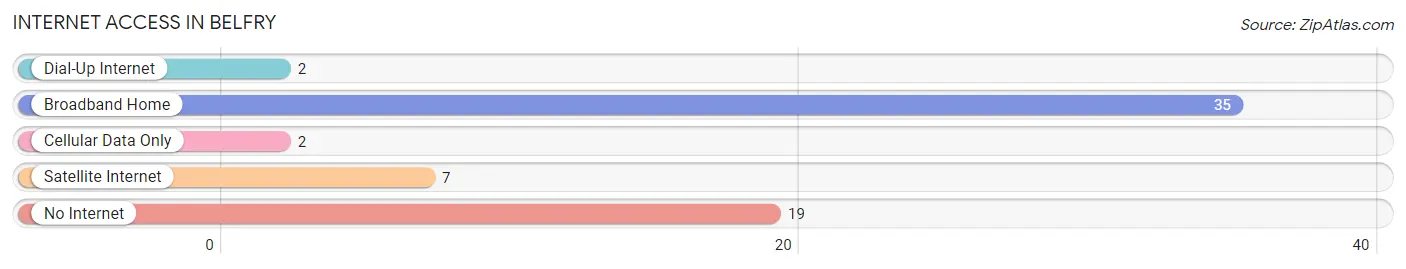
| Internet Type | # Households | % Households |
| Dial-Up Internet | 2 | 2.7% |
| Broadband Home | 35 | 47.9% |
| Cellular Data Only | 2 | 2.7% |
| Satellite Internet | 7 | 9.6% |
| No Internet | 19 | 26.0% |
| Total | 73 | 100.0% |
Belfry Summary
Belfry, Montana is a small town located in Carbon County, Montana. It is situated in the foothills of the Beartooth Mountains, approximately 20 miles south of Billings. The town was founded in 1882 and has a population of approximately 500 people.
Geography
Belfry is located in the foothills of the Beartooth Mountains, approximately 20 miles south of Billings. The town is situated in a valley surrounded by mountains and hills. The town is located at an elevation of 4,000 feet and has a total area of 0.7 square miles. The climate in Belfry is semi-arid, with hot summers and cold winters.
Economy
The economy of Belfry is largely based on agriculture and tourism. The town is home to several small businesses, including a grocery store, a hardware store, a restaurant, and a gas station. The town also has a small airport, which is used for recreational flying.
Agriculture is the main economic activity in Belfry. The town is home to several farms, which produce hay, wheat, barley, and other crops. The town also has a small livestock industry, which includes cattle, sheep, and horses.
Tourism is also an important part of the economy in Belfry. The town is home to several attractions, including the Beartooth Nature Center, which offers educational programs and guided tours of the area. The town also has several campgrounds, which attract visitors from all over the country.
Demographics
As of the 2010 census, the population of Belfry was 498 people. The racial makeup of the town was 97.2% White, 0.2% African American, 0.4% Native American, 0.2% Asian, 0.2% from other races, and 1.9% from two or more races. Hispanic or Latino of any race were 0.8% of the population.
The median income for a household in Belfry was $37,500, and the median income for a family was $41,250. The per capita income for the town was $17,845. About 11.2% of families and 13.2% of the population were below the poverty line, including 16.7% of those under age 18 and 8.3% of those age 65 or over.
Conclusion
Belfry, Montana is a small town located in Carbon County, Montana. It is situated in the foothills of the Beartooth Mountains, approximately 20 miles south of Billings. The town was founded in 1882 and has a population of approximately 500 people. The economy of Belfry is largely based on agriculture and tourism. The town is home to several small businesses, including a grocery store, a hardware store, a restaurant, and a gas station. The town also has a small airport, which is used for recreational flying. As of the 2010 census, the population of Belfry was 498 people. The median income for a household in Belfry was $37,500, and the median income for a family was $41,250. The per capita income for the town was $17,845. Belfry is a small town with a rich history and a vibrant economy.
Common Questions
What is Per Capita Income in Belfry?
Per Capita income in Belfry is $53,733.
What is the Median Family Income in Belfry?
Median Family Income in Belfry is $95,625.
What is the Median Household income in Belfry?
Median Household Income in Belfry is $43,250.
What is Inequality or Gini Index in Belfry?
Inequality or Gini Index in Belfry is 0.69.
What is the Total Population of Belfry?
Total Population of Belfry is 178.
What is the Total Male Population of Belfry?
Total Male Population of Belfry is 88.
What is the Total Female Population of Belfry?
Total Female Population of Belfry is 90.
What is the Ratio of Males per 100 Females in Belfry?
There are 97.78 Males per 100 Females in Belfry.
What is the Ratio of Females per 100 Males in Belfry?
There are 102.27 Females per 100 Males in Belfry.
What is the Median Population Age in Belfry?
Median Population Age in Belfry is 47.6 Years.
What is the Average Family Size in Belfry
Average Family Size in Belfry is 3.7 People.
What is the Average Household Size in Belfry
Average Household Size in Belfry is 2.4 People.
How Large is the Labor Force in Belfry?
There are 78 People in the Labor Forcein in Belfry.
What is the Percentage of People in the Labor Force in Belfry?
48.1% of People are in the Labor Force in Belfry.