Dyersburg, TN Map & Demographics
Dyersburg Map
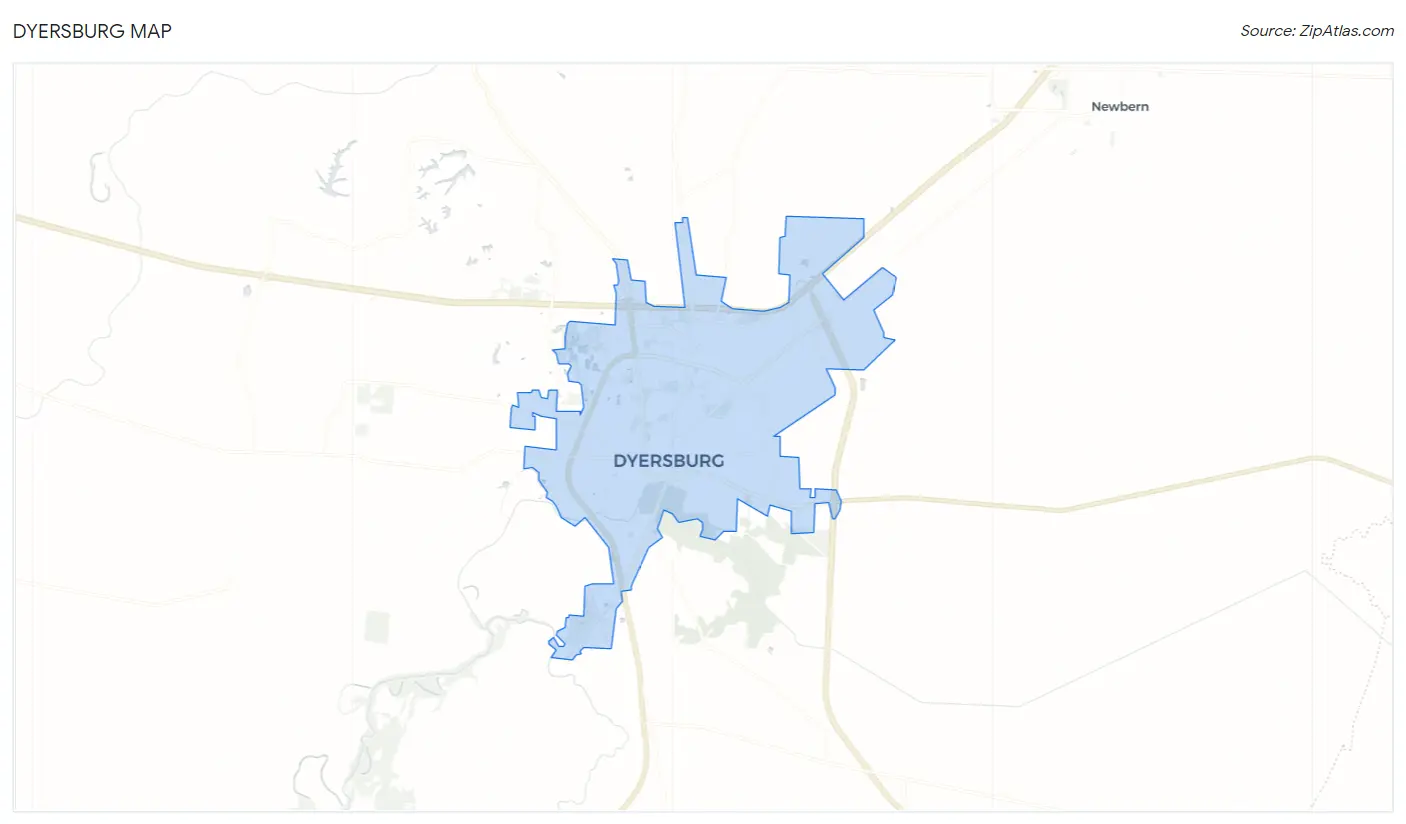
Dyersburg Overview
$45,980
PER CAPITA INCOME
$66,069
AVG FAMILY INCOME
$50,550
AVG HOUSEHOLD INCOME
27.6%
WAGE / INCOME GAP [ % ]
72.4¢/ $1
WAGE / INCOME GAP [ $ ]
$10,452
FAMILY INCOME DEFICIT
0.69
INEQUALITY / GINI INDEX
16,170
TOTAL POPULATION
7,609
MALE POPULATION
8,561
FEMALE POPULATION
88.88
MALES / 100 FEMALES
112.51
FEMALES / 100 MALES
42.5
MEDIAN AGE
3.2
AVG FAMILY SIZE
2.4
AVG HOUSEHOLD SIZE
6,925
LABOR FORCE [ PEOPLE ]
54.8%
PERCENT IN LABOR FORCE
6.5%
UNEMPLOYMENT RATE
Dyersburg Zip Codes
Dyersburg Area Codes
Income in Dyersburg
Income Overview in Dyersburg
Per Capita Income in Dyersburg is $45,980, while median incomes of families and households are $66,069 and $50,550 respectively.
| Characteristic | Number | Measure |
| Per Capita Income | 16,170 | $45,980 |
| Median Family Income | 3,820 | $66,069 |
| Mean Family Income | 3,820 | $163,167 |
| Median Household Income | 6,635 | $50,550 |
| Mean Household Income | 6,635 | $113,380 |
| Income Deficit | 3,820 | $10,452 |
| Wage / Income Gap (%) | 16,170 | 27.60% |
| Wage / Income Gap ($) | 16,170 | 72.40¢ per $1 |
| Gini / Inequality Index | 16,170 | 0.69 |
Earnings by Sex in Dyersburg
Average Earnings in Dyersburg are $34,207, $42,708 for men and $30,921 for women, a difference of 27.6%.
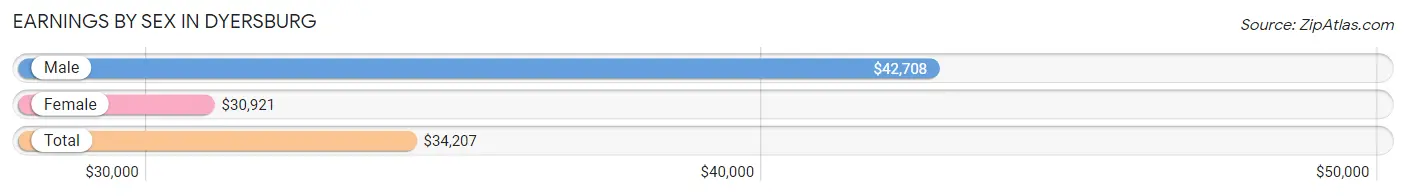
| Sex | Number | Average Earnings |
| Male | 3,900 (52.3%) | $42,708 |
| Female | 3,562 (47.7%) | $30,921 |
| Total | 7,462 (100.0%) | $34,207 |
Earnings by Sex by Income Bracket in Dyersburg
The most common earnings brackets in Dyersburg are $100,000+ for men (443 | 11.4%) and $55,000 to $64,999 for women (415 | 11.7%).
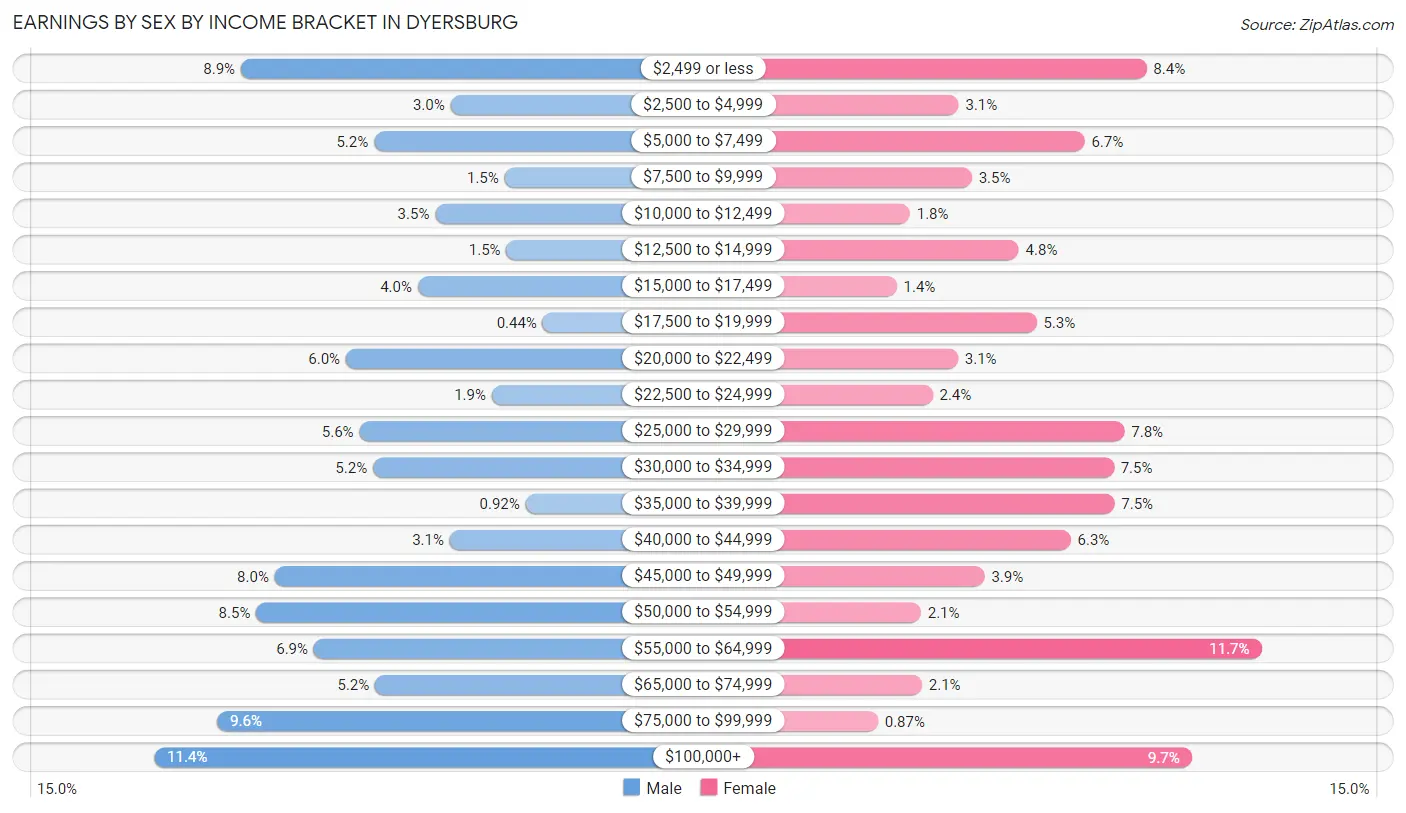
| Income | Male | Female |
| $2,499 or less | 348 (8.9%) | 300 (8.4%) |
| $2,500 to $4,999 | 118 (3.0%) | 112 (3.1%) |
| $5,000 to $7,499 | 202 (5.2%) | 238 (6.7%) |
| $7,500 to $9,999 | 59 (1.5%) | 125 (3.5%) |
| $10,000 to $12,499 | 135 (3.5%) | 63 (1.8%) |
| $12,500 to $14,999 | 57 (1.5%) | 172 (4.8%) |
| $15,000 to $17,499 | 154 (4.0%) | 50 (1.4%) |
| $17,500 to $19,999 | 17 (0.4%) | 190 (5.3%) |
| $20,000 to $22,499 | 233 (6.0%) | 111 (3.1%) |
| $22,500 to $24,999 | 73 (1.9%) | 86 (2.4%) |
| $25,000 to $29,999 | 218 (5.6%) | 278 (7.8%) |
| $30,000 to $34,999 | 203 (5.2%) | 267 (7.5%) |
| $35,000 to $39,999 | 36 (0.9%) | 268 (7.5%) |
| $40,000 to $44,999 | 119 (3.0%) | 224 (6.3%) |
| $45,000 to $49,999 | 311 (8.0%) | 138 (3.9%) |
| $50,000 to $54,999 | 331 (8.5%) | 74 (2.1%) |
| $55,000 to $64,999 | 268 (6.9%) | 415 (11.7%) |
| $65,000 to $74,999 | 201 (5.1%) | 75 (2.1%) |
| $75,000 to $99,999 | 374 (9.6%) | 31 (0.9%) |
| $100,000+ | 443 (11.4%) | 345 (9.7%) |
| Total | 3,900 (100.0%) | 3,562 (100.0%) |
Earnings by Sex by Educational Attainment in Dyersburg
Average earnings in Dyersburg are $49,853 for men and $34,207 for women, a difference of 31.4%. Men with an educational attainment of graduate degree enjoy the highest average annual earnings of $89,406, while those with less than high school education earn the least with $26,892. Women with an educational attainment of graduate degree earn the most with the average annual earnings of $59,094, while those with less than high school education have the smallest earnings of $2,499.
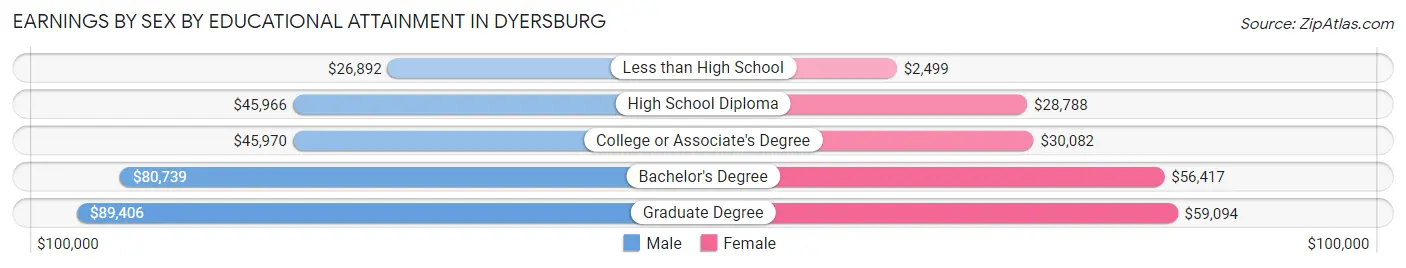
| Educational Attainment | Male Income | Female Income |
| Less than High School | $26,892 | $2,499 |
| High School Diploma | $45,966 | $28,788 |
| College or Associate's Degree | $45,970 | $30,082 |
| Bachelor's Degree | $80,739 | $56,417 |
| Graduate Degree | $89,406 | $59,094 |
| Total | $49,853 | $34,207 |
Family Income in Dyersburg
Family Income Brackets in Dyersburg
According to the Dyersburg family income data, there are 905 families falling into the $50,000 to $74,999 income range, which is the most common income bracket and makes up 23.7% of all families. Conversely, the $10,000 to $14,999 income bracket is the least frequent group with only 31 families (0.8%) belonging to this category.
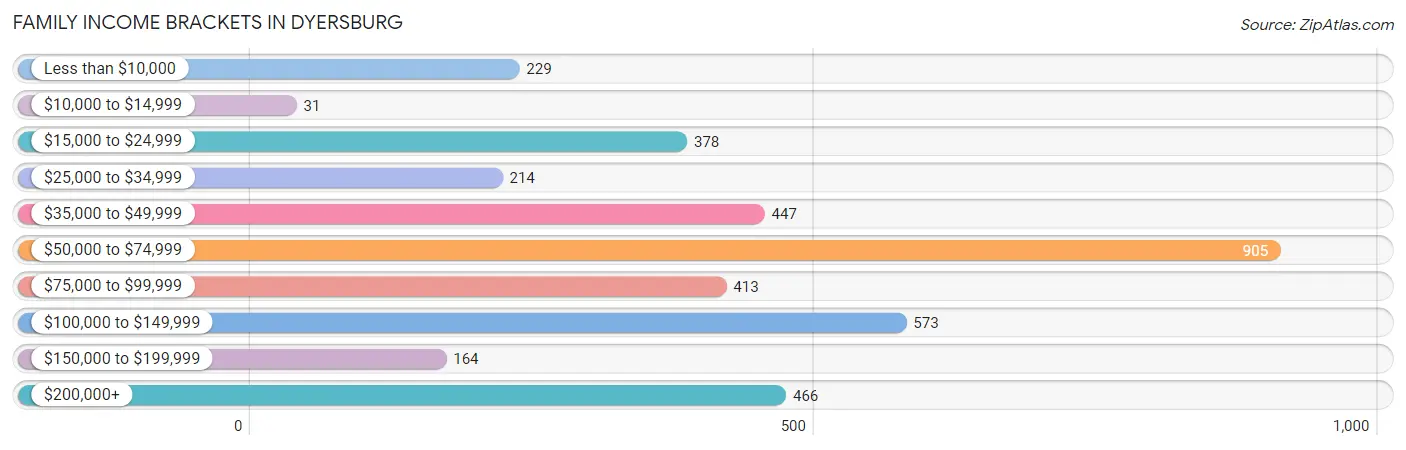
| Income Bracket | # Families | % Families |
| Less than $10,000 | 229 | 6.0% |
| $10,000 to $14,999 | 31 | 0.8% |
| $15,000 to $24,999 | 378 | 9.9% |
| $25,000 to $34,999 | 214 | 5.6% |
| $35,000 to $49,999 | 447 | 11.7% |
| $50,000 to $74,999 | 905 | 23.7% |
| $75,000 to $99,999 | 413 | 10.8% |
| $100,000 to $149,999 | 573 | 15.0% |
| $150,000 to $199,999 | 164 | 4.3% |
| $200,000+ | 466 | 12.2% |
Family Income by Famaliy Size in Dyersburg
5-person families (317 | 8.3%) account for the highest median family income in Dyersburg with $126,152 per family, while 2-person families (2,107 | 55.2%) have the highest median income of $27,699 per family member.
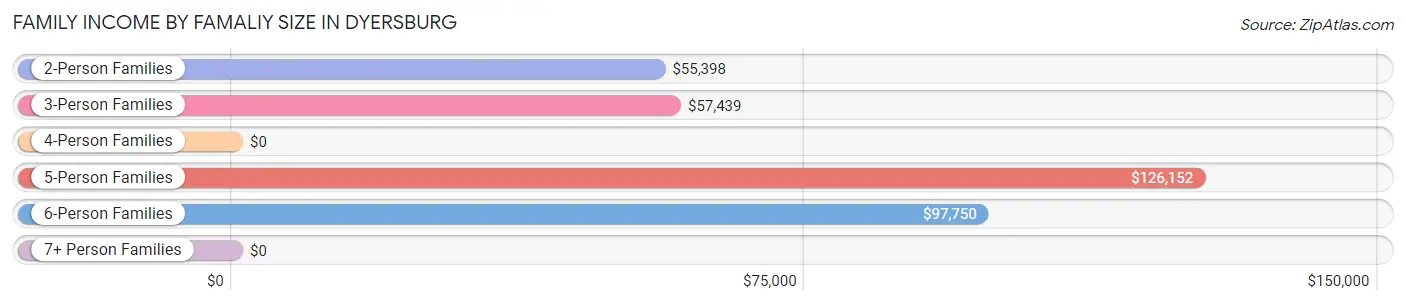
| Income Bracket | # Families | Median Income |
| 2-Person Families | 2,107 (55.2%) | $55,398 |
| 3-Person Families | 681 (17.8%) | $57,439 |
| 4-Person Families | 629 (16.5%) | $0 |
| 5-Person Families | 317 (8.3%) | $126,152 |
| 6-Person Families | 45 (1.2%) | $97,750 |
| 7+ Person Families | 41 (1.1%) | $0 |
| Total | 3,820 (100.0%) | $66,069 |
Family Income by Number of Earners in Dyersburg
The median family income in Dyersburg is $66,069, with families comprising 3+ earners (265) having the highest median family income of $143,589, while families with no earners (632) have the lowest median family income of $23,939, accounting for 6.9% and 16.5% of families, respectively.
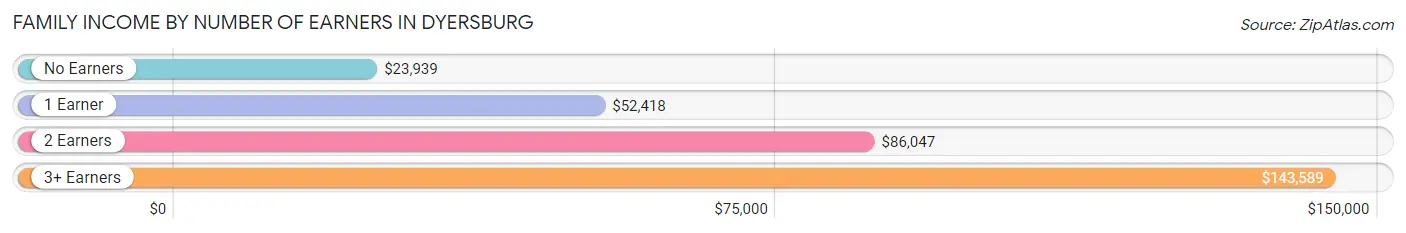
| Number of Earners | # Families | Median Income |
| No Earners | 632 (16.5%) | $23,939 |
| 1 Earner | 1,361 (35.6%) | $52,418 |
| 2 Earners | 1,562 (40.9%) | $86,047 |
| 3+ Earners | 265 (6.9%) | $143,589 |
| Total | 3,820 (100.0%) | $66,069 |
Household Income in Dyersburg
Household Income Brackets in Dyersburg
With 1,480 households falling in the category, the $50,000 to $74,999 income range is the most frequent in Dyersburg, accounting for 22.3% of all households. In contrast, only 166 households (2.5%) fall into the $150,000 to $199,999 income bracket, making it the least populous group.
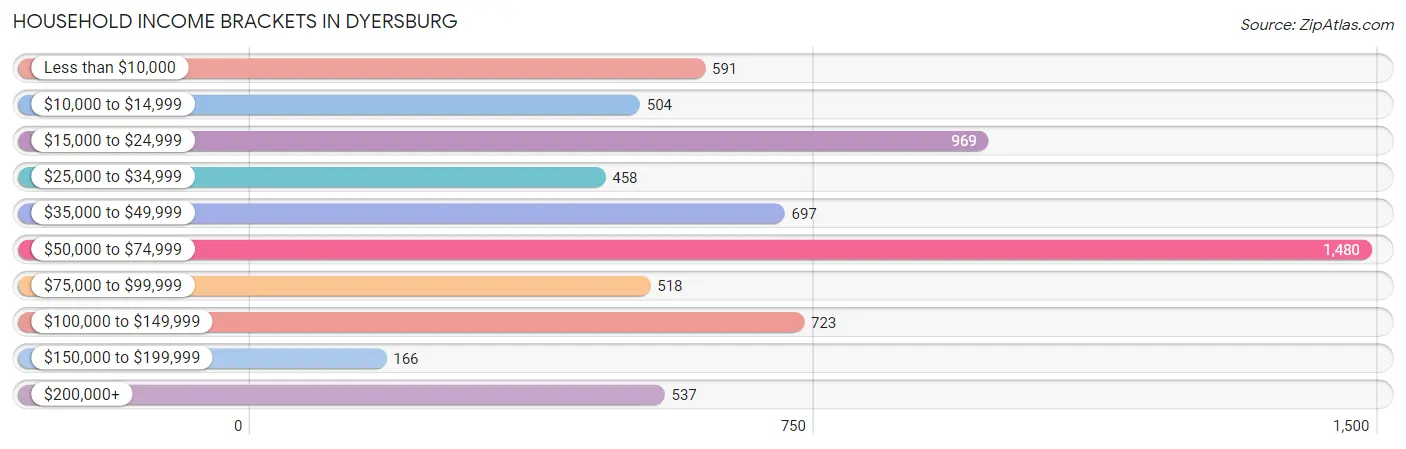
| Income Bracket | # Households | % Households |
| Less than $10,000 | 591 | 8.9% |
| $10,000 to $14,999 | 504 | 7.6% |
| $15,000 to $24,999 | 969 | 14.6% |
| $25,000 to $34,999 | 458 | 6.9% |
| $35,000 to $49,999 | 697 | 10.5% |
| $50,000 to $74,999 | 1,480 | 22.3% |
| $75,000 to $99,999 | 518 | 7.8% |
| $100,000 to $149,999 | 723 | 10.9% |
| $150,000 to $199,999 | 166 | 2.5% |
| $200,000+ | 537 | 8.1% |
Household Income by Householder Age in Dyersburg
The median household income in Dyersburg is $50,550, with the highest median household income of $54,773 found in the 15 to 24 years age bracket for the primary householder. A total of 154 households (2.3%) fall into this category. Meanwhile, the 65+ years age bracket for the primary householder has the lowest median household income of $44,591, with 1,962 households (29.6%) in this group.
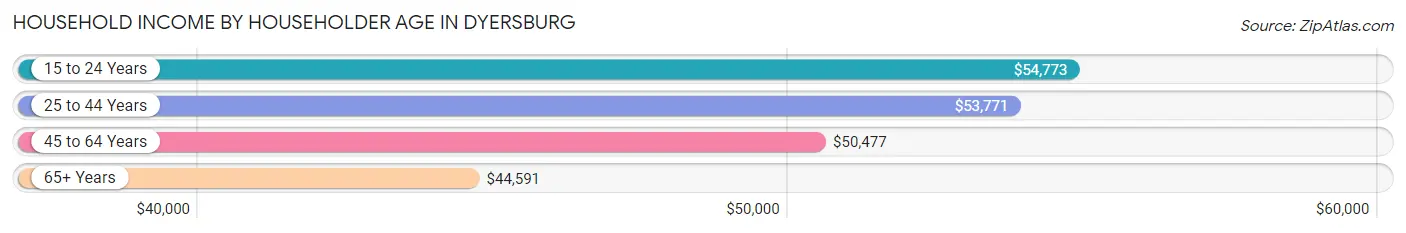
| Income Bracket | # Households | Median Income |
| 15 to 24 Years | 154 (2.3%) | $54,773 |
| 25 to 44 Years | 2,035 (30.7%) | $53,771 |
| 45 to 64 Years | 2,484 (37.4%) | $50,477 |
| 65+ Years | 1,962 (29.6%) | $44,591 |
| Total | 6,635 (100.0%) | $50,550 |
Poverty in Dyersburg
Income Below Poverty by Sex and Age in Dyersburg
With 19.4% poverty level for males and 22.7% for females among the residents of Dyersburg, 16 and 17 year old males and 5 year old females are the most vulnerable to poverty, with 58 males (36.2%) and 45 females (100.0%) in their respective age groups living below the poverty level.
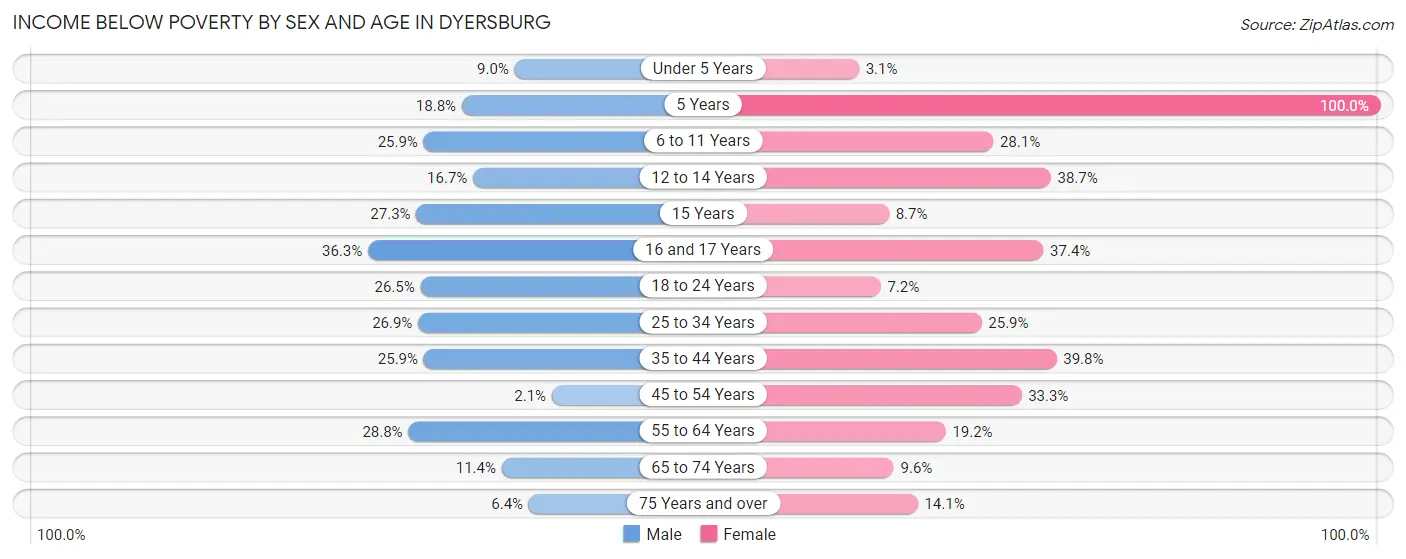
| Age Bracket | Male | Female |
| Under 5 Years | 33 (9.0%) | 17 (3.1%) |
| 5 Years | 29 (18.8%) | 45 (100.0%) |
| 6 to 11 Years | 247 (25.9%) | 172 (28.1%) |
| 12 to 14 Years | 39 (16.7%) | 86 (38.7%) |
| 15 Years | 18 (27.3%) | 25 (8.7%) |
| 16 and 17 Years | 58 (36.2%) | 80 (37.4%) |
| 18 to 24 Years | 208 (26.5%) | 27 (7.2%) |
| 25 to 34 Years | 215 (26.9%) | 253 (25.9%) |
| 35 to 44 Years | 181 (25.9%) | 377 (39.8%) |
| 45 to 54 Years | 23 (2.1%) | 385 (33.3%) |
| 55 to 64 Years | 249 (28.7%) | 219 (19.2%) |
| 65 to 74 Years | 95 (11.4%) | 102 (9.6%) |
| 75 Years and over | 17 (6.4%) | 110 (14.1%) |
| Total | 1,412 (19.4%) | 1,898 (22.7%) |
Income Above Poverty by Sex and Age in Dyersburg
According to the poverty statistics in Dyersburg, males aged 45 to 54 years and females aged under 5 years are the age groups that are most secure financially, with 97.9% of males and 96.9% of females in these age groups living above the poverty line.
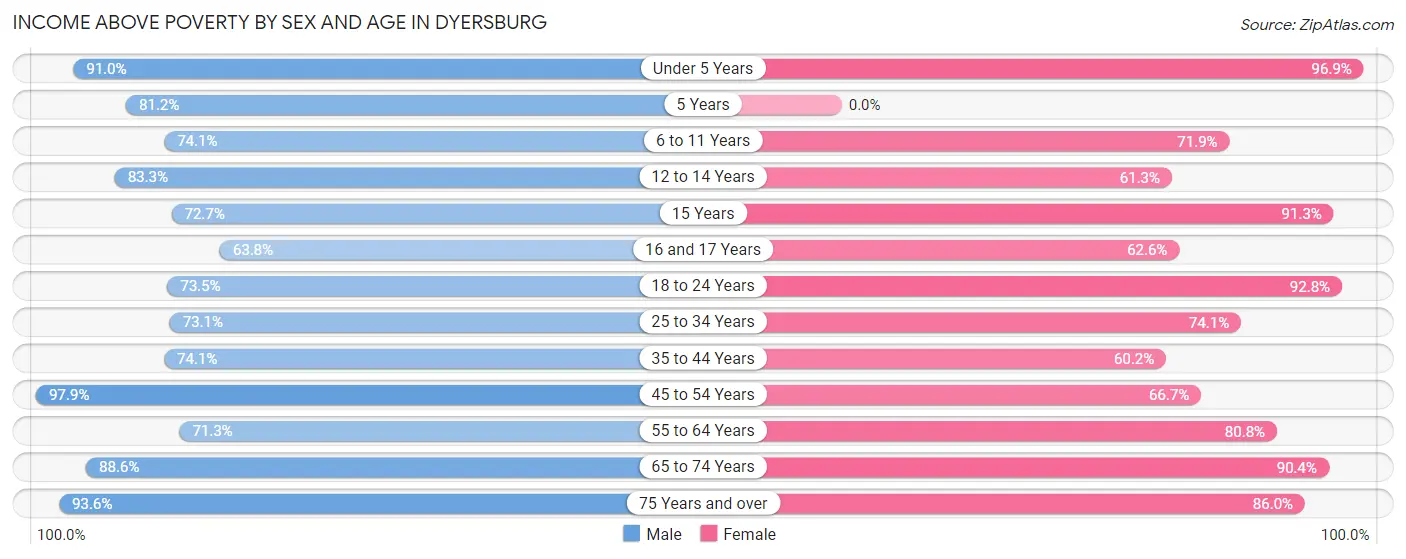
| Age Bracket | Male | Female |
| Under 5 Years | 332 (91.0%) | 524 (96.9%) |
| 5 Years | 125 (81.2%) | 0 (0.0%) |
| 6 to 11 Years | 706 (74.1%) | 441 (71.9%) |
| 12 to 14 Years | 194 (83.3%) | 136 (61.3%) |
| 15 Years | 48 (72.7%) | 262 (91.3%) |
| 16 and 17 Years | 102 (63.7%) | 134 (62.6%) |
| 18 to 24 Years | 577 (73.5%) | 349 (92.8%) |
| 25 to 34 Years | 583 (73.1%) | 724 (74.1%) |
| 35 to 44 Years | 518 (74.1%) | 570 (60.2%) |
| 45 to 54 Years | 1,064 (97.9%) | 771 (66.7%) |
| 55 to 64 Years | 617 (71.3%) | 919 (80.8%) |
| 65 to 74 Years | 737 (88.6%) | 959 (90.4%) |
| 75 Years and over | 249 (93.6%) | 673 (86.0%) |
| Total | 5,852 (80.6%) | 6,462 (77.3%) |
Income Below Poverty Among Married-Couple Families in Dyersburg
The poverty statistics for married-couple families in Dyersburg show that 5.8% or 140 of the total 2,400 families live below the poverty line. Families with 1 or 2 children have the highest poverty rate of 7.2%, comprising of 53 families. On the other hand, families with no children have the lowest poverty rate of 5.1%, which includes 78 families.
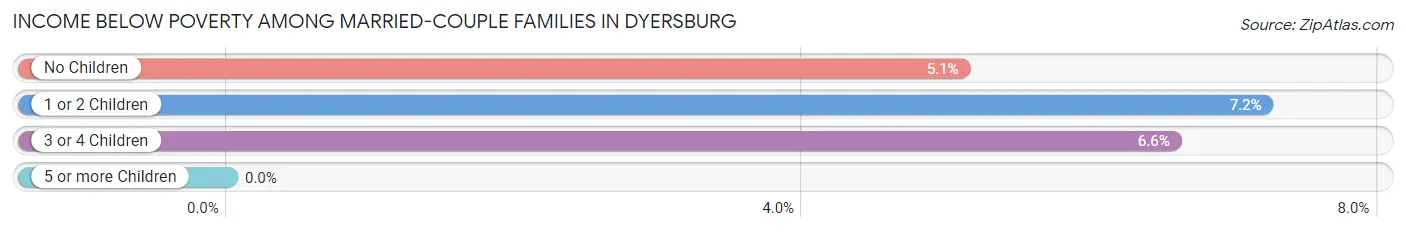
| Children | Above Poverty | Below Poverty |
| No Children | 1,450 (94.9%) | 78 (5.1%) |
| 1 or 2 Children | 682 (92.8%) | 53 (7.2%) |
| 3 or 4 Children | 128 (93.4%) | 9 (6.6%) |
| 5 or more Children | 0 (0.0%) | 0 (0.0%) |
| Total | 2,260 (94.2%) | 140 (5.8%) |
Income Below Poverty Among Single-Parent Households in Dyersburg
According to the poverty data in Dyersburg, 15.4% or 54 single-father households and 28.7% or 307 single-mother households are living below the poverty line. Among single-father households, those with no children have the highest poverty rate, with 23 households (18.2%) experiencing poverty. Likewise, among single-mother households, those with 5 or more children have the highest poverty rate, with 19 households (100.0%) falling below the poverty line.
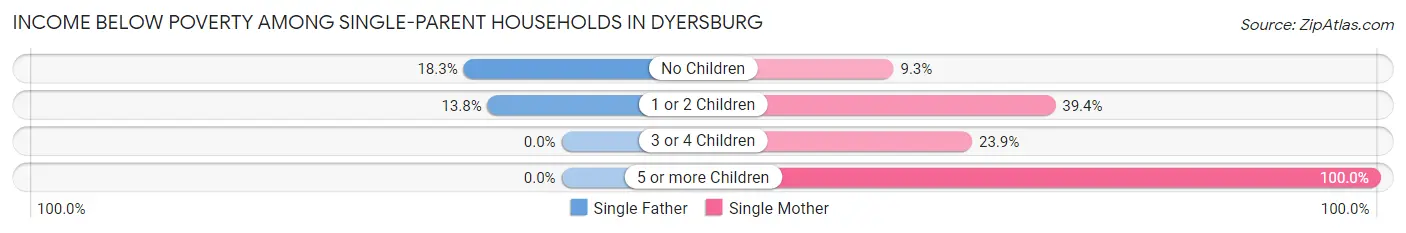
| Children | Single Father | Single Mother |
| No Children | 23 (18.2%) | 30 (9.3%) |
| 1 or 2 Children | 31 (13.8%) | 214 (39.4%) |
| 3 or 4 Children | 0 (0.0%) | 44 (23.9%) |
| 5 or more Children | 0 (0.0%) | 19 (100.0%) |
| Total | 54 (15.4%) | 307 (28.7%) |
Income Below Poverty Among Married-Couple vs Single-Parent Households in Dyersburg
The poverty data for Dyersburg shows that 140 of the married-couple family households (5.8%) and 361 of the single-parent households (25.4%) are living below the poverty level. Within the married-couple family households, those with 1 or 2 children have the highest poverty rate, with 53 households (7.2%) falling below the poverty line. Among the single-parent households, those with 5 or more children have the highest poverty rate, with 19 household (100.0%) living below poverty.
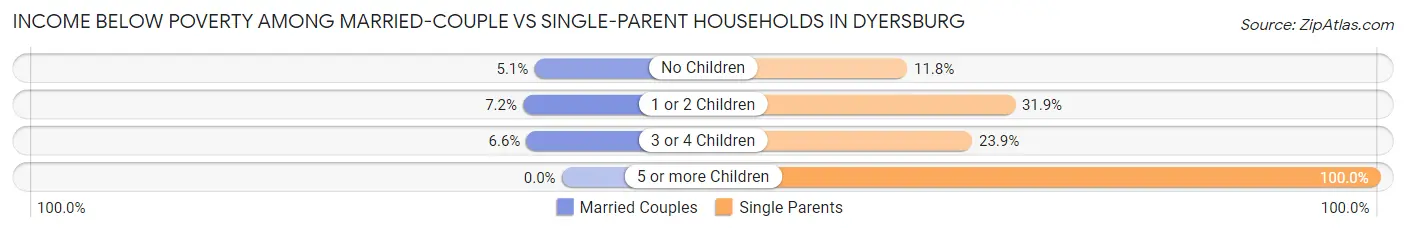
| Children | Married-Couple Families | Single-Parent Households |
| No Children | 78 (5.1%) | 53 (11.8%) |
| 1 or 2 Children | 53 (7.2%) | 245 (31.9%) |
| 3 or 4 Children | 9 (6.6%) | 44 (23.9%) |
| 5 or more Children | 0 (0.0%) | 19 (100.0%) |
| Total | 140 (5.8%) | 361 (25.4%) |
Race in Dyersburg
The most populous races in Dyersburg are White / Caucasian (11,116 | 68.7%), Black / African American (3,938 | 24.3%), and Two or more Races (911 | 5.6%).
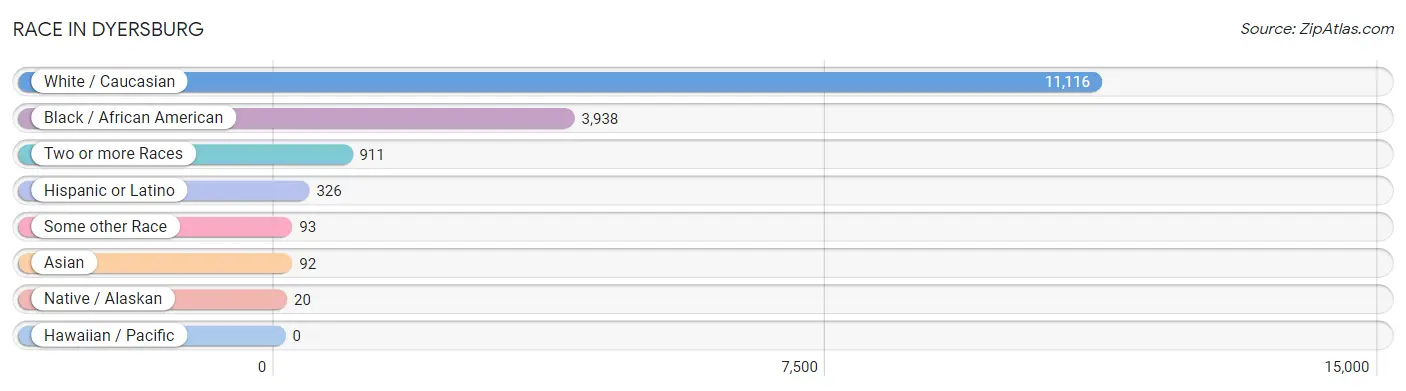
| Race | # Population | % Population |
| Asian | 92 | 0.6% |
| Black / African American | 3,938 | 24.3% |
| Hawaiian / Pacific | 0 | 0.0% |
| Hispanic or Latino | 326 | 2.0% |
| Native / Alaskan | 20 | 0.1% |
| White / Caucasian | 11,116 | 68.7% |
| Two or more Races | 911 | 5.6% |
| Some other Race | 93 | 0.6% |
| Total | 16,170 | 100.0% |
Ancestry in Dyersburg
The most populous ancestries reported in Dyersburg are Irish (2,249 | 13.9%), German (1,419 | 8.8%), American (1,381 | 8.5%), English (1,336 | 8.3%), and Scotch-Irish (470 | 2.9%), together accounting for 42.4% of all Dyersburg residents.
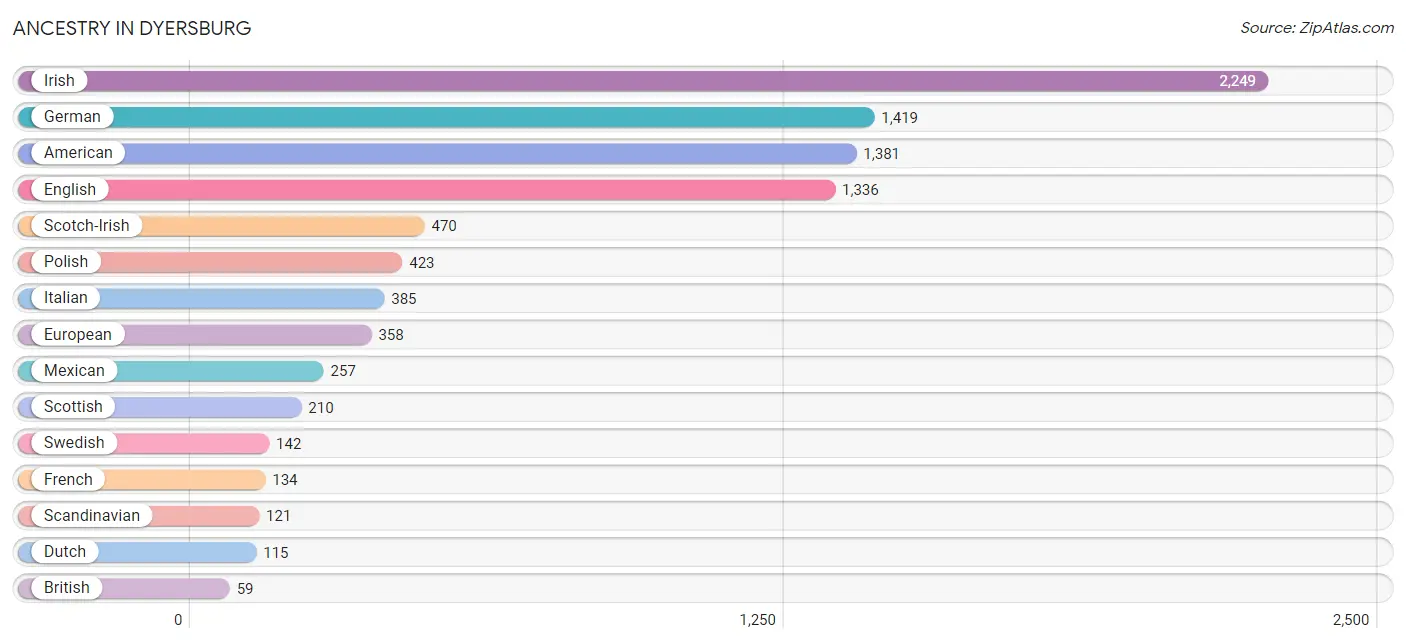
| Ancestry | # Population | % Population |
| African | 41 | 0.3% |
| American | 1,381 | 8.5% |
| Austrian | 12 | 0.1% |
| British | 59 | 0.4% |
| Central American | 10 | 0.1% |
| Central American Indian | 10 | 0.1% |
| Cherokee | 55 | 0.3% |
| Creek | 17 | 0.1% |
| Czechoslovakian | 28 | 0.2% |
| Dutch | 115 | 0.7% |
| English | 1,336 | 8.3% |
| European | 358 | 2.2% |
| French | 134 | 0.8% |
| French Canadian | 18 | 0.1% |
| German | 1,419 | 8.8% |
| Honduran | 10 | 0.1% |
| Hungarian | 14 | 0.1% |
| Indian (Asian) | 34 | 0.2% |
| Irish | 2,249 | 13.9% |
| Iroquois | 6 | 0.0% |
| Italian | 385 | 2.4% |
| Korean | 5 | 0.0% |
| Laotian | 16 | 0.1% |
| Mexican | 257 | 1.6% |
| Mexican American Indian | 10 | 0.1% |
| Navajo | 9 | 0.1% |
| Norwegian | 31 | 0.2% |
| Polish | 423 | 2.6% |
| Puerto Rican | 1 | 0.0% |
| Russian | 43 | 0.3% |
| Scandinavian | 121 | 0.7% |
| Scotch-Irish | 470 | 2.9% |
| Scottish | 210 | 1.3% |
| South American Indian | 10 | 0.1% |
| Spaniard | 58 | 0.4% |
| Sri Lankan | 58 | 0.4% |
| Subsaharan African | 41 | 0.3% |
| Swedish | 142 | 0.9% |
| Welsh | 20 | 0.1% | View All 39 Rows |
Immigrants in Dyersburg
The most numerous immigrant groups reported in Dyersburg came from Central America (173 | 1.1%), Latin America (173 | 1.1%), Mexico (173 | 1.1%), Asia (114 | 0.7%), and Africa (80 | 0.5%), together accounting for 4.4% of all Dyersburg residents.
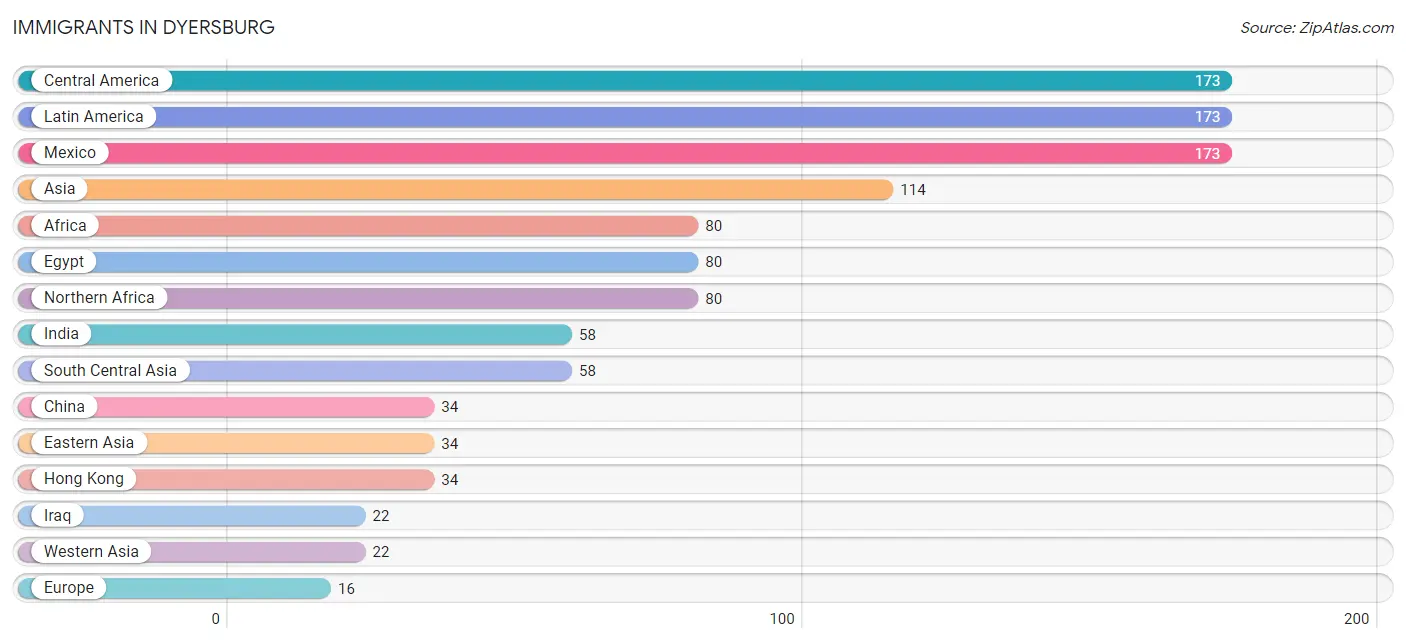
| Immigration Origin | # Population | % Population |
| Africa | 80 | 0.5% |
| Asia | 114 | 0.7% |
| Central America | 173 | 1.1% |
| China | 34 | 0.2% |
| Eastern Asia | 34 | 0.2% |
| Eastern Europe | 14 | 0.1% |
| Egypt | 80 | 0.5% |
| Europe | 16 | 0.1% |
| Germany | 2 | 0.0% |
| Hong Kong | 34 | 0.2% |
| Hungary | 14 | 0.1% |
| India | 58 | 0.4% |
| Iraq | 22 | 0.1% |
| Latin America | 173 | 1.1% |
| Mexico | 173 | 1.1% |
| Northern Africa | 80 | 0.5% |
| South Central Asia | 58 | 0.4% |
| Western Asia | 22 | 0.1% |
| Western Europe | 2 | 0.0% | View All 19 Rows |
Sex and Age in Dyersburg
Sex and Age in Dyersburg
The most populous age groups in Dyersburg are 5 to 9 Years (804 | 10.6%) for men and 25 to 29 Years (677 | 7.9%) for women.
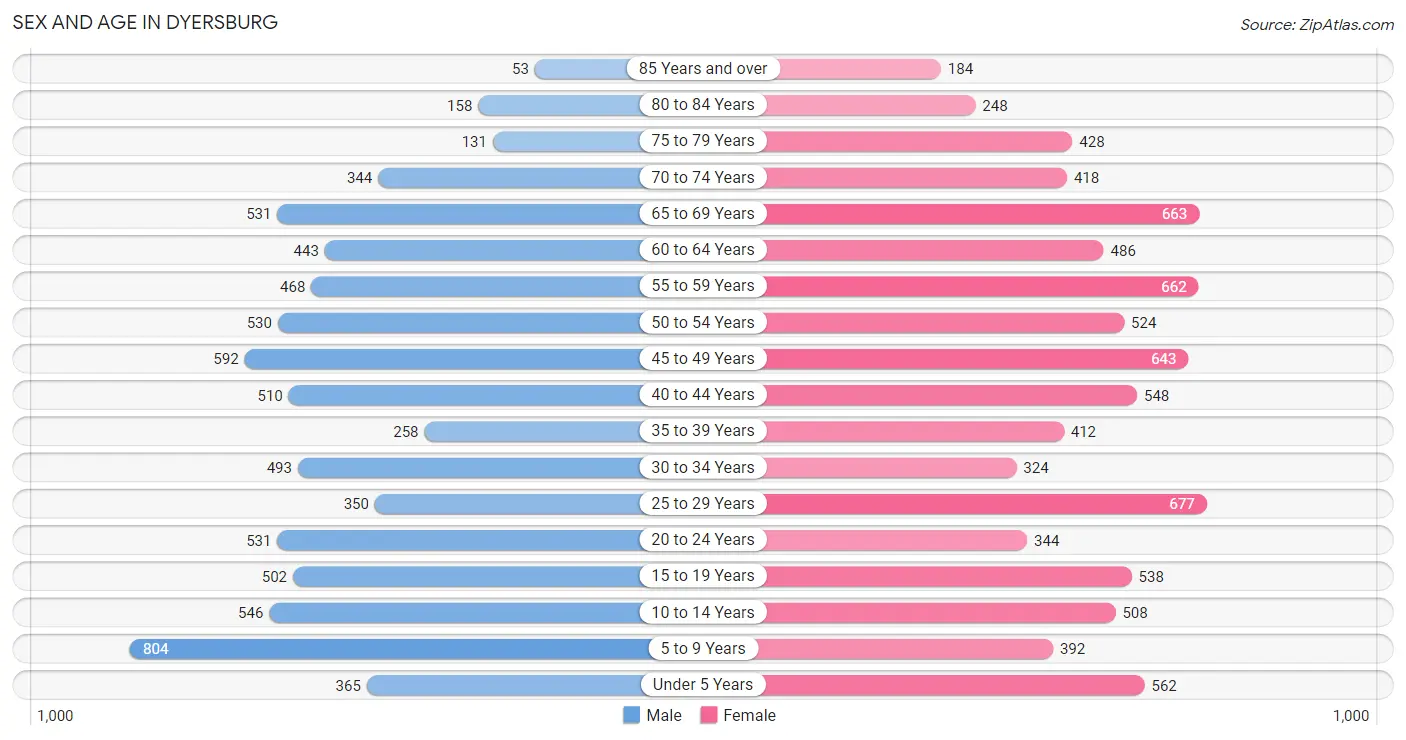
| Age Bracket | Male | Female |
| Under 5 Years | 365 (4.8%) | 562 (6.6%) |
| 5 to 9 Years | 804 (10.6%) | 392 (4.6%) |
| 10 to 14 Years | 546 (7.2%) | 508 (5.9%) |
| 15 to 19 Years | 502 (6.6%) | 538 (6.3%) |
| 20 to 24 Years | 531 (7.0%) | 344 (4.0%) |
| 25 to 29 Years | 350 (4.6%) | 677 (7.9%) |
| 30 to 34 Years | 493 (6.5%) | 324 (3.8%) |
| 35 to 39 Years | 258 (3.4%) | 412 (4.8%) |
| 40 to 44 Years | 510 (6.7%) | 548 (6.4%) |
| 45 to 49 Years | 592 (7.8%) | 643 (7.5%) |
| 50 to 54 Years | 530 (7.0%) | 524 (6.1%) |
| 55 to 59 Years | 468 (6.1%) | 662 (7.7%) |
| 60 to 64 Years | 443 (5.8%) | 486 (5.7%) |
| 65 to 69 Years | 531 (7.0%) | 663 (7.7%) |
| 70 to 74 Years | 344 (4.5%) | 418 (4.9%) |
| 75 to 79 Years | 131 (1.7%) | 428 (5.0%) |
| 80 to 84 Years | 158 (2.1%) | 248 (2.9%) |
| 85 Years and over | 53 (0.7%) | 184 (2.1%) |
| Total | 7,609 (100.0%) | 8,561 (100.0%) |
Families and Households in Dyersburg
Median Family Size in Dyersburg
The median family size in Dyersburg is 3.17 persons per family, with single male/father families (351 | 9.2%) accounting for the largest median family size of 3.66 persons per family. On the other hand, married-couple families (2,400 | 62.8%) represent the smallest median family size with 2.95 persons per family.
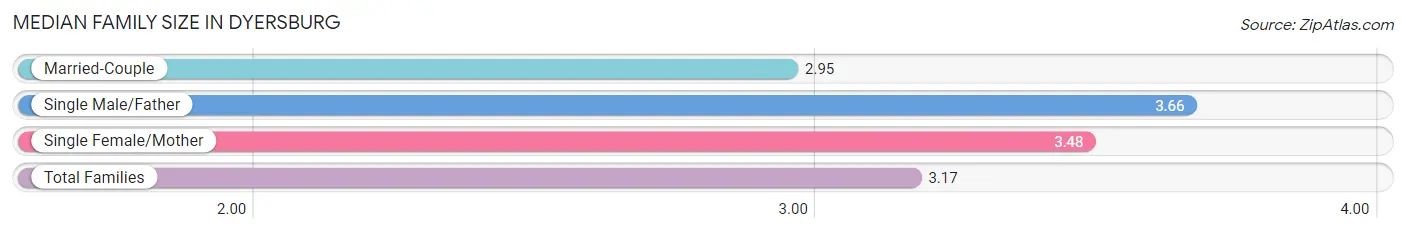
| Family Type | # Families | Family Size |
| Married-Couple | 2,400 (62.8%) | 2.95 |
| Single Male/Father | 351 (9.2%) | 3.66 |
| Single Female/Mother | 1,069 (28.0%) | 3.48 |
| Total Families | 3,820 (100.0%) | 3.17 |
Median Household Size in Dyersburg
The median household size in Dyersburg is 2.35 persons per household, with single male/father households (351 | 5.3%) accounting for the largest median household size of 3.89 persons per household. non-family households (2,815 | 42.4%) represent the smallest median household size with 1.16 persons per household.
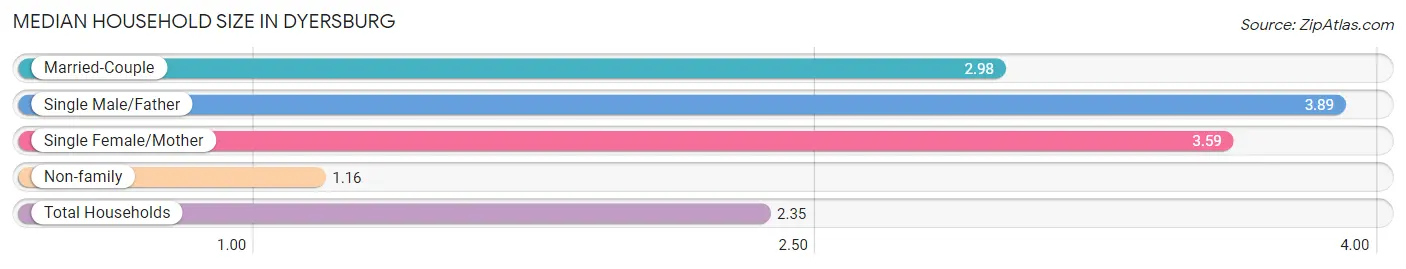
| Household Type | # Households | Household Size |
| Married-Couple | 2,400 (36.2%) | 2.98 |
| Single Male/Father | 351 (5.3%) | 3.89 |
| Single Female/Mother | 1,069 (16.1%) | 3.59 |
| Non-family | 2,815 (42.4%) | 1.16 |
| Total Households | 6,635 (100.0%) | 2.35 |
Household Size by Marriage Status in Dyersburg
Out of a total of 6,635 households in Dyersburg, 3,820 (57.6%) are family households, while 2,815 (42.4%) are nonfamily households. The most numerous type of family households are 2-person households, comprising 2,040, and the most common type of nonfamily households are 1-person households, comprising 2,557.
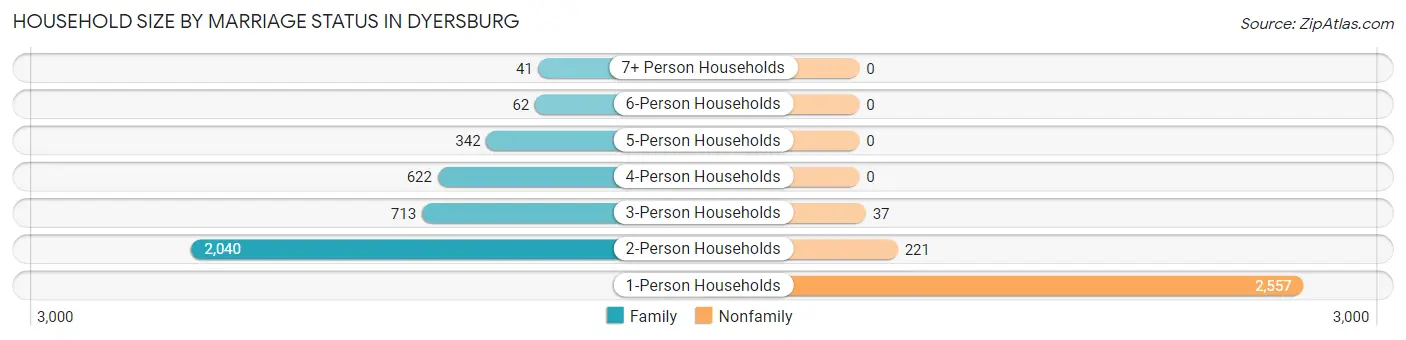
| Household Size | Family Households | Nonfamily Households |
| 1-Person Households | - | 2,557 (38.5%) |
| 2-Person Households | 2,040 (30.7%) | 221 (3.3%) |
| 3-Person Households | 713 (10.7%) | 37 (0.6%) |
| 4-Person Households | 622 (9.4%) | 0 (0.0%) |
| 5-Person Households | 342 (5.1%) | 0 (0.0%) |
| 6-Person Households | 62 (0.9%) | 0 (0.0%) |
| 7+ Person Households | 41 (0.6%) | 0 (0.0%) |
| Total | 3,820 (57.6%) | 2,815 (42.4%) |
Female Fertility in Dyersburg
Fertility by Age in Dyersburg
Average fertility rate in Dyersburg is 58.0 births per 1,000 women. Women in the age bracket of 15 to 19 years have the highest fertility rate with 106.0 births per 1,000 women. Women in the age bracket of 35 to 50 years acount for 41.7% of all women with births.
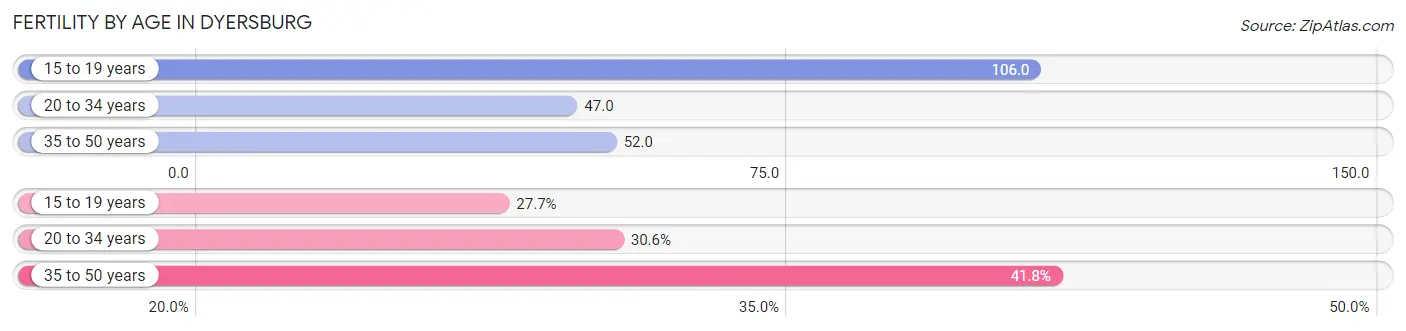
| Age Bracket | Women with Births | Births / 1,000 Women |
| 15 to 19 years | 57 (27.7%) | 106.0 |
| 20 to 34 years | 63 (30.6%) | 47.0 |
| 35 to 50 years | 86 (41.7%) | 52.0 |
| Total | 206 (100.0%) | 58.0 |
Fertility by Age by Marriage Status in Dyersburg
72.3% of women with births (206) in Dyersburg are married. The highest percentage of unmarried women with births falls into 15 to 19 years age bracket with 100.0% of them unmarried at the time of birth, while the lowest percentage of unmarried women with births belong to 20 to 34 years age bracket with 0.0% of them unmarried.
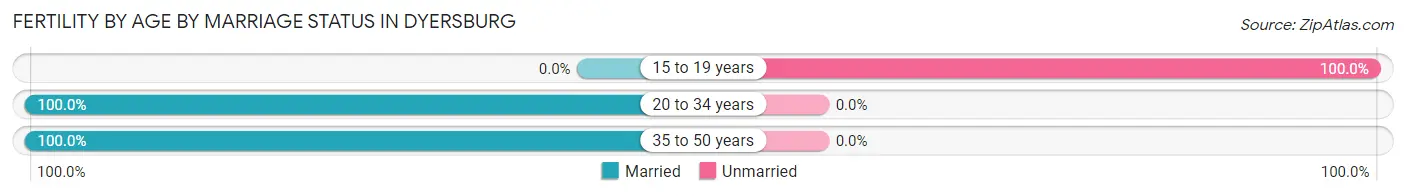
| Age Bracket | Married | Unmarried |
| 15 to 19 years | 0 (0.0%) | 57 (100.0%) |
| 20 to 34 years | 63 (100.0%) | 0 (0.0%) |
| 35 to 50 years | 86 (100.0%) | 0 (0.0%) |
| Total | 149 (72.3%) | 57 (27.7%) |
Fertility by Education in Dyersburg
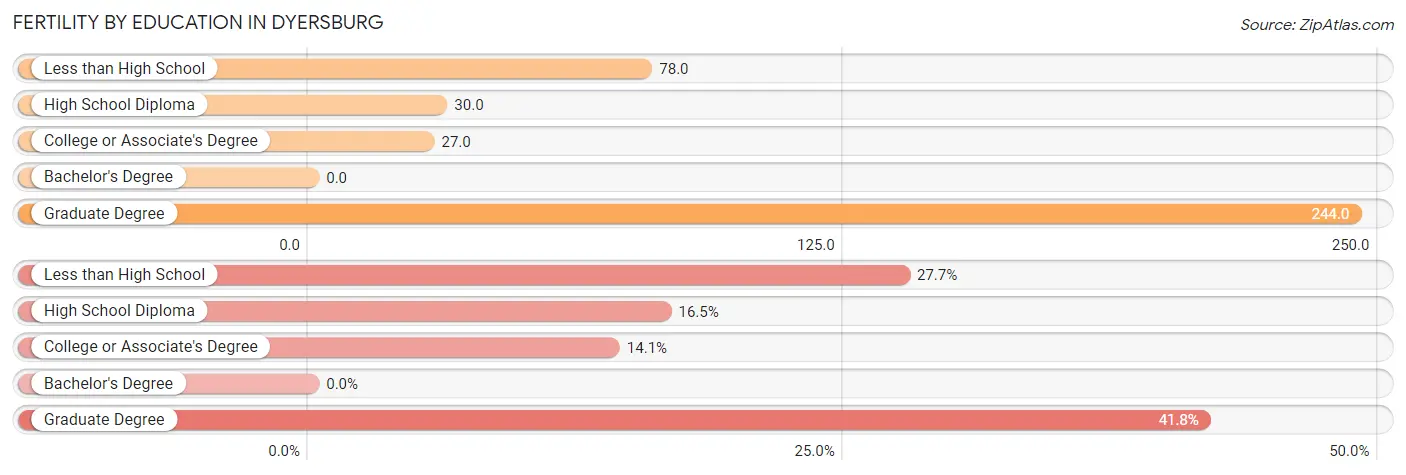
| Educational Attainment | Women with Births | Births / 1,000 Women |
| Less than High School | 57 (27.7%) | 78.0 |
| High School Diploma | 34 (16.5%) | 30.0 |
| College or Associate's Degree | 29 (14.1%) | 27.0 |
| Bachelor's Degree | 0 (0.0%) | 0.0 |
| Graduate Degree | 86 (41.7%) | 244.0 |
| Total | 206 (100.0%) | 58.0 |
Fertility by Education by Marriage Status in Dyersburg
27.7% of women with births in Dyersburg are unmarried. Women with the educational attainment of high school diploma are most likely to be married with 100.0% of them married at childbirth, while women with the educational attainment of less than high school are least likely to be married with 100.0% of them unmarried at childbirth.
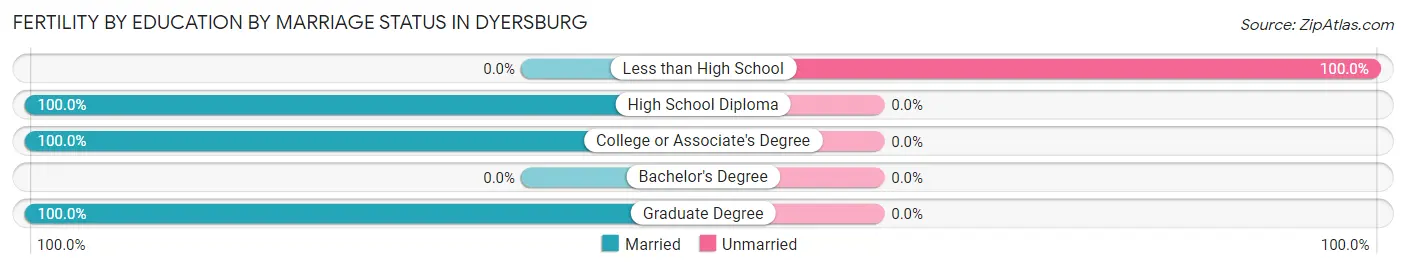
| Educational Attainment | Married | Unmarried |
| Less than High School | 0 (0.0%) | 57 (100.0%) |
| High School Diploma | 34 (100.0%) | 0 (0.0%) |
| College or Associate's Degree | 29 (100.0%) | 0 (0.0%) |
| Bachelor's Degree | 0 (0.0%) | 0 (0.0%) |
| Graduate Degree | 86 (100.0%) | 0 (0.0%) |
| Total | 149 (72.3%) | 57 (27.7%) |
Employment Characteristics in Dyersburg
Employment by Class of Employer in Dyersburg
Among the 6,403 employed individuals in Dyersburg, private company employees (4,445 | 69.4%), local government employees (435 | 6.8%), and self-employed (incorporated) (414 | 6.5%) make up the most common classes of employment.
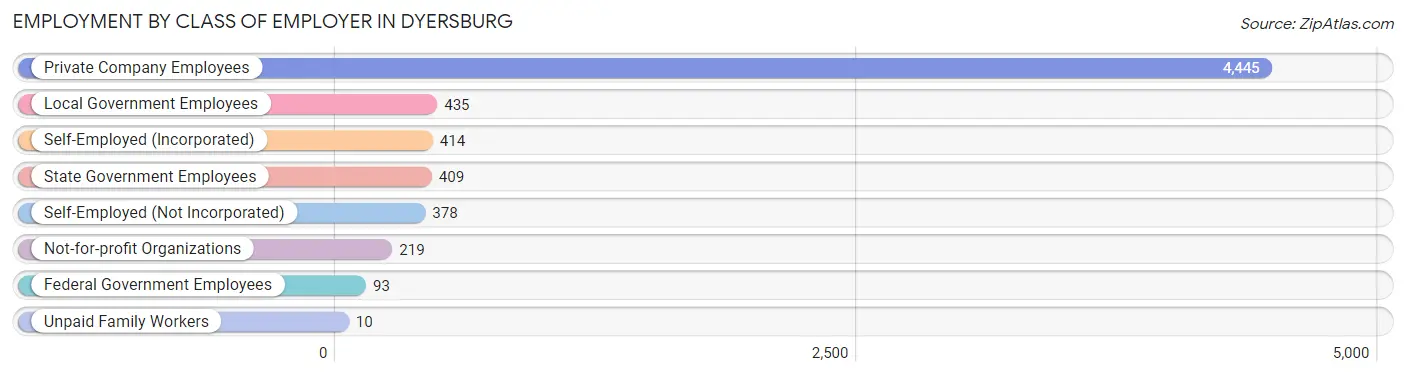
| Employer Class | # Employees | % Employees |
| Private Company Employees | 4,445 | 69.4% |
| Self-Employed (Incorporated) | 414 | 6.5% |
| Self-Employed (Not Incorporated) | 378 | 5.9% |
| Not-for-profit Organizations | 219 | 3.4% |
| Local Government Employees | 435 | 6.8% |
| State Government Employees | 409 | 6.4% |
| Federal Government Employees | 93 | 1.5% |
| Unpaid Family Workers | 10 | 0.2% |
| Total | 6,403 | 100.0% |
Employment Status by Age in Dyersburg
According to the labor force statistics for Dyersburg, out of the total population over 16 years of age (12,637), 54.8% or 6,925 individuals are in the labor force, with 6.5% or 450 of them unemployed. The age group with the highest labor force participation rate is 30 to 34 years, with 85.2% or 696 individuals in the labor force. Within the labor force, the 16 to 19 years age range has the highest percentage of unemployed individuals, with 11.1% or 36 of them being unemployed.
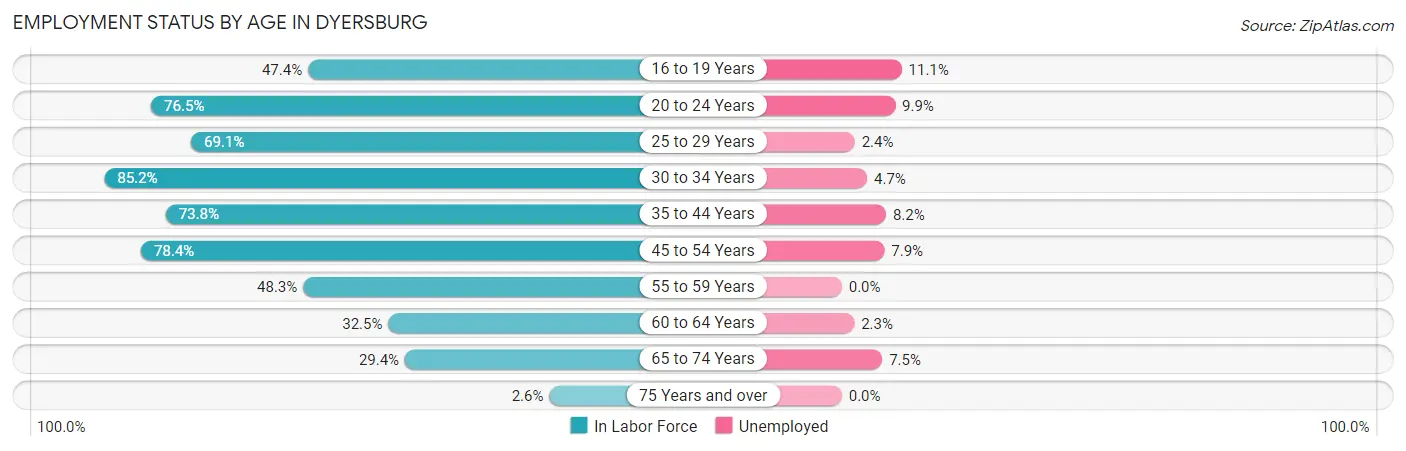
| Age Bracket | In Labor Force | Unemployed |
| 16 to 19 Years | 324 (47.4%) | 36 (11.1%) |
| 20 to 24 Years | 669 (76.5%) | 66 (9.9%) |
| 25 to 29 Years | 710 (69.1%) | 17 (2.4%) |
| 30 to 34 Years | 696 (85.2%) | 33 (4.7%) |
| 35 to 44 Years | 1,275 (73.8%) | 105 (8.2%) |
| 45 to 54 Years | 1,795 (78.4%) | 142 (7.9%) |
| 55 to 59 Years | 546 (48.3%) | 0 (0.0%) |
| 60 to 64 Years | 302 (32.5%) | 7 (2.3%) |
| 65 to 74 Years | 575 (29.4%) | 43 (7.5%) |
| 75 Years and over | 31 (2.6%) | 0 (0.0%) |
| Total | 6,925 (54.8%) | 450 (6.5%) |
Employment Status by Educational Attainment in Dyersburg
According to labor force statistics for Dyersburg, 67.2% of individuals (5,322) out of the total population between 25 and 64 years of age (7,920) are in the labor force, with 5.7% or 303 of them being unemployed. The group with the highest labor force participation rate are those with the educational attainment of bachelor's degree or higher, with 90.5% or 1,516 individuals in the labor force. Within the labor force, individuals with less than high school education have the highest percentage of unemployment, with 20.8% or 53 of them being unemployed.
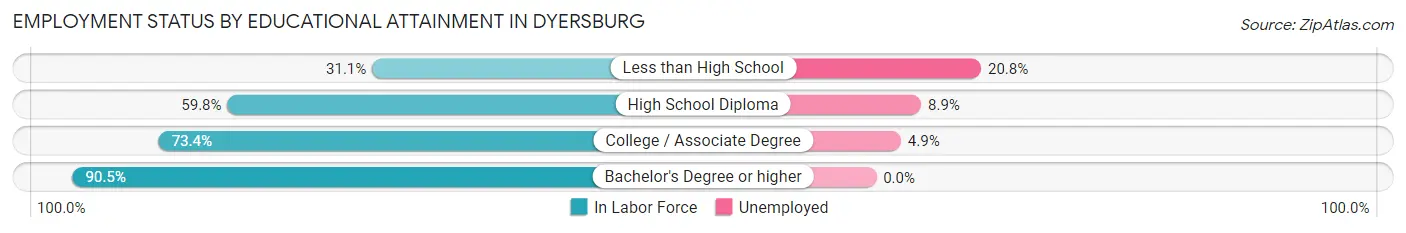
| Educational Attainment | In Labor Force | Unemployed |
| Less than High School | 255 (31.1%) | 170 (20.8%) |
| High School Diploma | 1,896 (59.8%) | 282 (8.9%) |
| College / Associate Degree | 1,656 (73.4%) | 111 (4.9%) |
| Bachelor's Degree or higher | 1,516 (90.5%) | 0 (0.0%) |
| Total | 5,322 (67.2%) | 451 (5.7%) |
Employment Occupations by Sex in Dyersburg
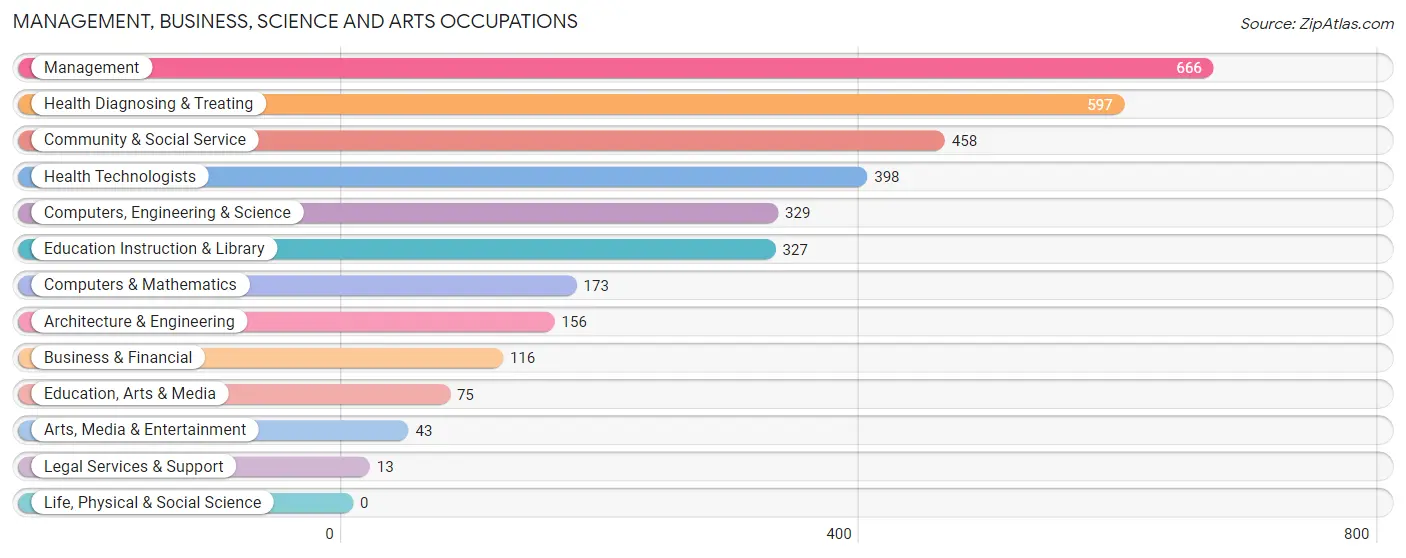
Management, Business, Science and Arts Occupations
The most common Management, Business, Science and Arts occupations in Dyersburg are Management (666 | 10.3%), Health Diagnosing & Treating (597 | 9.2%), Community & Social Service (458 | 7.1%), Health Technologists (398 | 6.1%), and Computers, Engineering & Science (329 | 5.1%).
Management, Business, Science and Arts Occupations by Sex
Within the Management, Business, Science and Arts occupations in Dyersburg, the most male-oriented occupations are Computers & Mathematics (82.1%), Computers, Engineering & Science (68.7%), and Management (59.0%), while the most female-oriented occupations are Legal Services & Support (100.0%), Arts, Media & Entertainment (100.0%), and Community & Social Service (67.9%).
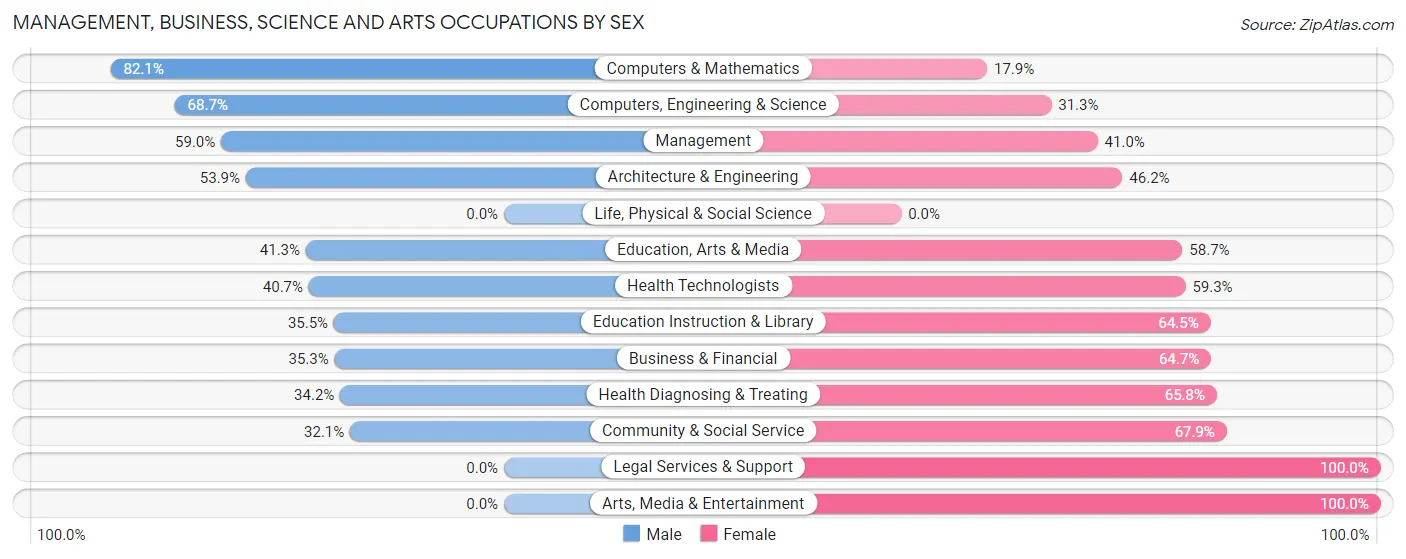
| Occupation | Male | Female |
| Management | 393 (59.0%) | 273 (41.0%) |
| Business & Financial | 41 (35.3%) | 75 (64.7%) |
| Computers, Engineering & Science | 226 (68.7%) | 103 (31.3%) |
| Computers & Mathematics | 142 (82.1%) | 31 (17.9%) |
| Architecture & Engineering | 84 (53.8%) | 72 (46.2%) |
| Life, Physical & Social Science | 0 (0.0%) | 0 (0.0%) |
| Community & Social Service | 147 (32.1%) | 311 (67.9%) |
| Education, Arts & Media | 31 (41.3%) | 44 (58.7%) |
| Legal Services & Support | 0 (0.0%) | 13 (100.0%) |
| Education Instruction & Library | 116 (35.5%) | 211 (64.5%) |
| Arts, Media & Entertainment | 0 (0.0%) | 43 (100.0%) |
| Health Diagnosing & Treating | 204 (34.2%) | 393 (65.8%) |
| Health Technologists | 162 (40.7%) | 236 (59.3%) |
| Total (Category) | 1,011 (46.7%) | 1,155 (53.3%) |
| Total (Overall) | 3,317 (51.2%) | 3,155 (48.7%) |
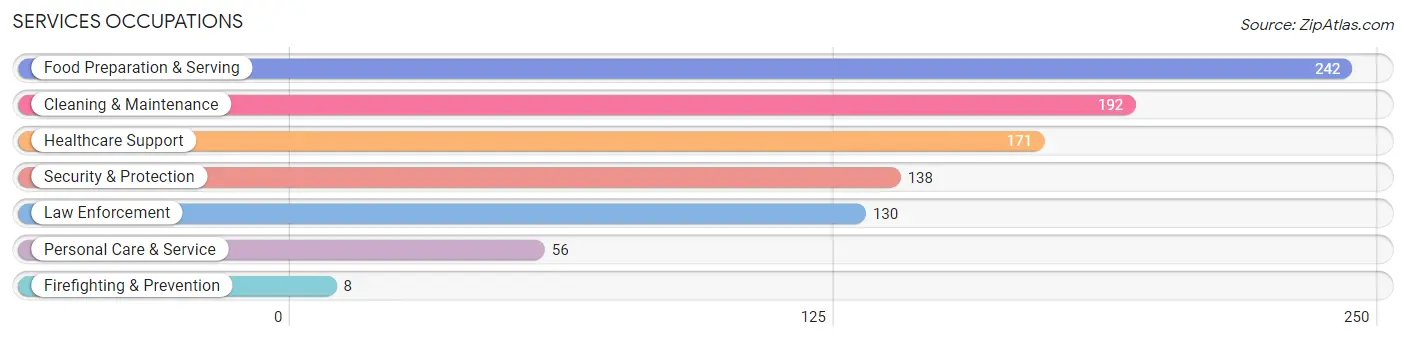
Services Occupations
The most common Services occupations in Dyersburg are Food Preparation & Serving (242 | 3.7%), Cleaning & Maintenance (192 | 3.0%), Healthcare Support (171 | 2.6%), Security & Protection (138 | 2.1%), and Law Enforcement (130 | 2.0%).
Services Occupations by Sex
Within the Services occupations in Dyersburg, the most male-oriented occupations are Law Enforcement (66.1%), Cleaning & Maintenance (64.6%), and Security & Protection (62.3%), while the most female-oriented occupations are Firefighting & Prevention (100.0%), Healthcare Support (91.2%), and Personal Care & Service (85.7%).
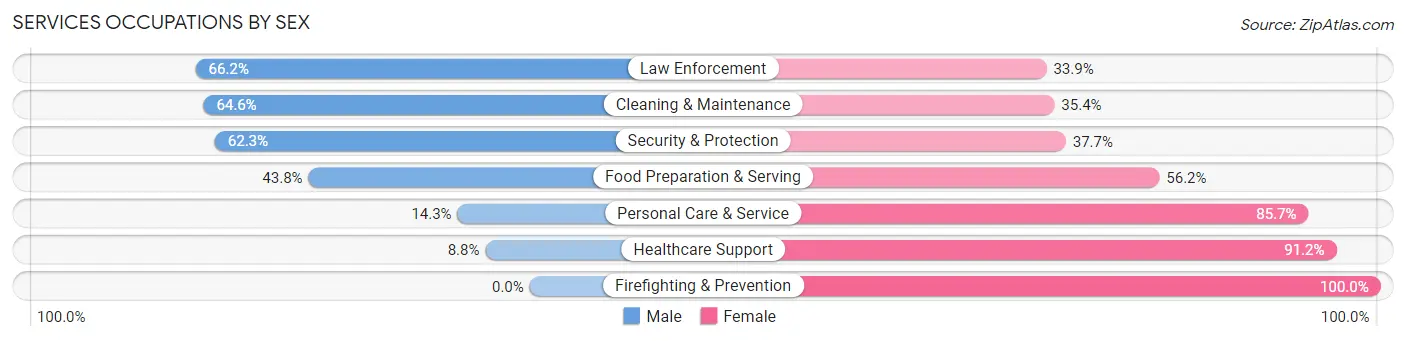
| Occupation | Male | Female |
| Healthcare Support | 15 (8.8%) | 156 (91.2%) |
| Security & Protection | 86 (62.3%) | 52 (37.7%) |
| Firefighting & Prevention | 0 (0.0%) | 8 (100.0%) |
| Law Enforcement | 86 (66.1%) | 44 (33.9%) |
| Food Preparation & Serving | 106 (43.8%) | 136 (56.2%) |
| Cleaning & Maintenance | 124 (64.6%) | 68 (35.4%) |
| Personal Care & Service | 8 (14.3%) | 48 (85.7%) |
| Total (Category) | 339 (42.4%) | 460 (57.6%) |
| Total (Overall) | 3,317 (51.2%) | 3,155 (48.7%) |
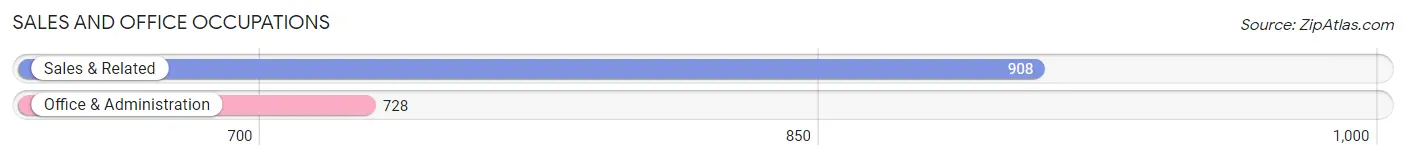
Sales and Office Occupations
The most common Sales and Office occupations in Dyersburg are Sales & Related (908 | 14.0%), and Office & Administration (728 | 11.3%).
Sales and Office Occupations by Sex
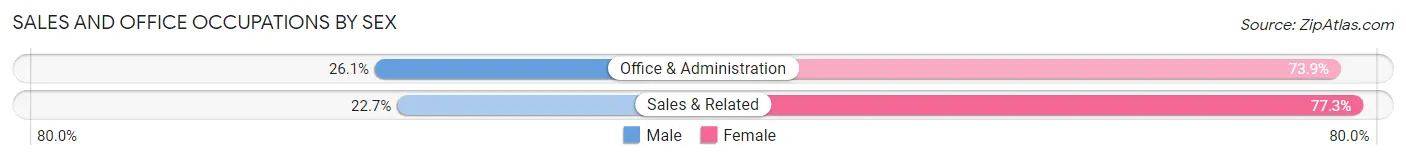
| Occupation | Male | Female |
| Sales & Related | 206 (22.7%) | 702 (77.3%) |
| Office & Administration | 190 (26.1%) | 538 (73.9%) |
| Total (Category) | 396 (24.2%) | 1,240 (75.8%) |
| Total (Overall) | 3,317 (51.2%) | 3,155 (48.7%) |
Natural Resources, Construction and Maintenance Occupations
The most common Natural Resources, Construction and Maintenance occupations in Dyersburg are Construction & Extraction (302 | 4.7%), and Installation, Maintenance & Repair (222 | 3.4%).
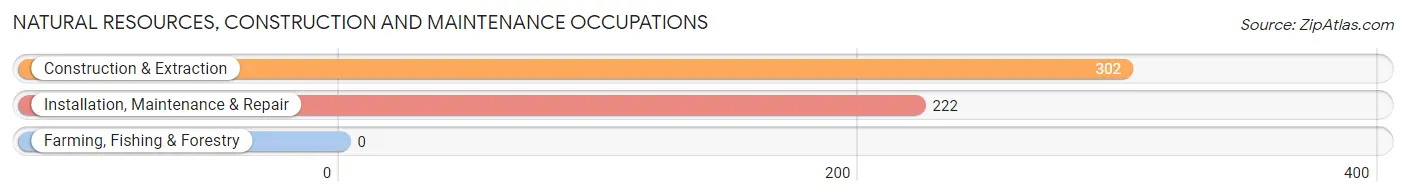
Natural Resources, Construction and Maintenance Occupations by Sex
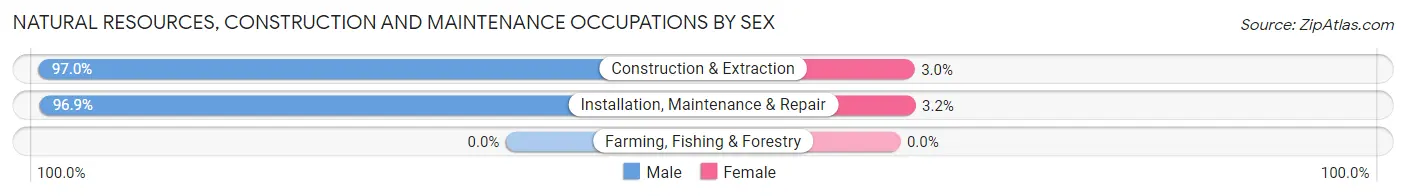
| Occupation | Male | Female |
| Farming, Fishing & Forestry | 0 (0.0%) | 0 (0.0%) |
| Construction & Extraction | 293 (97.0%) | 9 (3.0%) |
| Installation, Maintenance & Repair | 215 (96.9%) | 7 (3.2%) |
| Total (Category) | 508 (97.0%) | 16 (3.0%) |
| Total (Overall) | 3,317 (51.2%) | 3,155 (48.7%) |
Production, Transportation and Moving Occupations
The most common Production, Transportation and Moving occupations in Dyersburg are Production (816 | 12.6%), Material Moving (309 | 4.8%), and Transportation (222 | 3.4%).
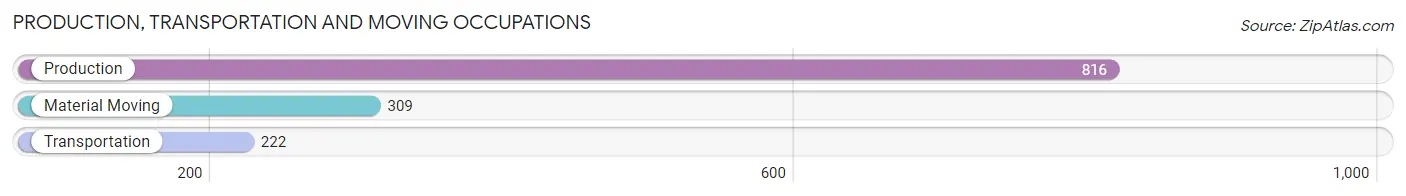
Production, Transportation and Moving Occupations by Sex
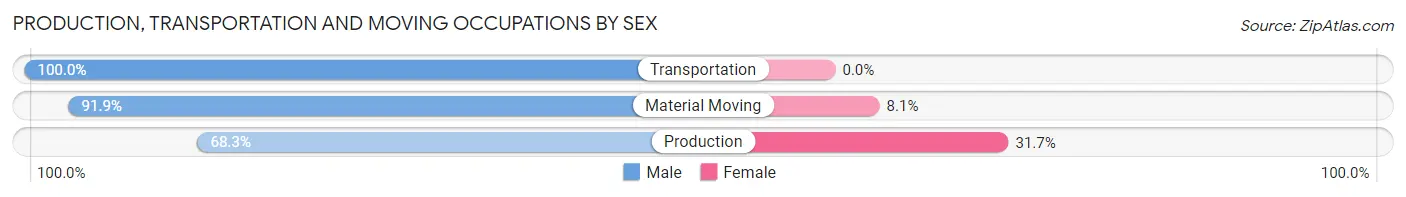
| Occupation | Male | Female |
| Production | 557 (68.3%) | 259 (31.7%) |
| Transportation | 222 (100.0%) | 0 (0.0%) |
| Material Moving | 284 (91.9%) | 25 (8.1%) |
| Total (Category) | 1,063 (78.9%) | 284 (21.1%) |
| Total (Overall) | 3,317 (51.2%) | 3,155 (48.7%) |
Employment Industries by Sex in Dyersburg
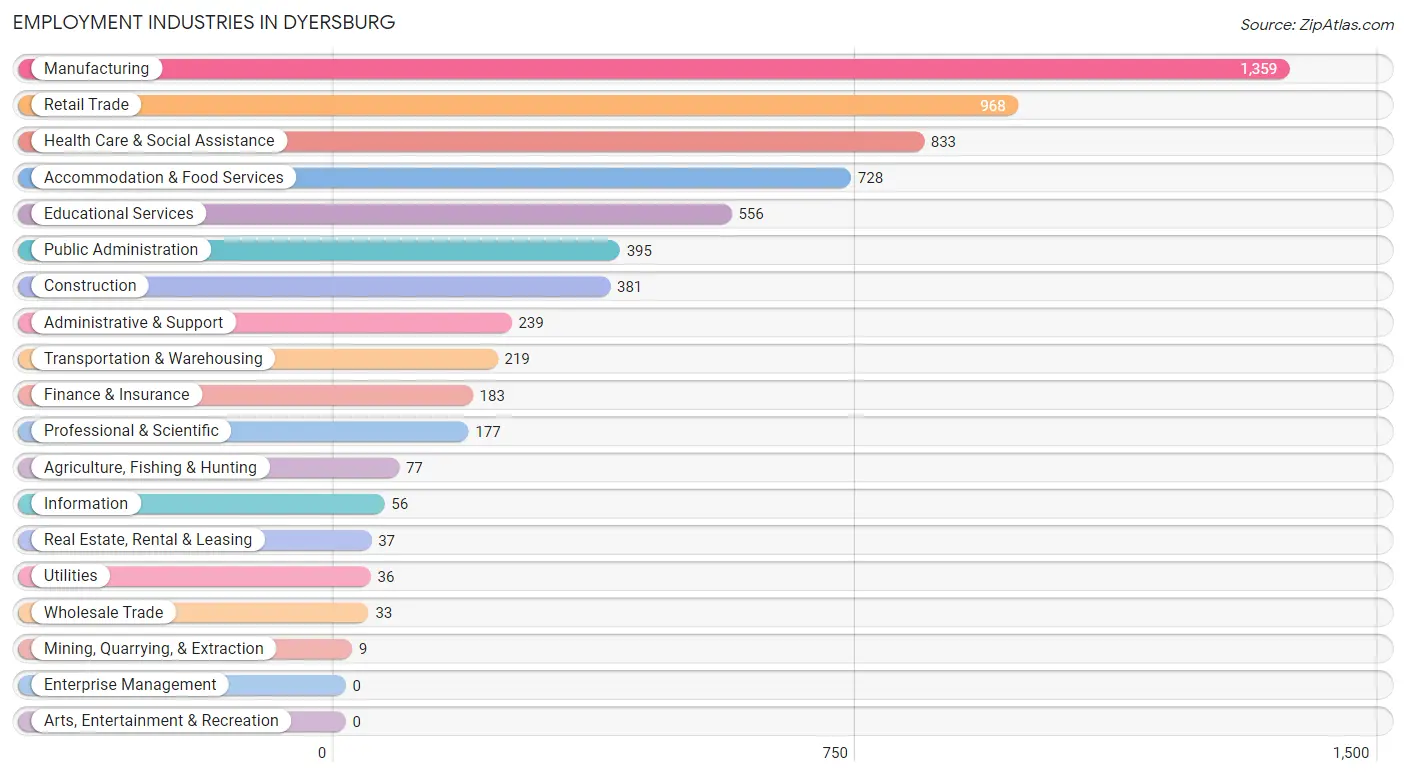
Employment Industries in Dyersburg
The major employment industries in Dyersburg include Manufacturing (1,359 | 21.0%), Retail Trade (968 | 15.0%), Health Care & Social Assistance (833 | 12.9%), Accommodation & Food Services (728 | 11.3%), and Educational Services (556 | 8.6%).
Employment Industries by Sex in Dyersburg
The Dyersburg industries that see more men than women are Agriculture, Fishing & Hunting (100.0%), Wholesale Trade (100.0%), and Utilities (100.0%), whereas the industries that tend to have a higher number of women are Mining, Quarrying, & Extraction (100.0%), Real Estate, Rental & Leasing (100.0%), and Educational Services (80.9%).
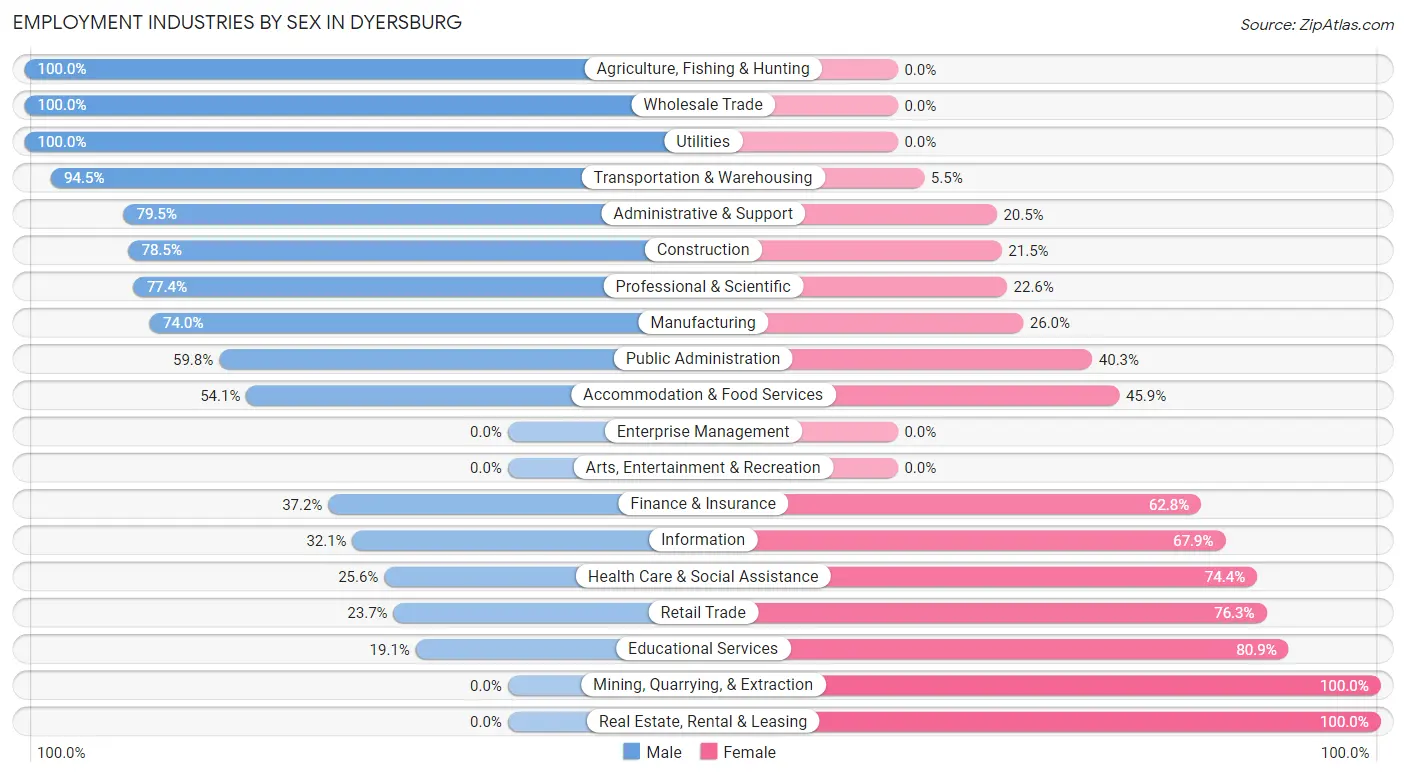
| Industry | Male | Female |
| Agriculture, Fishing & Hunting | 77 (100.0%) | 0 (0.0%) |
| Mining, Quarrying, & Extraction | 0 (0.0%) | 9 (100.0%) |
| Construction | 299 (78.5%) | 82 (21.5%) |
| Manufacturing | 1,006 (74.0%) | 353 (26.0%) |
| Wholesale Trade | 33 (100.0%) | 0 (0.0%) |
| Retail Trade | 229 (23.7%) | 739 (76.3%) |
| Transportation & Warehousing | 207 (94.5%) | 12 (5.5%) |
| Utilities | 36 (100.0%) | 0 (0.0%) |
| Information | 18 (32.1%) | 38 (67.9%) |
| Finance & Insurance | 68 (37.2%) | 115 (62.8%) |
| Real Estate, Rental & Leasing | 0 (0.0%) | 37 (100.0%) |
| Professional & Scientific | 137 (77.4%) | 40 (22.6%) |
| Enterprise Management | 0 (0.0%) | 0 (0.0%) |
| Administrative & Support | 190 (79.5%) | 49 (20.5%) |
| Educational Services | 106 (19.1%) | 450 (80.9%) |
| Health Care & Social Assistance | 213 (25.6%) | 620 (74.4%) |
| Arts, Entertainment & Recreation | 0 (0.0%) | 0 (0.0%) |
| Accommodation & Food Services | 394 (54.1%) | 334 (45.9%) |
| Public Administration | 236 (59.8%) | 159 (40.3%) |
| Total | 3,317 (51.2%) | 3,155 (48.7%) |
Education in Dyersburg
School Enrollment in Dyersburg
The most common levels of schooling among the 3,826 students in Dyersburg are elementary school (1,029 | 26.9%), middle school (803 | 21.0%), and high school (787 | 20.6%).
| School Level | # Students | % Students |
| Nursery / Preschool | 245 | 6.4% |
| Kindergarten | 264 | 6.9% |
| Elementary School | 1,029 | 26.9% |
| Middle School | 803 | 21.0% |
| High School | 787 | 20.6% |
| College / Undergraduate | 617 | 16.1% |
| Graduate / Professional | 81 | 2.1% |
| Total | 3,826 | 100.0% |
School Enrollment by Age by Funding Source in Dyersburg
Out of a total of 3,826 students who are enrolled in schools in Dyersburg, 696 (18.2%) attend a private institution, while the remaining 3,130 (81.8%) are enrolled in public schools. The age group of 3 to 4 year olds has the highest likelihood of being enrolled in private schools, with 92 (41.4% in the age bracket) enrolled. Conversely, the age group of 20 to 24 year olds has the lowest likelihood of being enrolled in a private school, with 110 (100.0% in the age bracket) attending a public institution.
| Age Bracket | Public School | Private School |
| 3 to 4 Year Olds | 130 (58.6%) | 92 (41.4%) |
| 5 to 9 Year Old | 929 (86.5%) | 145 (13.5%) |
| 10 to 14 Year Olds | 907 (88.3%) | 120 (11.7%) |
| 15 to 17 Year Olds | 524 (71.2%) | 212 (28.8%) |
| 18 to 19 Year Olds | 115 (82.1%) | 25 (17.9%) |
| 20 to 24 Year Olds | 110 (100.0%) | 0 (0.0%) |
| 25 to 34 Year Olds | 168 (71.8%) | 66 (28.2%) |
| 35 Years and over | 248 (87.6%) | 35 (12.4%) |
| Total | 3,130 (81.8%) | 696 (18.2%) |
Educational Attainment by Field of Study in Dyersburg
Business (673 | 24.4%), science & technology (397 | 14.4%), education (370 | 13.4%), bio, nature & agricultural (289 | 10.5%), and visual & performing arts (256 | 9.3%) are the most common fields of study among 2,761 individuals in Dyersburg who have obtained a bachelor's degree or higher.
| Field of Study | # Graduates | % Graduates |
| Computers & Mathematics | 108 | 3.9% |
| Bio, Nature & Agricultural | 289 | 10.5% |
| Physical & Health Sciences | 99 | 3.6% |
| Psychology | 109 | 4.0% |
| Social Sciences | 58 | 2.1% |
| Engineering | 237 | 8.6% |
| Multidisciplinary Studies | 0 | 0.0% |
| Science & Technology | 397 | 14.4% |
| Business | 673 | 24.4% |
| Education | 370 | 13.4% |
| Literature & Languages | 25 | 0.9% |
| Liberal Arts & History | 50 | 1.8% |
| Visual & Performing Arts | 256 | 9.3% |
| Communications | 6 | 0.2% |
| Arts & Humanities | 84 | 3.0% |
| Total | 2,761 | 100.0% |
Transportation & Commute in Dyersburg
Vehicle Availability by Sex in Dyersburg
The most prevalent vehicle ownership categories in Dyersburg are males with 2 vehicles (1,478, accounting for 45.0%) and females with 2 vehicles (1,518, making up 47.6%).
| Vehicles Available | Male | Female |
| No Vehicle | 104 (3.2%) | 51 (1.6%) |
| 1 Vehicle | 839 (25.5%) | 837 (27.0%) |
| 2 Vehicles | 1,478 (45.0%) | 1,518 (48.9%) |
| 3 Vehicles | 483 (14.7%) | 469 (15.1%) |
| 4 Vehicles | 384 (11.7%) | 228 (7.3%) |
| 5 or more Vehicles | 0 (0.0%) | 0 (0.0%) |
| Total | 3,288 (100.0%) | 3,103 (100.0%) |
Commute Time in Dyersburg
The most frequently occuring commute durations in Dyersburg are 5 to 9 minutes (1,735 commuters, 28.0%), 10 to 14 minutes (1,366 commuters, 22.0%), and 15 to 19 minutes (814 commuters, 13.1%).
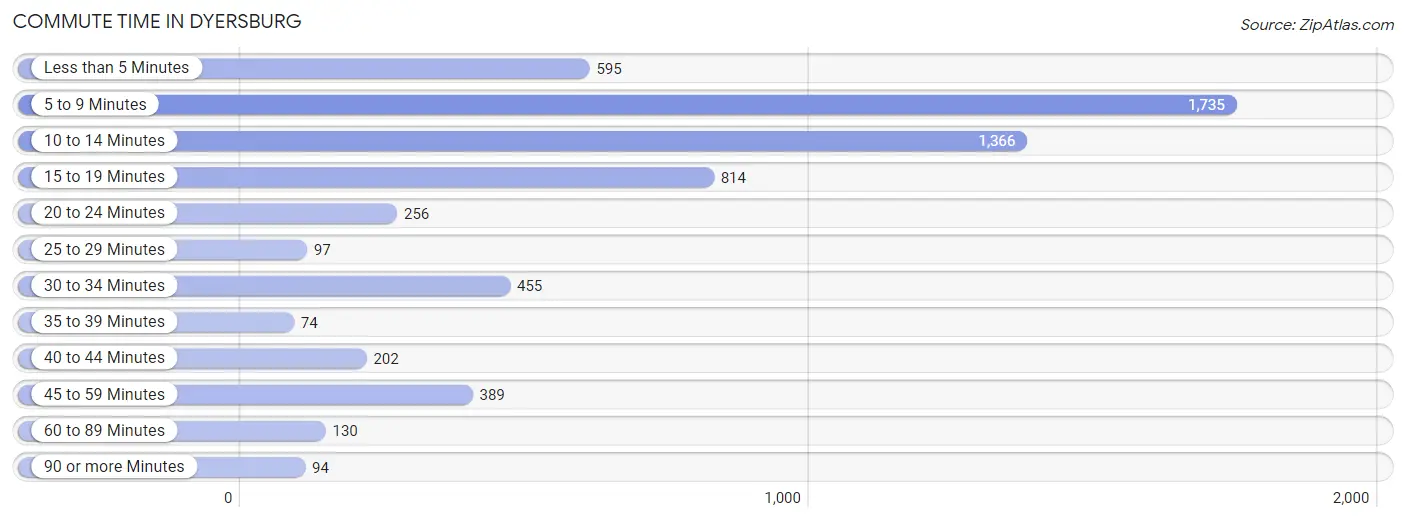
| Commute Time | # Commuters | % Commuters |
| Less than 5 Minutes | 595 | 9.6% |
| 5 to 9 Minutes | 1,735 | 28.0% |
| 10 to 14 Minutes | 1,366 | 22.0% |
| 15 to 19 Minutes | 814 | 13.1% |
| 20 to 24 Minutes | 256 | 4.1% |
| 25 to 29 Minutes | 97 | 1.6% |
| 30 to 34 Minutes | 455 | 7.3% |
| 35 to 39 Minutes | 74 | 1.2% |
| 40 to 44 Minutes | 202 | 3.3% |
| 45 to 59 Minutes | 389 | 6.3% |
| 60 to 89 Minutes | 130 | 2.1% |
| 90 or more Minutes | 94 | 1.5% |
Commute Time by Sex in Dyersburg
The most common commute times in Dyersburg are 5 to 9 minutes (619 commuters, 19.7%) for males and 5 to 9 minutes (1,116 commuters, 36.5%) for females.
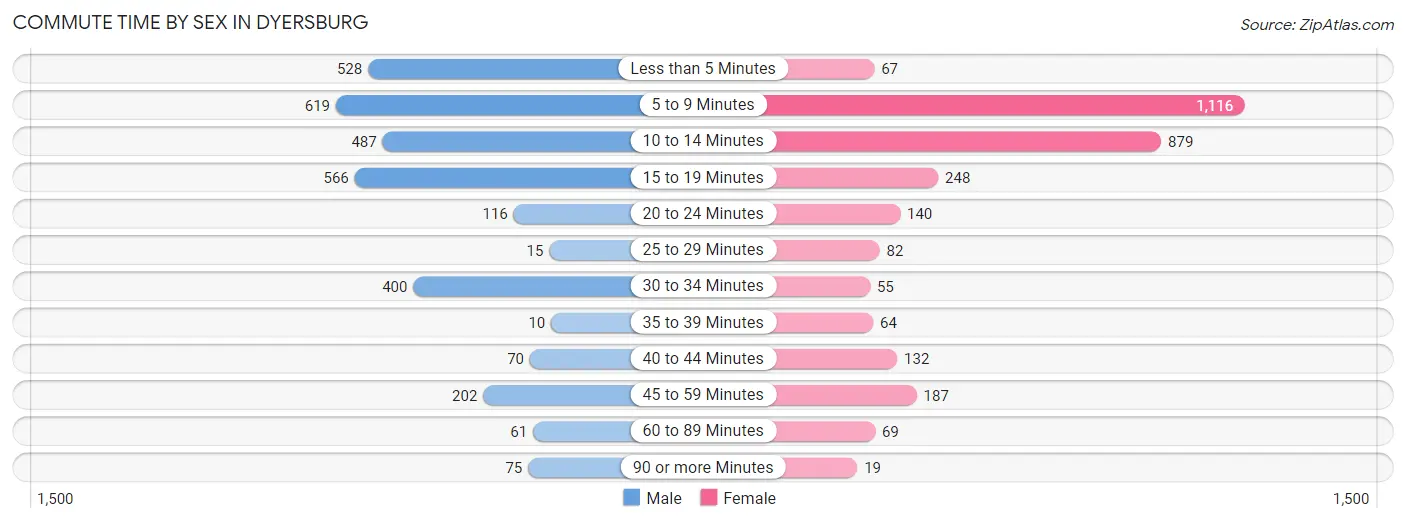
| Commute Time | Male | Female |
| Less than 5 Minutes | 528 (16.8%) | 67 (2.2%) |
| 5 to 9 Minutes | 619 (19.7%) | 1,116 (36.5%) |
| 10 to 14 Minutes | 487 (15.5%) | 879 (28.7%) |
| 15 to 19 Minutes | 566 (18.0%) | 248 (8.1%) |
| 20 to 24 Minutes | 116 (3.7%) | 140 (4.6%) |
| 25 to 29 Minutes | 15 (0.5%) | 82 (2.7%) |
| 30 to 34 Minutes | 400 (12.7%) | 55 (1.8%) |
| 35 to 39 Minutes | 10 (0.3%) | 64 (2.1%) |
| 40 to 44 Minutes | 70 (2.2%) | 132 (4.3%) |
| 45 to 59 Minutes | 202 (6.4%) | 187 (6.1%) |
| 60 to 89 Minutes | 61 (1.9%) | 69 (2.3%) |
| 90 or more Minutes | 75 (2.4%) | 19 (0.6%) |
Time of Departure to Work by Sex in Dyersburg
The most frequent times of departure to work in Dyersburg are 7:00 AM to 7:29 AM (531, 16.9%) for males and 7:00 AM to 7:29 AM (684, 22.4%) for females.
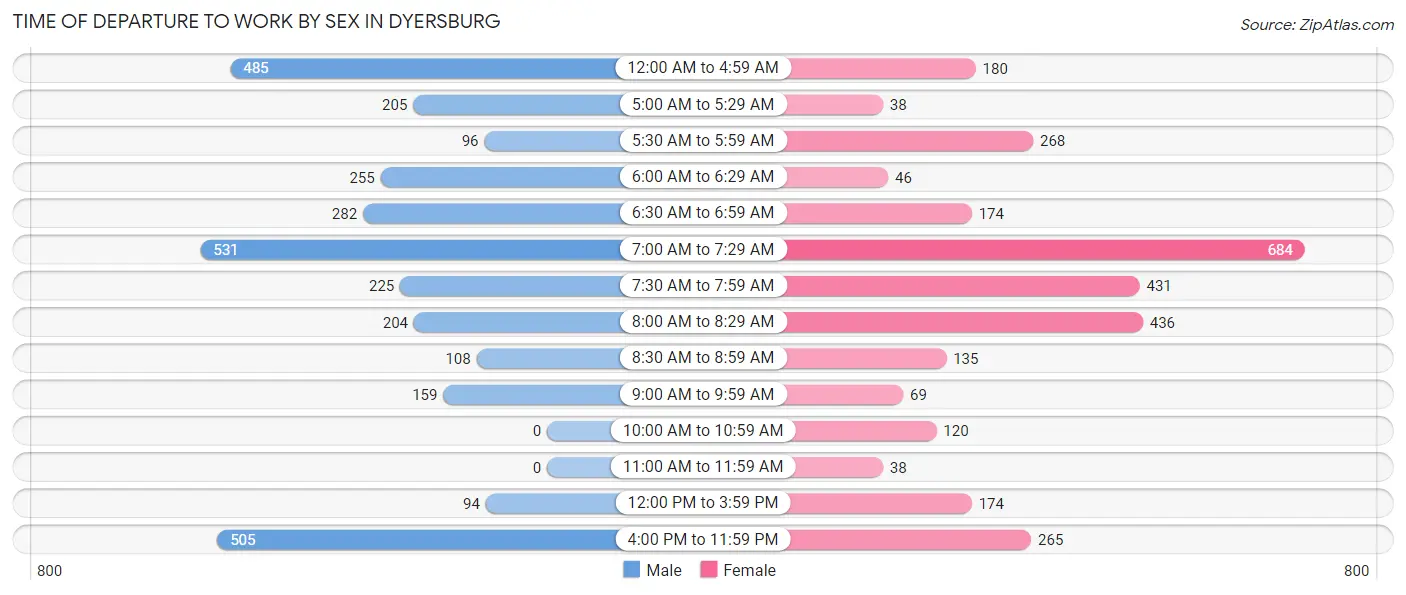
| Time of Departure | Male | Female |
| 12:00 AM to 4:59 AM | 485 (15.4%) | 180 (5.9%) |
| 5:00 AM to 5:29 AM | 205 (6.5%) | 38 (1.2%) |
| 5:30 AM to 5:59 AM | 96 (3.0%) | 268 (8.8%) |
| 6:00 AM to 6:29 AM | 255 (8.1%) | 46 (1.5%) |
| 6:30 AM to 6:59 AM | 282 (9.0%) | 174 (5.7%) |
| 7:00 AM to 7:29 AM | 531 (16.9%) | 684 (22.4%) |
| 7:30 AM to 7:59 AM | 225 (7.1%) | 431 (14.1%) |
| 8:00 AM to 8:29 AM | 204 (6.5%) | 436 (14.3%) |
| 8:30 AM to 8:59 AM | 108 (3.4%) | 135 (4.4%) |
| 9:00 AM to 9:59 AM | 159 (5.1%) | 69 (2.3%) |
| 10:00 AM to 10:59 AM | 0 (0.0%) | 120 (3.9%) |
| 11:00 AM to 11:59 AM | 0 (0.0%) | 38 (1.2%) |
| 12:00 PM to 3:59 PM | 94 (3.0%) | 174 (5.7%) |
| 4:00 PM to 11:59 PM | 505 (16.0%) | 265 (8.7%) |
| Total | 3,149 (100.0%) | 3,058 (100.0%) |
Housing Occupancy in Dyersburg
Occupancy by Ownership in Dyersburg
Of the total 6,635 dwellings in Dyersburg, owner-occupied units account for 3,355 (50.6%), while renter-occupied units make up 3,280 (49.4%).
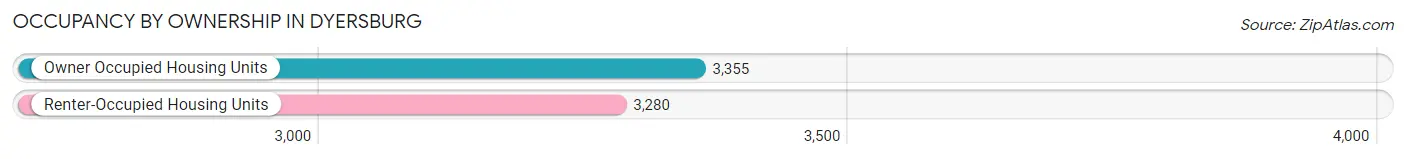
| Occupancy | # Housing Units | % Housing Units |
| Owner Occupied Housing Units | 3,355 | 50.6% |
| Renter-Occupied Housing Units | 3,280 | 49.4% |
| Total Occupied Housing Units | 6,635 | 100.0% |
Occupancy by Household Size in Dyersburg
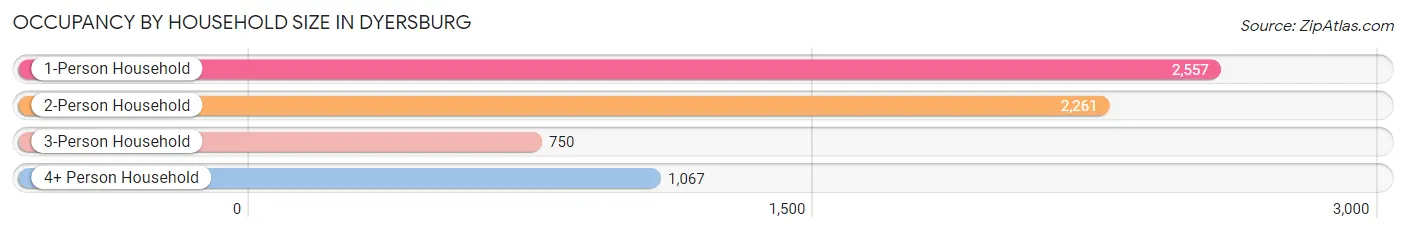
| Household Size | # Housing Units | % Housing Units |
| 1-Person Household | 2,557 | 38.5% |
| 2-Person Household | 2,261 | 34.1% |
| 3-Person Household | 750 | 11.3% |
| 4+ Person Household | 1,067 | 16.1% |
| Total Housing Units | 6,635 | 100.0% |
Occupancy by Ownership by Household Size in Dyersburg
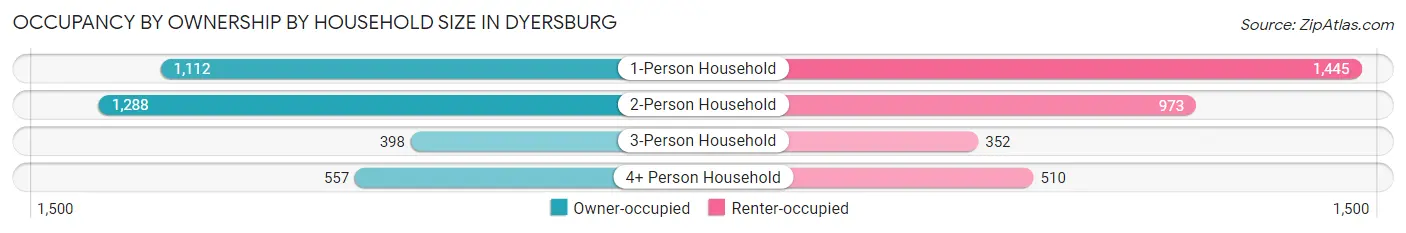
| Household Size | Owner-occupied | Renter-occupied |
| 1-Person Household | 1,112 (43.5%) | 1,445 (56.5%) |
| 2-Person Household | 1,288 (57.0%) | 973 (43.0%) |
| 3-Person Household | 398 (53.1%) | 352 (46.9%) |
| 4+ Person Household | 557 (52.2%) | 510 (47.8%) |
| Total Housing Units | 3,355 (50.6%) | 3,280 (49.4%) |
Occupancy by Educational Attainment in Dyersburg
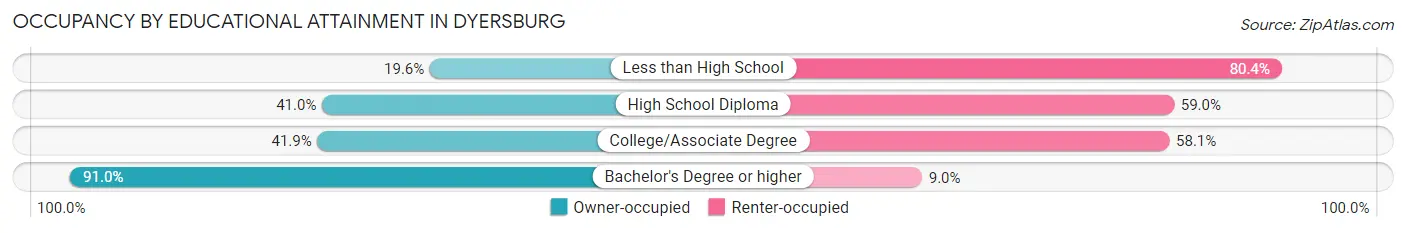
| Household Size | Owner-occupied | Renter-occupied |
| Less than High School | 178 (19.6%) | 730 (80.4%) |
| High School Diploma | 933 (41.0%) | 1,343 (59.0%) |
| College/Associate Degree | 765 (41.9%) | 1,060 (58.1%) |
| Bachelor's Degree or higher | 1,479 (91.0%) | 147 (9.0%) |
Occupancy by Age of Householder in Dyersburg
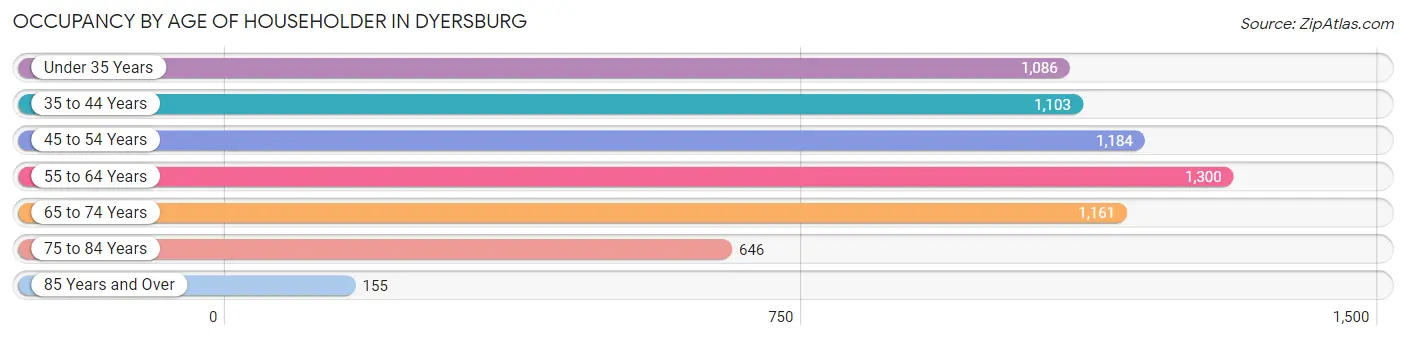
| Age Bracket | # Households | % Households |
| Under 35 Years | 1,086 | 16.4% |
| 35 to 44 Years | 1,103 | 16.6% |
| 45 to 54 Years | 1,184 | 17.8% |
| 55 to 64 Years | 1,300 | 19.6% |
| 65 to 74 Years | 1,161 | 17.5% |
| 75 to 84 Years | 646 | 9.7% |
| 85 Years and Over | 155 | 2.3% |
| Total | 6,635 | 100.0% |
Housing Finances in Dyersburg
Median Income by Occupancy in Dyersburg
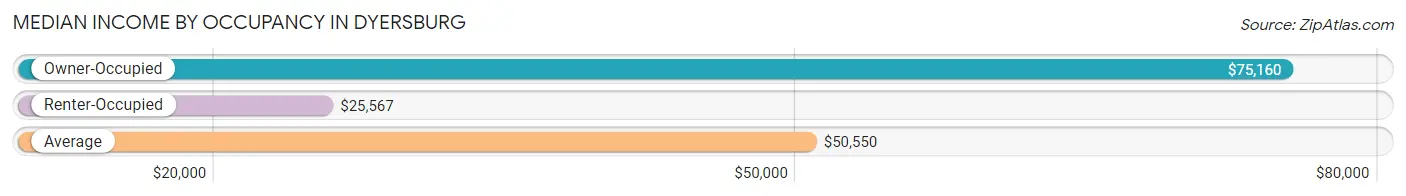
| Occupancy Type | # Households | Median Income |
| Owner-Occupied | 3,355 (50.6%) | $75,160 |
| Renter-Occupied | 3,280 (49.4%) | $25,567 |
| Average | 6,635 (100.0%) | $50,550 |
Occupancy by Householder Income Bracket in Dyersburg
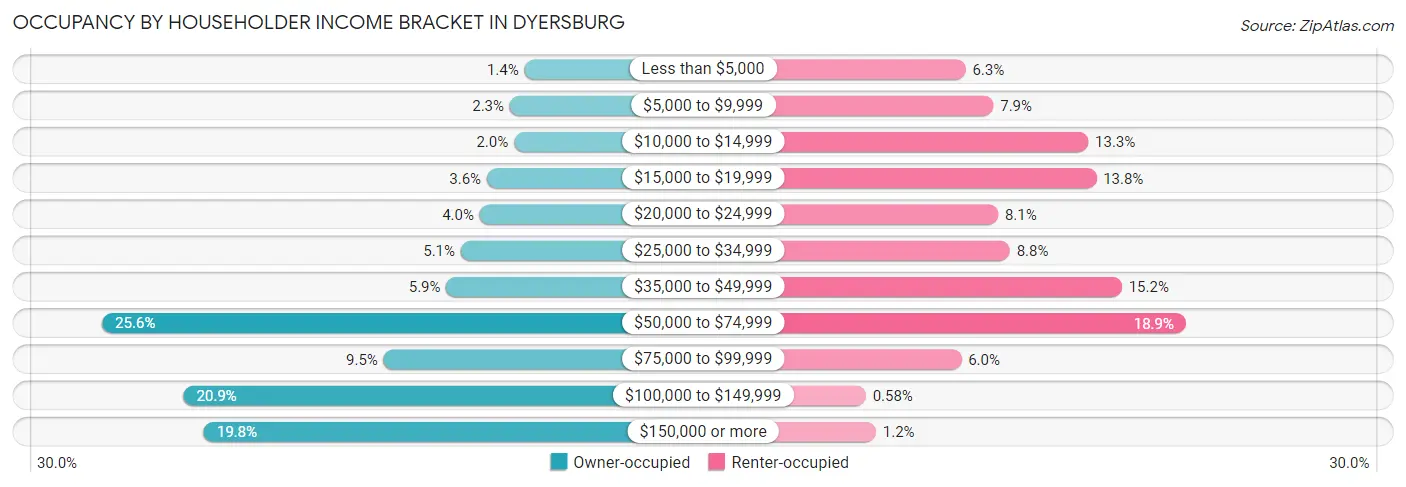
| Income Bracket | Owner-occupied | Renter-occupied |
| Less than $5,000 | 48 (1.4%) | 206 (6.3%) |
| $5,000 to $9,999 | 76 (2.3%) | 258 (7.9%) |
| $10,000 to $14,999 | 68 (2.0%) | 436 (13.3%) |
| $15,000 to $19,999 | 120 (3.6%) | 451 (13.8%) |
| $20,000 to $24,999 | 134 (4.0%) | 267 (8.1%) |
| $25,000 to $34,999 | 170 (5.1%) | 289 (8.8%) |
| $35,000 to $49,999 | 198 (5.9%) | 499 (15.2%) |
| $50,000 to $74,999 | 858 (25.6%) | 619 (18.9%) |
| $75,000 to $99,999 | 318 (9.5%) | 198 (6.0%) |
| $100,000 to $149,999 | 702 (20.9%) | 19 (0.6%) |
| $150,000 or more | 663 (19.8%) | 38 (1.2%) |
| Total | 3,355 (100.0%) | 3,280 (100.0%) |
Monthly Housing Cost Tiers in Dyersburg
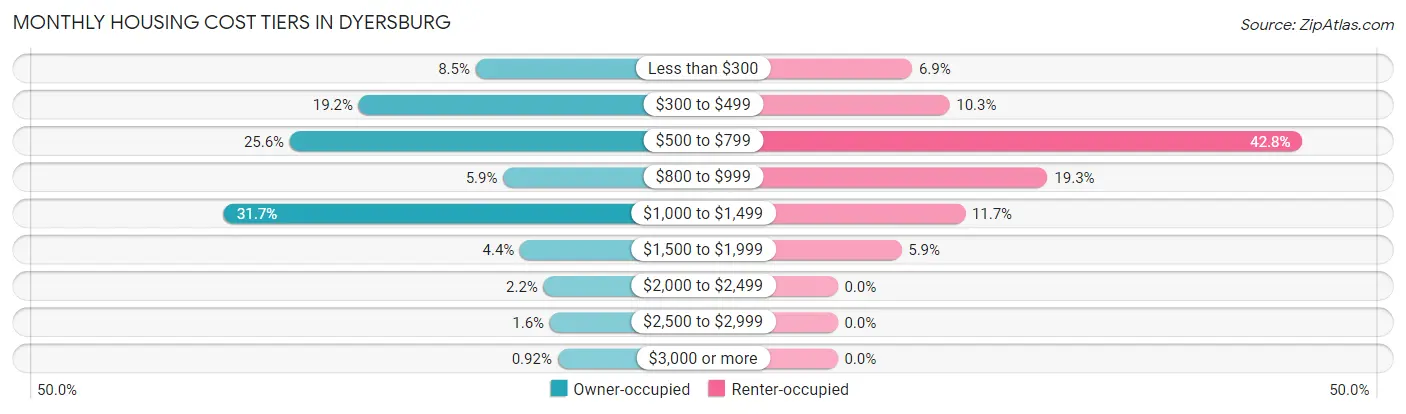
| Monthly Cost | Owner-occupied | Renter-occupied |
| Less than $300 | 284 (8.5%) | 225 (6.9%) |
| $300 to $499 | 645 (19.2%) | 338 (10.3%) |
| $500 to $799 | 858 (25.6%) | 1,404 (42.8%) |
| $800 to $999 | 199 (5.9%) | 634 (19.3%) |
| $1,000 to $1,499 | 1,062 (31.7%) | 385 (11.7%) |
| $1,500 to $1,999 | 147 (4.4%) | 193 (5.9%) |
| $2,000 to $2,499 | 74 (2.2%) | 0 (0.0%) |
| $2,500 to $2,999 | 55 (1.6%) | 0 (0.0%) |
| $3,000 or more | 31 (0.9%) | 0 (0.0%) |
| Total | 3,355 (100.0%) | 3,280 (100.0%) |
Physical Housing Characteristics in Dyersburg
Housing Structures in Dyersburg
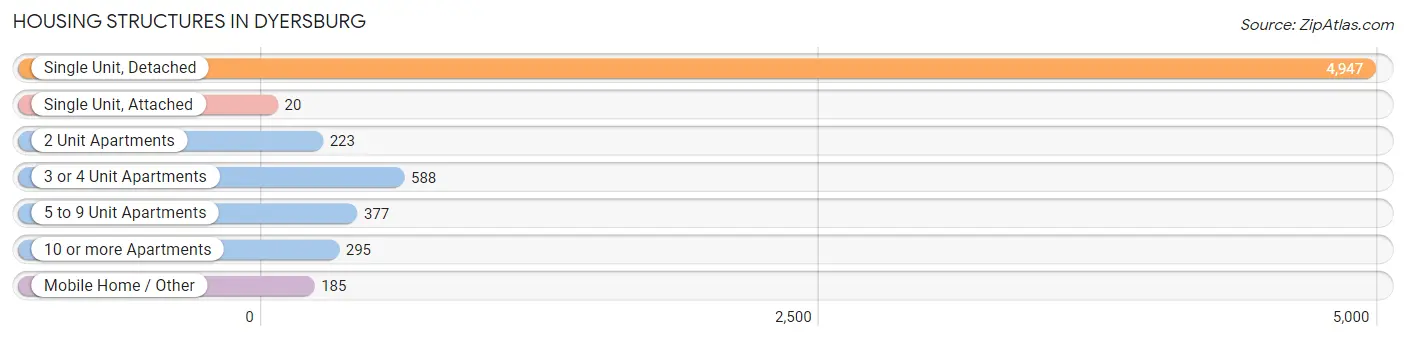
| Structure Type | # Housing Units | % Housing Units |
| Single Unit, Detached | 4,947 | 74.6% |
| Single Unit, Attached | 20 | 0.3% |
| 2 Unit Apartments | 223 | 3.4% |
| 3 or 4 Unit Apartments | 588 | 8.9% |
| 5 to 9 Unit Apartments | 377 | 5.7% |
| 10 or more Apartments | 295 | 4.4% |
| Mobile Home / Other | 185 | 2.8% |
| Total | 6,635 | 100.0% |
Housing Structures by Occupancy in Dyersburg
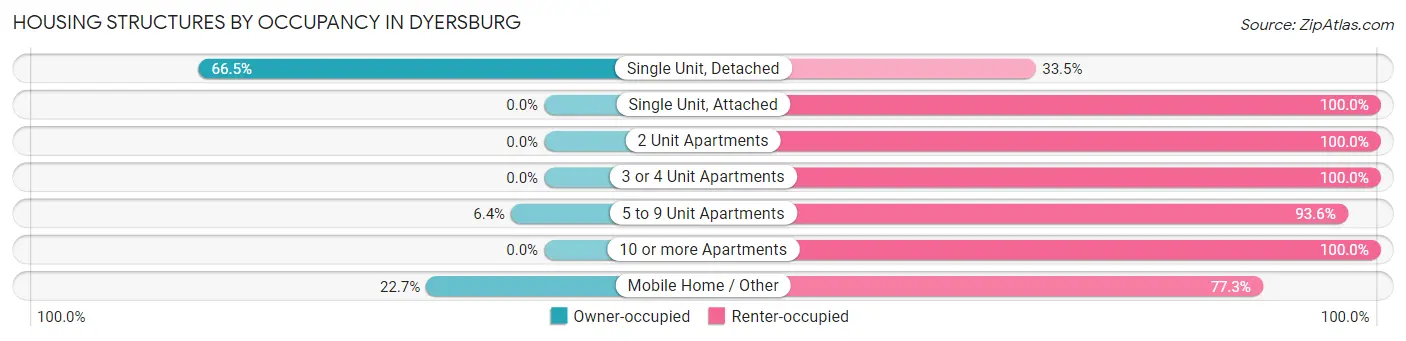
| Structure Type | Owner-occupied | Renter-occupied |
| Single Unit, Detached | 3,289 (66.5%) | 1,658 (33.5%) |
| Single Unit, Attached | 0 (0.0%) | 20 (100.0%) |
| 2 Unit Apartments | 0 (0.0%) | 223 (100.0%) |
| 3 or 4 Unit Apartments | 0 (0.0%) | 588 (100.0%) |
| 5 to 9 Unit Apartments | 24 (6.4%) | 353 (93.6%) |
| 10 or more Apartments | 0 (0.0%) | 295 (100.0%) |
| Mobile Home / Other | 42 (22.7%) | 143 (77.3%) |
| Total | 3,355 (50.6%) | 3,280 (49.4%) |
Housing Structures by Number of Rooms in Dyersburg
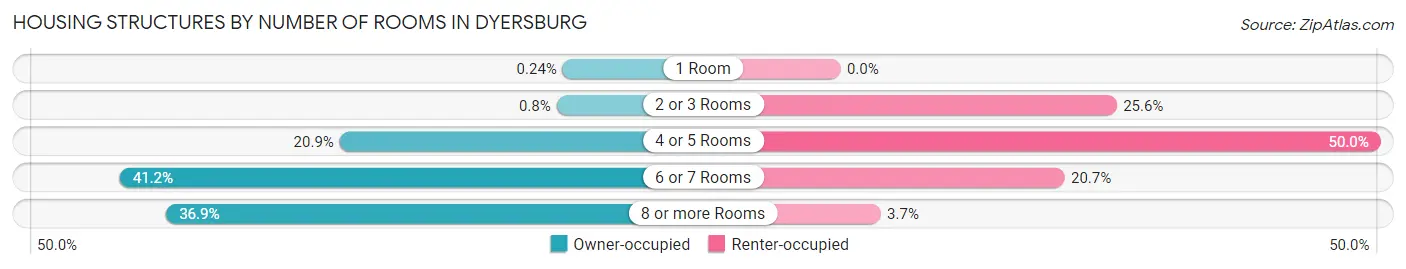
| Number of Rooms | Owner-occupied | Renter-occupied |
| 1 Room | 8 (0.2%) | 0 (0.0%) |
| 2 or 3 Rooms | 27 (0.8%) | 838 (25.6%) |
| 4 or 5 Rooms | 700 (20.9%) | 1,640 (50.0%) |
| 6 or 7 Rooms | 1,382 (41.2%) | 680 (20.7%) |
| 8 or more Rooms | 1,238 (36.9%) | 122 (3.7%) |
| Total | 3,355 (100.0%) | 3,280 (100.0%) |
Housing Structure by Heating Type in Dyersburg
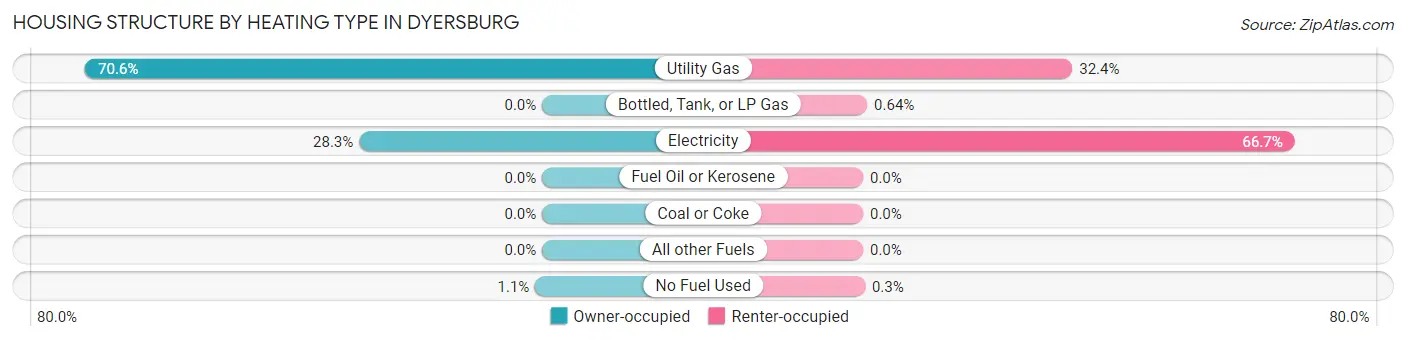
| Heating Type | Owner-occupied | Renter-occupied |
| Utility Gas | 2,370 (70.6%) | 1,061 (32.4%) |
| Bottled, Tank, or LP Gas | 0 (0.0%) | 21 (0.6%) |
| Electricity | 949 (28.3%) | 2,188 (66.7%) |
| Fuel Oil or Kerosene | 0 (0.0%) | 0 (0.0%) |
| Coal or Coke | 0 (0.0%) | 0 (0.0%) |
| All other Fuels | 0 (0.0%) | 0 (0.0%) |
| No Fuel Used | 36 (1.1%) | 10 (0.3%) |
| Total | 3,355 (100.0%) | 3,280 (100.0%) |
Household Vehicle Usage in Dyersburg
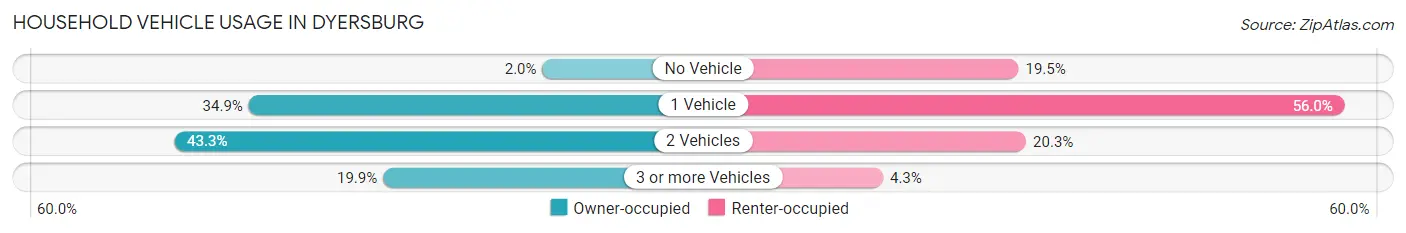
| Vehicles per Household | Owner-occupied | Renter-occupied |
| No Vehicle | 67 (2.0%) | 638 (19.5%) |
| 1 Vehicle | 1,171 (34.9%) | 1,836 (56.0%) |
| 2 Vehicles | 1,451 (43.2%) | 666 (20.3%) |
| 3 or more Vehicles | 666 (19.9%) | 140 (4.3%) |
| Total | 3,355 (100.0%) | 3,280 (100.0%) |
Real Estate & Mortgages in Dyersburg
Real Estate and Mortgage Overview in Dyersburg
| Characteristic | Without Mortgage | With Mortgage |
| Housing Units | 1,844 | 1,511 |
| Median Property Value | $206,000 | $153,100 |
| Median Household Income | $68,289 | $241 |
| Monthly Housing Costs | $510 | $31 |
| Real Estate Taxes | $1,474 | $53 |
Property Value by Mortgage Status in Dyersburg
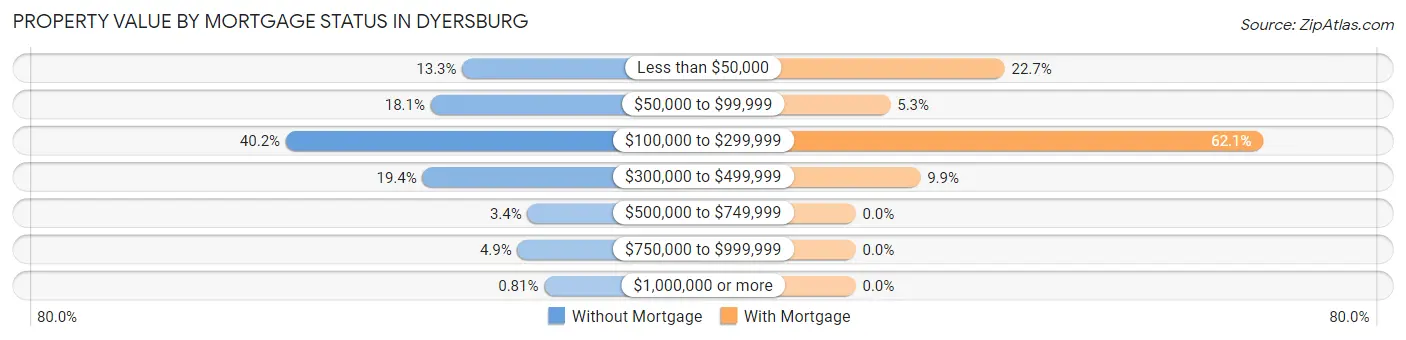
| Property Value | Without Mortgage | With Mortgage |
| Less than $50,000 | 245 (13.3%) | 343 (22.7%) |
| $50,000 to $99,999 | 334 (18.1%) | 80 (5.3%) |
| $100,000 to $299,999 | 741 (40.2%) | 939 (62.1%) |
| $300,000 to $499,999 | 357 (19.4%) | 149 (9.9%) |
| $500,000 to $749,999 | 62 (3.4%) | 0 (0.0%) |
| $750,000 to $999,999 | 90 (4.9%) | 0 (0.0%) |
| $1,000,000 or more | 15 (0.8%) | 0 (0.0%) |
| Total | 1,844 (100.0%) | 1,511 (100.0%) |
Household Income by Mortgage Status in Dyersburg
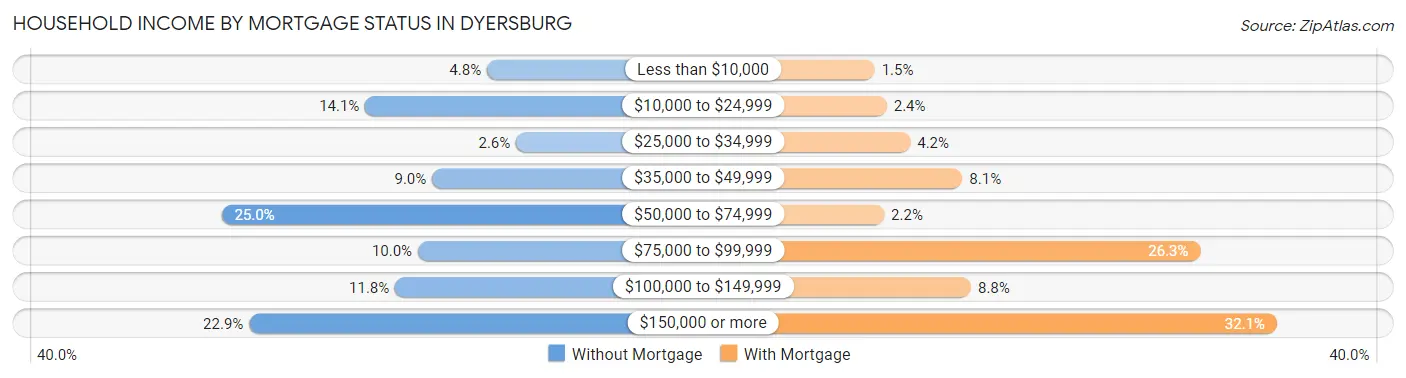
| Household Income | Without Mortgage | With Mortgage |
| Less than $10,000 | 88 (4.8%) | 22 (1.5%) |
| $10,000 to $24,999 | 259 (14.1%) | 36 (2.4%) |
| $25,000 to $34,999 | 47 (2.5%) | 63 (4.2%) |
| $35,000 to $49,999 | 165 (8.9%) | 123 (8.1%) |
| $50,000 to $74,999 | 461 (25.0%) | 33 (2.2%) |
| $75,000 to $99,999 | 185 (10.0%) | 397 (26.3%) |
| $100,000 to $149,999 | 217 (11.8%) | 133 (8.8%) |
| $150,000 or more | 422 (22.9%) | 485 (32.1%) |
| Total | 1,844 (100.0%) | 1,511 (100.0%) |
Property Value to Household Income Ratio in Dyersburg
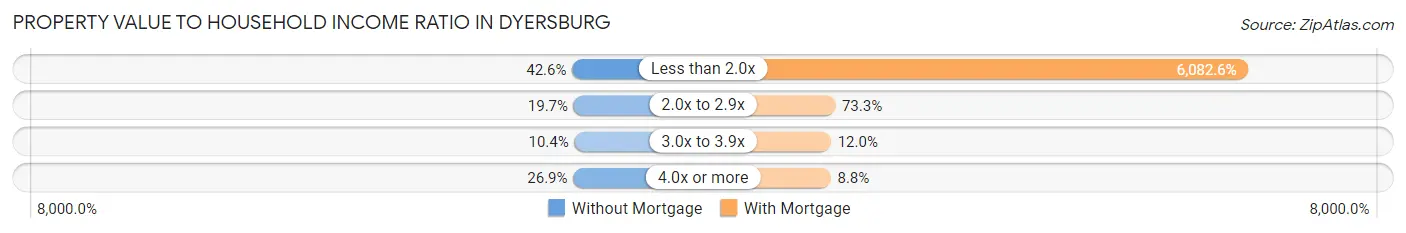
| Value-to-Income Ratio | Without Mortgage | With Mortgage |
| Less than 2.0x | 785 (42.6%) | 91,908 (6,082.6%) |
| 2.0x to 2.9x | 363 (19.7%) | 1,107 (73.3%) |
| 3.0x to 3.9x | 191 (10.4%) | 181 (12.0%) |
| 4.0x or more | 496 (26.9%) | 133 (8.8%) |
| Total | 1,844 (100.0%) | 1,511 (100.0%) |
Real Estate Taxes by Mortgage Status in Dyersburg
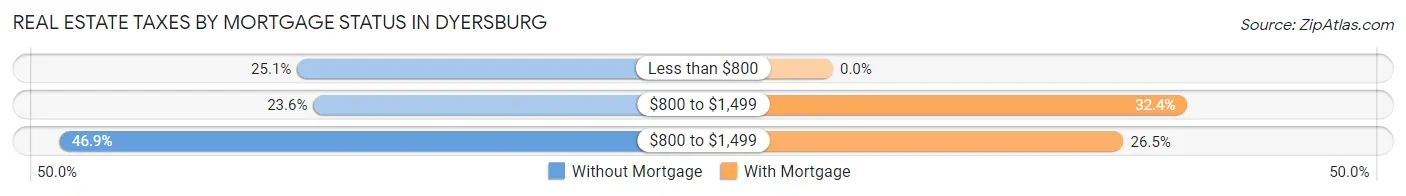
| Property Taxes | Without Mortgage | With Mortgage |
| Less than $800 | 463 (25.1%) | 0 (0.0%) |
| $800 to $1,499 | 436 (23.6%) | 489 (32.4%) |
| $800 to $1,499 | 864 (46.9%) | 401 (26.5%) |
| Total | 1,844 (100.0%) | 1,511 (100.0%) |
Health & Disability in Dyersburg
Health Insurance Coverage by Age in Dyersburg
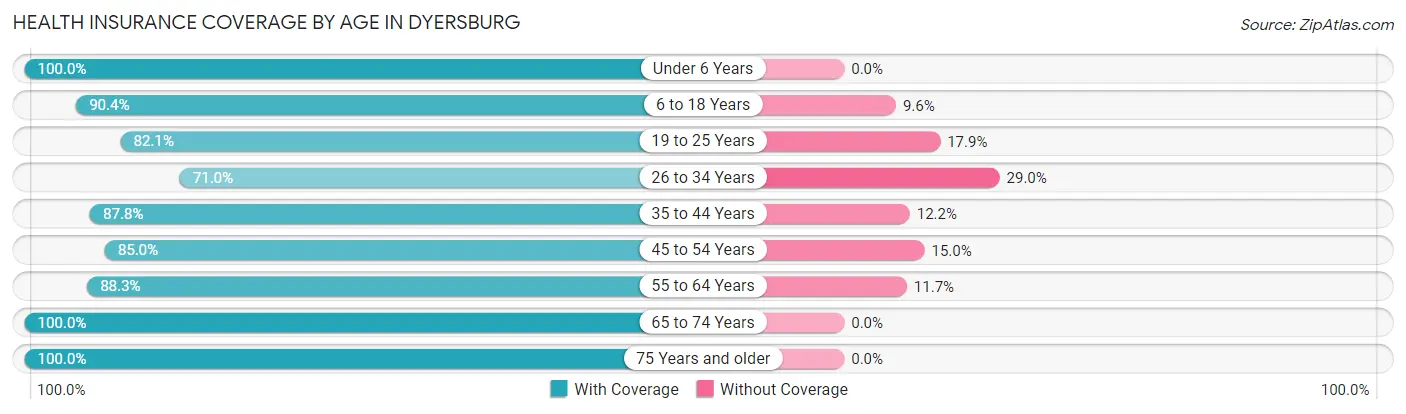
| Age Bracket | With Coverage | Without Coverage |
| Under 6 Years | 1,126 (100.0%) | 0 (0.0%) |
| 6 to 18 Years | 2,616 (90.4%) | 279 (9.6%) |
| 19 to 25 Years | 1,005 (82.1%) | 219 (17.9%) |
| 26 to 34 Years | 1,126 (71.0%) | 459 (29.0%) |
| 35 to 44 Years | 1,445 (87.8%) | 201 (12.2%) |
| 45 to 54 Years | 1,903 (85.0%) | 335 (15.0%) |
| 55 to 64 Years | 1,770 (88.3%) | 234 (11.7%) |
| 65 to 74 Years | 1,893 (100.0%) | 0 (0.0%) |
| 75 Years and older | 1,049 (100.0%) | 0 (0.0%) |
| Total | 13,933 (89.0%) | 1,727 (11.0%) |
Health Insurance Coverage by Citizenship Status in Dyersburg
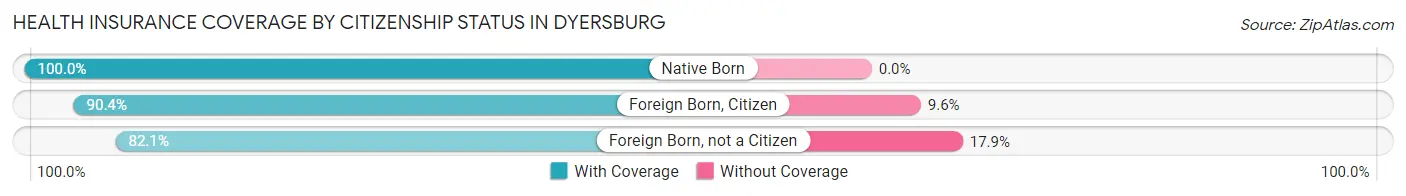
| Citizenship Status | With Coverage | Without Coverage |
| Native Born | 1,126 (100.0%) | 0 (0.0%) |
| Foreign Born, Citizen | 2,616 (90.4%) | 279 (9.6%) |
| Foreign Born, not a Citizen | 1,005 (82.1%) | 219 (17.9%) |
Health Insurance Coverage by Household Income in Dyersburg
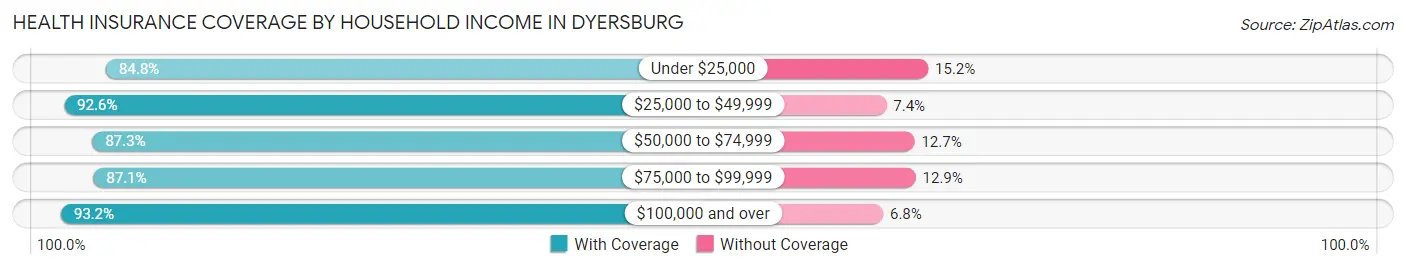
| Household Income | With Coverage | Without Coverage |
| Under $25,000 | 3,360 (84.8%) | 604 (15.2%) |
| $25,000 to $49,999 | 2,211 (92.6%) | 177 (7.4%) |
| $50,000 to $74,999 | 3,249 (87.3%) | 472 (12.7%) |
| $75,000 to $99,999 | 1,020 (87.1%) | 151 (12.9%) |
| $100,000 and over | 4,078 (93.2%) | 297 (6.8%) |
Public vs Private Health Insurance Coverage by Age in Dyersburg
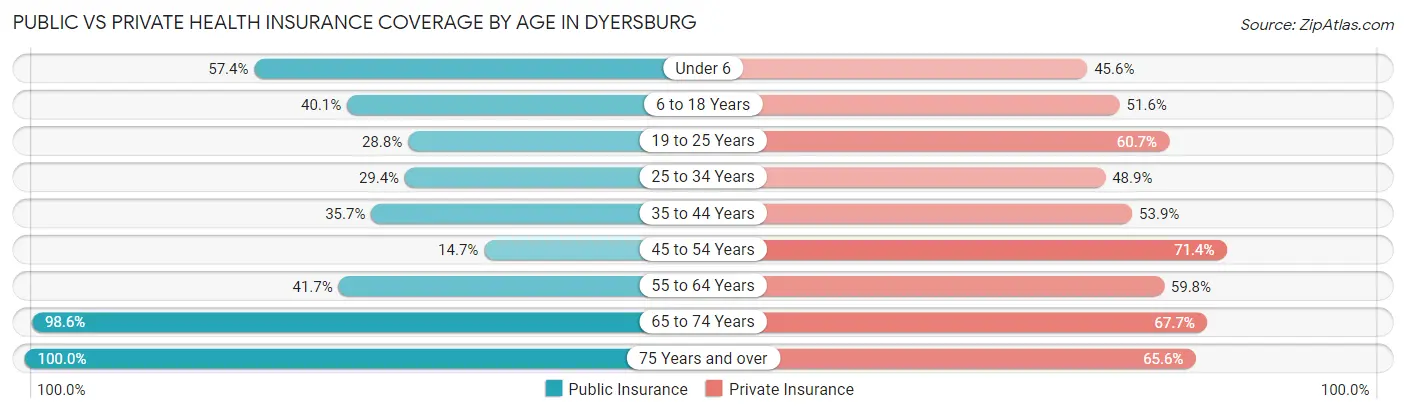
| Age Bracket | Public Insurance | Private Insurance |
| Under 6 | 646 (57.4%) | 513 (45.6%) |
| 6 to 18 Years | 1,162 (40.1%) | 1,493 (51.6%) |
| 19 to 25 Years | 353 (28.8%) | 743 (60.7%) |
| 25 to 34 Years | 466 (29.4%) | 775 (48.9%) |
| 35 to 44 Years | 587 (35.7%) | 887 (53.9%) |
| 45 to 54 Years | 329 (14.7%) | 1,597 (71.4%) |
| 55 to 64 Years | 836 (41.7%) | 1,198 (59.8%) |
| 65 to 74 Years | 1,867 (98.6%) | 1,282 (67.7%) |
| 75 Years and over | 1,049 (100.0%) | 688 (65.6%) |
| Total | 7,295 (46.6%) | 9,176 (58.6%) |
Disability Status by Sex by Age in Dyersburg
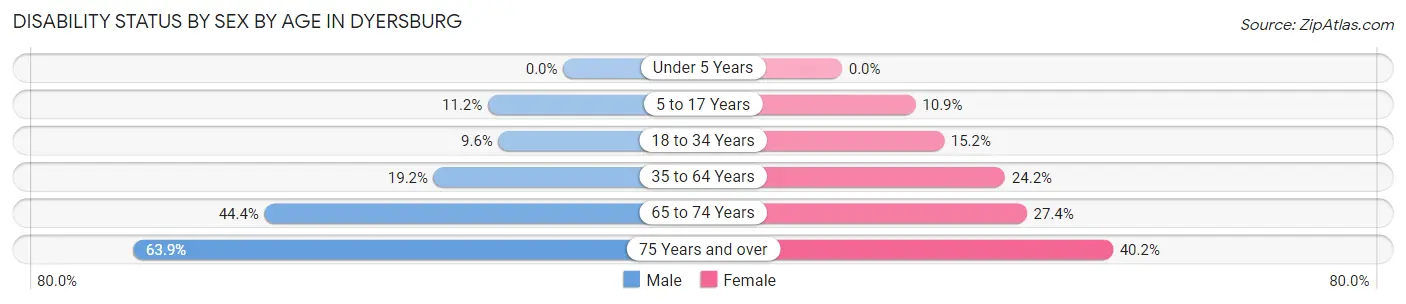
| Age Bracket | Male | Female |
| Under 5 Years | 0 (0.0%) | 0 (0.0%) |
| 5 to 17 Years | 175 (11.2%) | 153 (10.9%) |
| 18 to 34 Years | 152 (9.6%) | 205 (15.1%) |
| 35 to 64 Years | 509 (19.2%) | 785 (24.2%) |
| 65 to 74 Years | 369 (44.4%) | 291 (27.4%) |
| 75 Years and over | 170 (63.9%) | 315 (40.2%) |
Disability Class by Sex by Age in Dyersburg
Disability Class: Hearing Difficulty
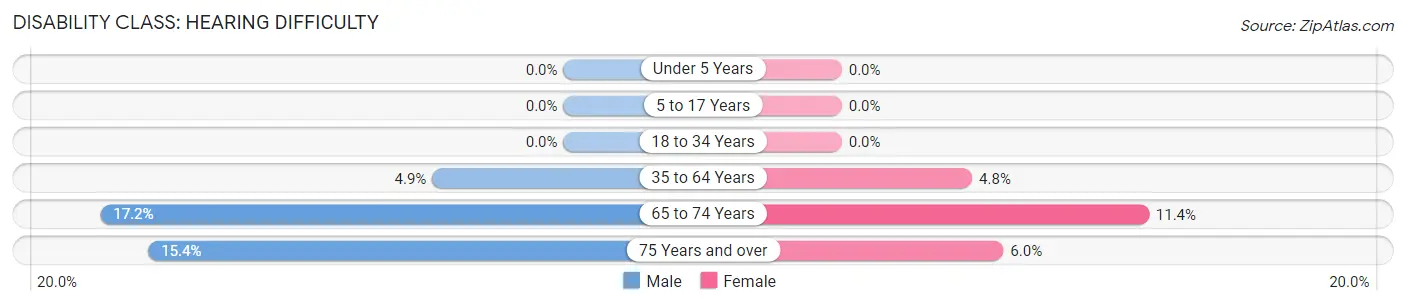
| Age Bracket | Male | Female |
| Under 5 Years | 0 (0.0%) | 0 (0.0%) |
| 5 to 17 Years | 0 (0.0%) | 0 (0.0%) |
| 18 to 34 Years | 0 (0.0%) | 0 (0.0%) |
| 35 to 64 Years | 129 (4.9%) | 157 (4.8%) |
| 65 to 74 Years | 143 (17.2%) | 121 (11.4%) |
| 75 Years and over | 41 (15.4%) | 47 (6.0%) |
Disability Class: Vision Difficulty
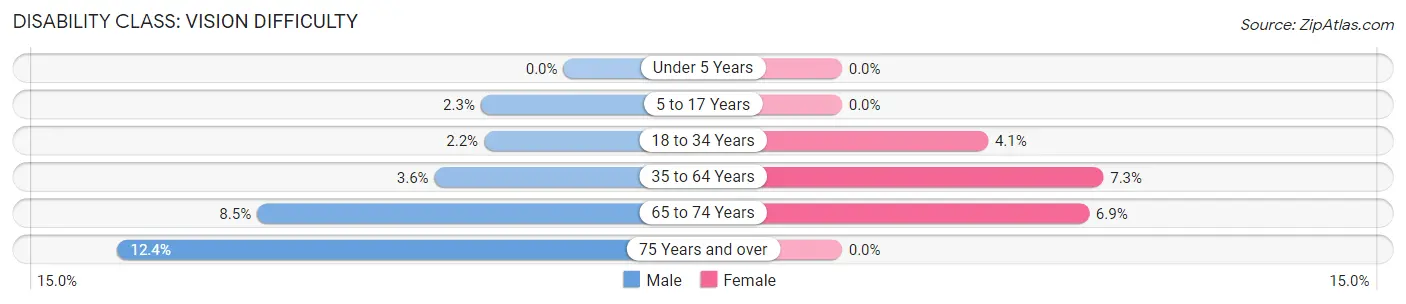
| Age Bracket | Male | Female |
| Under 5 Years | 0 (0.0%) | 0 (0.0%) |
| 5 to 17 Years | 36 (2.3%) | 0 (0.0%) |
| 18 to 34 Years | 35 (2.2%) | 55 (4.1%) |
| 35 to 64 Years | 95 (3.6%) | 236 (7.3%) |
| 65 to 74 Years | 71 (8.5%) | 73 (6.9%) |
| 75 Years and over | 33 (12.4%) | 0 (0.0%) |
Disability Class: Cognitive Difficulty
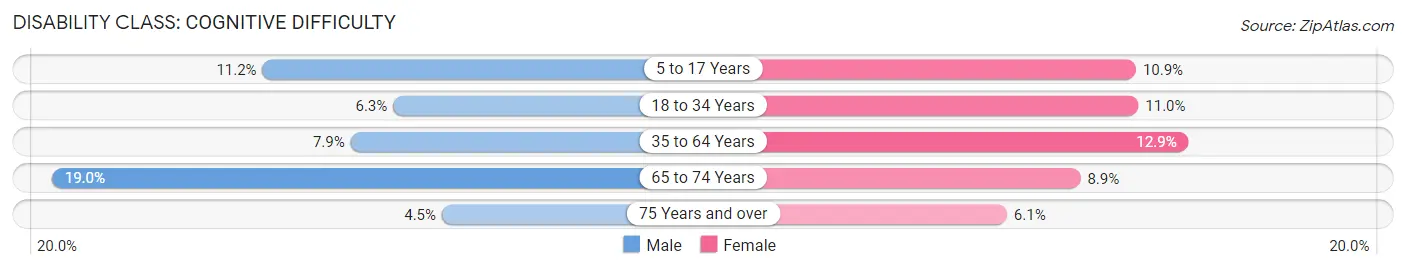
| Age Bracket | Male | Female |
| 5 to 17 Years | 175 (11.2%) | 153 (10.9%) |
| 18 to 34 Years | 100 (6.3%) | 149 (11.0%) |
| 35 to 64 Years | 209 (7.9%) | 417 (12.9%) |
| 65 to 74 Years | 158 (19.0%) | 94 (8.9%) |
| 75 Years and over | 12 (4.5%) | 48 (6.1%) |
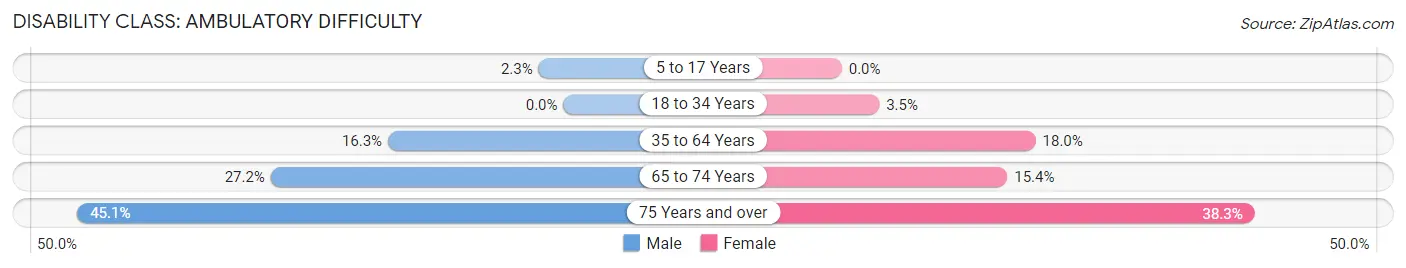
Disability Class: Ambulatory Difficulty
| Age Bracket | Male | Female |
| 5 to 17 Years | 36 (2.3%) | 0 (0.0%) |
| 18 to 34 Years | 0 (0.0%) | 47 (3.5%) |
| 35 to 64 Years | 431 (16.3%) | 583 (18.0%) |
| 65 to 74 Years | 226 (27.2%) | 163 (15.4%) |
| 75 Years and over | 120 (45.1%) | 300 (38.3%) |
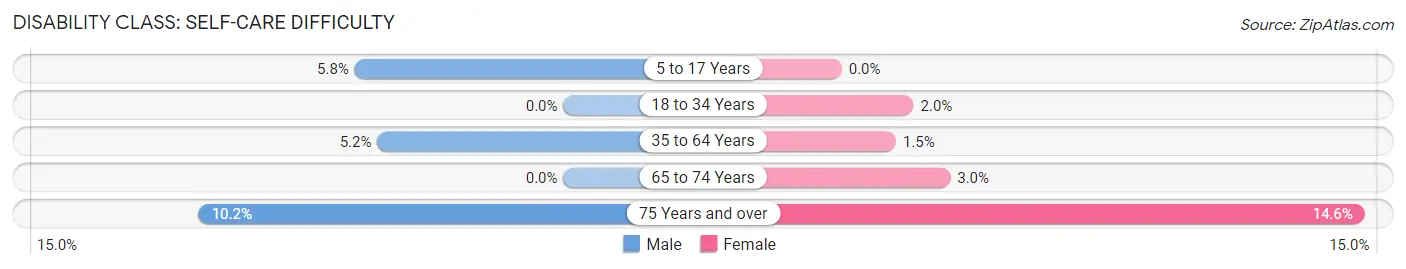
Disability Class: Self-Care Difficulty
| Age Bracket | Male | Female |
| 5 to 17 Years | 91 (5.8%) | 0 (0.0%) |
| 18 to 34 Years | 0 (0.0%) | 27 (2.0%) |
| 35 to 64 Years | 137 (5.2%) | 49 (1.5%) |
| 65 to 74 Years | 0 (0.0%) | 32 (3.0%) |
| 75 Years and over | 27 (10.2%) | 114 (14.6%) |
Technology Access in Dyersburg
Computing Device Access in Dyersburg
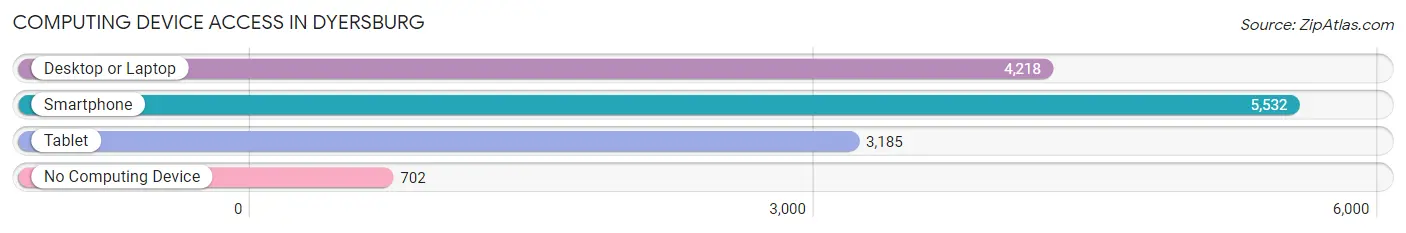
| Device Type | # Households | % Households |
| Desktop or Laptop | 4,218 | 63.6% |
| Smartphone | 5,532 | 83.4% |
| Tablet | 3,185 | 48.0% |
| No Computing Device | 702 | 10.6% |
| Total | 6,635 | 100.0% |
Internet Access in Dyersburg
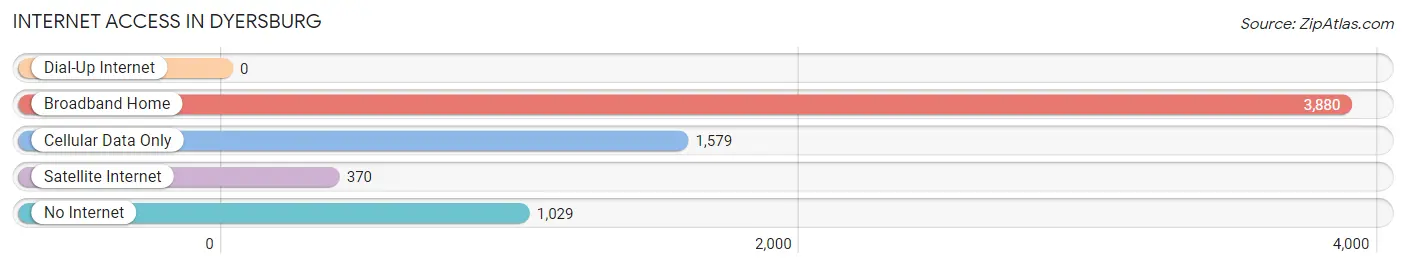
| Internet Type | # Households | % Households |
| Dial-Up Internet | 0 | 0.0% |
| Broadband Home | 3,880 | 58.5% |
| Cellular Data Only | 1,579 | 23.8% |
| Satellite Internet | 370 | 5.6% |
| No Internet | 1,029 | 15.5% |
| Total | 6,635 | 100.0% |
Dyersburg Summary
Dyersburg is a city located in the state of Tennessee, United States. It is the county seat of Dyer County and is located along the banks of the Forked Deer River. The city has a population of 17,145 as of the 2010 census.
History
The area that is now Dyersburg was first settled in 1824 by John Dyer, a veteran of the War of 1812. Dyer had been granted a land grant in the area and established a trading post. The town was officially established in 1825 and was named after Dyer.
In 1827, Dyersburg was incorporated as a town and in 1837 it was incorporated as a city. During the Civil War, the city was occupied by Union forces and was the site of a major battle in 1863.
After the war, the city experienced a period of growth and development. The railroad arrived in 1873 and the city became a major hub for the cotton industry. The city also became a center for the timber industry and was home to several sawmills.
In the early 20th century, Dyersburg experienced a period of decline as the cotton and timber industries declined. The city was also hit hard by the Great Depression.
In the 1950s, the city began to experience a period of revitalization. The city was the site of a major industrial park and several new businesses were established. The city also experienced a population boom as people moved to the area for jobs.
Geography
Dyersburg is located in the western part of Tennessee, in the northwest corner of Dyer County. It is situated along the banks of the Forked Deer River. The city has a total area of 11.3 square miles, of which 11.2 square miles is land and 0.1 square miles is water.
The city is located in the western part of the state, about 80 miles northeast of Memphis and about 120 miles southwest of Nashville. The city is located in the Central Basin region of Tennessee and is part of the Jackson Purchase region.
Economy
Dyersburg’s economy is largely based on manufacturing and agriculture. The city is home to several major manufacturing companies, including Dyersburg Fabrics, Dyersburg Plastics, and Dyersburg Steel. The city is also home to several agricultural businesses, including poultry farms, cotton farms, and soybean farms.
The city is also home to several retail businesses, including several shopping centers and a variety of restaurants. The city is also home to several medical facilities, including a hospital and several clinics.
Demographics
As of the 2010 census, the city had a population of 17,145. The racial makeup of the city was 79.2% White, 17.7% African American, 0.3% Native American, 0.5% Asian, 0.1% Pacific Islander, 1.2% from other races, and 1.1% from two or more races. Hispanic or Latino of any race were 2.7% of the population.
The median income for a household in the city was $30,945 and the median income for a family was $37,945. The per capita income for the city was $17,845. About 17.2% of families and 20.7% of the population were below the poverty line, including 28.2% of those under age 18 and 16.2% of those age 65 or over.
Common Questions
What is Per Capita Income in Dyersburg?
Per Capita income in Dyersburg is $45,980.
What is the Median Family Income in Dyersburg?
Median Family Income in Dyersburg is $66,069.
What is the Median Household income in Dyersburg?
Median Household Income in Dyersburg is $50,550.
What is Income or Wage Gap in Dyersburg?
Income or Wage Gap in Dyersburg is 27.6%.
Women in Dyersburg earn 72.4 cents for every dollar earned by a man.
What is Family Income Deficit in Dyersburg?
Family Income Deficit in Dyersburg is $10,452.
Families that are below poverty line in Dyersburg earn $10,452 less on average than the poverty threshold level.
What is Inequality or Gini Index in Dyersburg?
Inequality or Gini Index in Dyersburg is 0.69.
What is the Total Population of Dyersburg?
Total Population of Dyersburg is 16,170.
What is the Total Male Population of Dyersburg?
Total Male Population of Dyersburg is 7,609.
What is the Total Female Population of Dyersburg?
Total Female Population of Dyersburg is 8,561.
What is the Ratio of Males per 100 Females in Dyersburg?
There are 88.88 Males per 100 Females in Dyersburg.
What is the Ratio of Females per 100 Males in Dyersburg?
There are 112.51 Females per 100 Males in Dyersburg.
What is the Median Population Age in Dyersburg?
Median Population Age in Dyersburg is 42.5 Years.
What is the Average Family Size in Dyersburg
Average Family Size in Dyersburg is 3.2 People.
What is the Average Household Size in Dyersburg
Average Household Size in Dyersburg is 2.4 People.
How Large is the Labor Force in Dyersburg?
There are 6,925 People in the Labor Forcein in Dyersburg.
What is the Percentage of People in the Labor Force in Dyersburg?
54.8% of People are in the Labor Force in Dyersburg.
What is the Unemployment Rate in Dyersburg?
Unemployment Rate in Dyersburg is 6.5%.