Edgartown, MA Map & Demographics
Edgartown Map
Edgartown Overview
$148,187
PER CAPITA INCOME
$250,001
AVG FAMILY INCOME
41.1%
WAGE / INCOME GAP [ % ]
58.9¢/ $1
WAGE / INCOME GAP [ $ ]
0.69
INEQUALITY / GINI INDEX
610
TOTAL POPULATION
268
MALE POPULATION
342
FEMALE POPULATION
78.36
MALES / 100 FEMALES
127.61
FEMALES / 100 MALES
63.4
MEDIAN AGE
3.8
AVG FAMILY SIZE
2.7
AVG HOUSEHOLD SIZE
357
LABOR FORCE [ PEOPLE ]
58.5%
PERCENT IN LABOR FORCE
Edgartown Zip Codes
Income in Edgartown
Income Overview in Edgartown
| Characteristic | Number | Measure |
| Per Capita Income | 610 | $148,187 |
| Median Family Income | 125 | $250,001 |
| Mean Family Income | 125 | $549,214 |
| Median Household Income | 213 | $0 |
| Mean Household Income | 213 | $350,060 |
| Income Deficit | 125 | $0 |
| Wage / Income Gap (%) | 610 | 41.08% |
| Wage / Income Gap ($) | 610 | 58.92¢ per $1 |
| Gini / Inequality Index | 610 | 0.69 |
Earnings by Sex in Edgartown
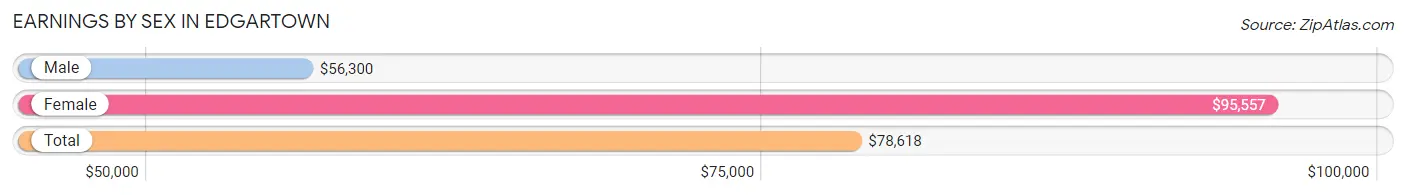
Average Earnings in Edgartown are $78,618, $56,300 for men and $95,557 for women, a difference of 41.1%.
| Sex | Number | Average Earnings |
| Male | 170 (40.4%) | $56,300 |
| Female | 251 (59.6%) | $95,557 |
| Total | 421 (100.0%) | $78,618 |
Earnings by Sex by Income Bracket in Edgartown
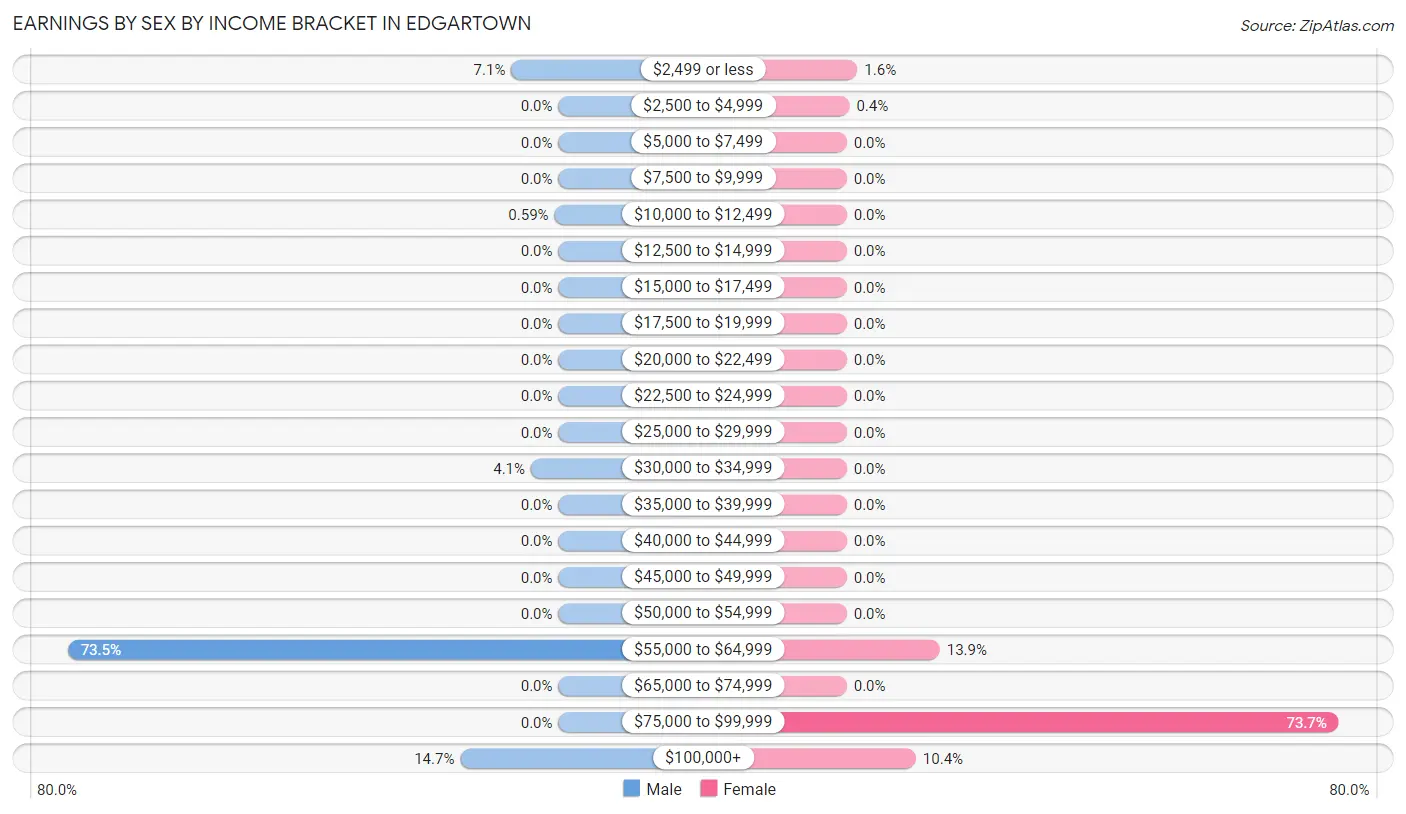
The most common earnings brackets in Edgartown are $55,000 to $64,999 for men (125 | 73.5%) and $75,000 to $99,999 for women (185 | 73.7%).
| Income | Male | Female |
| $2,499 or less | 12 (7.1%) | 4 (1.6%) |
| $2,500 to $4,999 | 0 (0.0%) | 1 (0.4%) |
| $5,000 to $7,499 | 0 (0.0%) | 0 (0.0%) |
| $7,500 to $9,999 | 0 (0.0%) | 0 (0.0%) |
| $10,000 to $12,499 | 1 (0.6%) | 0 (0.0%) |
| $12,500 to $14,999 | 0 (0.0%) | 0 (0.0%) |
| $15,000 to $17,499 | 0 (0.0%) | 0 (0.0%) |
| $17,500 to $19,999 | 0 (0.0%) | 0 (0.0%) |
| $20,000 to $22,499 | 0 (0.0%) | 0 (0.0%) |
| $22,500 to $24,999 | 0 (0.0%) | 0 (0.0%) |
| $25,000 to $29,999 | 0 (0.0%) | 0 (0.0%) |
| $30,000 to $34,999 | 7 (4.1%) | 0 (0.0%) |
| $35,000 to $39,999 | 0 (0.0%) | 0 (0.0%) |
| $40,000 to $44,999 | 0 (0.0%) | 0 (0.0%) |
| $45,000 to $49,999 | 0 (0.0%) | 0 (0.0%) |
| $50,000 to $54,999 | 0 (0.0%) | 0 (0.0%) |
| $55,000 to $64,999 | 125 (73.5%) | 35 (13.9%) |
| $65,000 to $74,999 | 0 (0.0%) | 0 (0.0%) |
| $75,000 to $99,999 | 0 (0.0%) | 185 (73.7%) |
| $100,000+ | 25 (14.7%) | 26 (10.4%) |
| Total | 170 (100.0%) | 251 (100.0%) |
Earnings by Sex by Educational Attainment in Edgartown
| Educational Attainment | Male Income | Female Income |
| Less than High School | - | - |
| High School Diploma | - | - |
| College or Associate's Degree | - | - |
| Bachelor's Degree | - | - |
| Graduate Degree | - | - |
| Total | $56,310 | $95,605 |
Family Income in Edgartown
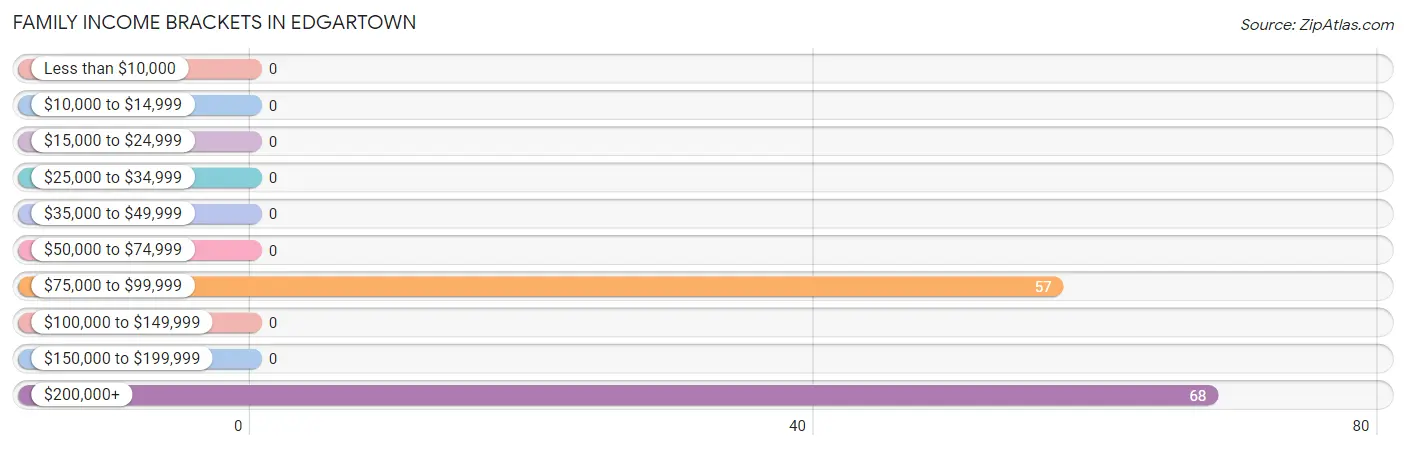
Family Income Brackets in Edgartown
According to the Edgartown family income data, there are 68 families falling into the $200,000+ income range, which is the most common income bracket and makes up 54.4% of all families.
| Income Bracket | # Families | % Families |
| Less than $10,000 | 0 | 0.0% |
| $10,000 to $14,999 | 0 | 0.0% |
| $15,000 to $24,999 | 0 | 0.0% |
| $25,000 to $34,999 | 0 | 0.0% |
| $35,000 to $49,999 | 0 | 0.0% |
| $50,000 to $74,999 | 0 | 0.0% |
| $75,000 to $99,999 | 57 | 45.6% |
| $100,000 to $149,999 | 0 | 0.0% |
| $150,000 to $199,999 | 0 | 0.0% |
| $200,000+ | 68 | 54.4% |
Family Income by Famaliy Size in Edgartown
| Income Bracket | # Families | Median Income |
| 2-Person Families | 82 (65.6%) | $0 |
| 3-Person Families | 43 (34.4%) | $0 |
| 4-Person Families | 0 (0.0%) | $0 |
| 5-Person Families | 0 (0.0%) | $0 |
| 6-Person Families | 0 (0.0%) | $0 |
| 7+ Person Families | 0 (0.0%) | $0 |
| Total | 125 (100.0%) | $250,001 |
Family Income by Number of Earners in Edgartown
| Number of Earners | # Families | Median Income |
| No Earners | 0 (0.0%) | $0 |
| 1 Earner | 57 (45.6%) | $0 |
| 2 Earners | 68 (54.4%) | $0 |
| 3+ Earners | 0 (0.0%) | $0 |
| Total | 125 (100.0%) | $250,001 |
Household Income in Edgartown
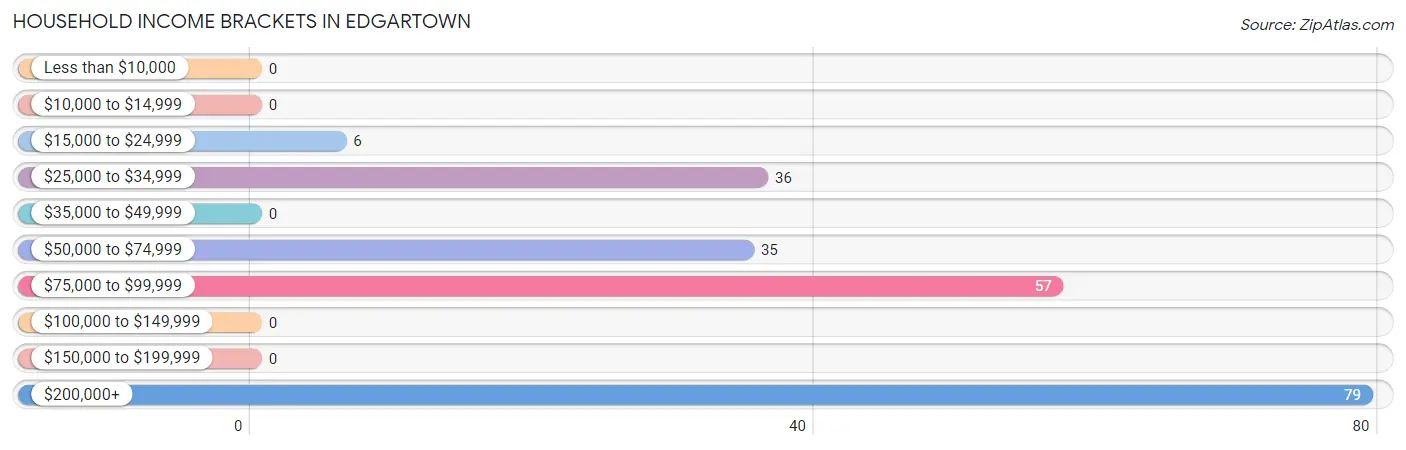
Household Income Brackets in Edgartown
With 79 households falling in the category, the $200,000+ income range is the most frequent in Edgartown, accounting for 37.1% of all households.
| Income Bracket | # Households | % Households |
| Less than $10,000 | 0 | 0.0% |
| $10,000 to $14,999 | 0 | 0.0% |
| $15,000 to $24,999 | 6 | 2.8% |
| $25,000 to $34,999 | 36 | 16.9% |
| $35,000 to $49,999 | 0 | 0.0% |
| $50,000 to $74,999 | 35 | 16.4% |
| $75,000 to $99,999 | 57 | 26.8% |
| $100,000 to $149,999 | 0 | 0.0% |
| $150,000 to $199,999 | 0 | 0.0% |
| $200,000+ | 79 | 37.1% |
Household Income by Householder Age in Edgartown
| Income Bracket | # Households | Median Income |
| 15 to 24 Years | 0 (0.0%) | $0 |
| 25 to 44 Years | 0 (0.0%) | $0 |
| 45 to 64 Years | 60 (28.2%) | $0 |
| 65+ Years | 153 (71.8%) | $0 |
| Total | 213 (100.0%) | $0 |
Poverty in Edgartown
Income Below Poverty by Sex and Age in Edgartown
| Age Bracket | Male | Female |
| Under 5 Years | 0 (0.0%) | 0 (0.0%) |
| 5 Years | 0 (0.0%) | 0 (0.0%) |
| 6 to 11 Years | 0 (0.0%) | 0 (0.0%) |
| 12 to 14 Years | 0 (0.0%) | 0 (0.0%) |
| 15 Years | 0 (0.0%) | 0 (0.0%) |
| 16 and 17 Years | 0 (0.0%) | 0 (0.0%) |
| 18 to 24 Years | 0 (0.0%) | 0 (0.0%) |
| 25 to 34 Years | 0 (0.0%) | 0 (0.0%) |
| 35 to 44 Years | 0 (0.0%) | 0 (0.0%) |
| 45 to 54 Years | 0 (0.0%) | 0 (0.0%) |
| 55 to 64 Years | 0 (0.0%) | 0 (0.0%) |
| 65 to 74 Years | 0 (0.0%) | 0 (0.0%) |
| 75 Years and over | 0 (0.0%) | 0 (0.0%) |
| Total | 0 (0.0%) | 0 (0.0%) |
Income Above Poverty by Sex and Age in Edgartown
According to the poverty statistics in Edgartown, males aged 55 to 64 years and females aged 55 to 64 years are the age groups that are most secure financially, with 100.0% of males and 100.0% of females in these age groups living above the poverty line.
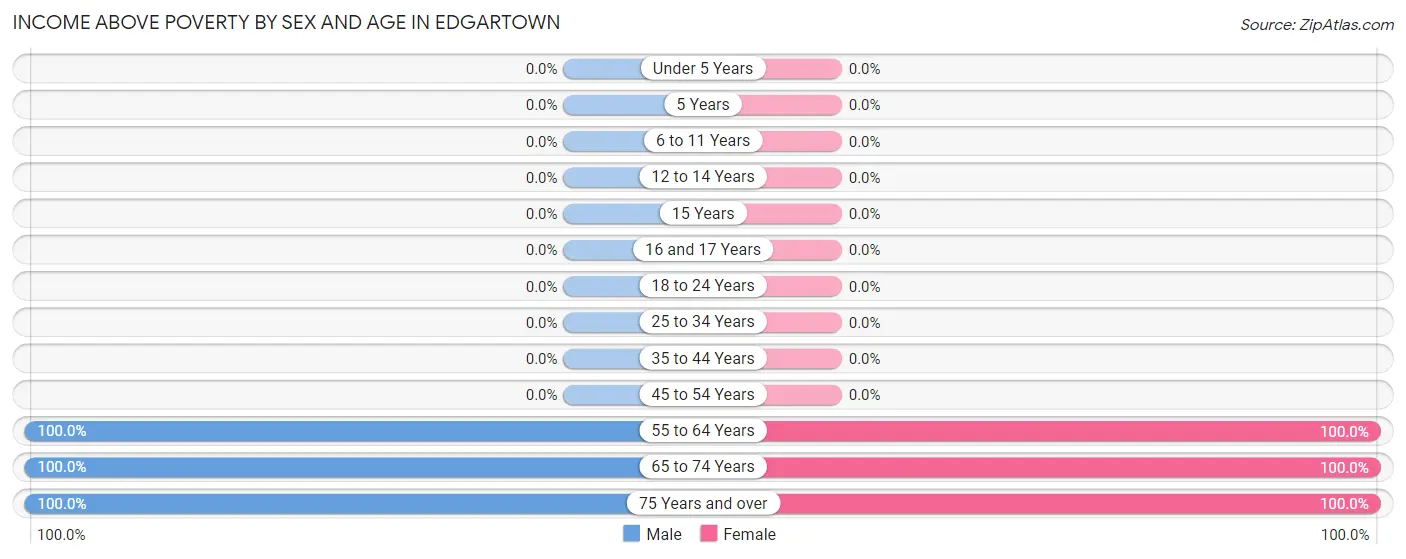
| Age Bracket | Male | Female |
| Under 5 Years | 0 (0.0%) | 0 (0.0%) |
| 5 Years | 0 (0.0%) | 0 (0.0%) |
| 6 to 11 Years | 0 (0.0%) | 0 (0.0%) |
| 12 to 14 Years | 0 (0.0%) | 0 (0.0%) |
| 15 Years | 0 (0.0%) | 0 (0.0%) |
| 16 and 17 Years | 0 (0.0%) | 0 (0.0%) |
| 18 to 24 Years | 0 (0.0%) | 0 (0.0%) |
| 25 to 34 Years | 0 (0.0%) | 0 (0.0%) |
| 35 to 44 Years | 0 (0.0%) | 0 (0.0%) |
| 45 to 54 Years | 0 (0.0%) | 0 (0.0%) |
| 55 to 64 Years | 153 (100.0%) | 189 (100.0%) |
| 65 to 74 Years | 6 (100.0%) | 36 (100.0%) |
| 75 Years and over | 77 (100.0%) | 111 (100.0%) |
| Total | 236 (100.0%) | 336 (100.0%) |
Income Below Poverty Among Married-Couple Families in Edgartown
| Children | Above Poverty | Below Poverty |
| No Children | 82 (100.0%) | 0 (0.0%) |
| 1 or 2 Children | 0 (0.0%) | 0 (0.0%) |
| 3 or 4 Children | 0 (0.0%) | 0 (0.0%) |
| 5 or more Children | 0 (0.0%) | 0 (0.0%) |
| Total | 82 (100.0%) | 0 (0.0%) |
Income Below Poverty Among Single-Parent Households in Edgartown
| Children | Single Father | Single Mother |
| No Children | 0 (0.0%) | 0 (0.0%) |
| 1 or 2 Children | 0 (0.0%) | 0 (0.0%) |
| 3 or 4 Children | 0 (0.0%) | 0 (0.0%) |
| 5 or more Children | 0 (0.0%) | 0 (0.0%) |
| Total | 0 (0.0%) | 0 (0.0%) |
Income Below Poverty Among Married-Couple vs Single-Parent Households in Edgartown
| Children | Married-Couple Families | Single-Parent Households |
| No Children | 0 (0.0%) | 0 (0.0%) |
| 1 or 2 Children | 0 (0.0%) | 0 (0.0%) |
| 3 or 4 Children | 0 (0.0%) | 0 (0.0%) |
| 5 or more Children | 0 (0.0%) | 0 (0.0%) |
| Total | 0 (0.0%) | 0 (0.0%) |
Race in Edgartown
The most populous races in Edgartown are White / Caucasian (605 | 99.2%), Black / African American (3 | 0.5%), and Hispanic or Latino (3 | 0.5%).
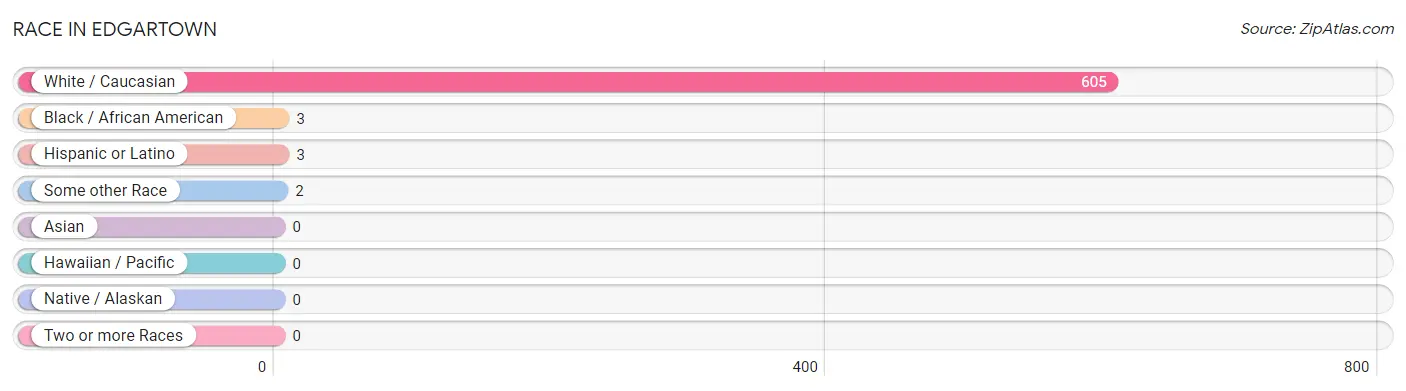
| Race | # Population | % Population |
| Asian | 0 | 0.0% |
| Black / African American | 3 | 0.5% |
| Hawaiian / Pacific | 0 | 0.0% |
| Hispanic or Latino | 3 | 0.5% |
| Native / Alaskan | 0 | 0.0% |
| White / Caucasian | 605 | 99.2% |
| Two or more Races | 0 | 0.0% |
| Some other Race | 2 | 0.3% |
| Total | 610 | 100.0% |
Ancestry in Edgartown
The most populous ancestries reported in Edgartown are English (195 | 32.0%), Irish (154 | 25.3%), Hungarian (125 | 20.5%), Italian (124 | 20.3%), and German (36 | 5.9%), together accounting for 103.9% of all Edgartown residents.
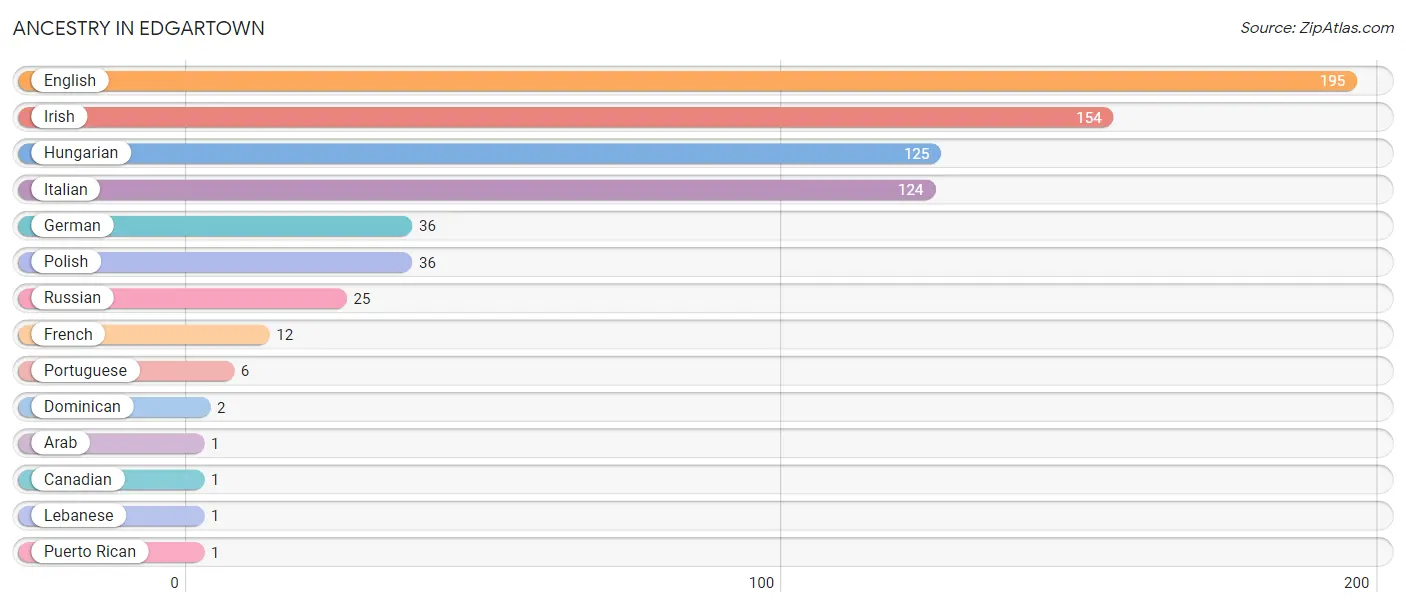
| Ancestry | # Population | % Population |
| Arab | 1 | 0.2% |
| Canadian | 1 | 0.2% |
| Dominican | 2 | 0.3% |
| English | 195 | 32.0% |
| French | 12 | 2.0% |
| German | 36 | 5.9% |
| Hungarian | 125 | 20.5% |
| Irish | 154 | 25.3% |
| Italian | 124 | 20.3% |
| Lebanese | 1 | 0.2% |
| Polish | 36 | 5.9% |
| Portuguese | 6 | 1.0% |
| Puerto Rican | 1 | 0.2% |
| Russian | 25 | 4.1% | View All 14 Rows |
Immigrants in Edgartown
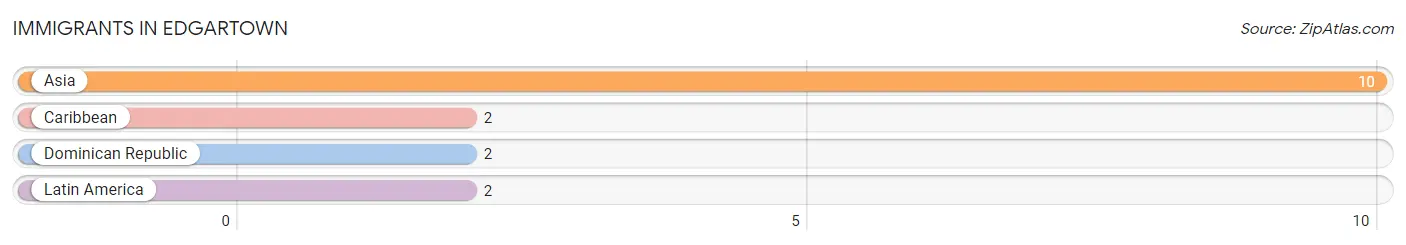
The most numerous immigrant groups reported in Edgartown came from Asia (10 | 1.6%), Caribbean (2 | 0.3%), Dominican Republic (2 | 0.3%), and Latin America (2 | 0.3%), together accounting for 2.6% of all Edgartown residents.
| Immigration Origin | # Population | % Population |
| Asia | 10 | 1.6% |
| Caribbean | 2 | 0.3% |
| Dominican Republic | 2 | 0.3% |
| Latin America | 2 | 0.3% | View All 4 Rows |
Sex and Age in Edgartown
Sex and Age in Edgartown
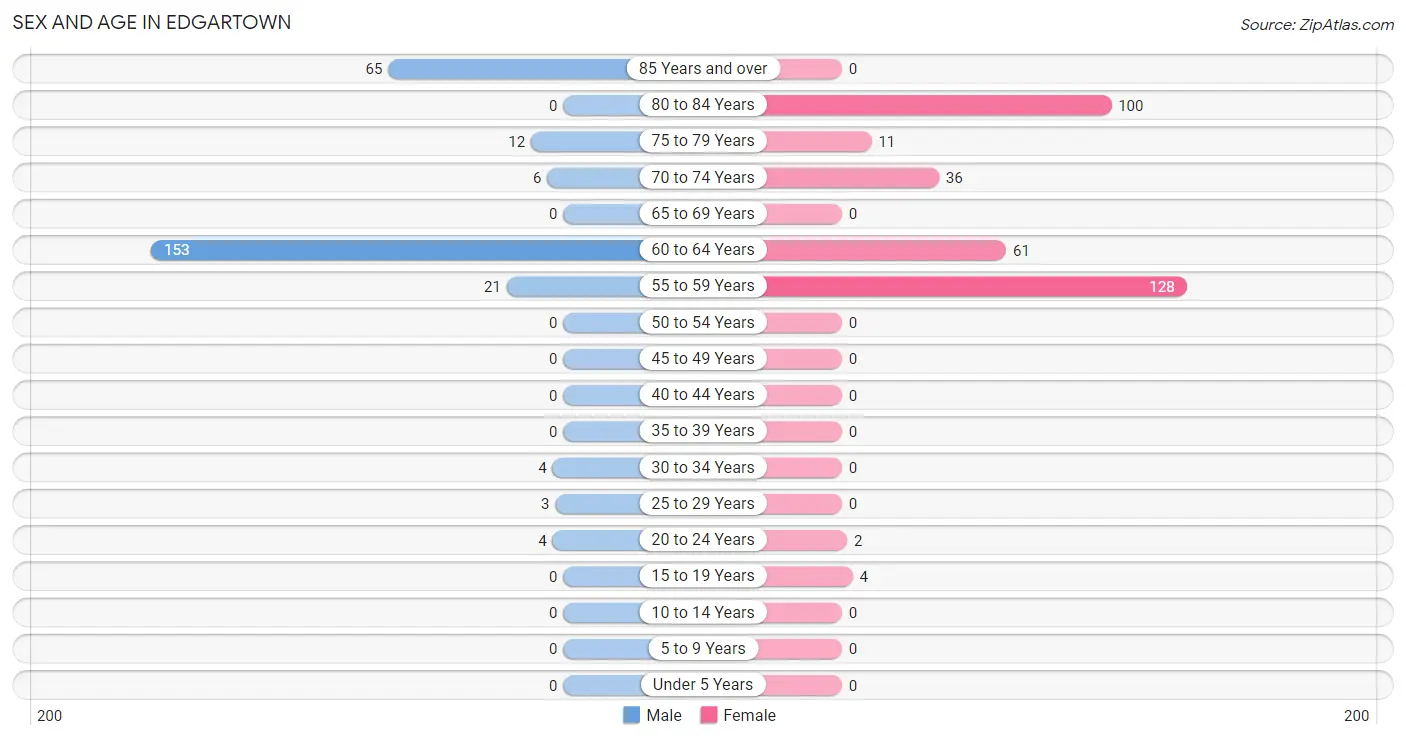
The most populous age groups in Edgartown are 60 to 64 Years (153 | 57.1%) for men and 55 to 59 Years (128 | 37.4%) for women.
| Age Bracket | Male | Female |
| Under 5 Years | 0 (0.0%) | 0 (0.0%) |
| 5 to 9 Years | 0 (0.0%) | 0 (0.0%) |
| 10 to 14 Years | 0 (0.0%) | 0 (0.0%) |
| 15 to 19 Years | 0 (0.0%) | 4 (1.2%) |
| 20 to 24 Years | 4 (1.5%) | 2 (0.6%) |
| 25 to 29 Years | 3 (1.1%) | 0 (0.0%) |
| 30 to 34 Years | 4 (1.5%) | 0 (0.0%) |
| 35 to 39 Years | 0 (0.0%) | 0 (0.0%) |
| 40 to 44 Years | 0 (0.0%) | 0 (0.0%) |
| 45 to 49 Years | 0 (0.0%) | 0 (0.0%) |
| 50 to 54 Years | 0 (0.0%) | 0 (0.0%) |
| 55 to 59 Years | 21 (7.8%) | 128 (37.4%) |
| 60 to 64 Years | 153 (57.1%) | 61 (17.8%) |
| 65 to 69 Years | 0 (0.0%) | 0 (0.0%) |
| 70 to 74 Years | 6 (2.2%) | 36 (10.5%) |
| 75 to 79 Years | 12 (4.5%) | 11 (3.2%) |
| 80 to 84 Years | 0 (0.0%) | 100 (29.2%) |
| 85 Years and over | 65 (24.2%) | 0 (0.0%) |
| Total | 268 (100.0%) | 342 (100.0%) |
Families and Households in Edgartown
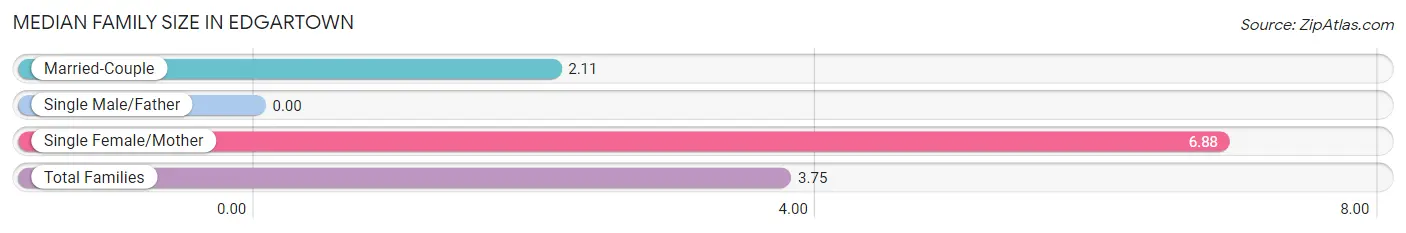
Median Family Size in Edgartown
| Family Type | # Families | Family Size |
| Married-Couple | 82 (65.6%) | 2.11 |
| Single Male/Father | 0 (0.0%) | - |
| Single Female/Mother | 43 (34.4%) | 6.88 |
| Total Families | 125 (100.0%) | 3.75 |
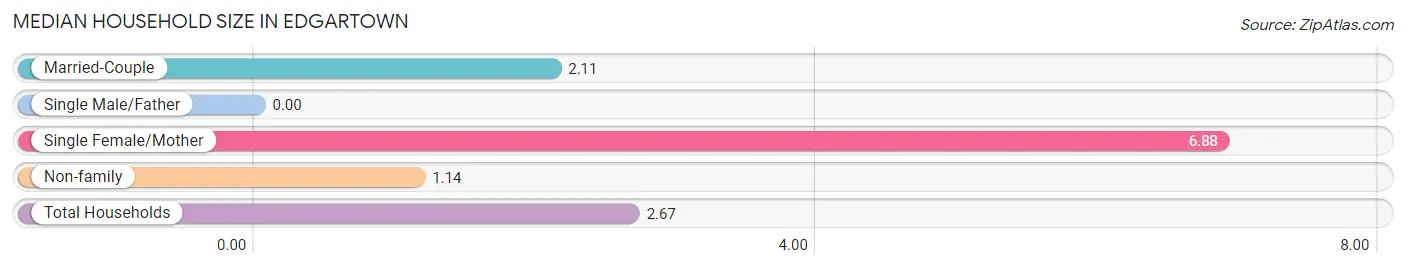
Median Household Size in Edgartown
| Household Type | # Households | Household Size |
| Married-Couple | 82 (38.5%) | 2.11 |
| Single Male/Father | 0 (0.0%) | - |
| Single Female/Mother | 43 (20.2%) | 6.88 |
| Non-family | 88 (41.3%) | 1.14 |
| Total Households | 213 (100.0%) | 2.67 |
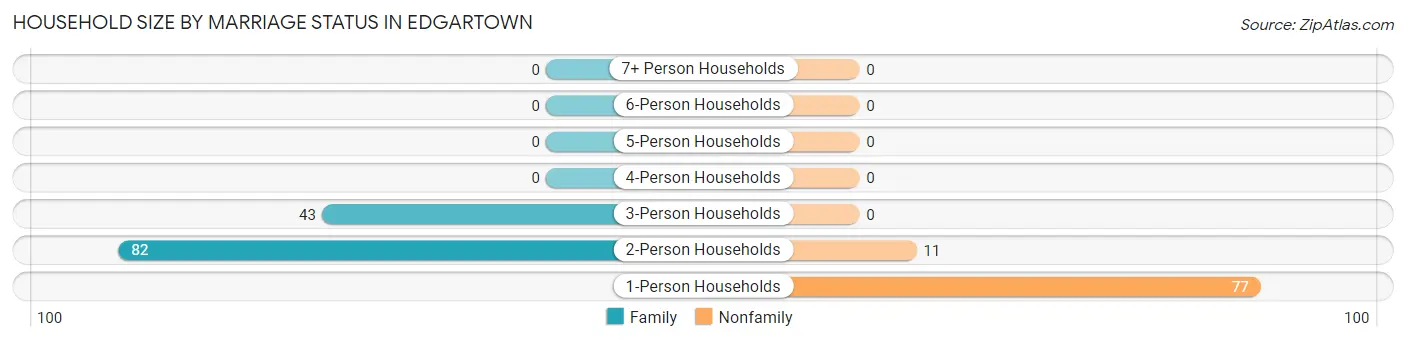
Household Size by Marriage Status in Edgartown
Out of a total of 213 households in Edgartown, 125 (58.7%) are family households, while 88 (41.3%) are nonfamily households. The most numerous type of family households are 2-person households, comprising 82, and the most common type of nonfamily households are 1-person households, comprising 77.
| Household Size | Family Households | Nonfamily Households |
| 1-Person Households | - | 77 (36.1%) |
| 2-Person Households | 82 (38.5%) | 11 (5.2%) |
| 3-Person Households | 43 (20.2%) | 0 (0.0%) |
| 4-Person Households | 0 (0.0%) | 0 (0.0%) |
| 5-Person Households | 0 (0.0%) | 0 (0.0%) |
| 6-Person Households | 0 (0.0%) | 0 (0.0%) |
| 7+ Person Households | 0 (0.0%) | 0 (0.0%) |
| Total | 125 (58.7%) | 88 (41.3%) |
Female Fertility in Edgartown
Fertility by Age in Edgartown
| Age Bracket | Women with Births | Births / 1,000 Women |
| 15 to 19 years | 0 (0.0%) | 0.0 |
| 20 to 34 years | 0 (0.0%) | 0.0 |
| 35 to 50 years | 0 (0.0%) | 0.0 |
| Total | 0 (0.0%) | 0.0 |
Fertility by Age by Marriage Status in Edgartown
| Age Bracket | Married | Unmarried |
| 15 to 19 years | 0 (0.0%) | 0 (0.0%) |
| 20 to 34 years | 0 (0.0%) | 0 (0.0%) |
| 35 to 50 years | 0 (0.0%) | 0 (0.0%) |
| Total | 0 (0.0%) | 0 (0.0%) |
Fertility by Education in Edgartown
| Educational Attainment | Women with Births | Births / 1,000 Women |
| Less than High School | 0 (0.0%) | 0.0 |
| High School Diploma | 0 (0.0%) | 0.0 |
| College or Associate's Degree | 0 (0.0%) | 0.0 |
| Bachelor's Degree | 0 (0.0%) | 0.0 |
| Graduate Degree | 0 (0.0%) | 0.0 |
| Total | 0 (0.0%) | 0.0 |
Fertility by Education by Marriage Status in Edgartown
| Educational Attainment | Married | Unmarried |
| Less than High School | 0 (0.0%) | 0 (0.0%) |
| High School Diploma | 0 (0.0%) | 0 (0.0%) |
| College or Associate's Degree | 0 (0.0%) | 0 (0.0%) |
| Bachelor's Degree | 0 (0.0%) | 0 (0.0%) |
| Graduate Degree | 0 (0.0%) | 0 (0.0%) |
| Total | 0 (0.0%) | 0 (0.0%) |
Employment Characteristics in Edgartown
Employment by Class of Employer in Edgartown
Among the 357 employed individuals in Edgartown, private company employees (280 | 78.4%), self-employed (not incorporated) (47 | 13.2%), and self-employed (incorporated) (26 | 7.3%) make up the most common classes of employment.
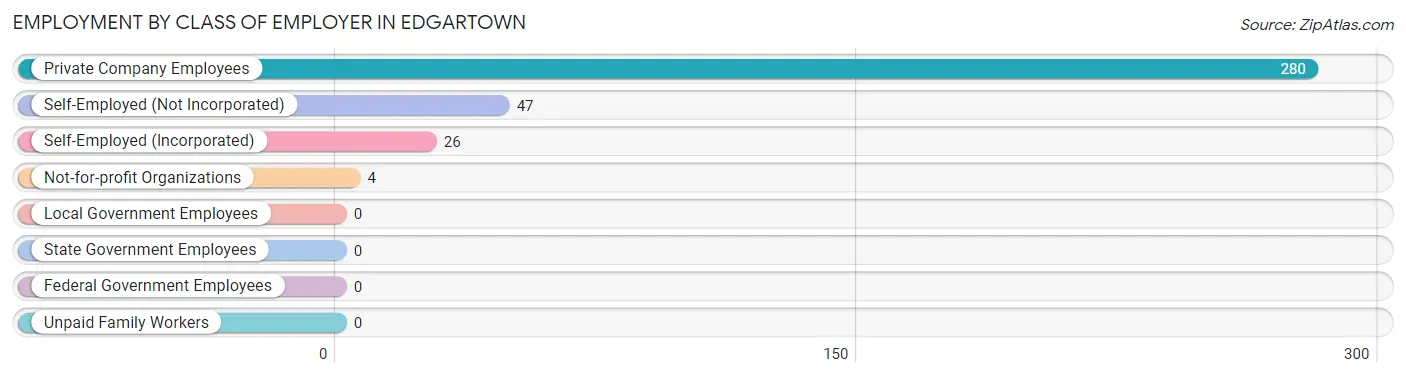
| Employer Class | # Employees | % Employees |
| Private Company Employees | 280 | 78.4% |
| Self-Employed (Incorporated) | 26 | 7.3% |
| Self-Employed (Not Incorporated) | 47 | 13.2% |
| Not-for-profit Organizations | 4 | 1.1% |
| Local Government Employees | 0 | 0.0% |
| State Government Employees | 0 | 0.0% |
| Federal Government Employees | 0 | 0.0% |
| Unpaid Family Workers | 0 | 0.0% |
| Total | 357 | 100.0% |
Employment Status by Age in Edgartown
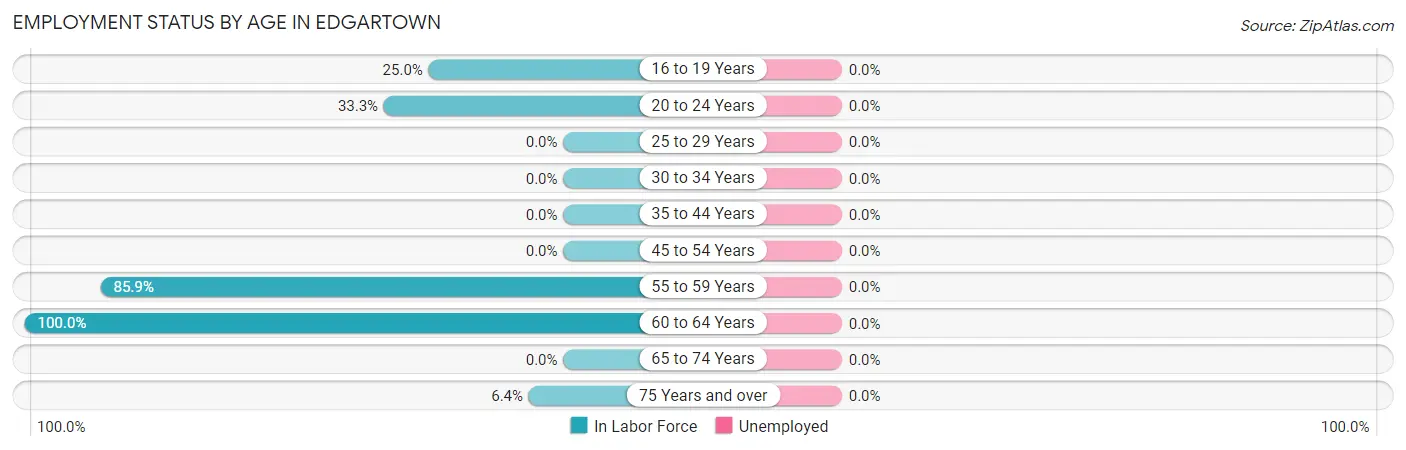
| Age Bracket | In Labor Force | Unemployed |
| 16 to 19 Years | 1 (25.0%) | 0 (0.0%) |
| 20 to 24 Years | 2 (33.3%) | 0 (0.0%) |
| 25 to 29 Years | 0 (0.0%) | 0 (0.0%) |
| 30 to 34 Years | 0 (0.0%) | 0 (0.0%) |
| 35 to 44 Years | 0 (0.0%) | 0 (0.0%) |
| 45 to 54 Years | 0 (0.0%) | 0 (0.0%) |
| 55 to 59 Years | 128 (85.9%) | 0 (0.0%) |
| 60 to 64 Years | 214 (100.0%) | 0 (0.0%) |
| 65 to 74 Years | 0 (0.0%) | 0 (0.0%) |
| 75 Years and over | 12 (6.4%) | 0 (0.0%) |
| Total | 357 (58.5%) | 0 (0.0%) |
Employment Status by Educational Attainment in Edgartown
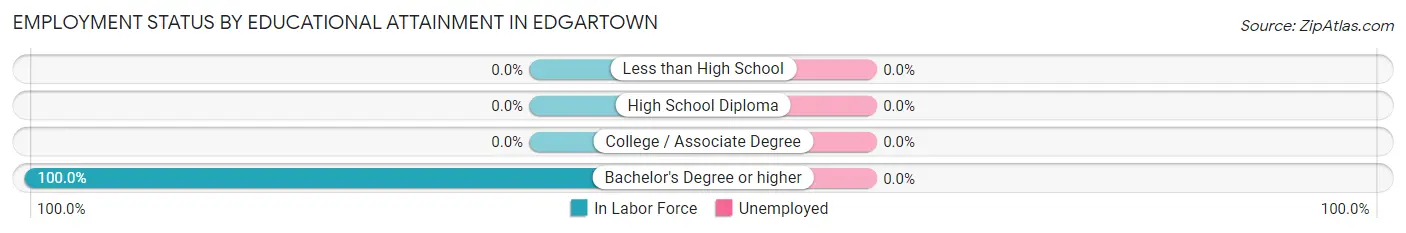
| Educational Attainment | In Labor Force | Unemployed |
| Less than High School | 0 (0.0%) | 0 (0.0%) |
| High School Diploma | 0 (0.0%) | 0 (0.0%) |
| College / Associate Degree | 0 (0.0%) | 0 (0.0%) |
| Bachelor's Degree or higher | 342 (100.0%) | 0 (0.0%) |
| Total | 342 (92.4%) | 0 (0.0%) |
Employment Occupations by Sex in Edgartown
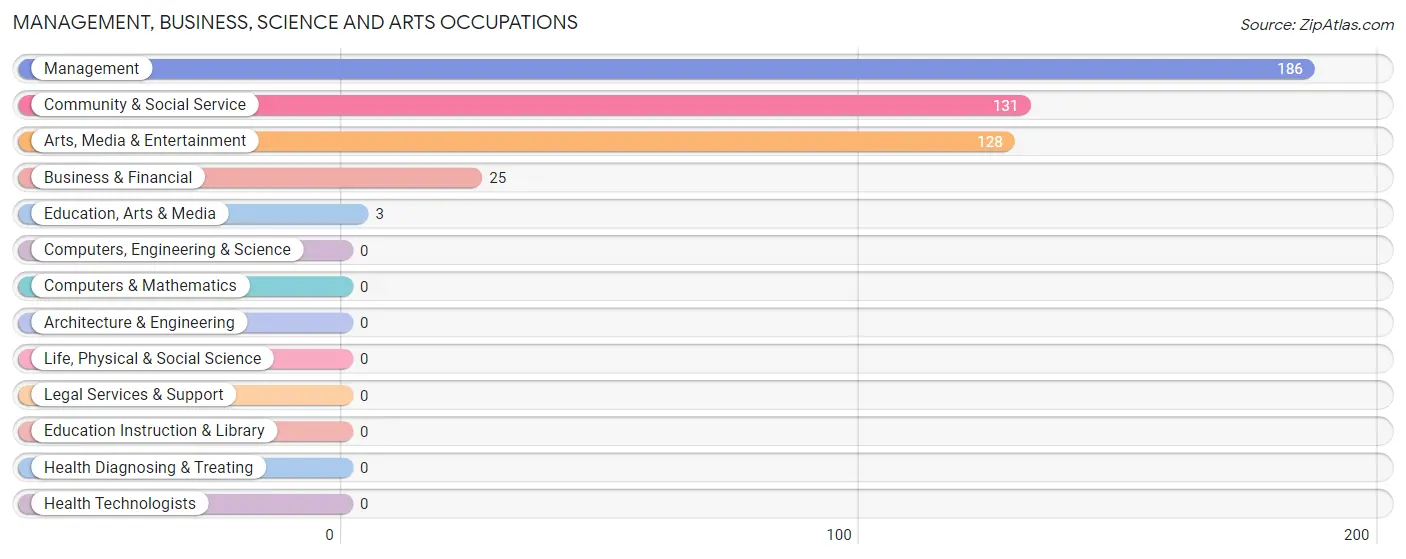
Management, Business, Science and Arts Occupations
The most common Management, Business, Science and Arts occupations in Edgartown are Management (186 | 52.1%), Community & Social Service (131 | 36.7%), Arts, Media & Entertainment (128 | 35.8%), Business & Financial (25 | 7.0%), and Education, Arts & Media (3 | 0.8%).
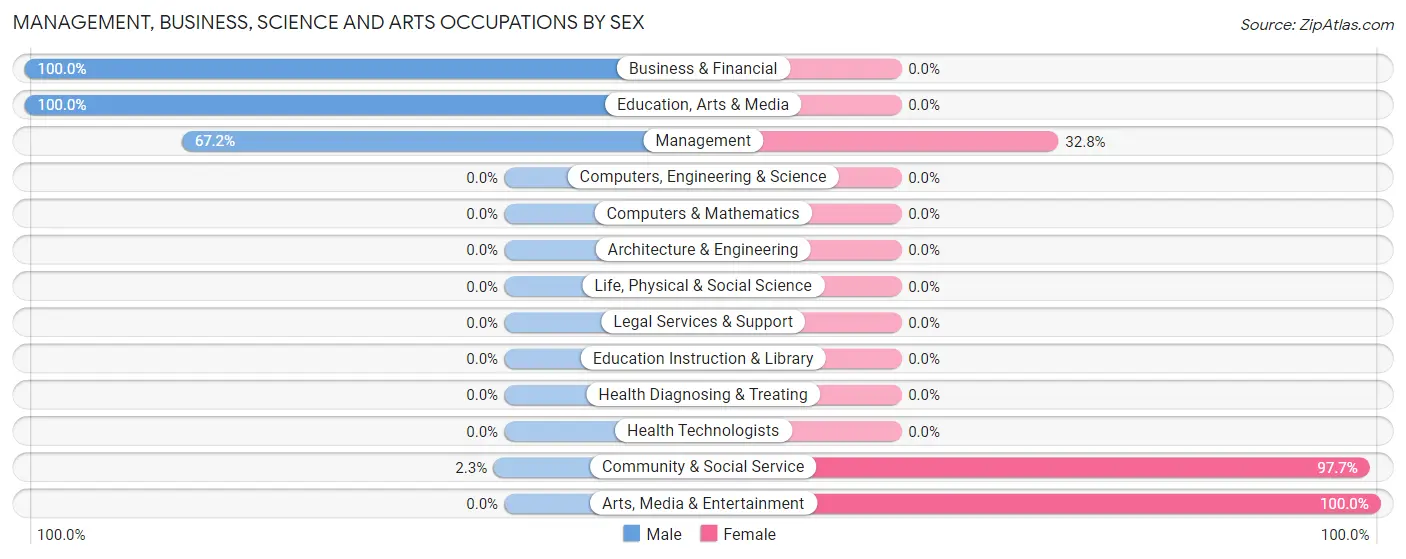
Management, Business, Science and Arts Occupations by Sex
Within the Management, Business, Science and Arts occupations in Edgartown, the most male-oriented occupations are Business & Financial (100.0%), Education, Arts & Media (100.0%), and Management (67.2%), while the most female-oriented occupations are Arts, Media & Entertainment (100.0%), Community & Social Service (97.7%), and Management (32.8%).
| Occupation | Male | Female |
| Management | 125 (67.2%) | 61 (32.8%) |
| Business & Financial | 25 (100.0%) | 0 (0.0%) |
| Computers, Engineering & Science | 0 (0.0%) | 0 (0.0%) |
| Computers & Mathematics | 0 (0.0%) | 0 (0.0%) |
| Architecture & Engineering | 0 (0.0%) | 0 (0.0%) |
| Life, Physical & Social Science | 0 (0.0%) | 0 (0.0%) |
| Community & Social Service | 3 (2.3%) | 128 (97.7%) |
| Education, Arts & Media | 3 (100.0%) | 0 (0.0%) |
| Legal Services & Support | 0 (0.0%) | 0 (0.0%) |
| Education Instruction & Library | 0 (0.0%) | 0 (0.0%) |
| Arts, Media & Entertainment | 0 (0.0%) | 128 (100.0%) |
| Health Diagnosing & Treating | 0 (0.0%) | 0 (0.0%) |
| Health Technologists | 0 (0.0%) | 0 (0.0%) |
| Total (Category) | 153 (44.7%) | 189 (55.3%) |
| Total (Overall) | 166 (46.5%) | 191 (53.5%) |
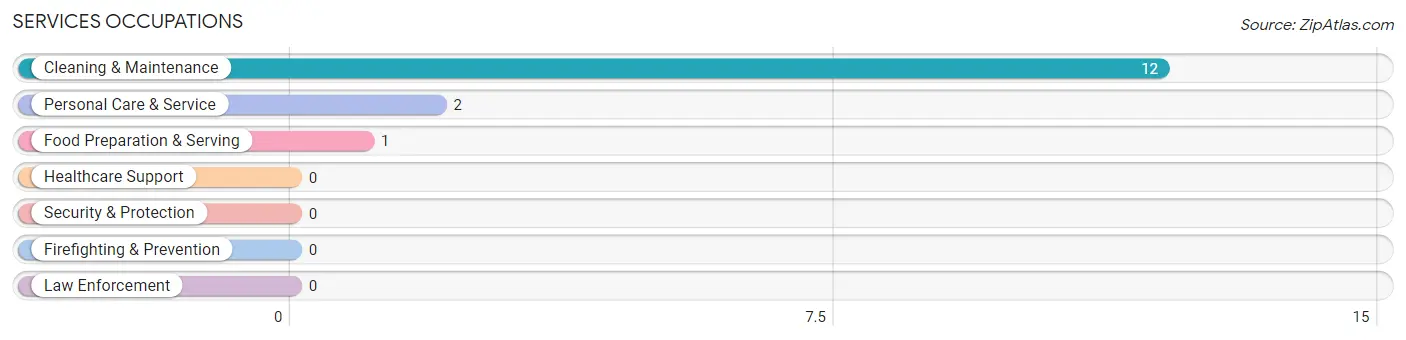
Services Occupations
The most common Services occupations in Edgartown are Cleaning & Maintenance (12 | 3.4%), Personal Care & Service (2 | 0.6%), and Food Preparation & Serving (1 | 0.3%).
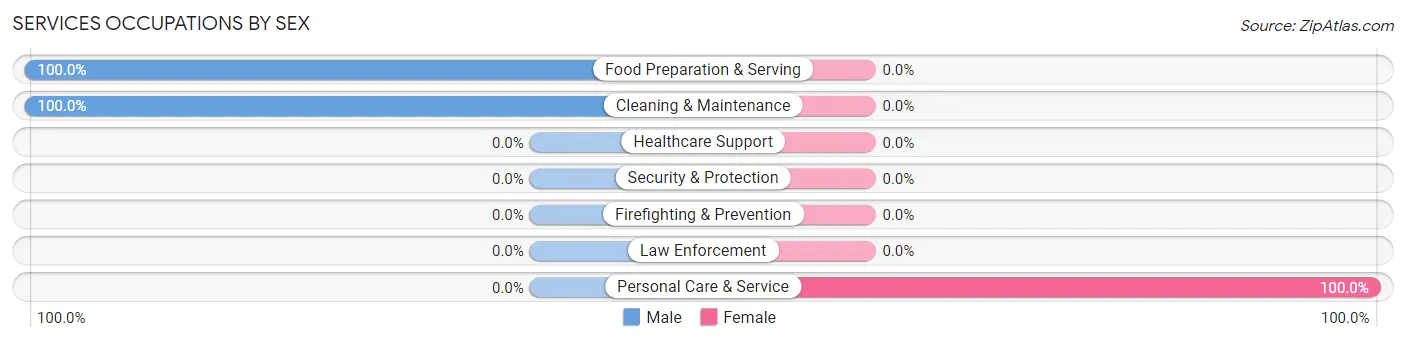
Services Occupations by Sex
| Occupation | Male | Female |
| Healthcare Support | 0 (0.0%) | 0 (0.0%) |
| Security & Protection | 0 (0.0%) | 0 (0.0%) |
| Firefighting & Prevention | 0 (0.0%) | 0 (0.0%) |
| Law Enforcement | 0 (0.0%) | 0 (0.0%) |
| Food Preparation & Serving | 1 (100.0%) | 0 (0.0%) |
| Cleaning & Maintenance | 12 (100.0%) | 0 (0.0%) |
| Personal Care & Service | 0 (0.0%) | 2 (100.0%) |
| Total (Category) | 13 (86.7%) | 2 (13.3%) |
| Total (Overall) | 166 (46.5%) | 191 (53.5%) |
Sales and Office Occupations
Sales and Office Occupations by Sex
| Occupation | Male | Female |
| Sales & Related | 0 (0.0%) | 0 (0.0%) |
| Office & Administration | 0 (0.0%) | 0 (0.0%) |
| Total (Category) | 0 (0.0%) | 0 (0.0%) |
| Total (Overall) | 166 (46.5%) | 191 (53.5%) |
Natural Resources, Construction and Maintenance Occupations
Natural Resources, Construction and Maintenance Occupations by Sex
| Occupation | Male | Female |
| Farming, Fishing & Forestry | 0 (0.0%) | 0 (0.0%) |
| Construction & Extraction | 0 (0.0%) | 0 (0.0%) |
| Installation, Maintenance & Repair | 0 (0.0%) | 0 (0.0%) |
| Total (Category) | 0 (0.0%) | 0 (0.0%) |
| Total (Overall) | 166 (46.5%) | 191 (53.5%) |
Production, Transportation and Moving Occupations
Production, Transportation and Moving Occupations by Sex
| Occupation | Male | Female |
| Production | 0 (0.0%) | 0 (0.0%) |
| Transportation | 0 (0.0%) | 0 (0.0%) |
| Material Moving | 0 (0.0%) | 0 (0.0%) |
| Total (Category) | 0 (0.0%) | 0 (0.0%) |
| Total (Overall) | 166 (46.5%) | 191 (53.5%) |
Employment Industries by Sex in Edgartown
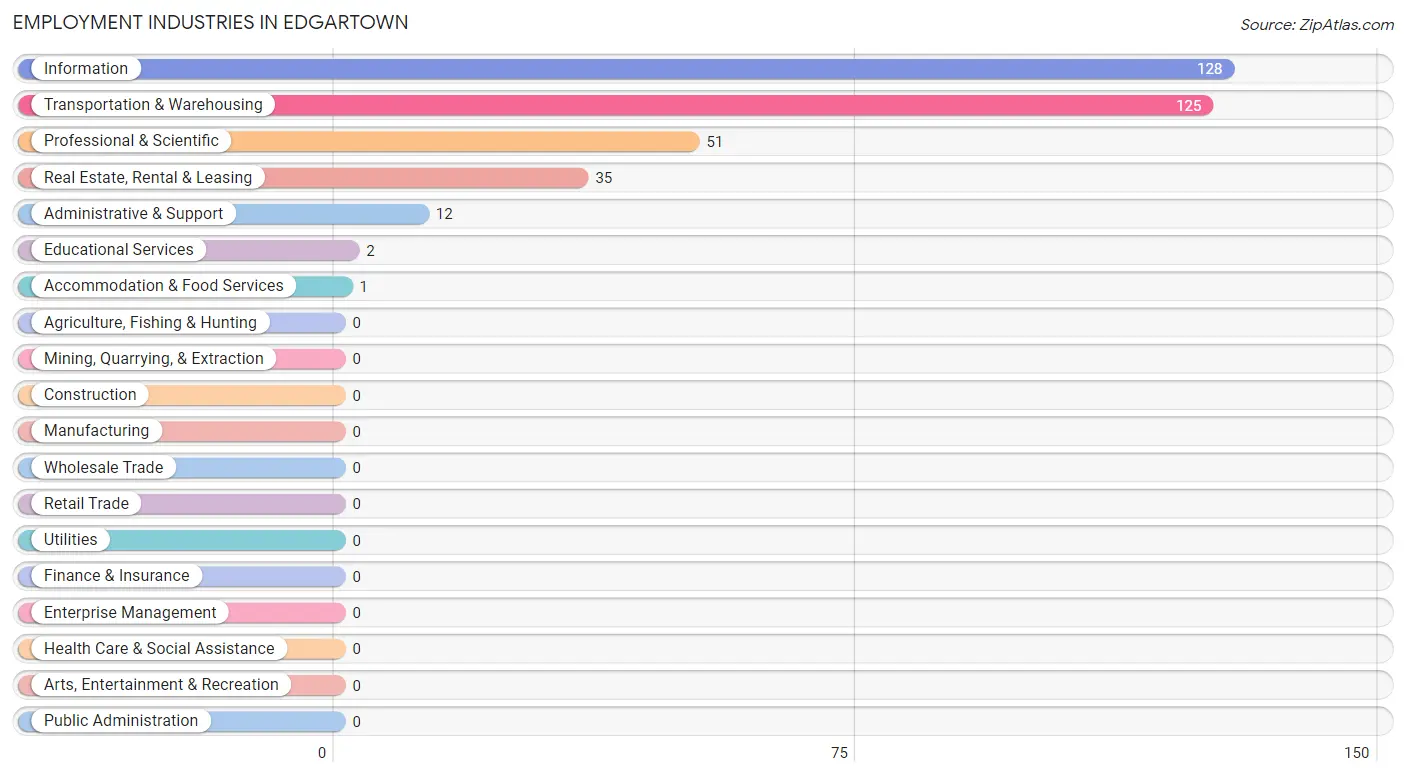
Employment Industries in Edgartown
The major employment industries in Edgartown include Information (128 | 35.8%), Transportation & Warehousing (125 | 35.0%), Professional & Scientific (51 | 14.3%), Real Estate, Rental & Leasing (35 | 9.8%), and Administrative & Support (12 | 3.4%).
Employment Industries by Sex in Edgartown
The Edgartown industries that see more men than women are Transportation & Warehousing (100.0%), Administrative & Support (100.0%), and Accommodation & Food Services (100.0%), whereas the industries that tend to have a higher number of women are Information (100.0%), Real Estate, Rental & Leasing (100.0%), and Educational Services (100.0%).
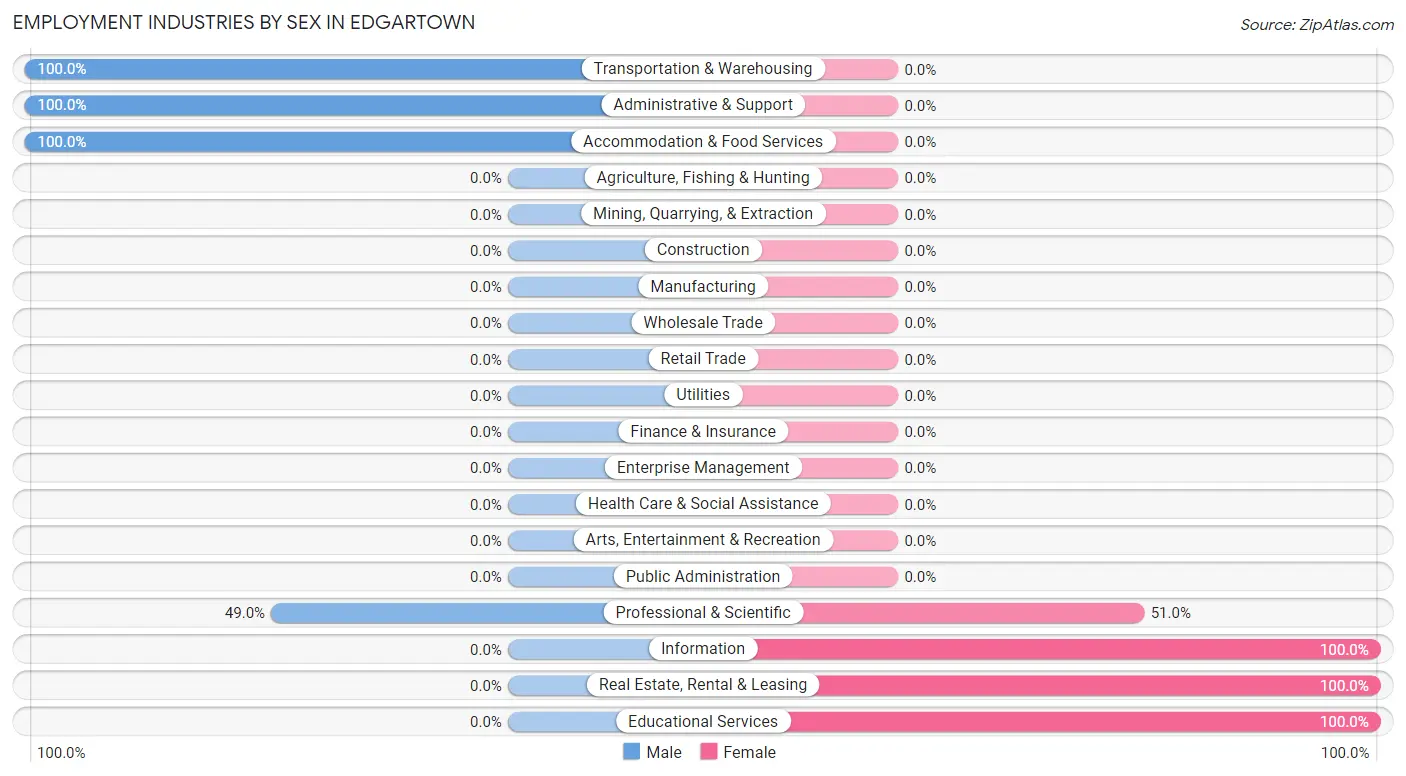
| Industry | Male | Female |
| Agriculture, Fishing & Hunting | 0 (0.0%) | 0 (0.0%) |
| Mining, Quarrying, & Extraction | 0 (0.0%) | 0 (0.0%) |
| Construction | 0 (0.0%) | 0 (0.0%) |
| Manufacturing | 0 (0.0%) | 0 (0.0%) |
| Wholesale Trade | 0 (0.0%) | 0 (0.0%) |
| Retail Trade | 0 (0.0%) | 0 (0.0%) |
| Transportation & Warehousing | 125 (100.0%) | 0 (0.0%) |
| Utilities | 0 (0.0%) | 0 (0.0%) |
| Information | 0 (0.0%) | 128 (100.0%) |
| Finance & Insurance | 0 (0.0%) | 0 (0.0%) |
| Real Estate, Rental & Leasing | 0 (0.0%) | 35 (100.0%) |
| Professional & Scientific | 25 (49.0%) | 26 (51.0%) |
| Enterprise Management | 0 (0.0%) | 0 (0.0%) |
| Administrative & Support | 12 (100.0%) | 0 (0.0%) |
| Educational Services | 0 (0.0%) | 2 (100.0%) |
| Health Care & Social Assistance | 0 (0.0%) | 0 (0.0%) |
| Arts, Entertainment & Recreation | 0 (0.0%) | 0 (0.0%) |
| Accommodation & Food Services | 1 (100.0%) | 0 (0.0%) |
| Public Administration | 0 (0.0%) | 0 (0.0%) |
| Total | 166 (46.5%) | 191 (53.5%) |
Education in Edgartown
School Enrollment in Edgartown
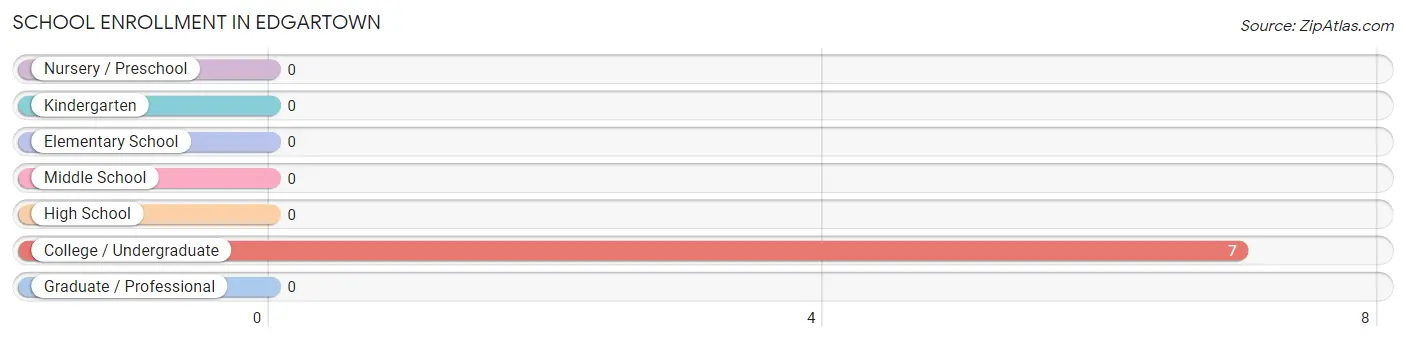
| School Level | # Students | % Students |
| Nursery / Preschool | 0 | 0.0% |
| Kindergarten | 0 | 0.0% |
| Elementary School | 0 | 0.0% |
| Middle School | 0 | 0.0% |
| High School | 0 | 0.0% |
| College / Undergraduate | 7 | 100.0% |
| Graduate / Professional | 0 | 0.0% |
| Total | 7 | 100.0% |
School Enrollment by Age by Funding Source in Edgartown
Out of a total of 7 students who are enrolled in schools in Edgartown, 5 (71.4%) attend a private institution, while the remaining 2 (28.6%) are enrolled in public schools. The age group of 18 to 19 year olds has the highest likelihood of being enrolled in private schools, with 4 (100.0% in the age bracket) enrolled. Conversely, the age group of 20 to 24 year olds has the lowest likelihood of being enrolled in a private school, with 2 (66.7% in the age bracket) attending a public institution.
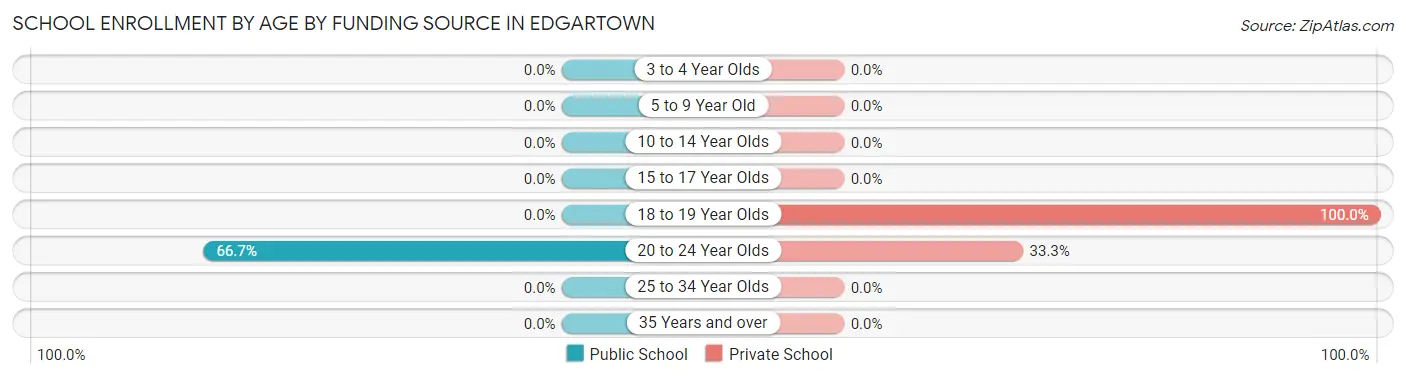
| Age Bracket | Public School | Private School |
| 3 to 4 Year Olds | 0 (0.0%) | 0 (0.0%) |
| 5 to 9 Year Old | 0 (0.0%) | 0 (0.0%) |
| 10 to 14 Year Olds | 0 (0.0%) | 0 (0.0%) |
| 15 to 17 Year Olds | 0 (0.0%) | 0 (0.0%) |
| 18 to 19 Year Olds | 0 (0.0%) | 4 (100.0%) |
| 20 to 24 Year Olds | 2 (66.7%) | 1 (33.3%) |
| 25 to 34 Year Olds | 0 (0.0%) | 0 (0.0%) |
| 35 Years and over | 0 (0.0%) | 0 (0.0%) |
| Total | 2 (28.6%) | 5 (71.4%) |
Educational Attainment by Field of Study in Edgartown
Business (151 | 38.9%), literature & languages (128 | 33.0%), social sciences (60 | 15.5%), liberal arts & history (38 | 9.8%), and psychology (11 | 2.8%) are the most common fields of study among 388 individuals in Edgartown who have obtained a bachelor's degree or higher.
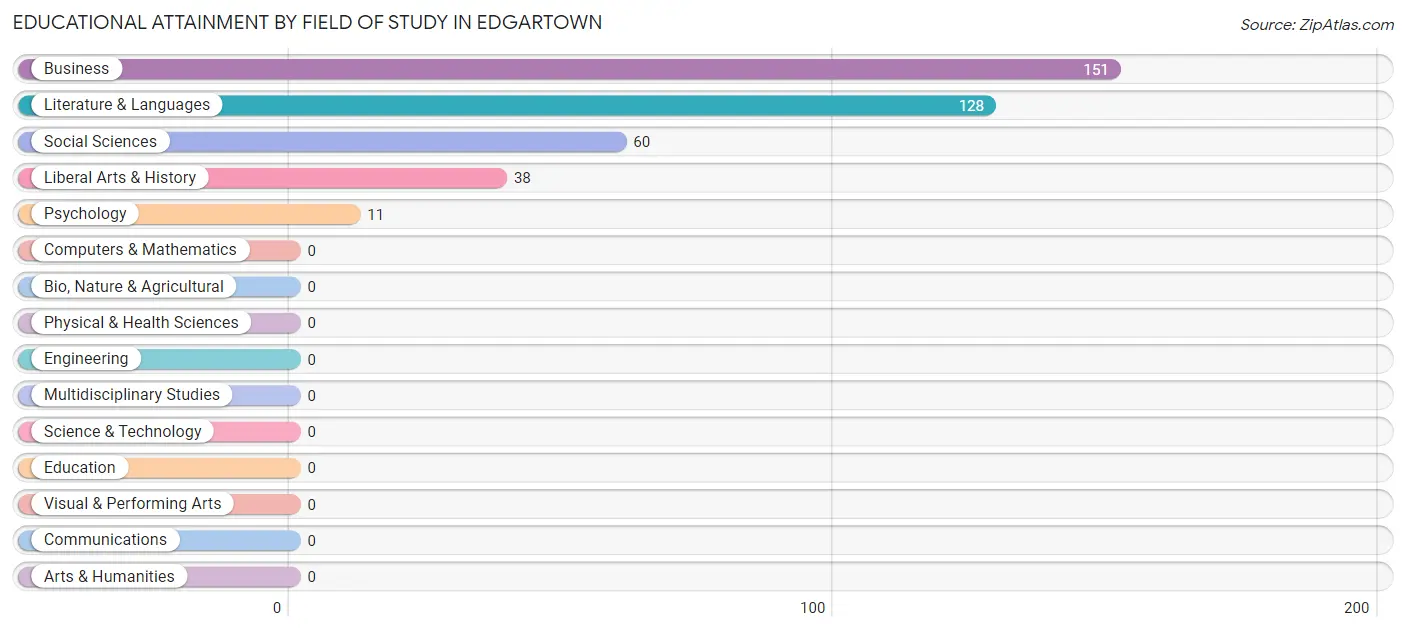
| Field of Study | # Graduates | % Graduates |
| Computers & Mathematics | 0 | 0.0% |
| Bio, Nature & Agricultural | 0 | 0.0% |
| Physical & Health Sciences | 0 | 0.0% |
| Psychology | 11 | 2.8% |
| Social Sciences | 60 | 15.5% |
| Engineering | 0 | 0.0% |
| Multidisciplinary Studies | 0 | 0.0% |
| Science & Technology | 0 | 0.0% |
| Business | 151 | 38.9% |
| Education | 0 | 0.0% |
| Literature & Languages | 128 | 33.0% |
| Liberal Arts & History | 38 | 9.8% |
| Visual & Performing Arts | 0 | 0.0% |
| Communications | 0 | 0.0% |
| Arts & Humanities | 0 | 0.0% |
| Total | 388 | 100.0% |
Transportation & Commute in Edgartown
Vehicle Availability by Sex in Edgartown
The most prevalent vehicle ownership categories in Edgartown are males with 3 vehicles (125, accounting for 77.2%) and females with 3 vehicles (128, making up 66.1%).
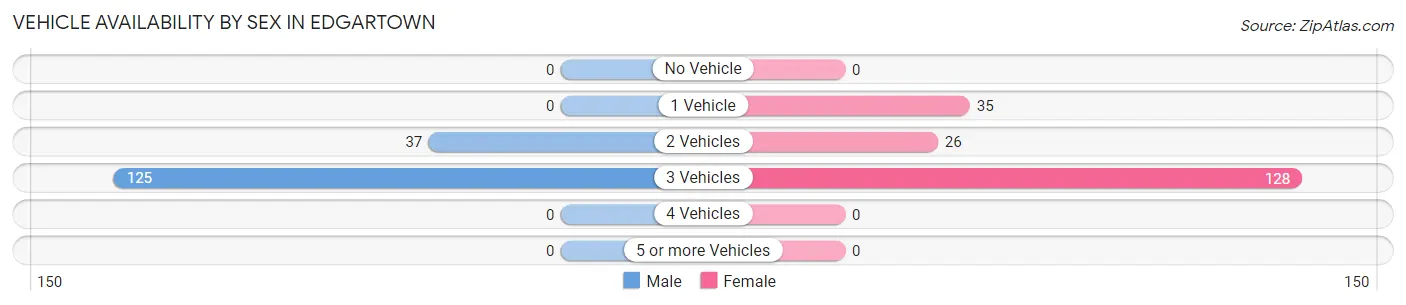
| Vehicles Available | Male | Female |
| No Vehicle | 0 (0.0%) | 0 (0.0%) |
| 1 Vehicle | 0 (0.0%) | 35 (18.5%) |
| 2 Vehicles | 37 (22.8%) | 26 (13.8%) |
| 3 Vehicles | 125 (77.2%) | 128 (67.7%) |
| 4 Vehicles | 0 (0.0%) | 0 (0.0%) |
| 5 or more Vehicles | 0 (0.0%) | 0 (0.0%) |
| Total | 162 (100.0%) | 189 (100.0%) |
Commute Time in Edgartown
The most frequently occuring commute durations in Edgartown are 10 to 14 minutes (186 commuters, 52.7%), 5 to 9 minutes (129 commuters, 36.5%), and less than 5 minutes (37 commuters, 10.5%).
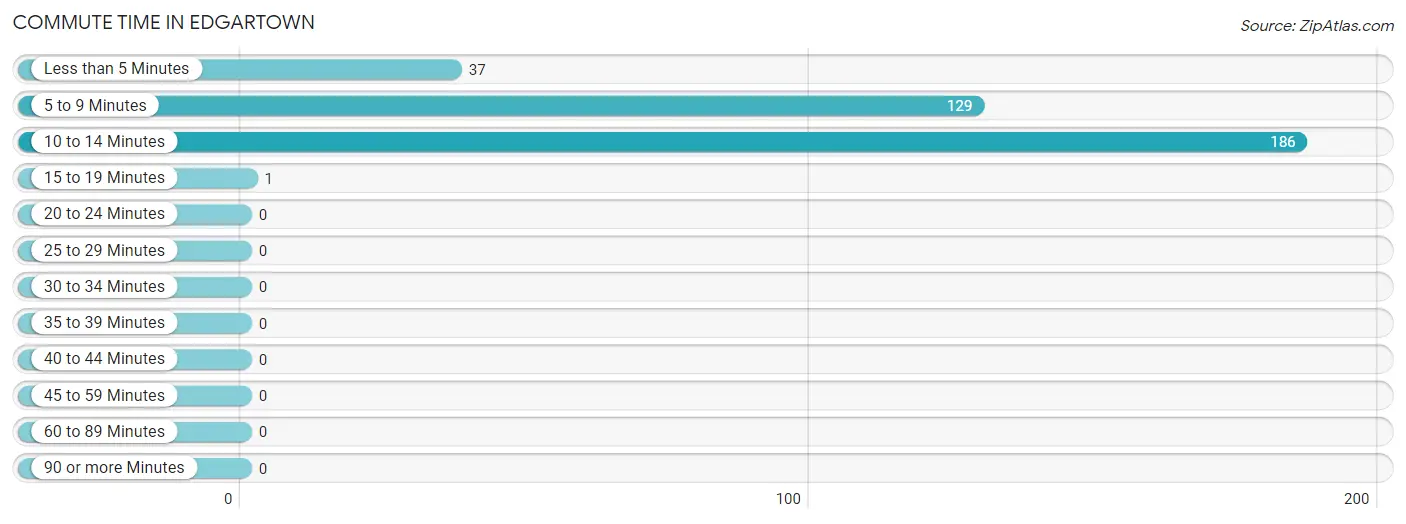
| Commute Time | # Commuters | % Commuters |
| Less than 5 Minutes | 37 | 10.5% |
| 5 to 9 Minutes | 129 | 36.5% |
| 10 to 14 Minutes | 186 | 52.7% |
| 15 to 19 Minutes | 1 | 0.3% |
| 20 to 24 Minutes | 0 | 0.0% |
| 25 to 29 Minutes | 0 | 0.0% |
| 30 to 34 Minutes | 0 | 0.0% |
| 35 to 39 Minutes | 0 | 0.0% |
| 40 to 44 Minutes | 0 | 0.0% |
| 45 to 59 Minutes | 0 | 0.0% |
| 60 to 89 Minutes | 0 | 0.0% |
| 90 or more Minutes | 0 | 0.0% |
Commute Time by Sex in Edgartown
The most common commute times in Edgartown are 10 to 14 minutes (125 commuters, 77.2%) for males and 5 to 9 minutes (129 commuters, 67.5%) for females.
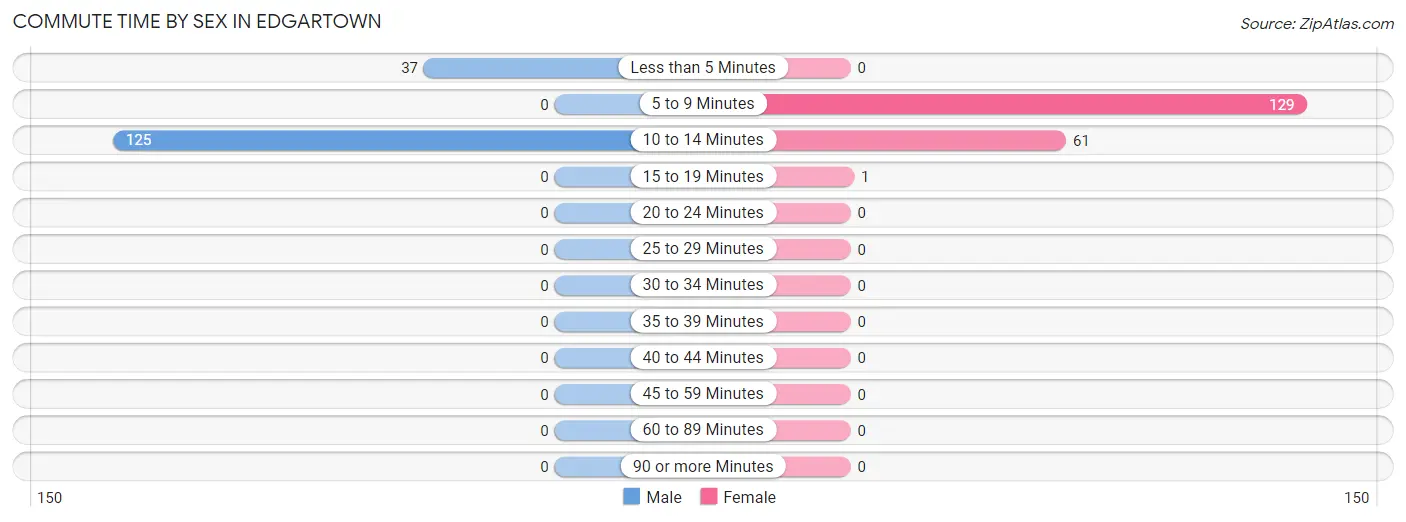
| Commute Time | Male | Female |
| Less than 5 Minutes | 37 (22.8%) | 0 (0.0%) |
| 5 to 9 Minutes | 0 (0.0%) | 129 (67.5%) |
| 10 to 14 Minutes | 125 (77.2%) | 61 (31.9%) |
| 15 to 19 Minutes | 0 (0.0%) | 1 (0.5%) |
| 20 to 24 Minutes | 0 (0.0%) | 0 (0.0%) |
| 25 to 29 Minutes | 0 (0.0%) | 0 (0.0%) |
| 30 to 34 Minutes | 0 (0.0%) | 0 (0.0%) |
| 35 to 39 Minutes | 0 (0.0%) | 0 (0.0%) |
| 40 to 44 Minutes | 0 (0.0%) | 0 (0.0%) |
| 45 to 59 Minutes | 0 (0.0%) | 0 (0.0%) |
| 60 to 89 Minutes | 0 (0.0%) | 0 (0.0%) |
| 90 or more Minutes | 0 (0.0%) | 0 (0.0%) |
Time of Departure to Work by Sex in Edgartown
The most frequent times of departure to work in Edgartown are 4:00 PM to 11:59 PM (125, 77.2%) for males and 5:30 AM to 5:59 AM (128, 67.0%) for females.
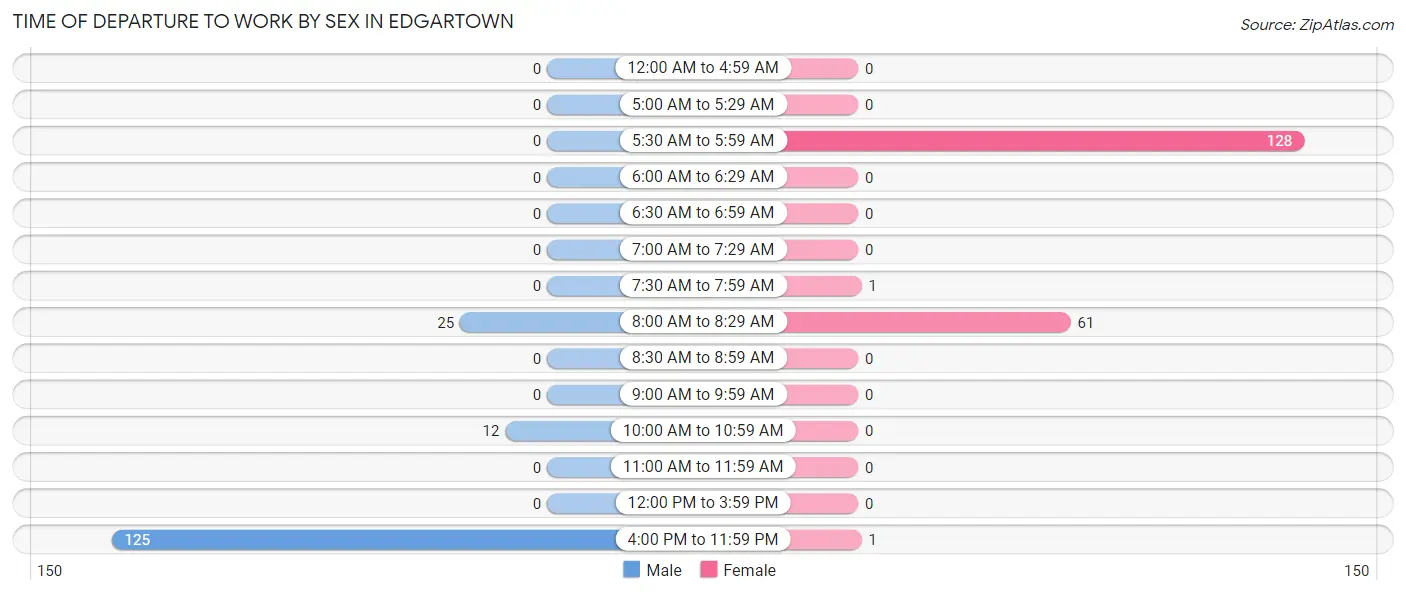
| Time of Departure | Male | Female |
| 12:00 AM to 4:59 AM | 0 (0.0%) | 0 (0.0%) |
| 5:00 AM to 5:29 AM | 0 (0.0%) | 0 (0.0%) |
| 5:30 AM to 5:59 AM | 0 (0.0%) | 128 (67.0%) |
| 6:00 AM to 6:29 AM | 0 (0.0%) | 0 (0.0%) |
| 6:30 AM to 6:59 AM | 0 (0.0%) | 0 (0.0%) |
| 7:00 AM to 7:29 AM | 0 (0.0%) | 0 (0.0%) |
| 7:30 AM to 7:59 AM | 0 (0.0%) | 1 (0.5%) |
| 8:00 AM to 8:29 AM | 25 (15.4%) | 61 (31.9%) |
| 8:30 AM to 8:59 AM | 0 (0.0%) | 0 (0.0%) |
| 9:00 AM to 9:59 AM | 0 (0.0%) | 0 (0.0%) |
| 10:00 AM to 10:59 AM | 12 (7.4%) | 0 (0.0%) |
| 11:00 AM to 11:59 AM | 0 (0.0%) | 0 (0.0%) |
| 12:00 PM to 3:59 PM | 0 (0.0%) | 0 (0.0%) |
| 4:00 PM to 11:59 PM | 125 (77.2%) | 1 (0.5%) |
| Total | 162 (100.0%) | 191 (100.0%) |
Housing Occupancy in Edgartown
Occupancy by Ownership in Edgartown
Of the total 213 dwellings in Edgartown, owner-occupied units account for 178 (83.6%), while renter-occupied units make up 35 (16.4%).
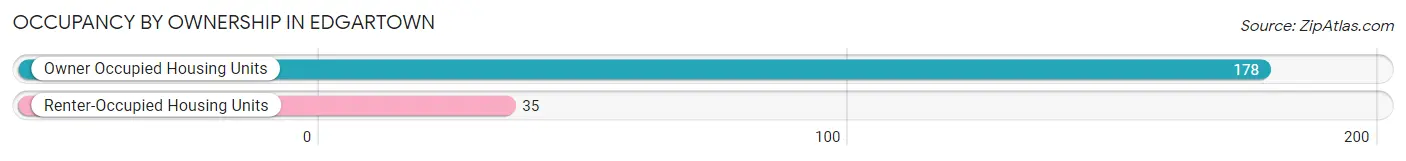
| Occupancy | # Housing Units | % Housing Units |
| Owner Occupied Housing Units | 178 | 83.6% |
| Renter-Occupied Housing Units | 35 | 16.4% |
| Total Occupied Housing Units | 213 | 100.0% |
Occupancy by Household Size in Edgartown
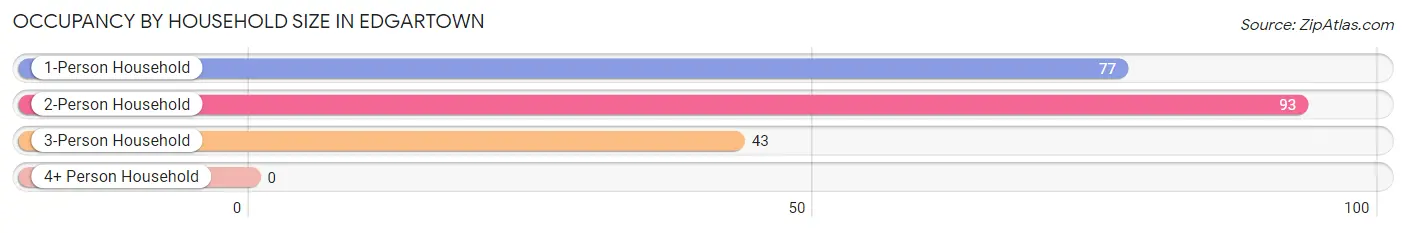
| Household Size | # Housing Units | % Housing Units |
| 1-Person Household | 77 | 36.1% |
| 2-Person Household | 93 | 43.7% |
| 3-Person Household | 43 | 20.2% |
| 4+ Person Household | 0 | 0.0% |
| Total Housing Units | 213 | 100.0% |
Occupancy by Ownership by Household Size in Edgartown
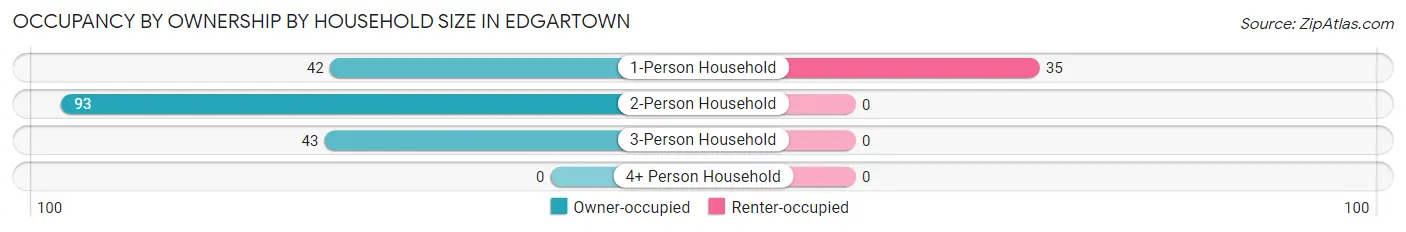
| Household Size | Owner-occupied | Renter-occupied |
| 1-Person Household | 42 (54.5%) | 35 (45.5%) |
| 2-Person Household | 93 (100.0%) | 0 (0.0%) |
| 3-Person Household | 43 (100.0%) | 0 (0.0%) |
| 4+ Person Household | 0 (0.0%) | 0 (0.0%) |
| Total Housing Units | 178 (83.6%) | 35 (16.4%) |
Occupancy by Educational Attainment in Edgartown
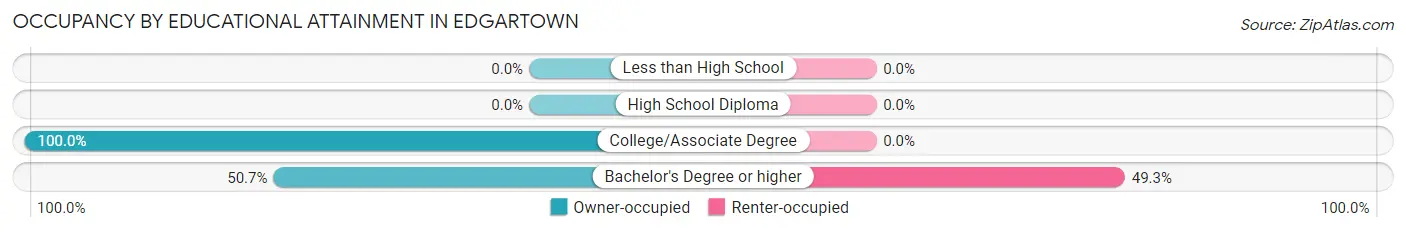
| Household Size | Owner-occupied | Renter-occupied |
| Less than High School | 0 (0.0%) | 0 (0.0%) |
| High School Diploma | 0 (0.0%) | 0 (0.0%) |
| College/Associate Degree | 142 (100.0%) | 0 (0.0%) |
| Bachelor's Degree or higher | 36 (50.7%) | 35 (49.3%) |
Occupancy by Age of Householder in Edgartown
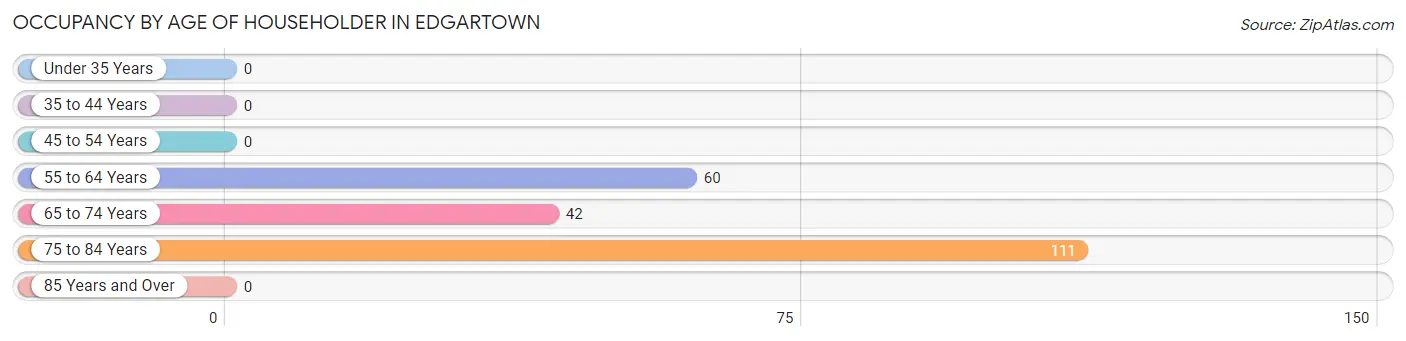
| Age Bracket | # Households | % Households |
| Under 35 Years | 0 | 0.0% |
| 35 to 44 Years | 0 | 0.0% |
| 45 to 54 Years | 0 | 0.0% |
| 55 to 64 Years | 60 | 28.2% |
| 65 to 74 Years | 42 | 19.7% |
| 75 to 84 Years | 111 | 52.1% |
| 85 Years and Over | 0 | 0.0% |
| Total | 213 | 100.0% |
Housing Finances in Edgartown
Median Income by Occupancy in Edgartown
| Occupancy Type | # Households | Median Income |
| Owner-Occupied | 178 (83.6%) | $0 |
| Renter-Occupied | 35 (16.4%) | $0 |
| Average | 213 (100.0%) | $0 |
Occupancy by Householder Income Bracket in Edgartown
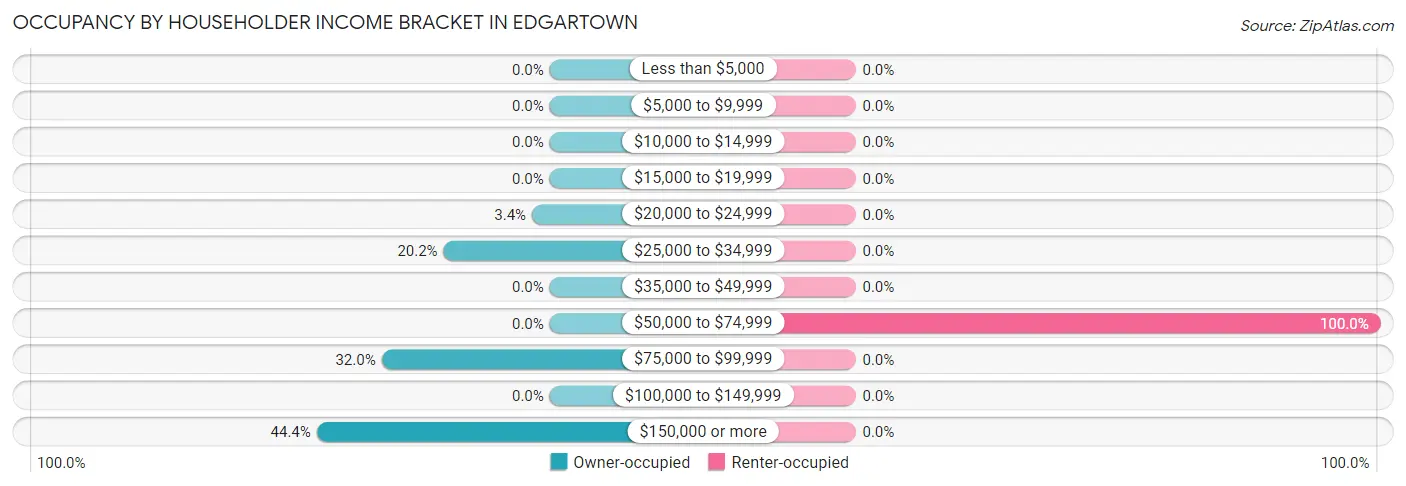
| Income Bracket | Owner-occupied | Renter-occupied |
| Less than $5,000 | 0 (0.0%) | 0 (0.0%) |
| $5,000 to $9,999 | 0 (0.0%) | 0 (0.0%) |
| $10,000 to $14,999 | 0 (0.0%) | 0 (0.0%) |
| $15,000 to $19,999 | 0 (0.0%) | 0 (0.0%) |
| $20,000 to $24,999 | 6 (3.4%) | 0 (0.0%) |
| $25,000 to $34,999 | 36 (20.2%) | 0 (0.0%) |
| $35,000 to $49,999 | 0 (0.0%) | 0 (0.0%) |
| $50,000 to $74,999 | 0 (0.0%) | 35 (100.0%) |
| $75,000 to $99,999 | 57 (32.0%) | 0 (0.0%) |
| $100,000 to $149,999 | 0 (0.0%) | 0 (0.0%) |
| $150,000 or more | 79 (44.4%) | 0 (0.0%) |
| Total | 178 (100.0%) | 35 (100.0%) |
Monthly Housing Cost Tiers in Edgartown
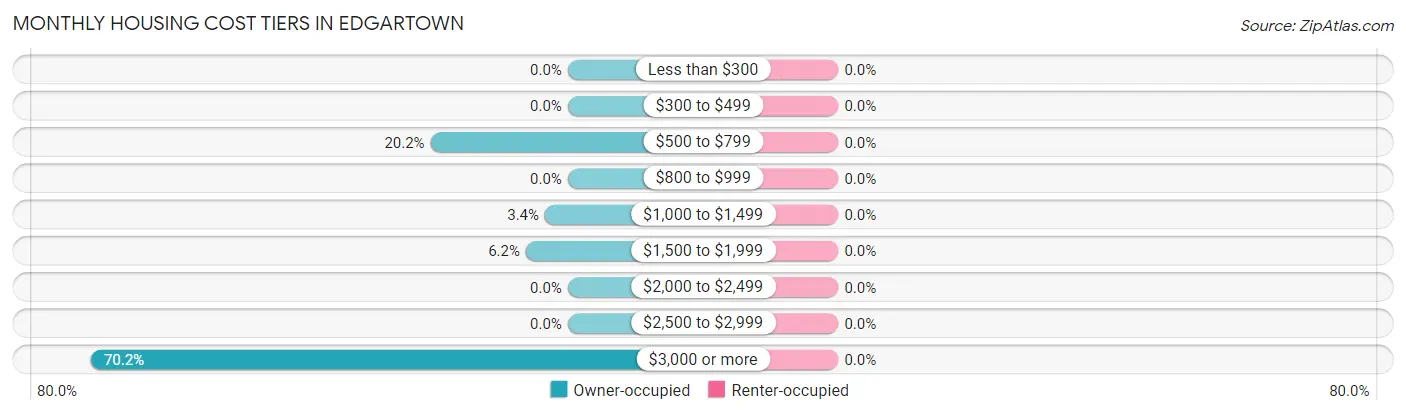
| Monthly Cost | Owner-occupied | Renter-occupied |
| Less than $300 | 0 (0.0%) | 0 (0.0%) |
| $300 to $499 | 0 (0.0%) | 0 (0.0%) |
| $500 to $799 | 36 (20.2%) | 0 (0.0%) |
| $800 to $999 | 0 (0.0%) | 0 (0.0%) |
| $1,000 to $1,499 | 6 (3.4%) | 0 (0.0%) |
| $1,500 to $1,999 | 11 (6.2%) | 0 (0.0%) |
| $2,000 to $2,499 | 0 (0.0%) | 0 (0.0%) |
| $2,500 to $2,999 | 0 (0.0%) | 0 (0.0%) |
| $3,000 or more | 125 (70.2%) | 0 (0.0%) |
| Total | 178 (100.0%) | 35 (100.0%) |
Physical Housing Characteristics in Edgartown
Housing Structures in Edgartown
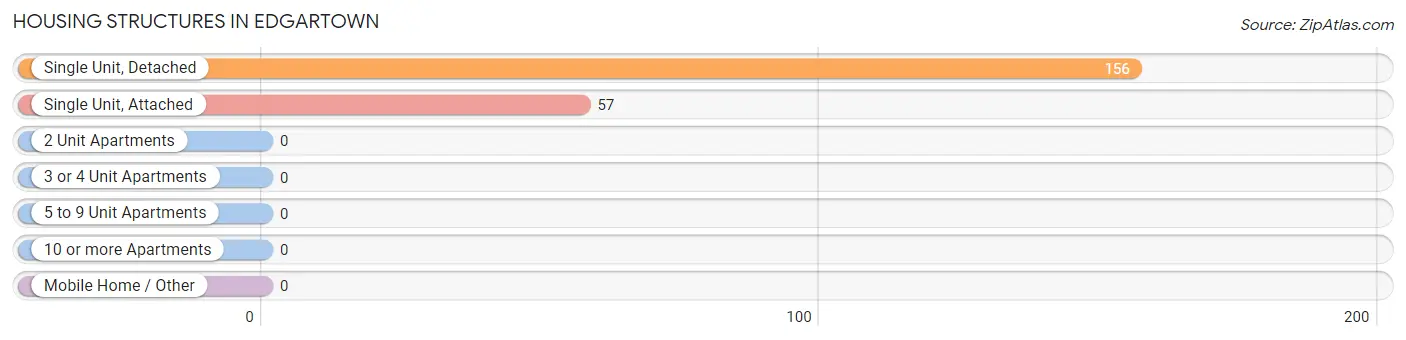
| Structure Type | # Housing Units | % Housing Units |
| Single Unit, Detached | 156 | 73.2% |
| Single Unit, Attached | 57 | 26.8% |
| 2 Unit Apartments | 0 | 0.0% |
| 3 or 4 Unit Apartments | 0 | 0.0% |
| 5 to 9 Unit Apartments | 0 | 0.0% |
| 10 or more Apartments | 0 | 0.0% |
| Mobile Home / Other | 0 | 0.0% |
| Total | 213 | 100.0% |
Housing Structures by Occupancy in Edgartown
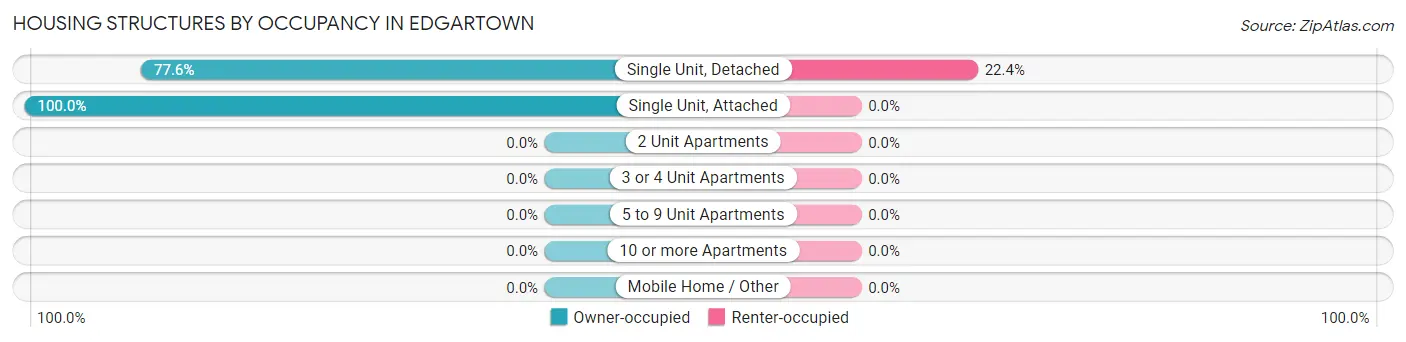
| Structure Type | Owner-occupied | Renter-occupied |
| Single Unit, Detached | 121 (77.6%) | 35 (22.4%) |
| Single Unit, Attached | 57 (100.0%) | 0 (0.0%) |
| 2 Unit Apartments | 0 (0.0%) | 0 (0.0%) |
| 3 or 4 Unit Apartments | 0 (0.0%) | 0 (0.0%) |
| 5 to 9 Unit Apartments | 0 (0.0%) | 0 (0.0%) |
| 10 or more Apartments | 0 (0.0%) | 0 (0.0%) |
| Mobile Home / Other | 0 (0.0%) | 0 (0.0%) |
| Total | 178 (83.6%) | 35 (16.4%) |
Housing Structures by Number of Rooms in Edgartown
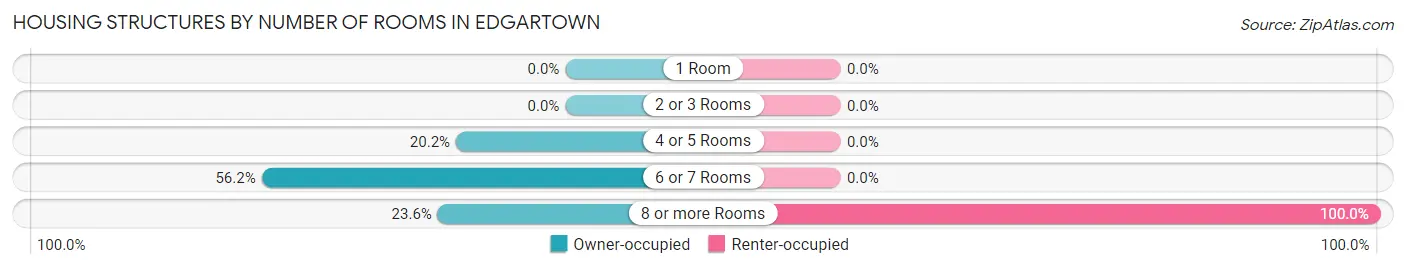
| Number of Rooms | Owner-occupied | Renter-occupied |
| 1 Room | 0 (0.0%) | 0 (0.0%) |
| 2 or 3 Rooms | 0 (0.0%) | 0 (0.0%) |
| 4 or 5 Rooms | 36 (20.2%) | 0 (0.0%) |
| 6 or 7 Rooms | 100 (56.2%) | 0 (0.0%) |
| 8 or more Rooms | 42 (23.6%) | 35 (100.0%) |
| Total | 178 (100.0%) | 35 (100.0%) |
Housing Structure by Heating Type in Edgartown
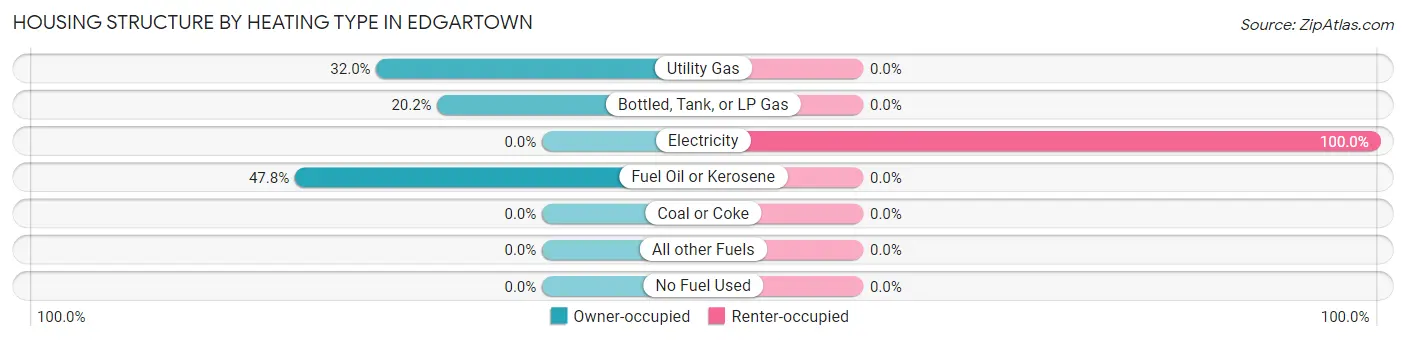
| Heating Type | Owner-occupied | Renter-occupied |
| Utility Gas | 57 (32.0%) | 0 (0.0%) |
| Bottled, Tank, or LP Gas | 36 (20.2%) | 0 (0.0%) |
| Electricity | 0 (0.0%) | 35 (100.0%) |
| Fuel Oil or Kerosene | 85 (47.7%) | 0 (0.0%) |
| Coal or Coke | 0 (0.0%) | 0 (0.0%) |
| All other Fuels | 0 (0.0%) | 0 (0.0%) |
| No Fuel Used | 0 (0.0%) | 0 (0.0%) |
| Total | 178 (100.0%) | 35 (100.0%) |
Household Vehicle Usage in Edgartown
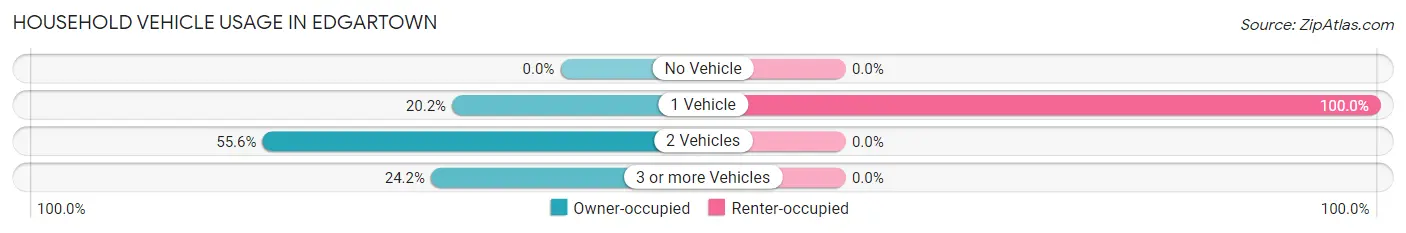
| Vehicles per Household | Owner-occupied | Renter-occupied |
| No Vehicle | 0 (0.0%) | 0 (0.0%) |
| 1 Vehicle | 36 (20.2%) | 35 (100.0%) |
| 2 Vehicles | 99 (55.6%) | 0 (0.0%) |
| 3 or more Vehicles | 43 (24.2%) | 0 (0.0%) |
| Total | 178 (100.0%) | 35 (100.0%) |
Real Estate & Mortgages in Edgartown
Real Estate and Mortgage Overview in Edgartown
| Characteristic | Without Mortgage | With Mortgage |
| Housing Units | 53 | 125 |
| Median Property Value | $907,700 | $2,000,001 |
| Median Household Income | - | - |
| Monthly Housing Costs | - | - |
| Real Estate Taxes | $4,631 | $0 |
Property Value by Mortgage Status in Edgartown
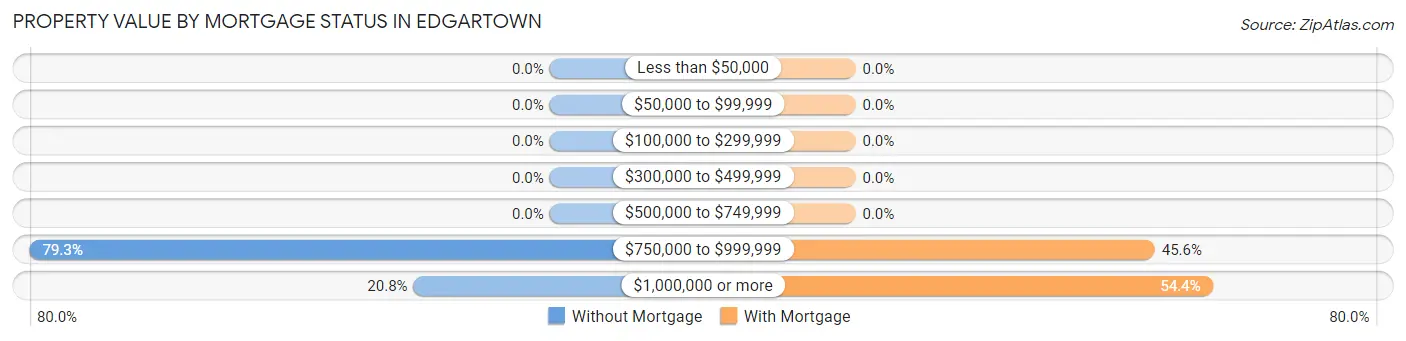
| Property Value | Without Mortgage | With Mortgage |
| Less than $50,000 | 0 (0.0%) | 0 (0.0%) |
| $50,000 to $99,999 | 0 (0.0%) | 0 (0.0%) |
| $100,000 to $299,999 | 0 (0.0%) | 0 (0.0%) |
| $300,000 to $499,999 | 0 (0.0%) | 0 (0.0%) |
| $500,000 to $749,999 | 0 (0.0%) | 0 (0.0%) |
| $750,000 to $999,999 | 42 (79.2%) | 57 (45.6%) |
| $1,000,000 or more | 11 (20.7%) | 68 (54.4%) |
| Total | 53 (100.0%) | 125 (100.0%) |
Household Income by Mortgage Status in Edgartown
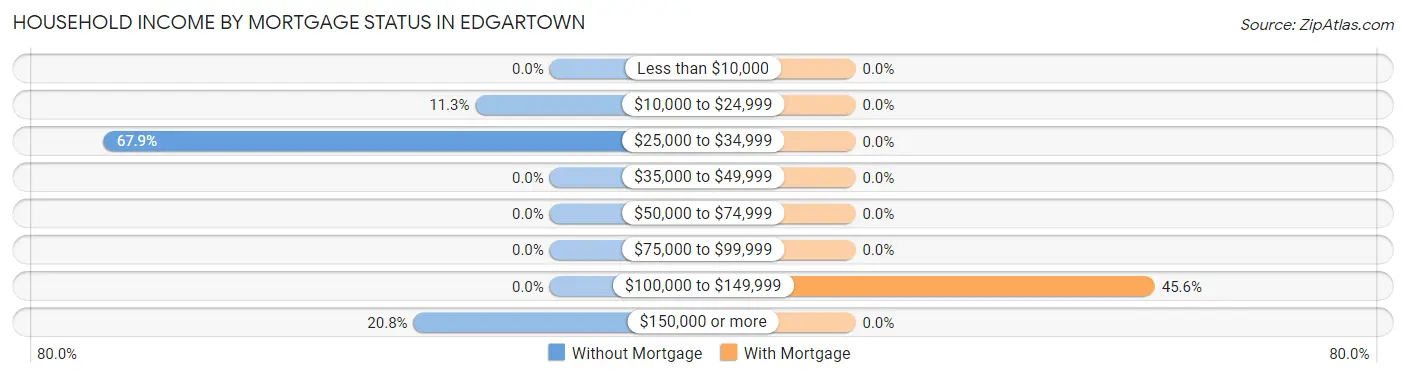
| Household Income | Without Mortgage | With Mortgage |
| Less than $10,000 | 0 (0.0%) | 0 (0.0%) |
| $10,000 to $24,999 | 6 (11.3%) | 0 (0.0%) |
| $25,000 to $34,999 | 36 (67.9%) | 0 (0.0%) |
| $35,000 to $49,999 | 0 (0.0%) | 0 (0.0%) |
| $50,000 to $74,999 | 0 (0.0%) | 0 (0.0%) |
| $75,000 to $99,999 | 0 (0.0%) | 0 (0.0%) |
| $100,000 to $149,999 | 0 (0.0%) | 57 (45.6%) |
| $150,000 or more | 11 (20.7%) | 0 (0.0%) |
| Total | 53 (100.0%) | 125 (100.0%) |
Property Value to Household Income Ratio in Edgartown
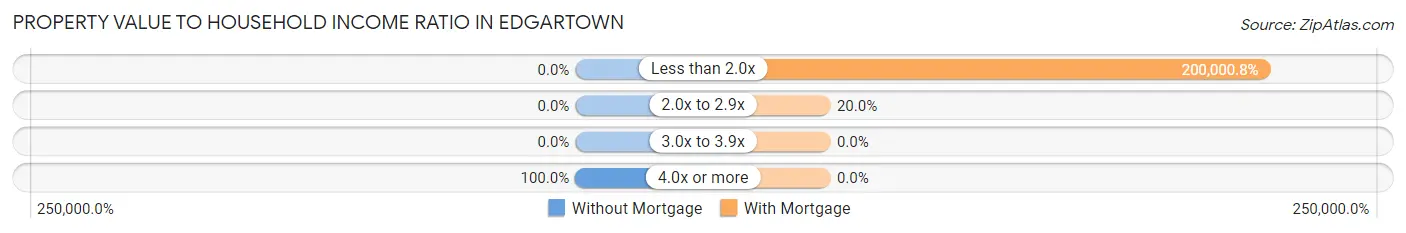
| Value-to-Income Ratio | Without Mortgage | With Mortgage |
| Less than 2.0x | 0 (0.0%) | 250,001 (200,000.8%) |
| 2.0x to 2.9x | 0 (0.0%) | 25 (20.0%) |
| 3.0x to 3.9x | 0 (0.0%) | 0 (0.0%) |
| 4.0x or more | 53 (100.0%) | 0 (0.0%) |
| Total | 53 (100.0%) | 125 (100.0%) |
Real Estate Taxes by Mortgage Status in Edgartown
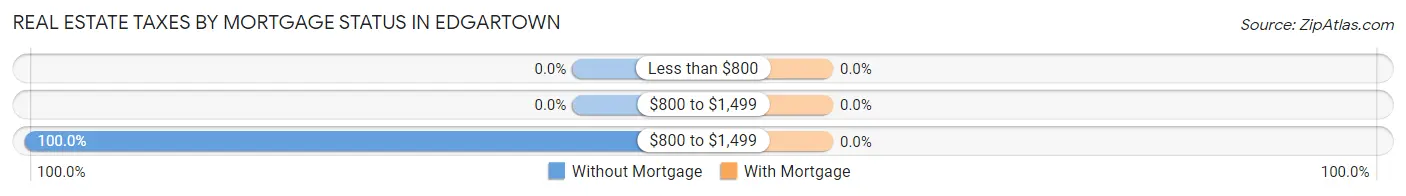
| Property Taxes | Without Mortgage | With Mortgage |
| Less than $800 | 0 (0.0%) | 0 (0.0%) |
| $800 to $1,499 | 0 (0.0%) | 0 (0.0%) |
| $800 to $1,499 | 53 (100.0%) | 0 (0.0%) |
| Total | 53 (100.0%) | 125 (100.0%) |
Health & Disability in Edgartown
Health Insurance Coverage by Age in Edgartown
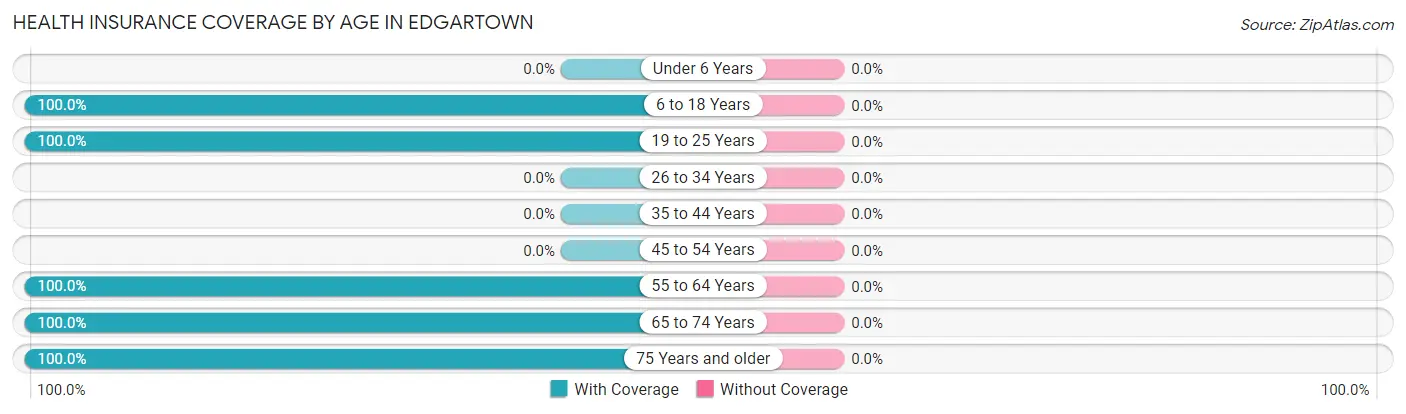
| Age Bracket | With Coverage | Without Coverage |
| Under 6 Years | 0 (0.0%) | 0 (0.0%) |
| 6 to 18 Years | 1 (100.0%) | 0 (0.0%) |
| 19 to 25 Years | 6 (100.0%) | 0 (0.0%) |
| 26 to 34 Years | 0 (0.0%) | 0 (0.0%) |
| 35 to 44 Years | 0 (0.0%) | 0 (0.0%) |
| 45 to 54 Years | 0 (0.0%) | 0 (0.0%) |
| 55 to 64 Years | 342 (100.0%) | 0 (0.0%) |
| 65 to 74 Years | 42 (100.0%) | 0 (0.0%) |
| 75 Years and older | 188 (100.0%) | 0 (0.0%) |
| Total | 579 (100.0%) | 0 (0.0%) |
Health Insurance Coverage by Citizenship Status in Edgartown
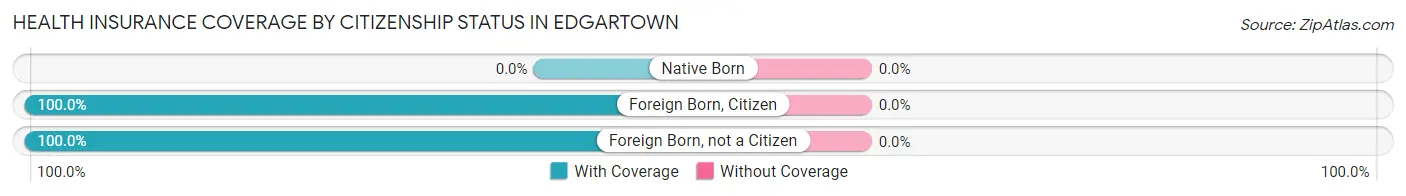
| Citizenship Status | With Coverage | Without Coverage |
| Native Born | 0 (0.0%) | 0 (0.0%) |
| Foreign Born, Citizen | 1 (100.0%) | 0 (0.0%) |
| Foreign Born, not a Citizen | 6 (100.0%) | 0 (0.0%) |
Health Insurance Coverage by Household Income in Edgartown
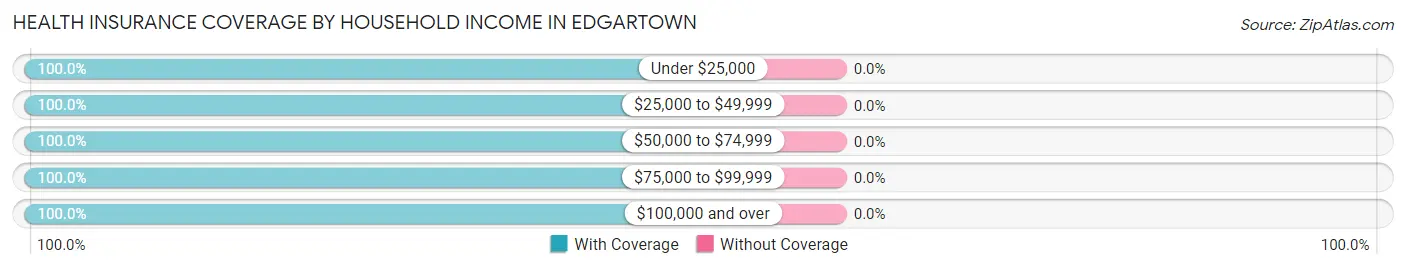
| Household Income | With Coverage | Without Coverage |
| Under $25,000 | 6 (100.0%) | 0 (0.0%) |
| $25,000 to $49,999 | 36 (100.0%) | 0 (0.0%) |
| $50,000 to $74,999 | 35 (100.0%) | 0 (0.0%) |
| $75,000 to $99,999 | 122 (100.0%) | 0 (0.0%) |
| $100,000 and over | 370 (100.0%) | 0 (0.0%) |
Public vs Private Health Insurance Coverage by Age in Edgartown
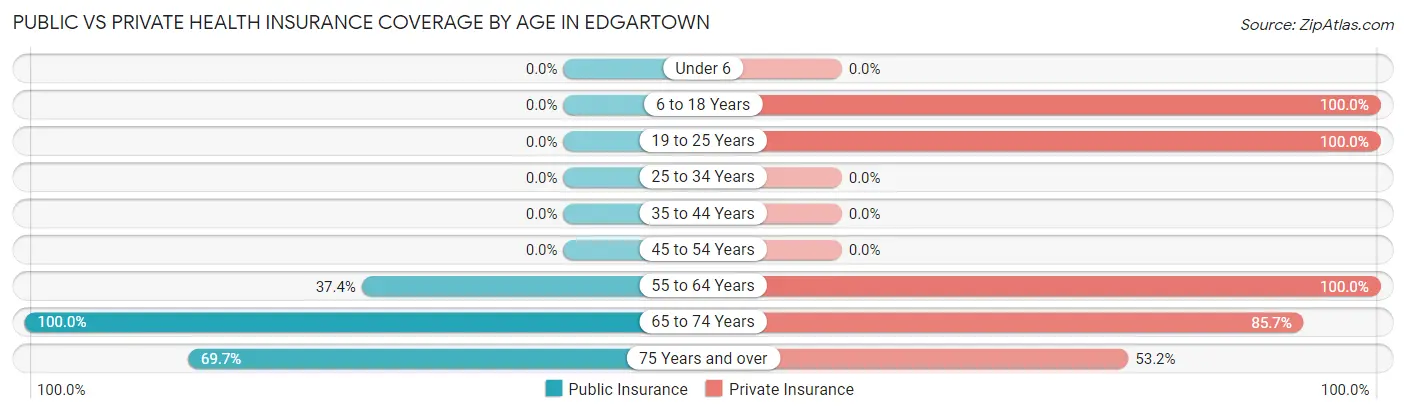
| Age Bracket | Public Insurance | Private Insurance |
| Under 6 | 0 (0.0%) | 0 (0.0%) |
| 6 to 18 Years | 0 (0.0%) | 1 (100.0%) |
| 19 to 25 Years | 0 (0.0%) | 6 (100.0%) |
| 25 to 34 Years | 0 (0.0%) | 0 (0.0%) |
| 35 to 44 Years | 0 (0.0%) | 0 (0.0%) |
| 45 to 54 Years | 0 (0.0%) | 0 (0.0%) |
| 55 to 64 Years | 128 (37.4%) | 342 (100.0%) |
| 65 to 74 Years | 42 (100.0%) | 36 (85.7%) |
| 75 Years and over | 131 (69.7%) | 100 (53.2%) |
| Total | 301 (52.0%) | 485 (83.8%) |
Disability Status by Sex by Age in Edgartown
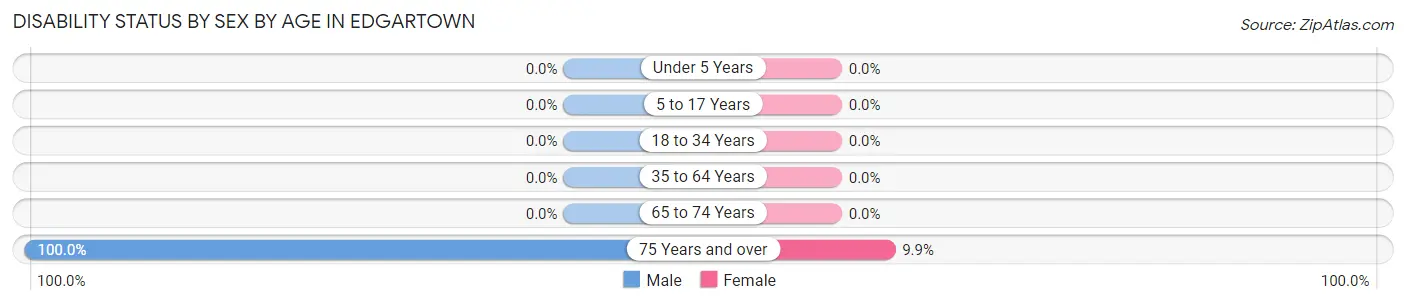
| Age Bracket | Male | Female |
| Under 5 Years | 0 (0.0%) | 0 (0.0%) |
| 5 to 17 Years | 0 (0.0%) | 0 (0.0%) |
| 18 to 34 Years | 0 (0.0%) | 0 (0.0%) |
| 35 to 64 Years | 0 (0.0%) | 0 (0.0%) |
| 65 to 74 Years | 0 (0.0%) | 0 (0.0%) |
| 75 Years and over | 77 (100.0%) | 11 (9.9%) |
Disability Class by Sex by Age in Edgartown
Disability Class: Hearing Difficulty
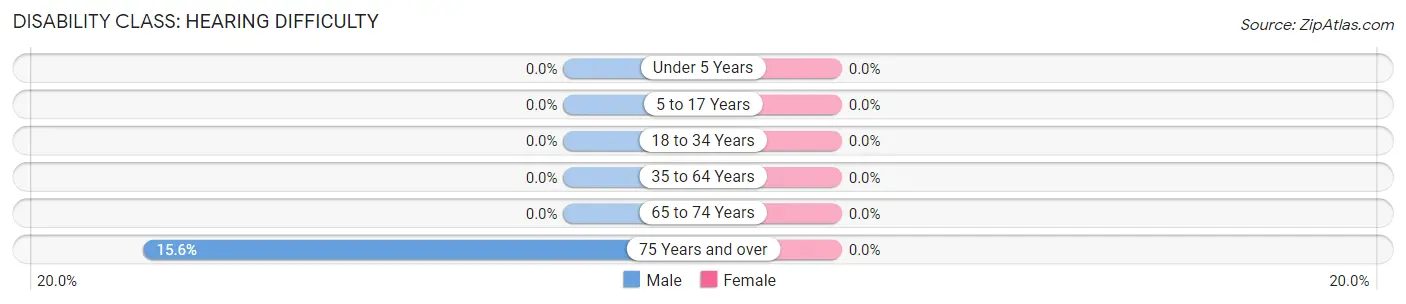
| Age Bracket | Male | Female |
| Under 5 Years | 0 (0.0%) | 0 (0.0%) |
| 5 to 17 Years | 0 (0.0%) | 0 (0.0%) |
| 18 to 34 Years | 0 (0.0%) | 0 (0.0%) |
| 35 to 64 Years | 0 (0.0%) | 0 (0.0%) |
| 65 to 74 Years | 0 (0.0%) | 0 (0.0%) |
| 75 Years and over | 12 (15.6%) | 0 (0.0%) |
Disability Class: Vision Difficulty
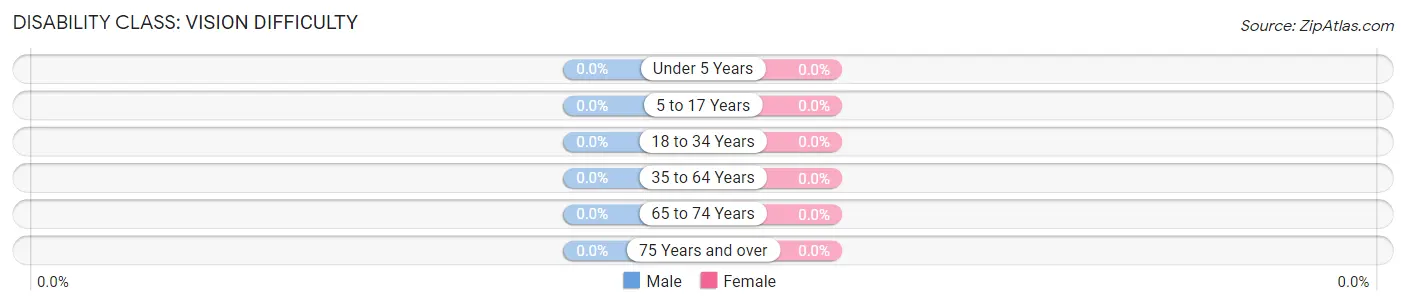
| Age Bracket | Male | Female |
| Under 5 Years | 0 (0.0%) | 0 (0.0%) |
| 5 to 17 Years | 0 (0.0%) | 0 (0.0%) |
| 18 to 34 Years | 0 (0.0%) | 0 (0.0%) |
| 35 to 64 Years | 0 (0.0%) | 0 (0.0%) |
| 65 to 74 Years | 0 (0.0%) | 0 (0.0%) |
| 75 Years and over | 0 (0.0%) | 0 (0.0%) |
Disability Class: Cognitive Difficulty
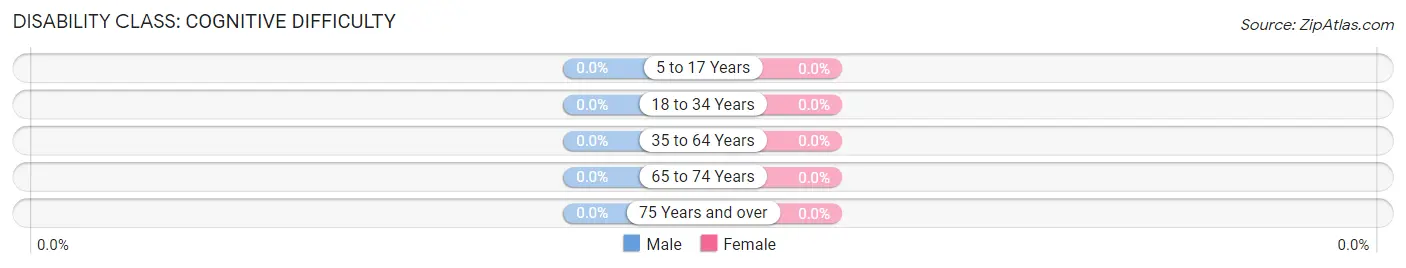
| Age Bracket | Male | Female |
| 5 to 17 Years | 0 (0.0%) | 0 (0.0%) |
| 18 to 34 Years | 0 (0.0%) | 0 (0.0%) |
| 35 to 64 Years | 0 (0.0%) | 0 (0.0%) |
| 65 to 74 Years | 0 (0.0%) | 0 (0.0%) |
| 75 Years and over | 0 (0.0%) | 0 (0.0%) |
Disability Class: Ambulatory Difficulty
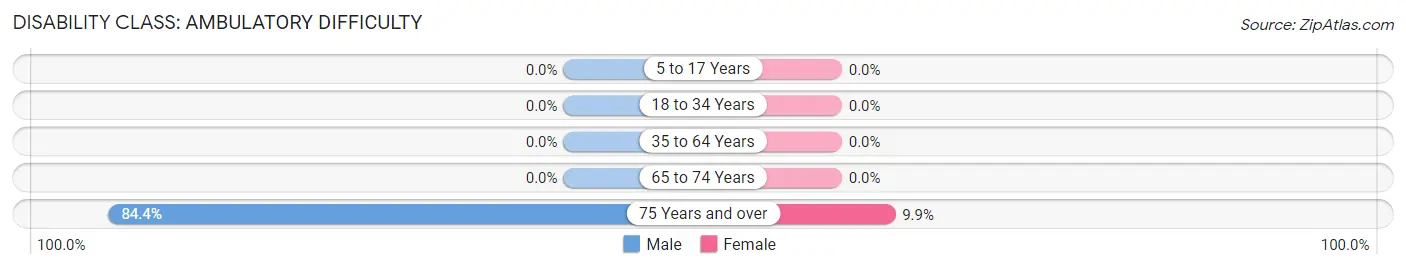
| Age Bracket | Male | Female |
| 5 to 17 Years | 0 (0.0%) | 0 (0.0%) |
| 18 to 34 Years | 0 (0.0%) | 0 (0.0%) |
| 35 to 64 Years | 0 (0.0%) | 0 (0.0%) |
| 65 to 74 Years | 0 (0.0%) | 0 (0.0%) |
| 75 Years and over | 65 (84.4%) | 11 (9.9%) |
Disability Class: Self-Care Difficulty
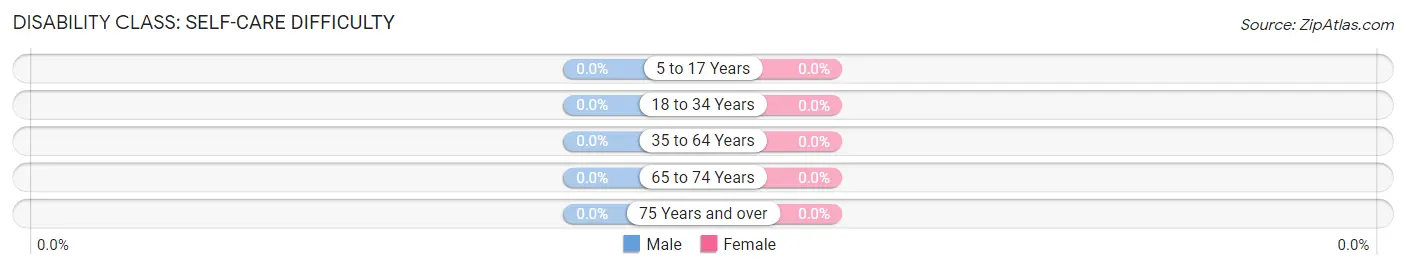
| Age Bracket | Male | Female |
| 5 to 17 Years | 0 (0.0%) | 0 (0.0%) |
| 18 to 34 Years | 0 (0.0%) | 0 (0.0%) |
| 35 to 64 Years | 0 (0.0%) | 0 (0.0%) |
| 65 to 74 Years | 0 (0.0%) | 0 (0.0%) |
| 75 Years and over | 0 (0.0%) | 0 (0.0%) |
Technology Access in Edgartown
Computing Device Access in Edgartown
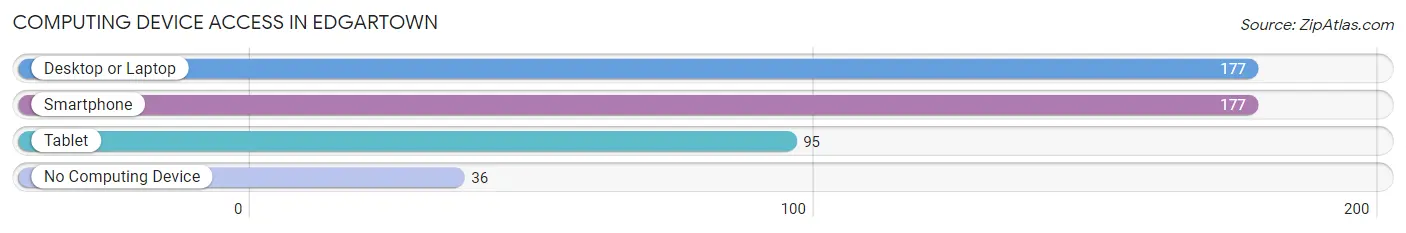
| Device Type | # Households | % Households |
| Desktop or Laptop | 177 | 83.1% |
| Smartphone | 177 | 83.1% |
| Tablet | 95 | 44.6% |
| No Computing Device | 36 | 16.9% |
| Total | 213 | 100.0% |
Internet Access in Edgartown
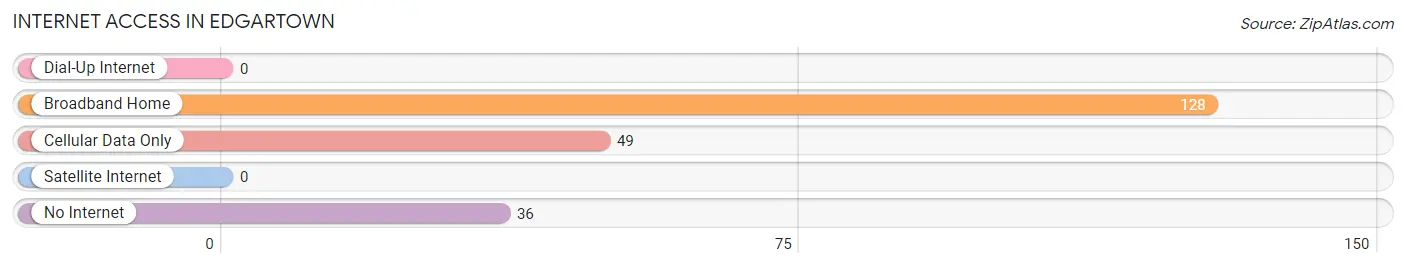
| Internet Type | # Households | % Households |
| Dial-Up Internet | 0 | 0.0% |
| Broadband Home | 128 | 60.1% |
| Cellular Data Only | 49 | 23.0% |
| Satellite Internet | 0 | 0.0% |
| No Internet | 36 | 16.9% |
| Total | 213 | 100.0% |
Edgartown Summary
Edgartown is a town located on the island of Martha’s Vineyard in Dukes County, Massachusetts. It is the county seat of Dukes County and the largest town on the island. The town was named after Edgar of the Saxons, a legendary king of the Saxons.
Geography
Edgartown is located on the eastern end of Martha’s Vineyard, an island off the coast of Massachusetts. The town is bordered by the towns of Oak Bluffs to the west, Tisbury to the north, and Chilmark to the south. The town is situated on a peninsula that juts out into the Atlantic Ocean. The town is home to several beaches, including South Beach, State Beach, and Lighthouse Beach. The town also has several ponds, including Katama Bay, Sengekontacket Pond, and Tashmoo Pond.
Economy
Edgartown’s economy is largely based on tourism. The town is home to several popular attractions, including the Martha’s Vineyard Museum, the Edgartown Lighthouse, and the Edgartown Harbor. The town also has several restaurants, shops, and galleries. The town is also home to several marinas, which provide services to boaters and fishermen.
Demographics
As of the 2010 census, Edgartown had a population of 4,067. The racial makeup of the town was 94.3% White, 1.2% African American, 0.3% Native American, 1.2% Asian, 0.1% Pacific Islander, 0.7% from other races, and 2.3% from two or more races. Hispanic or Latino of any race were 2.3% of the population.
The median income for a household in the town was $62,813, and the median income for a family was $77,917. The per capita income for the town was $37,945. About 5.2% of families and 8.2% of the population were below the poverty line, including 10.2% of those under age 18 and 4.2% of those age 65 or over.
Edgartown is a popular tourist destination and is known for its historic architecture, beautiful beaches, and vibrant culture. The town is home to several museums, galleries, and other attractions, making it a great place to visit and explore. With its rich history, beautiful scenery, and vibrant economy, Edgartown is a great place to live and visit.
Common Questions
What is Per Capita Income in Edgartown?
Per Capita income in Edgartown is $148,187.
What is the Median Family Income in Edgartown?
Median Family Income in Edgartown is $250,001.
What is Income or Wage Gap in Edgartown?
Income or Wage Gap in Edgartown is 41.1%.
Women in Edgartown earn 58.9 cents for every dollar earned by a man.
What is Inequality or Gini Index in Edgartown?
Inequality or Gini Index in Edgartown is 0.69.
What is the Total Population of Edgartown?
Total Population of Edgartown is 610.
What is the Total Male Population of Edgartown?
Total Male Population of Edgartown is 268.
What is the Total Female Population of Edgartown?
Total Female Population of Edgartown is 342.
What is the Ratio of Males per 100 Females in Edgartown?
There are 78.36 Males per 100 Females in Edgartown.
What is the Ratio of Females per 100 Males in Edgartown?
There are 127.61 Females per 100 Males in Edgartown.
What is the Median Population Age in Edgartown?
Median Population Age in Edgartown is 63.4 Years.
What is the Average Family Size in Edgartown
Average Family Size in Edgartown is 3.8 People.
What is the Average Household Size in Edgartown
Average Household Size in Edgartown is 2.7 People.
How Large is the Labor Force in Edgartown?
There are 357 People in the Labor Forcein in Edgartown.
What is the Percentage of People in the Labor Force in Edgartown?
58.5% of People are in the Labor Force in Edgartown.