Marshallville, GA Map & Demographics
Marshallville Map
Marshallville Overview
$49,276
PER CAPITA INCOME
$50,156
AVG FAMILY INCOME
$18,839
AVG HOUSEHOLD INCOME
0.80
INEQUALITY / GINI INDEX
1,014
TOTAL POPULATION
438
MALE POPULATION
576
FEMALE POPULATION
76.04
MALES / 100 FEMALES
131.51
FEMALES / 100 MALES
47.2
MEDIAN AGE
3.3
AVG FAMILY SIZE
2.3
AVG HOUSEHOLD SIZE
452
LABOR FORCE [ PEOPLE ]
52.4%
PERCENT IN LABOR FORCE
13.0%
UNEMPLOYMENT RATE
Marshallville Zip Codes
Marshallville Area Codes
Income in Marshallville
Income Overview in Marshallville
Per Capita Income in Marshallville is $49,276, while median incomes of families and households are $50,156 and $18,839 respectively.
| Characteristic | Number | Measure |
| Per Capita Income | 1,014 | $49,276 |
| Median Family Income | 241 | $50,156 |
| Mean Family Income | 241 | $173,578 |
| Median Household Income | 439 | $18,839 |
| Mean Household Income | 439 | $103,737 |
| Income Deficit | 241 | $0 |
| Wage / Income Gap (%) | 1,014 | 0.00% |
| Wage / Income Gap ($) | 1,014 | 100.00¢ per $1 |
| Gini / Inequality Index | 1,014 | 0.80 |
Earnings by Sex in Marshallville
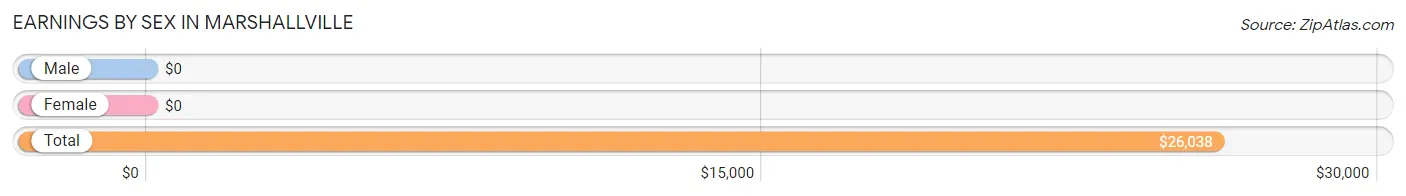
| Sex | Number | Average Earnings |
| Male | 134 (32.5%) | $0 |
| Female | 279 (67.5%) | $0 |
| Total | 413 (100.0%) | $26,038 |
Earnings by Sex by Income Bracket in Marshallville
The most common earnings brackets in Marshallville are $25,000 to $29,999 for men (41 | 30.6%) and $5,000 to $7,499 for women (81 | 29.0%).
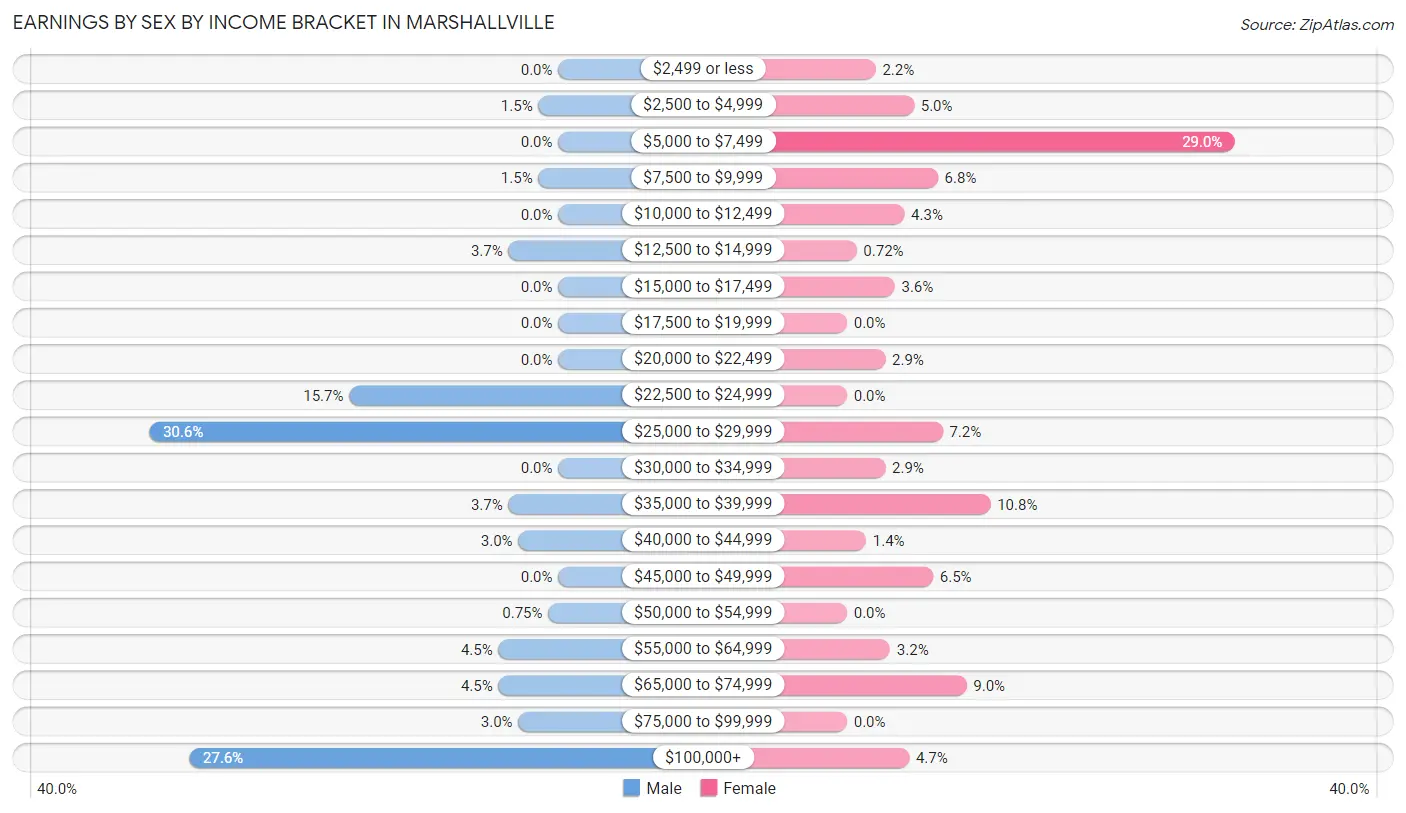
| Income | Male | Female |
| $2,499 or less | 0 (0.0%) | 6 (2.1%) |
| $2,500 to $4,999 | 2 (1.5%) | 14 (5.0%) |
| $5,000 to $7,499 | 0 (0.0%) | 81 (29.0%) |
| $7,500 to $9,999 | 2 (1.5%) | 19 (6.8%) |
| $10,000 to $12,499 | 0 (0.0%) | 12 (4.3%) |
| $12,500 to $14,999 | 5 (3.7%) | 2 (0.7%) |
| $15,000 to $17,499 | 0 (0.0%) | 10 (3.6%) |
| $17,500 to $19,999 | 0 (0.0%) | 0 (0.0%) |
| $20,000 to $22,499 | 0 (0.0%) | 8 (2.9%) |
| $22,500 to $24,999 | 21 (15.7%) | 0 (0.0%) |
| $25,000 to $29,999 | 41 (30.6%) | 20 (7.2%) |
| $30,000 to $34,999 | 0 (0.0%) | 8 (2.9%) |
| $35,000 to $39,999 | 5 (3.7%) | 30 (10.7%) |
| $40,000 to $44,999 | 4 (3.0%) | 4 (1.4%) |
| $45,000 to $49,999 | 0 (0.0%) | 18 (6.5%) |
| $50,000 to $54,999 | 1 (0.7%) | 0 (0.0%) |
| $55,000 to $64,999 | 6 (4.5%) | 9 (3.2%) |
| $65,000 to $74,999 | 6 (4.5%) | 25 (9.0%) |
| $75,000 to $99,999 | 4 (3.0%) | 0 (0.0%) |
| $100,000+ | 37 (27.6%) | 13 (4.7%) |
| Total | 134 (100.0%) | 279 (100.0%) |
Earnings by Sex by Educational Attainment in Marshallville
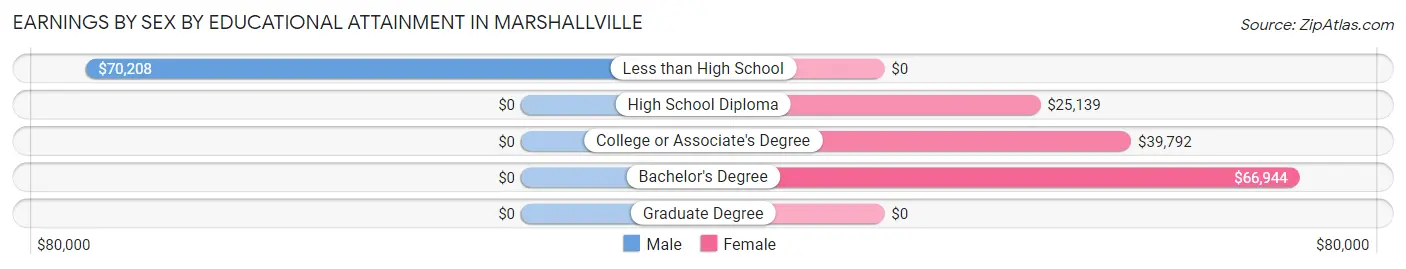
| Educational Attainment | Male Income | Female Income |
| Less than High School | $70,208 | $0 |
| High School Diploma | - | - |
| College or Associate's Degree | - | - |
| Bachelor's Degree | - | - |
| Graduate Degree | - | - |
| Total | - | - |
Family Income in Marshallville
Family Income Brackets in Marshallville
According to the Marshallville family income data, there are 49 families falling into the $100,000 to $149,999 income range, which is the most common income bracket and makes up 20.3% of all families. Conversely, the $75,000 to $99,999 income bracket is the least frequent group with only 4 families (1.7%) belonging to this category.
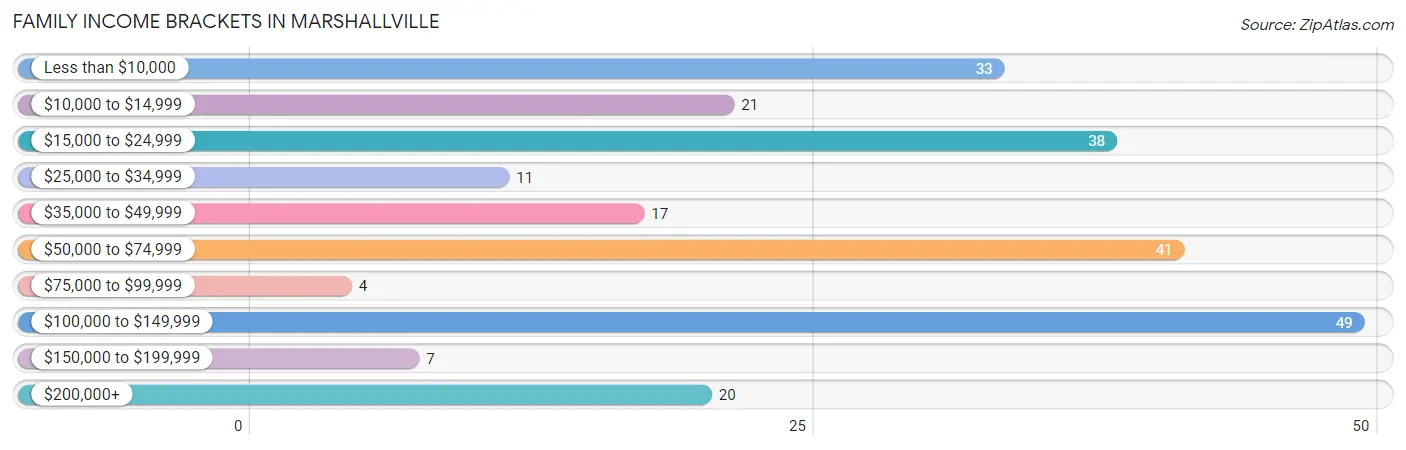
| Income Bracket | # Families | % Families |
| Less than $10,000 | 33 | 13.7% |
| $10,000 to $14,999 | 21 | 8.7% |
| $15,000 to $24,999 | 38 | 15.8% |
| $25,000 to $34,999 | 11 | 4.6% |
| $35,000 to $49,999 | 17 | 7.1% |
| $50,000 to $74,999 | 41 | 17.0% |
| $75,000 to $99,999 | 4 | 1.7% |
| $100,000 to $149,999 | 49 | 20.3% |
| $150,000 to $199,999 | 7 | 2.9% |
| $200,000+ | 20 | 8.3% |
Family Income by Famaliy Size in Marshallville
2-person families (125 | 51.9%) account for the highest median family income in Marshallville with $65,972 per family, while 2-person families (125 | 51.9%) have the highest median income of $32,986 per family member.
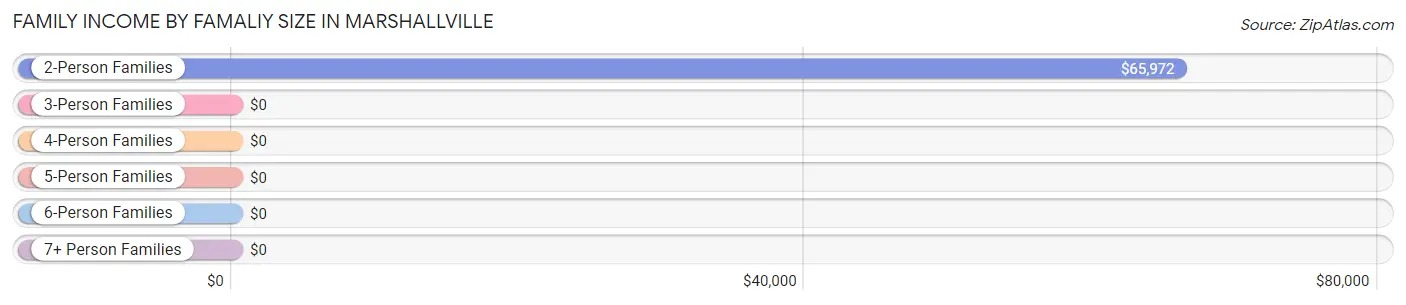
| Income Bracket | # Families | Median Income |
| 2-Person Families | 125 (51.9%) | $65,972 |
| 3-Person Families | 101 (41.9%) | $0 |
| 4-Person Families | 0 (0.0%) | $0 |
| 5-Person Families | 15 (6.2%) | $0 |
| 6-Person Families | 0 (0.0%) | $0 |
| 7+ Person Families | 0 (0.0%) | $0 |
| Total | 241 (100.0%) | $50,156 |
Family Income by Number of Earners in Marshallville
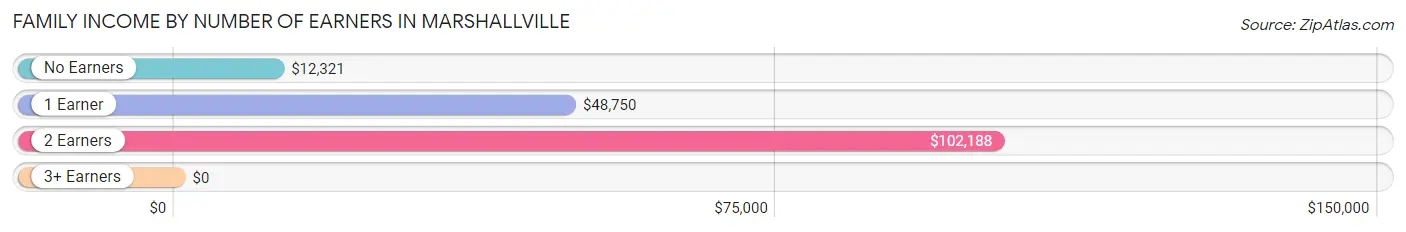
| Number of Earners | # Families | Median Income |
| No Earners | 77 (32.0%) | $12,321 |
| 1 Earner | 102 (42.3%) | $48,750 |
| 2 Earners | 57 (23.6%) | $102,188 |
| 3+ Earners | 5 (2.1%) | $0 |
| Total | 241 (100.0%) | $50,156 |
Household Income in Marshallville
Household Income Brackets in Marshallville
With 125 households falling in the category, the less than $10,000 income range is the most frequent in Marshallville, accounting for 28.5% of all households. In contrast, only 7 households (1.6%) fall into the $75,000 to $99,999 income bracket, making it the least populous group.
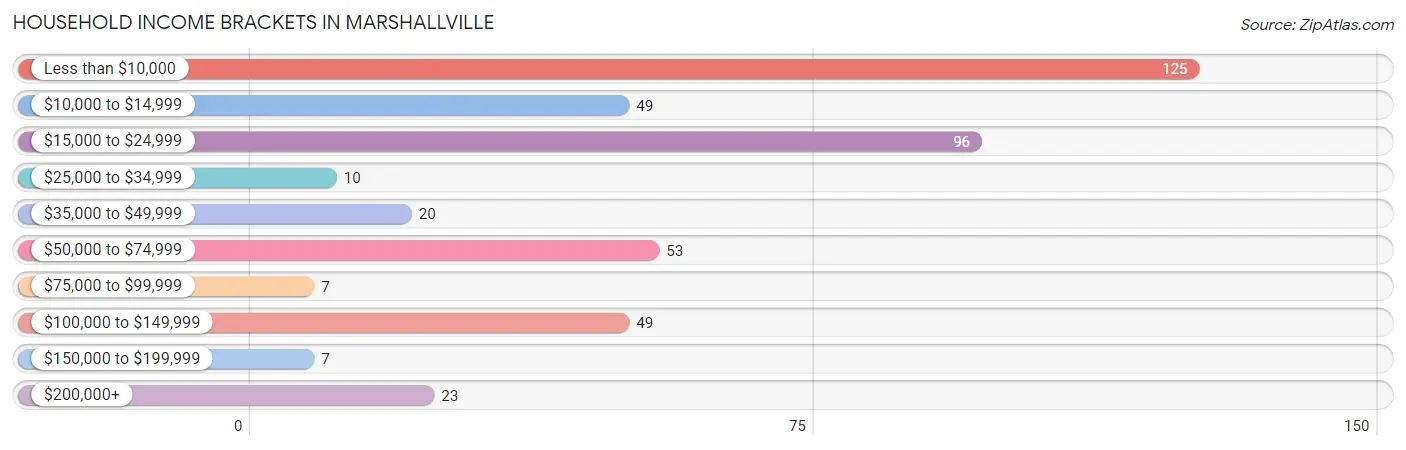
| Income Bracket | # Households | % Households |
| Less than $10,000 | 125 | 28.5% |
| $10,000 to $14,999 | 49 | 11.2% |
| $15,000 to $24,999 | 96 | 21.9% |
| $25,000 to $34,999 | 10 | 2.3% |
| $35,000 to $49,999 | 20 | 4.6% |
| $50,000 to $74,999 | 53 | 12.1% |
| $75,000 to $99,999 | 7 | 1.6% |
| $100,000 to $149,999 | 49 | 11.2% |
| $150,000 to $199,999 | 7 | 1.6% |
| $200,000+ | 23 | 5.2% |
Household Income by Householder Age in Marshallville
The median household income in Marshallville is $18,839, with the highest median household income of $23,304 found in the 25 to 44 years age bracket for the primary householder. A total of 43 households (9.8%) fall into this category. Meanwhile, the 45 to 64 years age bracket for the primary householder has the lowest median household income of $0, with 103 households (23.5%) in this group.
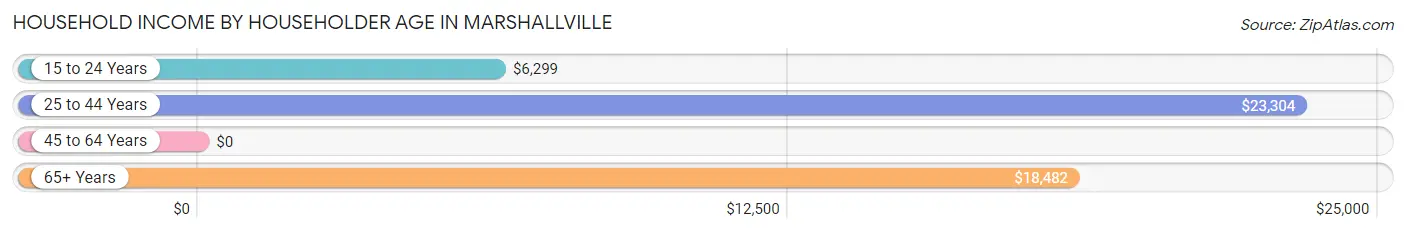
| Income Bracket | # Households | Median Income |
| 15 to 24 Years | 80 (18.2%) | $6,299 |
| 25 to 44 Years | 43 (9.8%) | $23,304 |
| 45 to 64 Years | 103 (23.5%) | $0 |
| 65+ Years | 213 (48.5%) | $18,482 |
| Total | 439 (100.0%) | $18,839 |
Poverty in Marshallville
Income Below Poverty by Sex and Age in Marshallville
With 34.5% poverty level for males and 47.0% for females among the residents of Marshallville, 25 to 34 year old males and 5 year old females are the most vulnerable to poverty, with 29 males (74.4%) and 2 females (100.0%) in their respective age groups living below the poverty level.
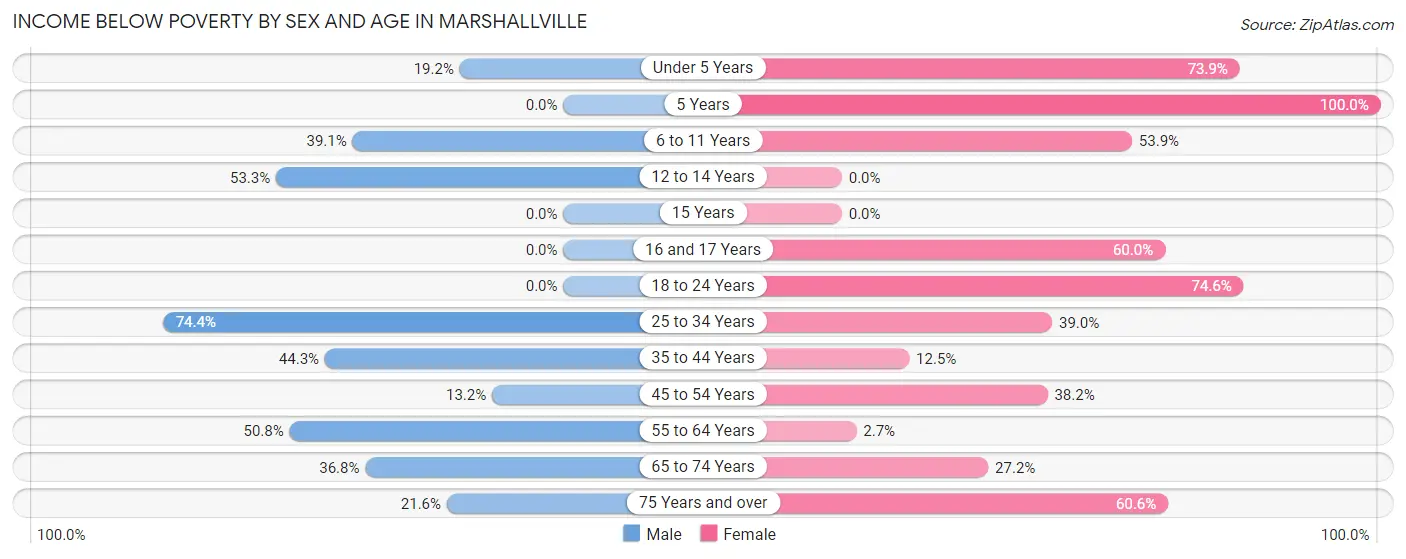
| Age Bracket | Male | Female |
| Under 5 Years | 5 (19.2%) | 48 (73.9%) |
| 5 Years | 0 (0.0%) | 2 (100.0%) |
| 6 to 11 Years | 9 (39.1%) | 7 (53.8%) |
| 12 to 14 Years | 8 (53.3%) | 0 (0.0%) |
| 15 Years | 0 (0.0%) | 0 (0.0%) |
| 16 and 17 Years | 0 (0.0%) | 18 (60.0%) |
| 18 to 24 Years | 0 (0.0%) | 88 (74.6%) |
| 25 to 34 Years | 29 (74.4%) | 16 (39.0%) |
| 35 to 44 Years | 27 (44.3%) | 1 (12.5%) |
| 45 to 54 Years | 9 (13.2%) | 21 (38.2%) |
| 55 to 64 Years | 31 (50.8%) | 2 (2.7%) |
| 65 to 74 Years | 25 (36.8%) | 25 (27.2%) |
| 75 Years and over | 8 (21.6%) | 43 (60.6%) |
| Total | 151 (34.5%) | 271 (47.0%) |
Income Above Poverty by Sex and Age in Marshallville
According to the poverty statistics in Marshallville, males aged 16 and 17 years and females aged 12 to 14 years are the age groups that are most secure financially, with 100.0% of males and 100.0% of females in these age groups living above the poverty line.
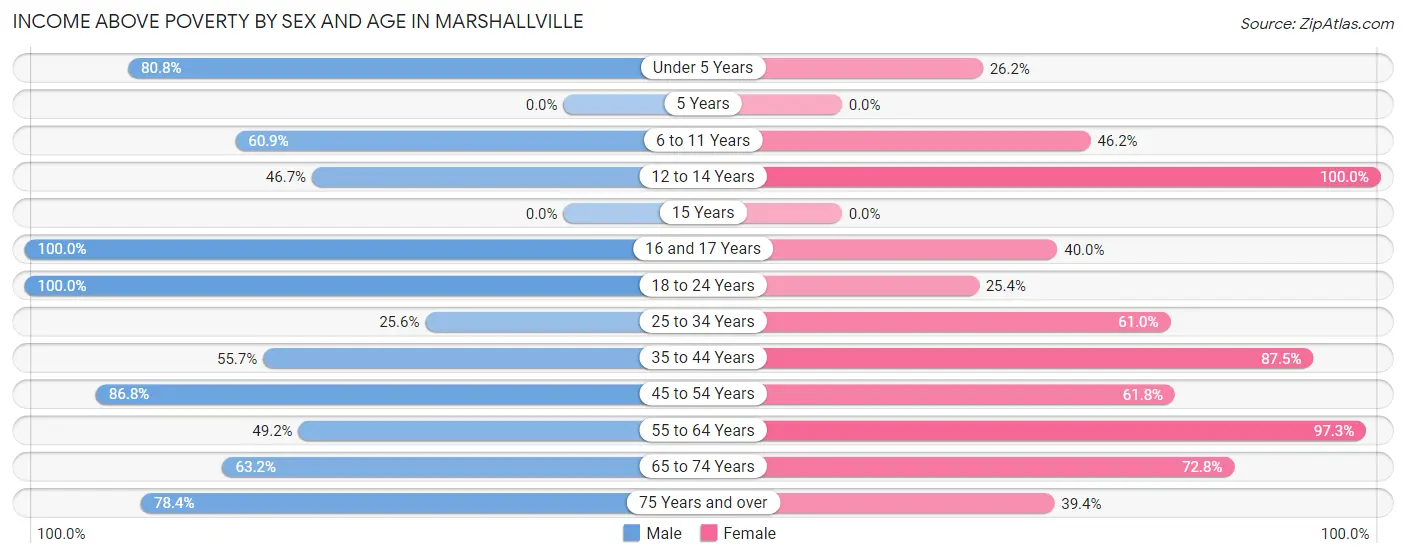
| Age Bracket | Male | Female |
| Under 5 Years | 21 (80.8%) | 17 (26.2%) |
| 5 Years | 0 (0.0%) | 0 (0.0%) |
| 6 to 11 Years | 14 (60.9%) | 6 (46.2%) |
| 12 to 14 Years | 7 (46.7%) | 7 (100.0%) |
| 15 Years | 0 (0.0%) | 0 (0.0%) |
| 16 and 17 Years | 16 (100.0%) | 12 (40.0%) |
| 18 to 24 Years | 24 (100.0%) | 30 (25.4%) |
| 25 to 34 Years | 10 (25.6%) | 25 (61.0%) |
| 35 to 44 Years | 34 (55.7%) | 7 (87.5%) |
| 45 to 54 Years | 59 (86.8%) | 34 (61.8%) |
| 55 to 64 Years | 30 (49.2%) | 72 (97.3%) |
| 65 to 74 Years | 43 (63.2%) | 67 (72.8%) |
| 75 Years and over | 29 (78.4%) | 28 (39.4%) |
| Total | 287 (65.5%) | 305 (52.9%) |
Income Below Poverty Among Married-Couple Families in Marshallville
The poverty statistics for married-couple families in Marshallville show that 7.8% or 9 of the total 116 families live below the poverty line. Families with no children have the highest poverty rate of 8.9%, comprising of 9 families. On the other hand, families with 1 or 2 children have the lowest poverty rate of 0.0%, which includes 0 families.
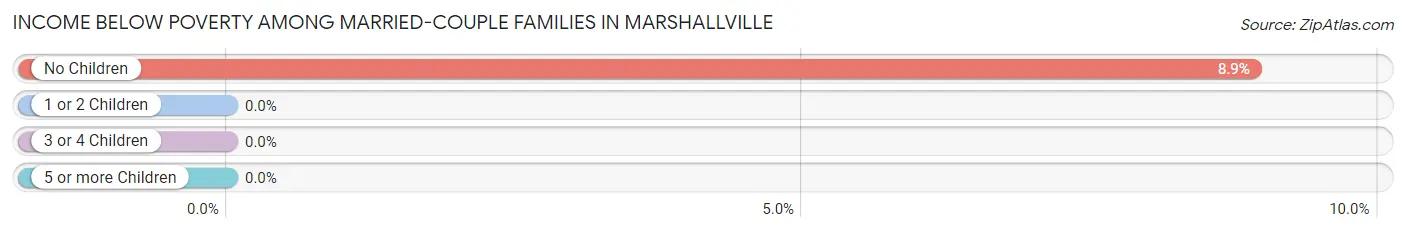
| Children | Above Poverty | Below Poverty |
| No Children | 92 (91.1%) | 9 (8.9%) |
| 1 or 2 Children | 15 (100.0%) | 0 (0.0%) |
| 3 or 4 Children | 0 (0.0%) | 0 (0.0%) |
| 5 or more Children | 0 (0.0%) | 0 (0.0%) |
| Total | 107 (92.2%) | 9 (7.8%) |
Income Below Poverty Among Single-Parent Households in Marshallville
According to the poverty data in Marshallville, 100.0% or 8 single-father households and 65.8% or 77 single-mother households are living below the poverty line. Among single-father households, those with no children have the highest poverty rate, with 8 households (100.0%) experiencing poverty. Likewise, among single-mother households, those with 1 or 2 children have the highest poverty rate, with 56 households (80.0%) falling below the poverty line.
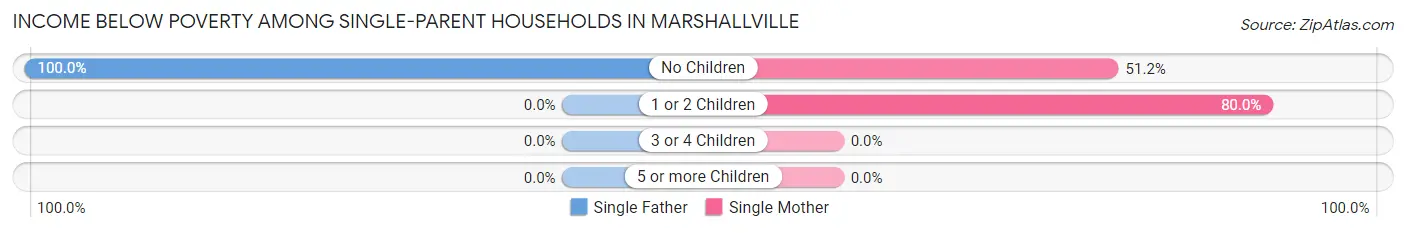
| Children | Single Father | Single Mother |
| No Children | 8 (100.0%) | 21 (51.2%) |
| 1 or 2 Children | 0 (0.0%) | 56 (80.0%) |
| 3 or 4 Children | 0 (0.0%) | 0 (0.0%) |
| 5 or more Children | 0 (0.0%) | 0 (0.0%) |
| Total | 8 (100.0%) | 77 (65.8%) |
Income Below Poverty Among Married-Couple vs Single-Parent Households in Marshallville
The poverty data for Marshallville shows that 9 of the married-couple family households (7.8%) and 85 of the single-parent households (68.0%) are living below the poverty level. Within the married-couple family households, those with no children have the highest poverty rate, with 9 households (8.9%) falling below the poverty line. Among the single-parent households, those with 1 or 2 children have the highest poverty rate, with 56 household (80.0%) living below poverty.
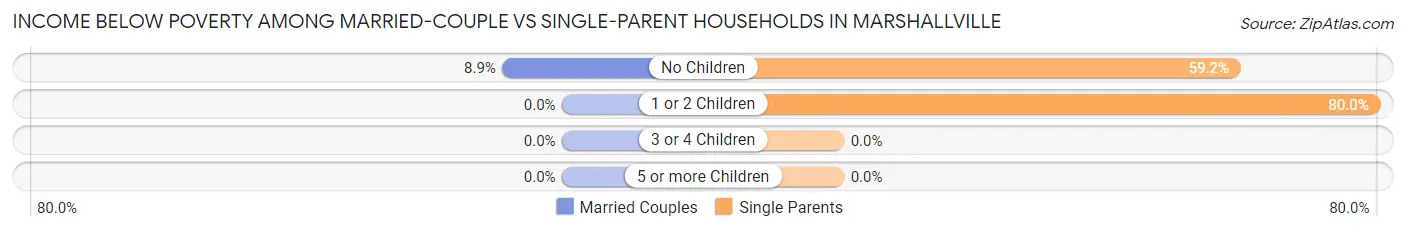
| Children | Married-Couple Families | Single-Parent Households |
| No Children | 9 (8.9%) | 29 (59.2%) |
| 1 or 2 Children | 0 (0.0%) | 56 (80.0%) |
| 3 or 4 Children | 0 (0.0%) | 0 (0.0%) |
| 5 or more Children | 0 (0.0%) | 0 (0.0%) |
| Total | 9 (7.8%) | 85 (68.0%) |
Race in Marshallville
The most populous races in Marshallville are Black / African American (613 | 60.5%), White / Caucasian (341 | 33.6%), and Hispanic or Latino (96 | 9.5%).
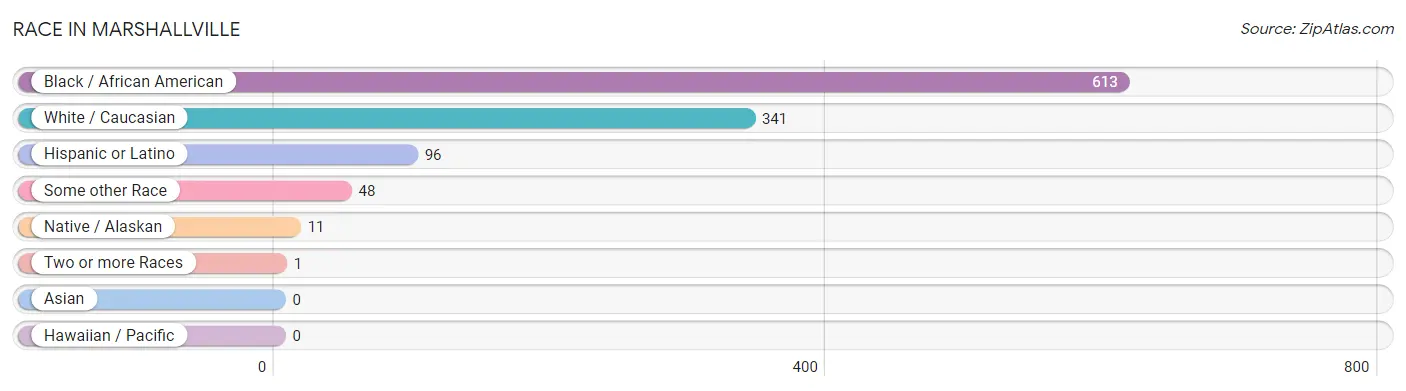
| Race | # Population | % Population |
| Asian | 0 | 0.0% |
| Black / African American | 613 | 60.5% |
| Hawaiian / Pacific | 0 | 0.0% |
| Hispanic or Latino | 96 | 9.5% |
| Native / Alaskan | 11 | 1.1% |
| White / Caucasian | 341 | 33.6% |
| Two or more Races | 1 | 0.1% |
| Some other Race | 48 | 4.7% |
| Total | 1,014 | 100.0% |
Ancestry in Marshallville
The most populous ancestries reported in Marshallville are American (89 | 8.8%), Mexican (87 | 8.6%), Irish (28 | 2.8%), British (13 | 1.3%), and Scottish (13 | 1.3%), together accounting for 22.7% of all Marshallville residents.
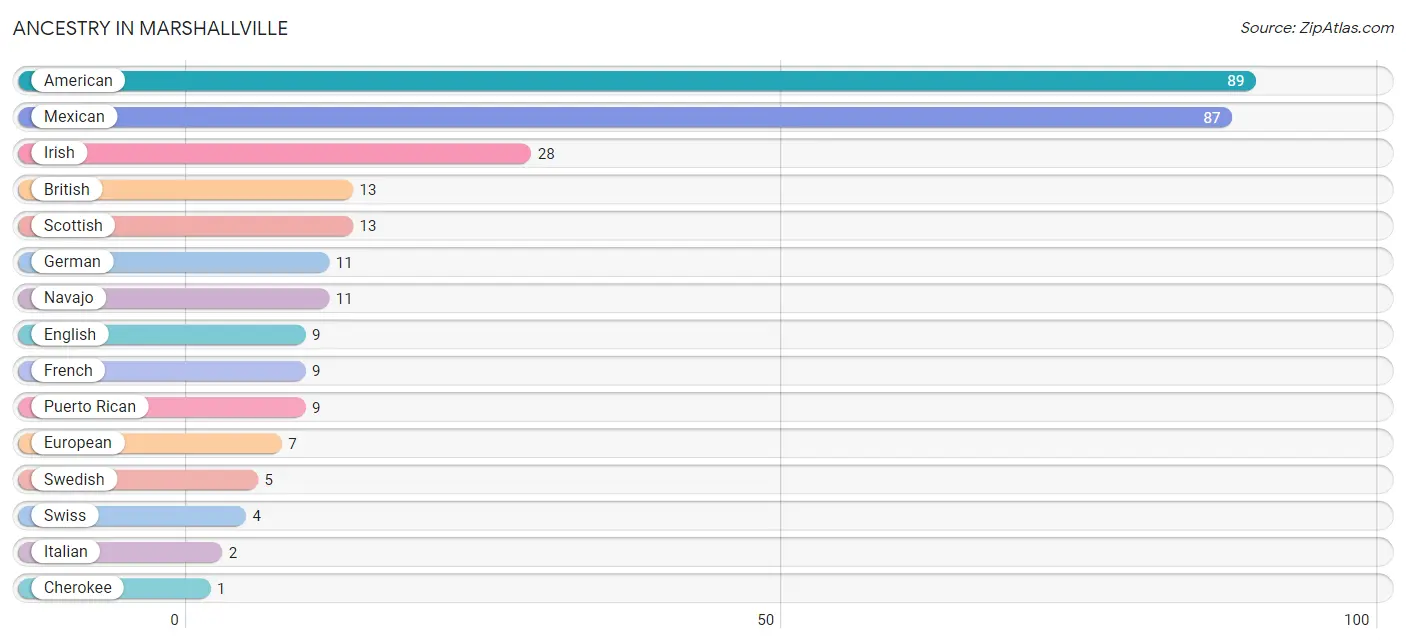
| Ancestry | # Population | % Population |
| American | 89 | 8.8% |
| British | 13 | 1.3% |
| Cherokee | 1 | 0.1% |
| English | 9 | 0.9% |
| European | 7 | 0.7% |
| French | 9 | 0.9% |
| German | 11 | 1.1% |
| Irish | 28 | 2.8% |
| Italian | 2 | 0.2% |
| Mexican | 87 | 8.6% |
| Navajo | 11 | 1.1% |
| Polish | 1 | 0.1% |
| Puerto Rican | 9 | 0.9% |
| Scottish | 13 | 1.3% |
| Swedish | 5 | 0.5% |
| Swiss | 4 | 0.4% | View All 16 Rows |
Immigrants in Marshallville

| Immigration Origin | # Population | % Population | View All 0 Rows |
Sex and Age in Marshallville
Sex and Age in Marshallville
The most populous age groups in Marshallville are 50 to 54 Years (68 | 15.5%) for men and 20 to 24 Years (108 | 18.8%) for women.
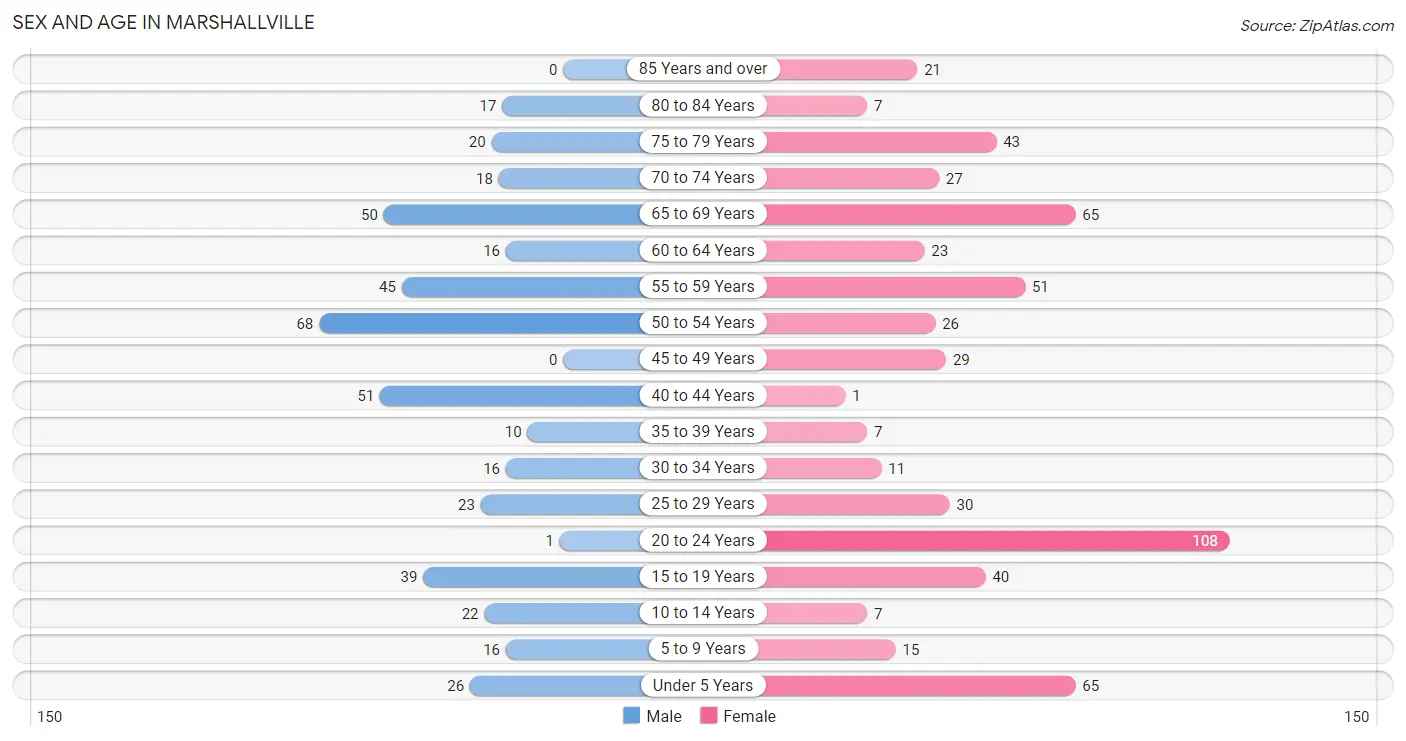
| Age Bracket | Male | Female |
| Under 5 Years | 26 (5.9%) | 65 (11.3%) |
| 5 to 9 Years | 16 (3.6%) | 15 (2.6%) |
| 10 to 14 Years | 22 (5.0%) | 7 (1.2%) |
| 15 to 19 Years | 39 (8.9%) | 40 (6.9%) |
| 20 to 24 Years | 1 (0.2%) | 108 (18.8%) |
| 25 to 29 Years | 23 (5.2%) | 30 (5.2%) |
| 30 to 34 Years | 16 (3.6%) | 11 (1.9%) |
| 35 to 39 Years | 10 (2.3%) | 7 (1.2%) |
| 40 to 44 Years | 51 (11.6%) | 1 (0.2%) |
| 45 to 49 Years | 0 (0.0%) | 29 (5.0%) |
| 50 to 54 Years | 68 (15.5%) | 26 (4.5%) |
| 55 to 59 Years | 45 (10.3%) | 51 (8.8%) |
| 60 to 64 Years | 16 (3.6%) | 23 (4.0%) |
| 65 to 69 Years | 50 (11.4%) | 65 (11.3%) |
| 70 to 74 Years | 18 (4.1%) | 27 (4.7%) |
| 75 to 79 Years | 20 (4.6%) | 43 (7.5%) |
| 80 to 84 Years | 17 (3.9%) | 7 (1.2%) |
| 85 Years and over | 0 (0.0%) | 21 (3.6%) |
| Total | 438 (100.0%) | 576 (100.0%) |
Families and Households in Marshallville
Median Family Size in Marshallville
The median family size in Marshallville is 3.27 persons per family, with single female/mother families (117 | 48.5%) accounting for the largest median family size of 3.79 persons per family. On the other hand, married-couple families (116 | 48.1%) represent the smallest median family size with 2.71 persons per family.
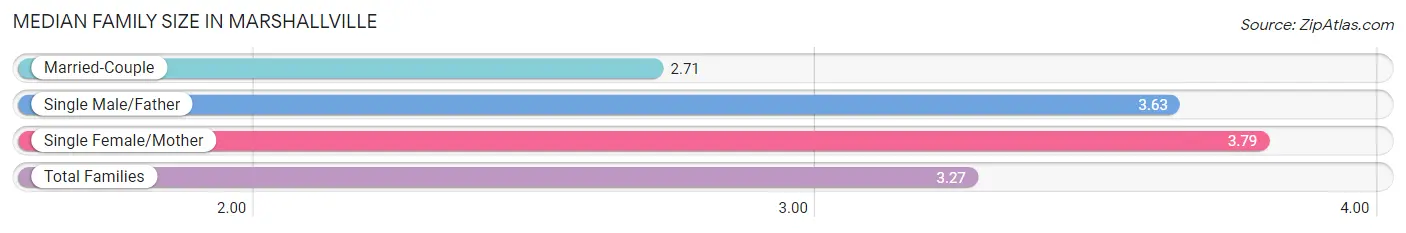
| Family Type | # Families | Family Size |
| Married-Couple | 116 (48.1%) | 2.71 |
| Single Male/Father | 8 (3.3%) | 3.63 |
| Single Female/Mother | 117 (48.5%) | 3.79 |
| Total Families | 241 (100.0%) | 3.27 |
Median Household Size in Marshallville
The median household size in Marshallville is 2.31 persons per household, with single female/mother households (117 | 26.7%) accounting for the largest median household size of 3.87 persons per household. non-family households (198 | 45.1%) represent the smallest median household size with 1.10 persons per household.
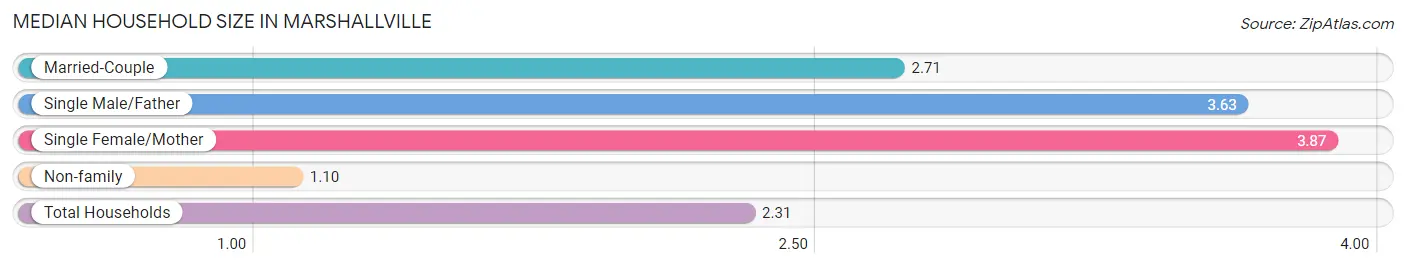
| Household Type | # Households | Household Size |
| Married-Couple | 116 (26.4%) | 2.71 |
| Single Male/Father | 8 (1.8%) | 3.63 |
| Single Female/Mother | 117 (26.7%) | 3.87 |
| Non-family | 198 (45.1%) | 1.10 |
| Total Households | 439 (100.0%) | 2.31 |
Household Size by Marriage Status in Marshallville
Out of a total of 439 households in Marshallville, 241 (54.9%) are family households, while 198 (45.1%) are nonfamily households. The most numerous type of family households are 2-person households, comprising 116, and the most common type of nonfamily households are 1-person households, comprising 187.
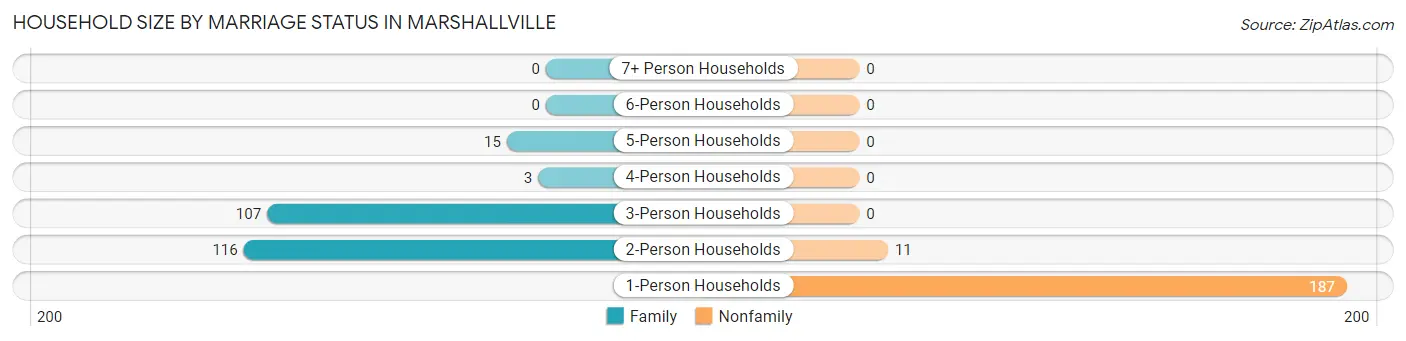
| Household Size | Family Households | Nonfamily Households |
| 1-Person Households | - | 187 (42.6%) |
| 2-Person Households | 116 (26.4%) | 11 (2.5%) |
| 3-Person Households | 107 (24.4%) | 0 (0.0%) |
| 4-Person Households | 3 (0.7%) | 0 (0.0%) |
| 5-Person Households | 15 (3.4%) | 0 (0.0%) |
| 6-Person Households | 0 (0.0%) | 0 (0.0%) |
| 7+ Person Households | 0 (0.0%) | 0 (0.0%) |
| Total | 241 (54.9%) | 198 (45.1%) |
Female Fertility in Marshallville
Fertility by Age in Marshallville
Average fertility rate in Marshallville is 35.0 births per 1,000 women. Women in the age bracket of 20 to 34 years have the highest fertility rate with 54.0 births per 1,000 women. Women in the age bracket of 20 to 34 years acount for 100.0% of all women with births.
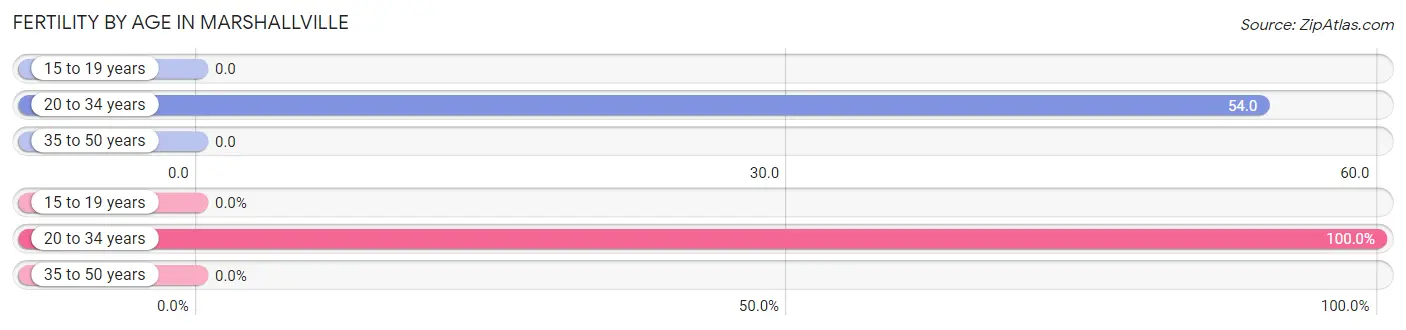
| Age Bracket | Women with Births | Births / 1,000 Women |
| 15 to 19 years | 0 (0.0%) | 0.0 |
| 20 to 34 years | 8 (100.0%) | 54.0 |
| 35 to 50 years | 0 (0.0%) | 0.0 |
| Total | 8 (100.0%) | 35.0 |
Fertility by Age by Marriage Status in Marshallville
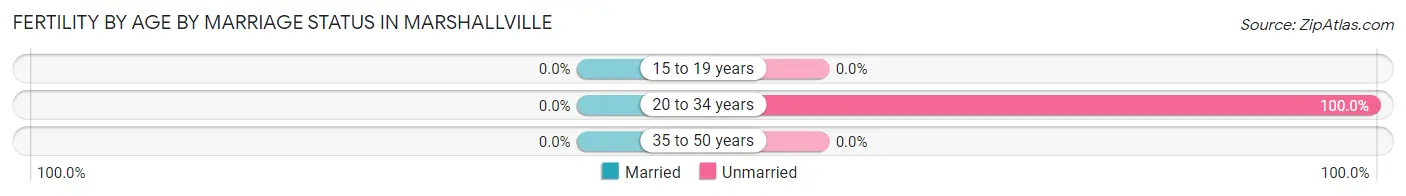
| Age Bracket | Married | Unmarried |
| 15 to 19 years | 0 (0.0%) | 0 (0.0%) |
| 20 to 34 years | 0 (0.0%) | 8 (100.0%) |
| 35 to 50 years | 0 (0.0%) | 0 (0.0%) |
| Total | 0 (0.0%) | 8 (100.0%) |
Fertility by Education in Marshallville
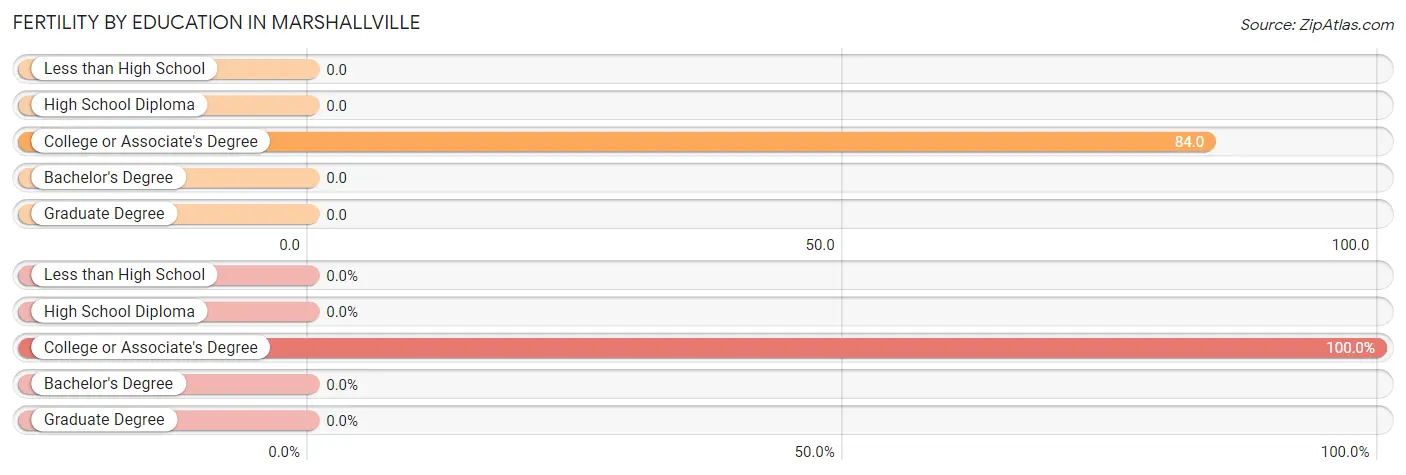
| Educational Attainment | Women with Births | Births / 1,000 Women |
| Less than High School | 0 (0.0%) | 0.0 |
| High School Diploma | 0 (0.0%) | 0.0 |
| College or Associate's Degree | 8 (100.0%) | 84.0 |
| Bachelor's Degree | 0 (0.0%) | 0.0 |
| Graduate Degree | 0 (0.0%) | 0.0 |
| Total | 8 (100.0%) | 35.0 |
Fertility by Education by Marriage Status in Marshallville
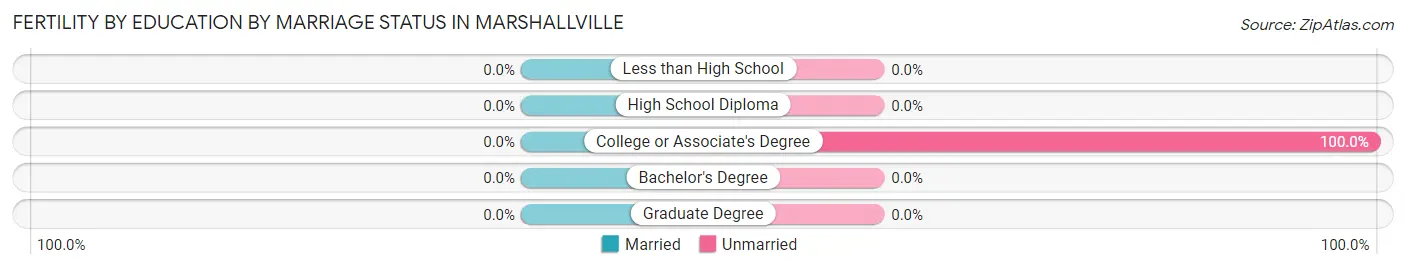
| Educational Attainment | Married | Unmarried |
| Less than High School | 0 (0.0%) | 0 (0.0%) |
| High School Diploma | 0 (0.0%) | 0 (0.0%) |
| College or Associate's Degree | 0 (0.0%) | 8 (100.0%) |
| Bachelor's Degree | 0 (0.0%) | 0 (0.0%) |
| Graduate Degree | 0 (0.0%) | 0 (0.0%) |
| Total | 0 (0.0%) | 8 (100.0%) |
Employment Characteristics in Marshallville
Employment by Class of Employer in Marshallville
Among the 394 employed individuals in Marshallville, private company employees (217 | 55.1%), self-employed (incorporated) (118 | 29.9%), and local government employees (22 | 5.6%) make up the most common classes of employment.
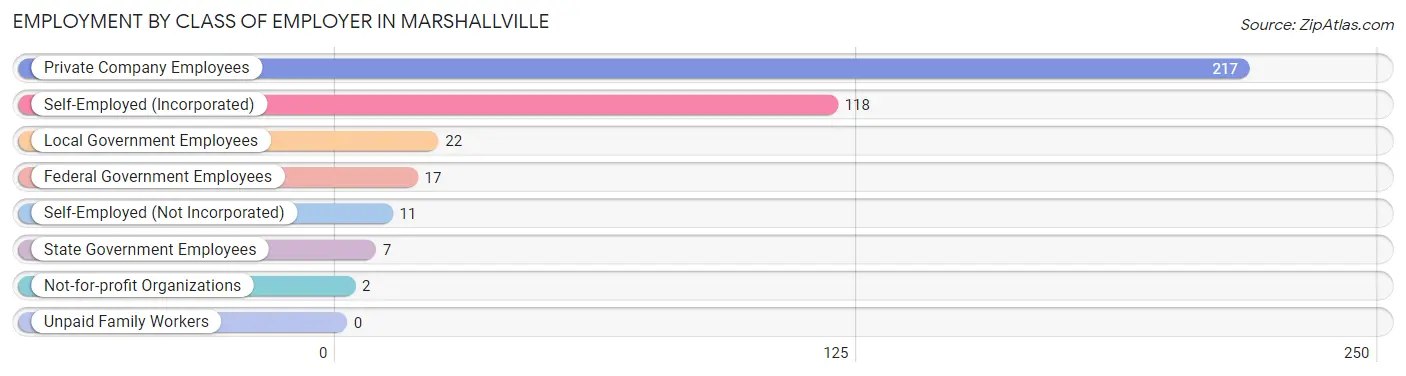
| Employer Class | # Employees | % Employees |
| Private Company Employees | 217 | 55.1% |
| Self-Employed (Incorporated) | 118 | 29.9% |
| Self-Employed (Not Incorporated) | 11 | 2.8% |
| Not-for-profit Organizations | 2 | 0.5% |
| Local Government Employees | 22 | 5.6% |
| State Government Employees | 7 | 1.8% |
| Federal Government Employees | 17 | 4.3% |
| Unpaid Family Workers | 0 | 0.0% |
| Total | 394 | 100.0% |
Employment Status by Age in Marshallville
According to the labor force statistics for Marshallville, out of the total population over 16 years of age (863), 52.4% or 452 individuals are in the labor force, with 13.0% or 59 of them unemployed. The age group with the highest labor force participation rate is 30 to 34 years, with 100.0% or 27 individuals in the labor force. Within the labor force, the 16 to 19 years age range has the highest percentage of unemployed individuals, with 64.3% or 18 of them being unemployed.
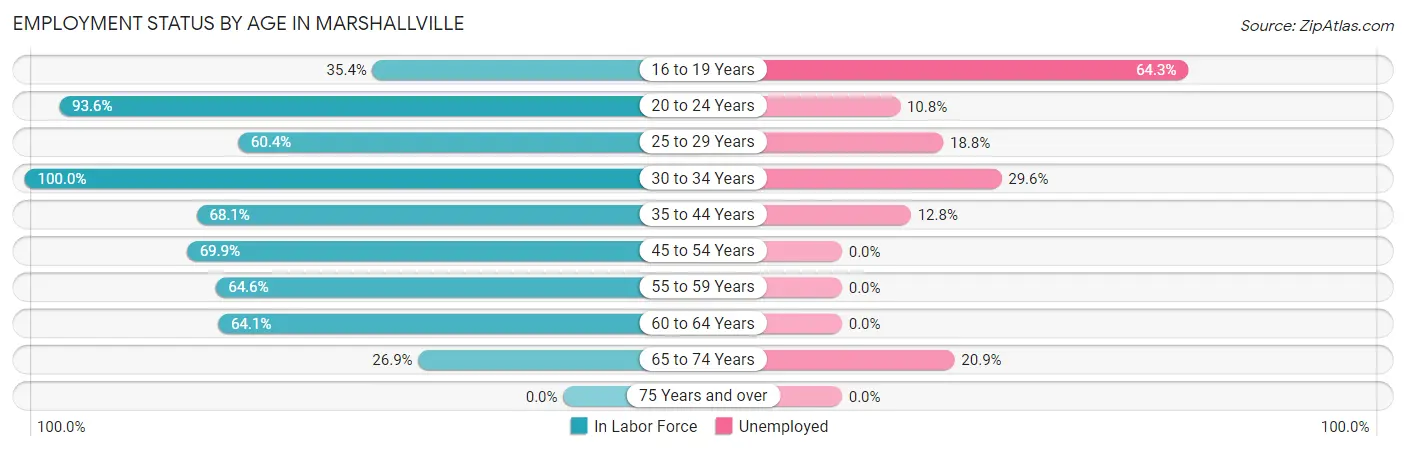
| Age Bracket | In Labor Force | Unemployed |
| 16 to 19 Years | 28 (35.4%) | 18 (64.3%) |
| 20 to 24 Years | 102 (93.6%) | 11 (10.8%) |
| 25 to 29 Years | 32 (60.4%) | 6 (18.8%) |
| 30 to 34 Years | 27 (100.0%) | 8 (29.6%) |
| 35 to 44 Years | 47 (68.1%) | 6 (12.8%) |
| 45 to 54 Years | 86 (69.9%) | 0 (0.0%) |
| 55 to 59 Years | 62 (64.6%) | 0 (0.0%) |
| 60 to 64 Years | 25 (64.1%) | 0 (0.0%) |
| 65 to 74 Years | 43 (26.9%) | 9 (20.9%) |
| 75 Years and over | 0 (0.0%) | 0 (0.0%) |
| Total | 452 (52.4%) | 59 (13.0%) |
Employment Status by Educational Attainment in Marshallville
According to labor force statistics for Marshallville, 68.6% of individuals (279) out of the total population between 25 and 64 years of age (407) are in the labor force, with 7.3% or 20 of them being unemployed. The group with the highest labor force participation rate are those with the educational attainment of bachelor's degree or higher, with 100.0% or 38 individuals in the labor force. Within the labor force, individuals with less than high school education have the highest percentage of unemployment, with 44.4% or 8 of them being unemployed.
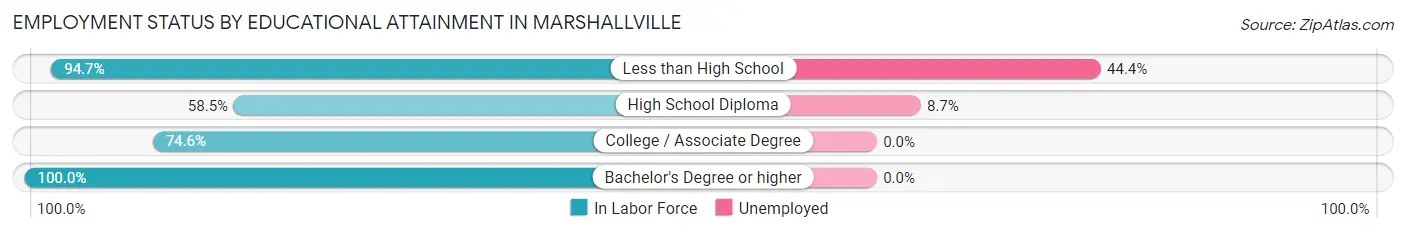
| Educational Attainment | In Labor Force | Unemployed |
| Less than High School | 18 (94.7%) | 8 (44.4%) |
| High School Diploma | 138 (58.5%) | 21 (8.7%) |
| College / Associate Degree | 85 (74.6%) | 0 (0.0%) |
| Bachelor's Degree or higher | 38 (100.0%) | 0 (0.0%) |
| Total | 279 (68.6%) | 30 (7.3%) |
Employment Occupations by Sex in Marshallville
Management, Business, Science and Arts Occupations
The most common Management, Business, Science and Arts occupations in Marshallville are Management (56 | 14.4%), Computers, Engineering & Science (23 | 5.9%), Life, Physical & Social Science (16 | 4.1%), Health Diagnosing & Treating (14 | 3.6%), and Computers & Mathematics (7 | 1.8%).
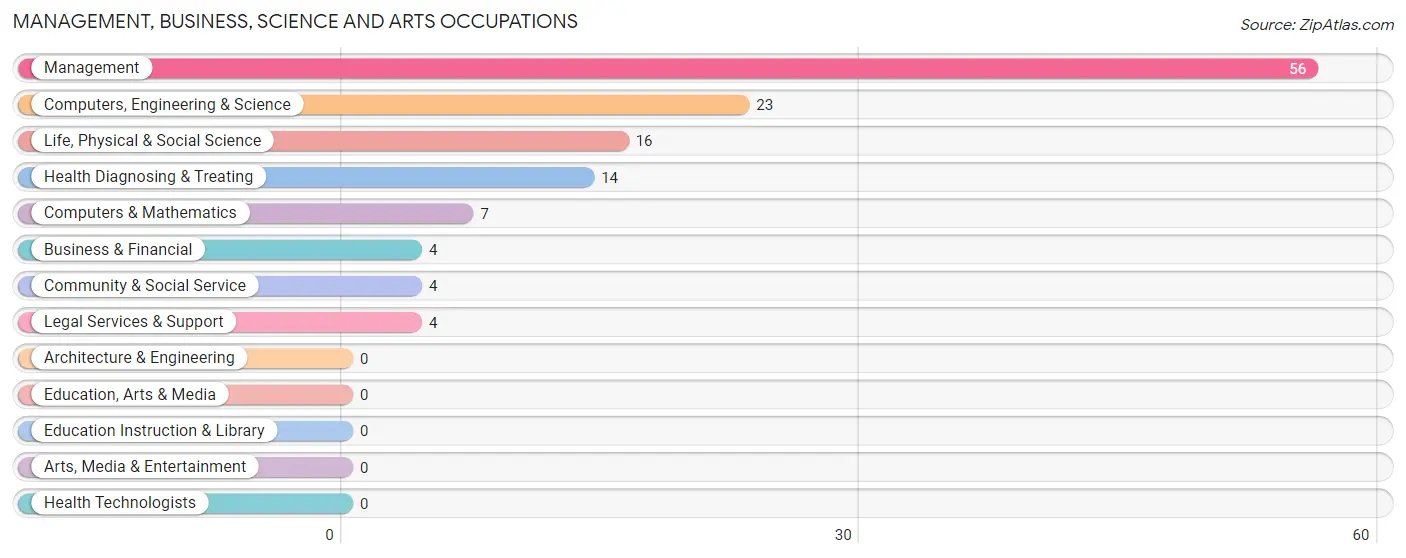
Management, Business, Science and Arts Occupations by Sex
Within the Management, Business, Science and Arts occupations in Marshallville, the most male-oriented occupations are Business & Financial (100.0%), Life, Physical & Social Science (100.0%), and Computers, Engineering & Science (69.6%), while the most female-oriented occupations are Computers & Mathematics (100.0%), Community & Social Service (100.0%), and Legal Services & Support (100.0%).
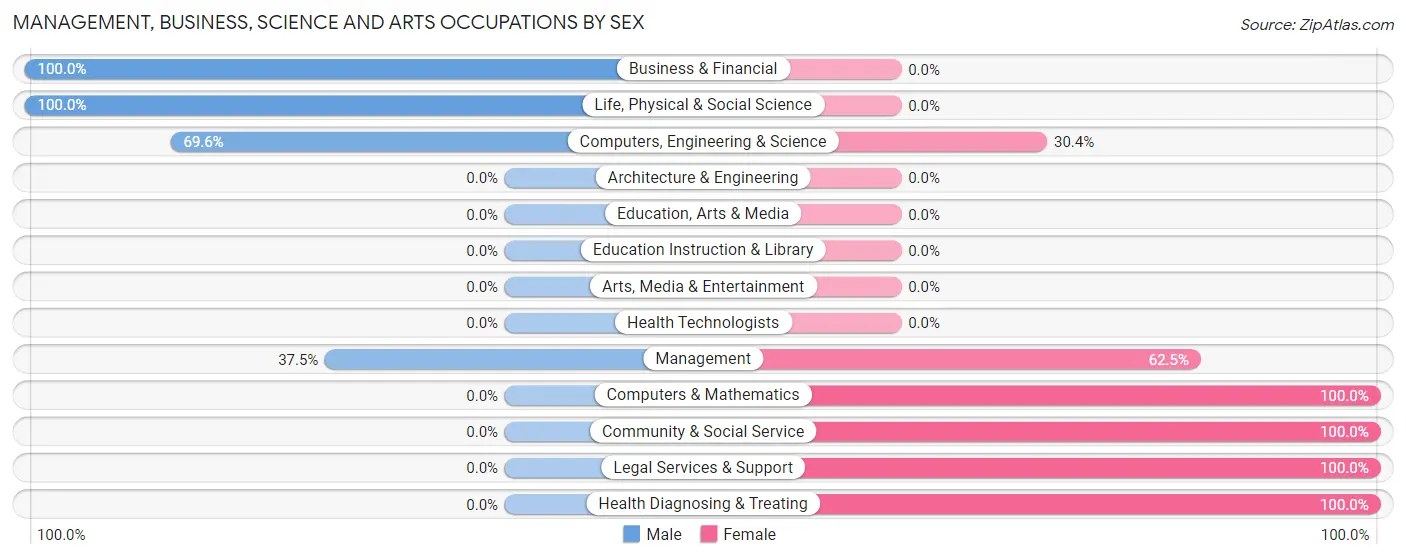
| Occupation | Male | Female |
| Management | 21 (37.5%) | 35 (62.5%) |
| Business & Financial | 4 (100.0%) | 0 (0.0%) |
| Computers, Engineering & Science | 16 (69.6%) | 7 (30.4%) |
| Computers & Mathematics | 0 (0.0%) | 7 (100.0%) |
| Architecture & Engineering | 0 (0.0%) | 0 (0.0%) |
| Life, Physical & Social Science | 16 (100.0%) | 0 (0.0%) |
| Community & Social Service | 0 (0.0%) | 4 (100.0%) |
| Education, Arts & Media | 0 (0.0%) | 0 (0.0%) |
| Legal Services & Support | 0 (0.0%) | 4 (100.0%) |
| Education Instruction & Library | 0 (0.0%) | 0 (0.0%) |
| Arts, Media & Entertainment | 0 (0.0%) | 0 (0.0%) |
| Health Diagnosing & Treating | 0 (0.0%) | 14 (100.0%) |
| Health Technologists | 0 (0.0%) | 0 (0.0%) |
| Total (Category) | 41 (40.6%) | 60 (59.4%) |
| Total (Overall) | 129 (33.3%) | 259 (66.7%) |
Services Occupations
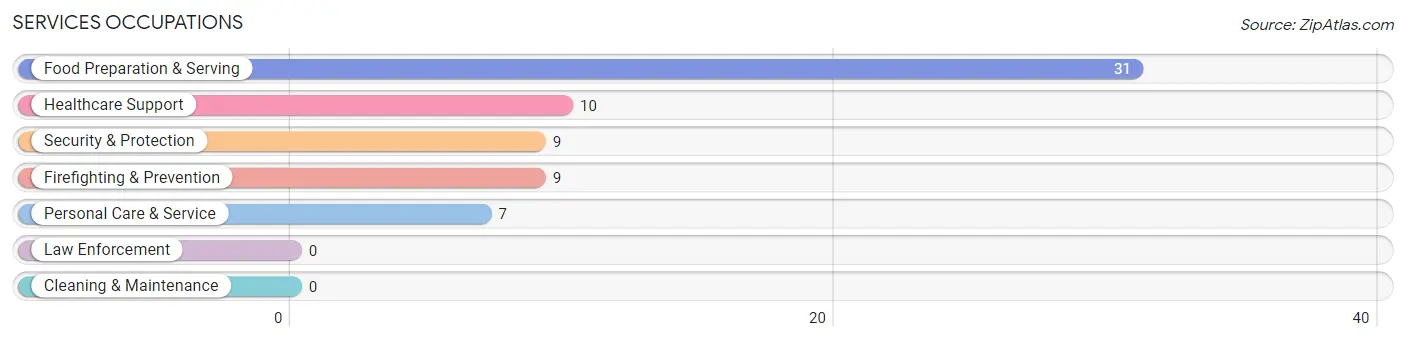
The most common Services occupations in Marshallville are Food Preparation & Serving (31 | 8.0%), Healthcare Support (10 | 2.6%), Security & Protection (9 | 2.3%), Firefighting & Prevention (9 | 2.3%), and Personal Care & Service (7 | 1.8%).
Services Occupations by Sex
Within the Services occupations in Marshallville, the most male-oriented occupations are Personal Care & Service (100.0%), and Food Preparation & Serving (67.7%), while the most female-oriented occupations are Healthcare Support (100.0%), Security & Protection (100.0%), and Firefighting & Prevention (100.0%).
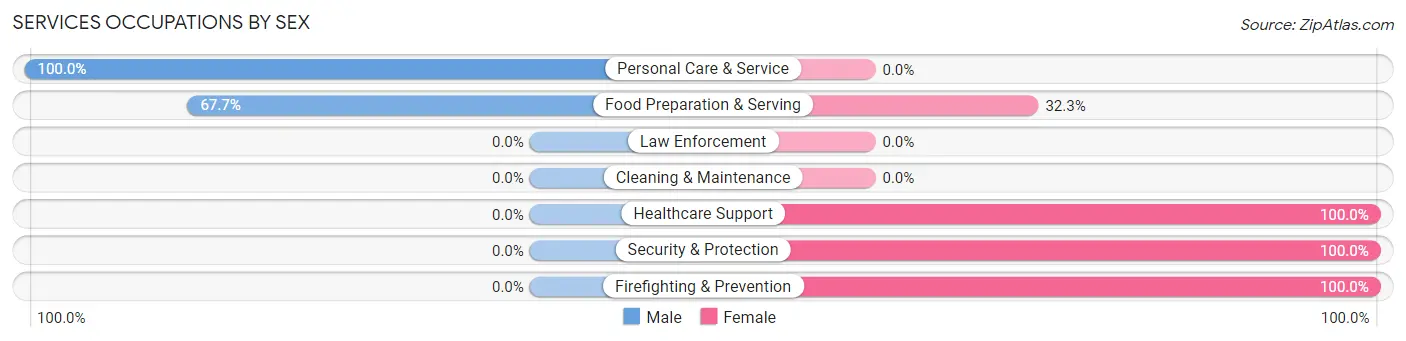
| Occupation | Male | Female |
| Healthcare Support | 0 (0.0%) | 10 (100.0%) |
| Security & Protection | 0 (0.0%) | 9 (100.0%) |
| Firefighting & Prevention | 0 (0.0%) | 9 (100.0%) |
| Law Enforcement | 0 (0.0%) | 0 (0.0%) |
| Food Preparation & Serving | 21 (67.7%) | 10 (32.3%) |
| Cleaning & Maintenance | 0 (0.0%) | 0 (0.0%) |
| Personal Care & Service | 7 (100.0%) | 0 (0.0%) |
| Total (Category) | 28 (49.1%) | 29 (50.9%) |
| Total (Overall) | 129 (33.3%) | 259 (66.7%) |
Sales and Office Occupations
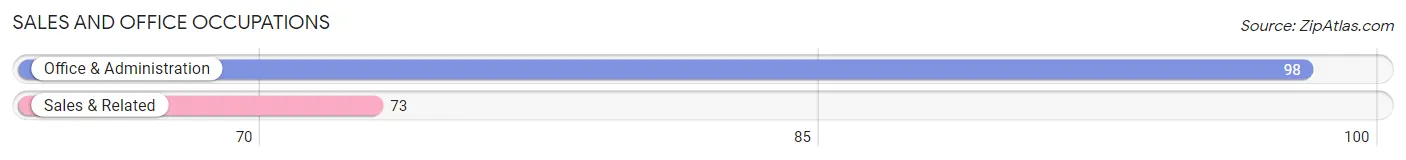
The most common Sales and Office occupations in Marshallville are Office & Administration (98 | 25.3%), and Sales & Related (73 | 18.8%).
Sales and Office Occupations by Sex
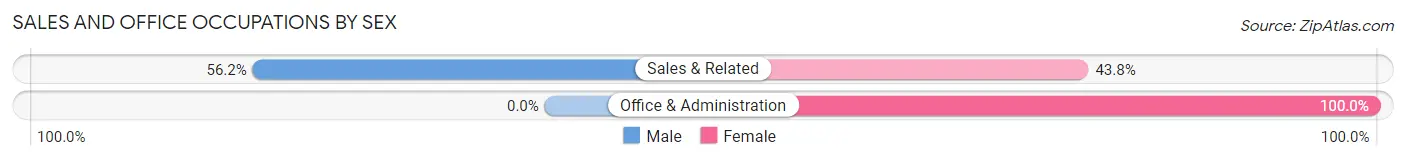
| Occupation | Male | Female |
| Sales & Related | 41 (56.2%) | 32 (43.8%) |
| Office & Administration | 0 (0.0%) | 98 (100.0%) |
| Total (Category) | 41 (24.0%) | 130 (76.0%) |
| Total (Overall) | 129 (33.3%) | 259 (66.7%) |
Natural Resources, Construction and Maintenance Occupations
Natural Resources, Construction and Maintenance Occupations by Sex
| Occupation | Male | Female |
| Farming, Fishing & Forestry | 0 (0.0%) | 0 (0.0%) |
| Construction & Extraction | 0 (0.0%) | 0 (0.0%) |
| Installation, Maintenance & Repair | 0 (0.0%) | 0 (0.0%) |
| Total (Category) | 0 (0.0%) | 0 (0.0%) |
| Total (Overall) | 129 (33.3%) | 259 (66.7%) |
Production, Transportation and Moving Occupations
The most common Production, Transportation and Moving occupations in Marshallville are Material Moving (28 | 7.2%), Production (21 | 5.4%), and Transportation (10 | 2.6%).
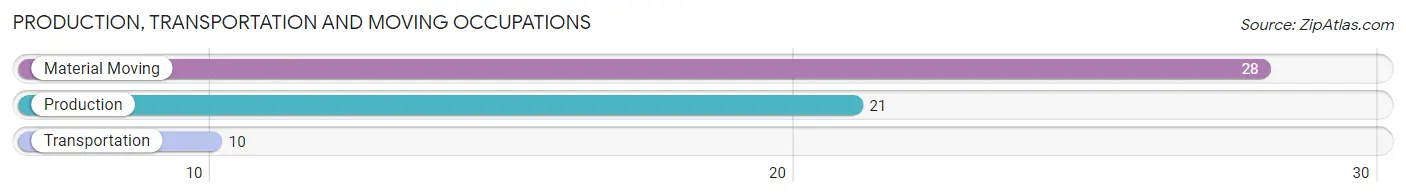
Production, Transportation and Moving Occupations by Sex
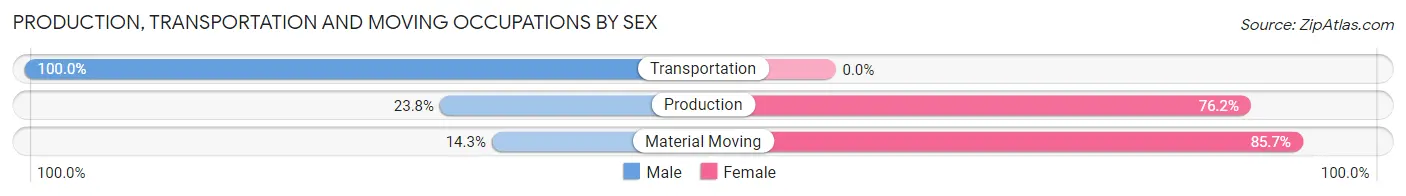
| Occupation | Male | Female |
| Production | 5 (23.8%) | 16 (76.2%) |
| Transportation | 10 (100.0%) | 0 (0.0%) |
| Material Moving | 4 (14.3%) | 24 (85.7%) |
| Total (Category) | 19 (32.2%) | 40 (67.8%) |
| Total (Overall) | 129 (33.3%) | 259 (66.7%) |
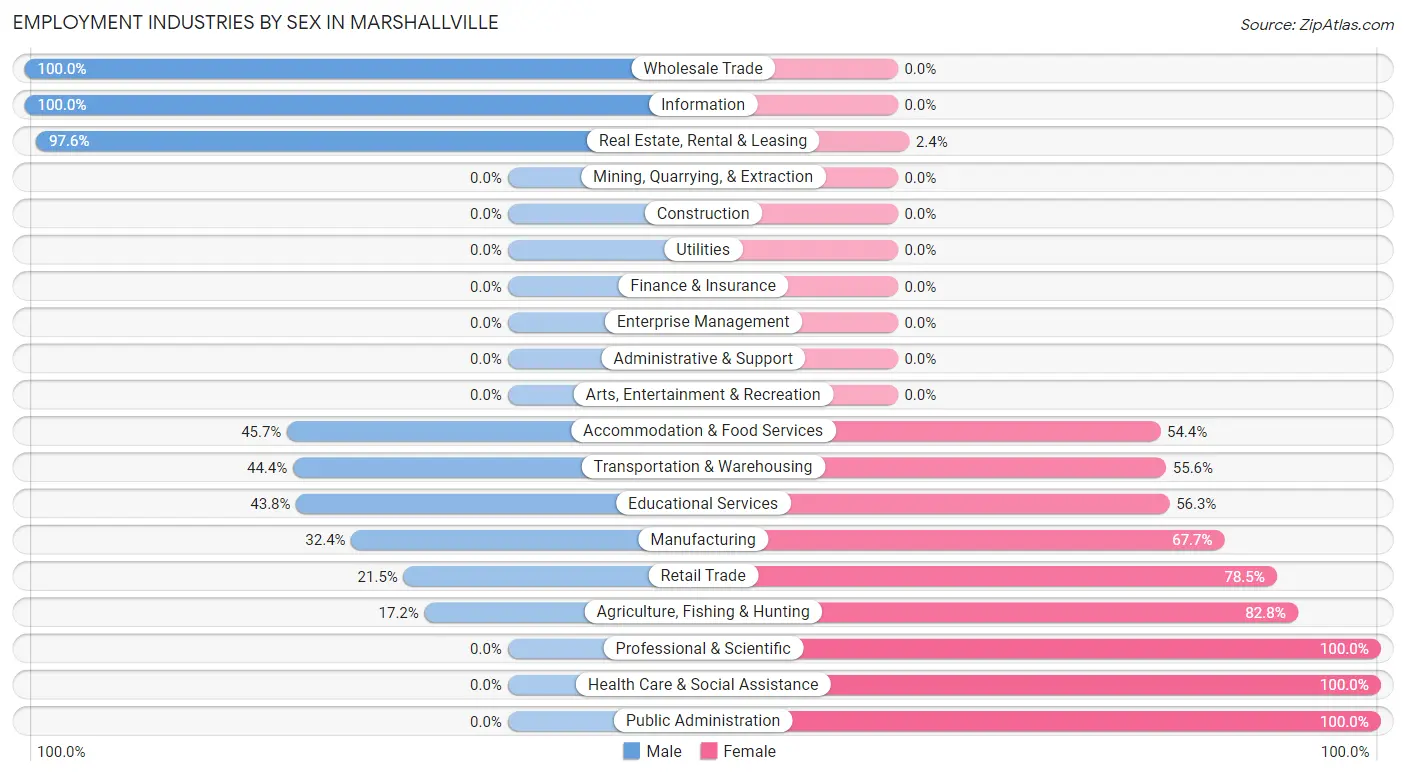
Employment Industries by Sex in Marshallville
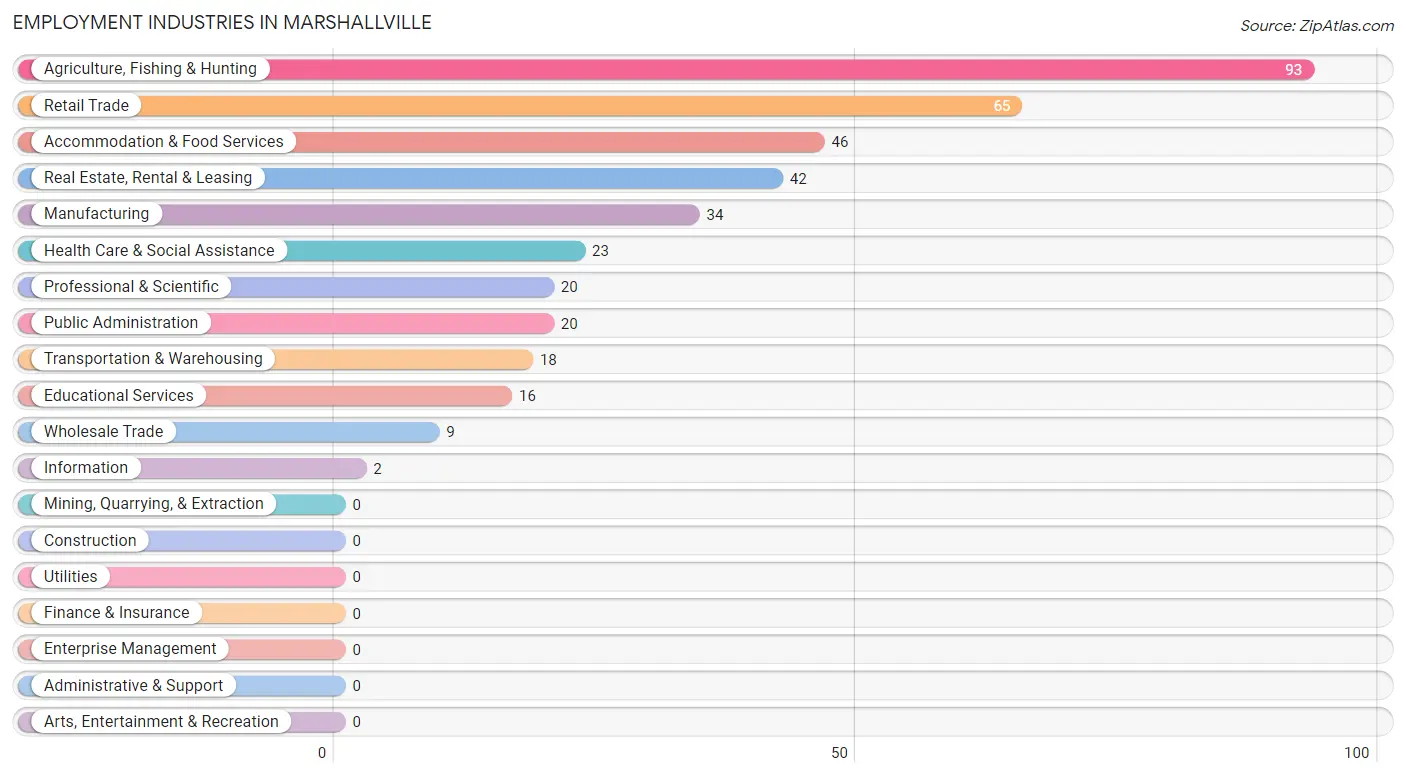
Employment Industries in Marshallville
The major employment industries in Marshallville include Agriculture, Fishing & Hunting (93 | 24.0%), Retail Trade (65 | 16.8%), Accommodation & Food Services (46 | 11.9%), Real Estate, Rental & Leasing (42 | 10.8%), and Manufacturing (34 | 8.8%).
Employment Industries by Sex in Marshallville
The Marshallville industries that see more men than women are Wholesale Trade (100.0%), Information (100.0%), and Real Estate, Rental & Leasing (97.6%), whereas the industries that tend to have a higher number of women are Professional & Scientific (100.0%), Health Care & Social Assistance (100.0%), and Public Administration (100.0%).
| Industry | Male | Female |
| Agriculture, Fishing & Hunting | 16 (17.2%) | 77 (82.8%) |
| Mining, Quarrying, & Extraction | 0 (0.0%) | 0 (0.0%) |
| Construction | 0 (0.0%) | 0 (0.0%) |
| Manufacturing | 11 (32.4%) | 23 (67.6%) |
| Wholesale Trade | 9 (100.0%) | 0 (0.0%) |
| Retail Trade | 14 (21.5%) | 51 (78.5%) |
| Transportation & Warehousing | 8 (44.4%) | 10 (55.6%) |
| Utilities | 0 (0.0%) | 0 (0.0%) |
| Information | 2 (100.0%) | 0 (0.0%) |
| Finance & Insurance | 0 (0.0%) | 0 (0.0%) |
| Real Estate, Rental & Leasing | 41 (97.6%) | 1 (2.4%) |
| Professional & Scientific | 0 (0.0%) | 20 (100.0%) |
| Enterprise Management | 0 (0.0%) | 0 (0.0%) |
| Administrative & Support | 0 (0.0%) | 0 (0.0%) |
| Educational Services | 7 (43.8%) | 9 (56.2%) |
| Health Care & Social Assistance | 0 (0.0%) | 23 (100.0%) |
| Arts, Entertainment & Recreation | 0 (0.0%) | 0 (0.0%) |
| Accommodation & Food Services | 21 (45.7%) | 25 (54.3%) |
| Public Administration | 0 (0.0%) | 20 (100.0%) |
| Total | 129 (33.3%) | 259 (66.7%) |
Education in Marshallville
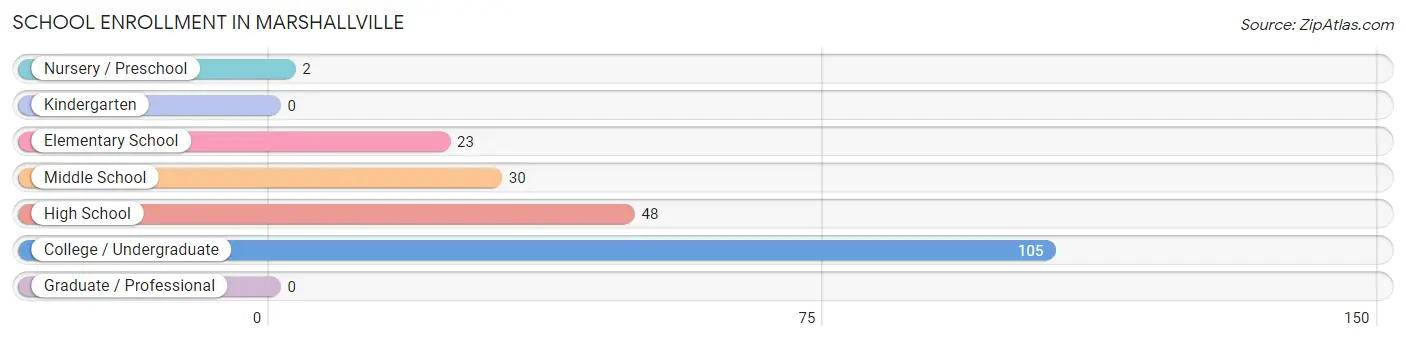
School Enrollment in Marshallville
The most common levels of schooling among the 208 students in Marshallville are college / undergraduate (105 | 50.5%), high school (48 | 23.1%), and middle school (30 | 14.4%).
| School Level | # Students | % Students |
| Nursery / Preschool | 2 | 1.0% |
| Kindergarten | 0 | 0.0% |
| Elementary School | 23 | 11.1% |
| Middle School | 30 | 14.4% |
| High School | 48 | 23.1% |
| College / Undergraduate | 105 | 50.5% |
| Graduate / Professional | 0 | 0.0% |
| Total | 208 | 100.0% |
School Enrollment by Age by Funding Source in Marshallville
Out of a total of 208 students who are enrolled in schools in Marshallville, 28 (13.5%) attend a private institution, while the remaining 180 (86.5%) are enrolled in public schools. The age group of 10 to 14 year olds has the highest likelihood of being enrolled in private schools, with 21 (72.4% in the age bracket) enrolled. Conversely, the age group of 15 to 17 year olds has the lowest likelihood of being enrolled in a private school, with 34 (100.0% in the age bracket) attending a public institution.
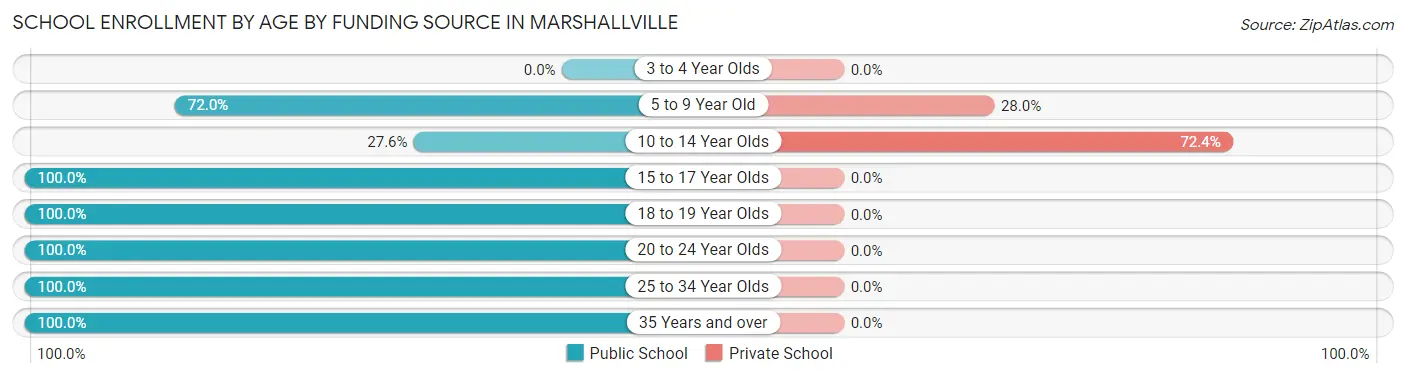
| Age Bracket | Public School | Private School |
| 3 to 4 Year Olds | 0 (0.0%) | 0 (0.0%) |
| 5 to 9 Year Old | 18 (72.0%) | 7 (28.0%) |
| 10 to 14 Year Olds | 8 (27.6%) | 21 (72.4%) |
| 15 to 17 Year Olds | 34 (100.0%) | 0 (0.0%) |
| 18 to 19 Year Olds | 23 (100.0%) | 0 (0.0%) |
| 20 to 24 Year Olds | 77 (100.0%) | 0 (0.0%) |
| 25 to 34 Year Olds | 12 (100.0%) | 0 (0.0%) |
| 35 Years and over | 8 (100.0%) | 0 (0.0%) |
| Total | 180 (86.5%) | 28 (13.5%) |
Educational Attainment by Field of Study in Marshallville
Business (34 | 46.0%), bio, nature & agricultural (23 | 31.1%), computers & mathematics (9 | 12.2%), social sciences (4 | 5.4%), and visual & performing arts (2 | 2.7%) are the most common fields of study among 74 individuals in Marshallville who have obtained a bachelor's degree or higher.
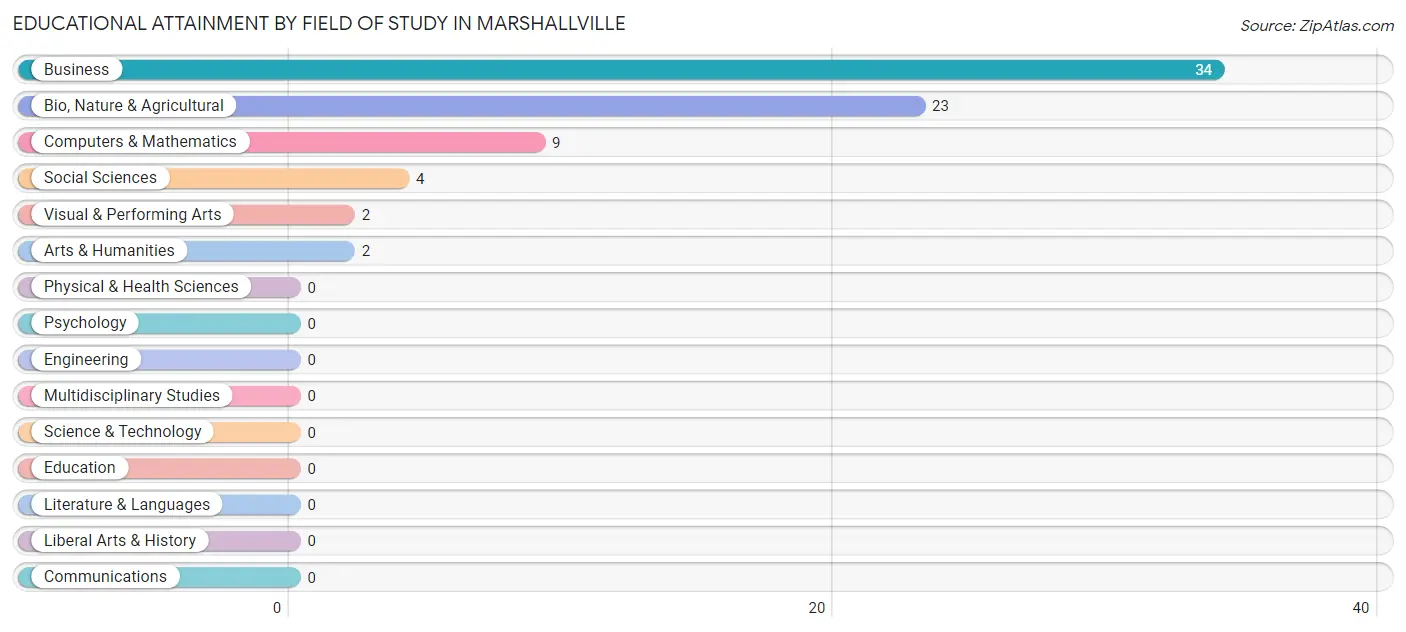
| Field of Study | # Graduates | % Graduates |
| Computers & Mathematics | 9 | 12.2% |
| Bio, Nature & Agricultural | 23 | 31.1% |
| Physical & Health Sciences | 0 | 0.0% |
| Psychology | 0 | 0.0% |
| Social Sciences | 4 | 5.4% |
| Engineering | 0 | 0.0% |
| Multidisciplinary Studies | 0 | 0.0% |
| Science & Technology | 0 | 0.0% |
| Business | 34 | 46.0% |
| Education | 0 | 0.0% |
| Literature & Languages | 0 | 0.0% |
| Liberal Arts & History | 0 | 0.0% |
| Visual & Performing Arts | 2 | 2.7% |
| Communications | 0 | 0.0% |
| Arts & Humanities | 2 | 2.7% |
| Total | 74 | 100.0% |
Transportation & Commute in Marshallville
Vehicle Availability by Sex in Marshallville
The most prevalent vehicle ownership categories in Marshallville are males with 3 vehicles (58, accounting for 45.0%) and females with 3 vehicles (33, making up 21.9%).
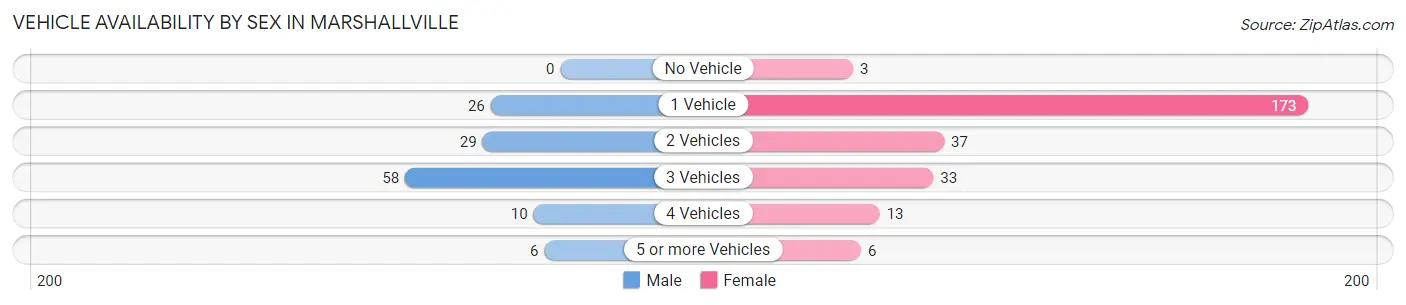
| Vehicles Available | Male | Female |
| No Vehicle | 0 (0.0%) | 3 (1.1%) |
| 1 Vehicle | 26 (20.2%) | 173 (65.3%) |
| 2 Vehicles | 29 (22.5%) | 37 (14.0%) |
| 3 Vehicles | 58 (45.0%) | 33 (12.4%) |
| 4 Vehicles | 10 (7.7%) | 13 (4.9%) |
| 5 or more Vehicles | 6 (4.6%) | 6 (2.3%) |
| Total | 129 (100.0%) | 265 (100.0%) |
Commute Time in Marshallville
The most frequently occuring commute durations in Marshallville are less than 5 minutes (86 commuters, 24.8%), 20 to 24 minutes (66 commuters, 19.0%), and 90 or more minutes (55 commuters, 15.9%).
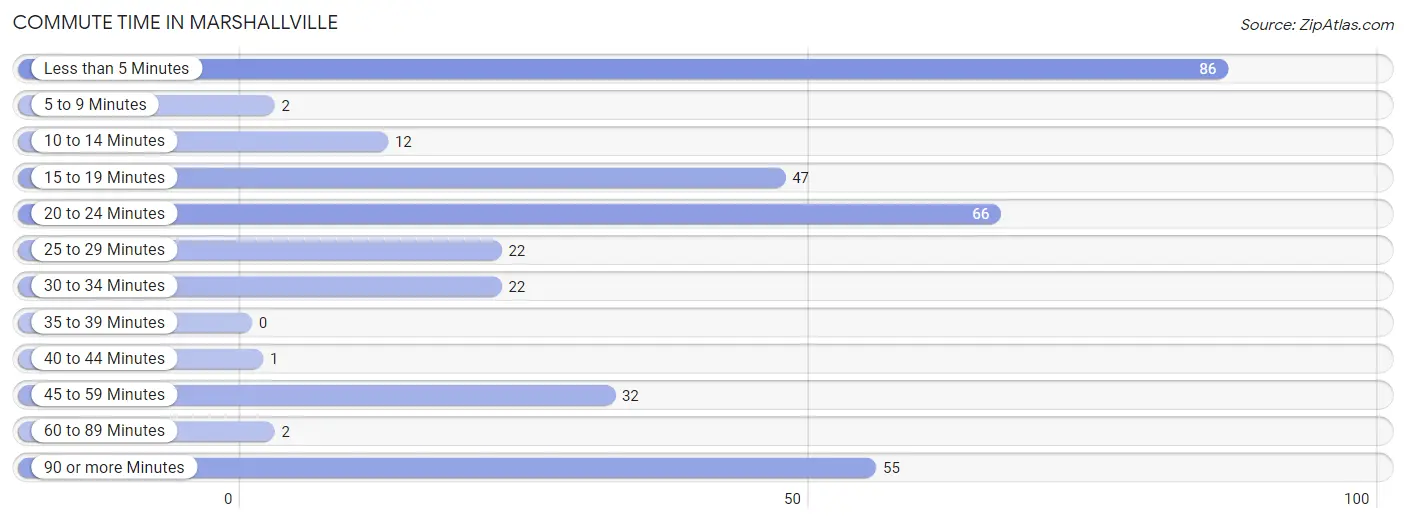
| Commute Time | # Commuters | % Commuters |
| Less than 5 Minutes | 86 | 24.8% |
| 5 to 9 Minutes | 2 | 0.6% |
| 10 to 14 Minutes | 12 | 3.5% |
| 15 to 19 Minutes | 47 | 13.5% |
| 20 to 24 Minutes | 66 | 19.0% |
| 25 to 29 Minutes | 22 | 6.3% |
| 30 to 34 Minutes | 22 | 6.3% |
| 35 to 39 Minutes | 0 | 0.0% |
| 40 to 44 Minutes | 1 | 0.3% |
| 45 to 59 Minutes | 32 | 9.2% |
| 60 to 89 Minutes | 2 | 0.6% |
| 90 or more Minutes | 55 | 15.9% |
Commute Time by Sex in Marshallville
The most common commute times in Marshallville are 90 or more minutes (41 commuters, 41.4%) for males and less than 5 minutes (82 commuters, 33.1%) for females.
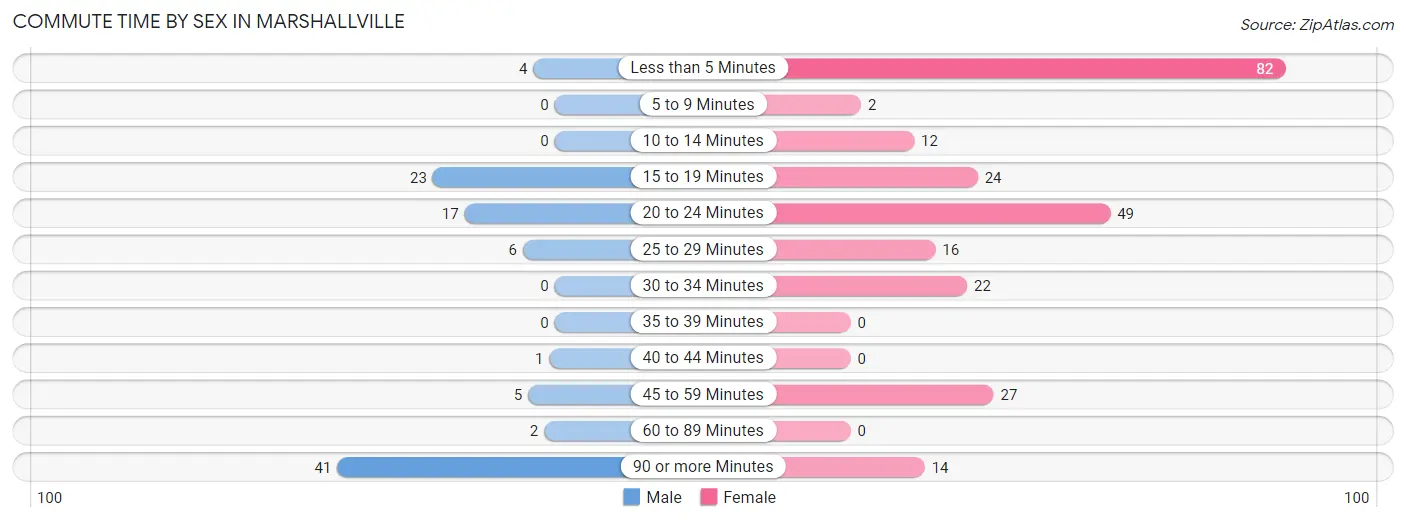
| Commute Time | Male | Female |
| Less than 5 Minutes | 4 (4.0%) | 82 (33.1%) |
| 5 to 9 Minutes | 0 (0.0%) | 2 (0.8%) |
| 10 to 14 Minutes | 0 (0.0%) | 12 (4.8%) |
| 15 to 19 Minutes | 23 (23.2%) | 24 (9.7%) |
| 20 to 24 Minutes | 17 (17.2%) | 49 (19.8%) |
| 25 to 29 Minutes | 6 (6.1%) | 16 (6.5%) |
| 30 to 34 Minutes | 0 (0.0%) | 22 (8.9%) |
| 35 to 39 Minutes | 0 (0.0%) | 0 (0.0%) |
| 40 to 44 Minutes | 1 (1.0%) | 0 (0.0%) |
| 45 to 59 Minutes | 5 (5.1%) | 27 (10.9%) |
| 60 to 89 Minutes | 2 (2.0%) | 0 (0.0%) |
| 90 or more Minutes | 41 (41.4%) | 14 (5.7%) |
Time of Departure to Work by Sex in Marshallville
The most frequent times of departure to work in Marshallville are 7:00 AM to 7:29 AM (44, 44.4%) for males and 7:00 AM to 7:29 AM (81, 32.7%) for females.
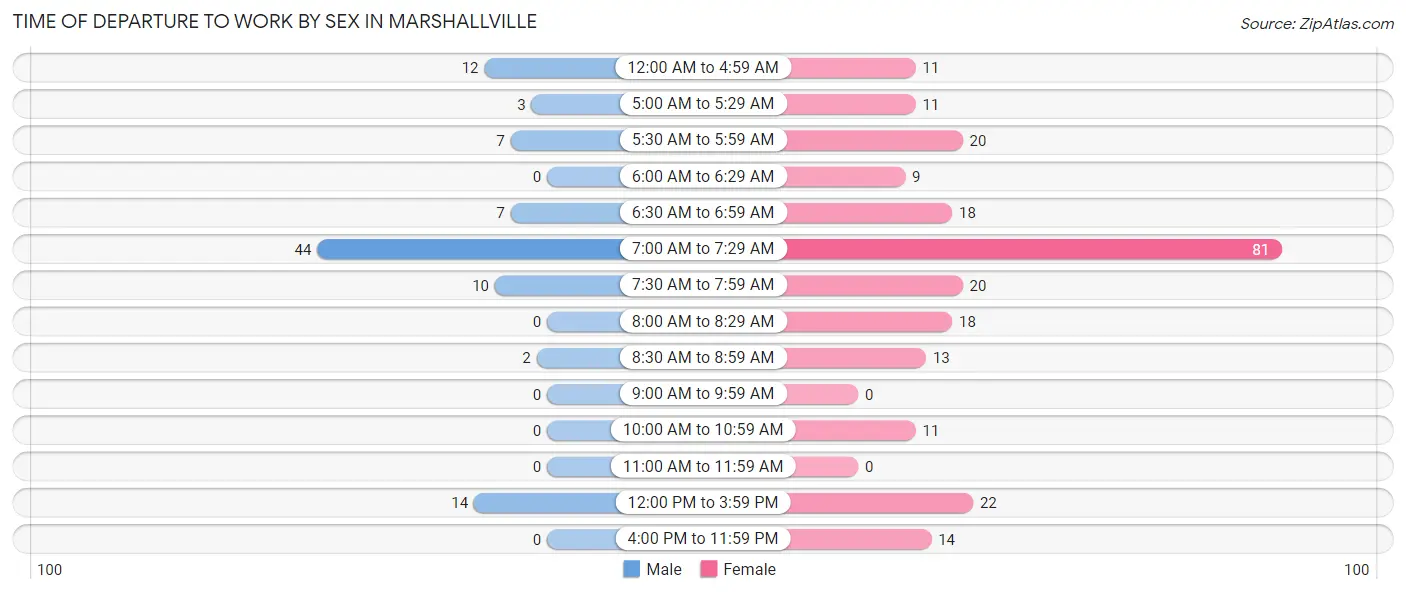
| Time of Departure | Male | Female |
| 12:00 AM to 4:59 AM | 12 (12.1%) | 11 (4.4%) |
| 5:00 AM to 5:29 AM | 3 (3.0%) | 11 (4.4%) |
| 5:30 AM to 5:59 AM | 7 (7.1%) | 20 (8.1%) |
| 6:00 AM to 6:29 AM | 0 (0.0%) | 9 (3.6%) |
| 6:30 AM to 6:59 AM | 7 (7.1%) | 18 (7.3%) |
| 7:00 AM to 7:29 AM | 44 (44.4%) | 81 (32.7%) |
| 7:30 AM to 7:59 AM | 10 (10.1%) | 20 (8.1%) |
| 8:00 AM to 8:29 AM | 0 (0.0%) | 18 (7.3%) |
| 8:30 AM to 8:59 AM | 2 (2.0%) | 13 (5.2%) |
| 9:00 AM to 9:59 AM | 0 (0.0%) | 0 (0.0%) |
| 10:00 AM to 10:59 AM | 0 (0.0%) | 11 (4.4%) |
| 11:00 AM to 11:59 AM | 0 (0.0%) | 0 (0.0%) |
| 12:00 PM to 3:59 PM | 14 (14.1%) | 22 (8.9%) |
| 4:00 PM to 11:59 PM | 0 (0.0%) | 14 (5.7%) |
| Total | 99 (100.0%) | 248 (100.0%) |
Housing Occupancy in Marshallville
Occupancy by Ownership in Marshallville
Of the total 439 dwellings in Marshallville, owner-occupied units account for 240 (54.7%), while renter-occupied units make up 199 (45.3%).
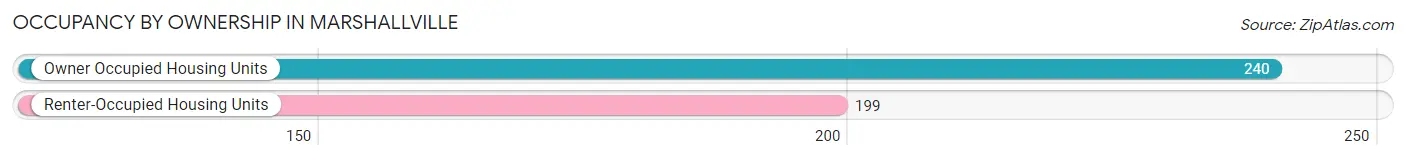
| Occupancy | # Housing Units | % Housing Units |
| Owner Occupied Housing Units | 240 | 54.7% |
| Renter-Occupied Housing Units | 199 | 45.3% |
| Total Occupied Housing Units | 439 | 100.0% |
Occupancy by Household Size in Marshallville
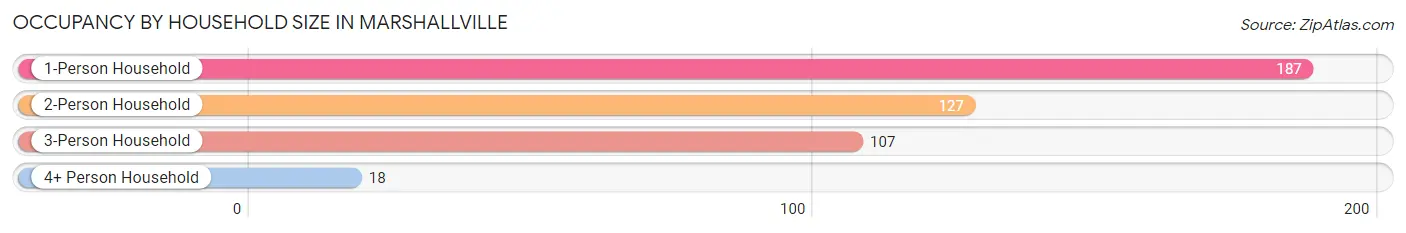
| Household Size | # Housing Units | % Housing Units |
| 1-Person Household | 187 | 42.6% |
| 2-Person Household | 127 | 28.9% |
| 3-Person Household | 107 | 24.4% |
| 4+ Person Household | 18 | 4.1% |
| Total Housing Units | 439 | 100.0% |
Occupancy by Ownership by Household Size in Marshallville
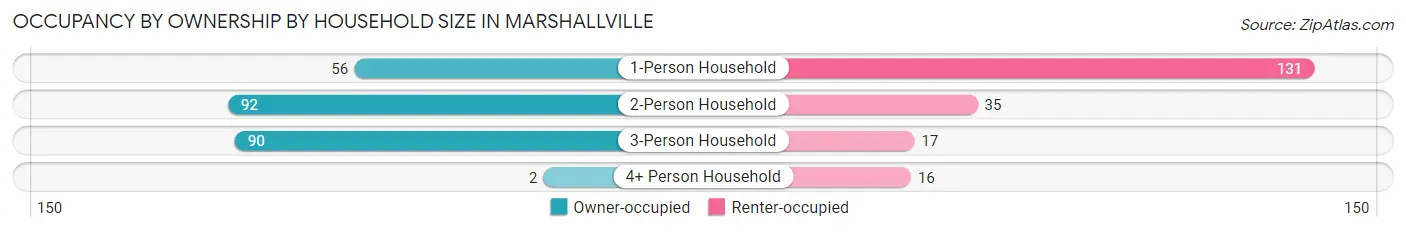
| Household Size | Owner-occupied | Renter-occupied |
| 1-Person Household | 56 (29.9%) | 131 (70.1%) |
| 2-Person Household | 92 (72.4%) | 35 (27.6%) |
| 3-Person Household | 90 (84.1%) | 17 (15.9%) |
| 4+ Person Household | 2 (11.1%) | 16 (88.9%) |
| Total Housing Units | 240 (54.7%) | 199 (45.3%) |
Occupancy by Educational Attainment in Marshallville
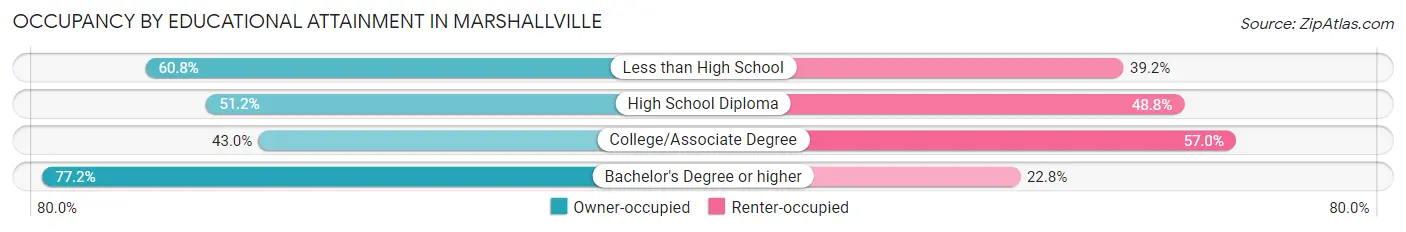
| Household Size | Owner-occupied | Renter-occupied |
| Less than High School | 73 (60.8%) | 47 (39.2%) |
| High School Diploma | 65 (51.2%) | 62 (48.8%) |
| College/Associate Degree | 58 (43.0%) | 77 (57.0%) |
| Bachelor's Degree or higher | 44 (77.2%) | 13 (22.8%) |
Occupancy by Age of Householder in Marshallville
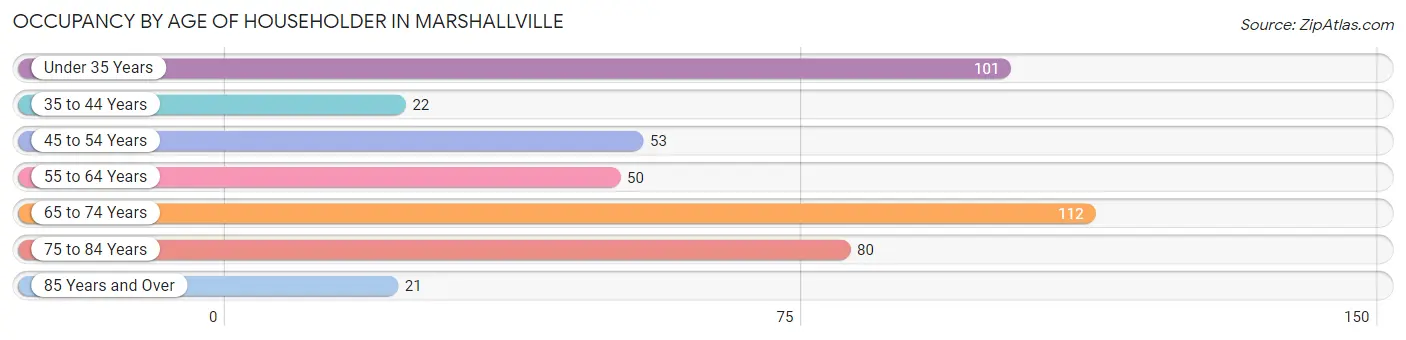
| Age Bracket | # Households | % Households |
| Under 35 Years | 101 | 23.0% |
| 35 to 44 Years | 22 | 5.0% |
| 45 to 54 Years | 53 | 12.1% |
| 55 to 64 Years | 50 | 11.4% |
| 65 to 74 Years | 112 | 25.5% |
| 75 to 84 Years | 80 | 18.2% |
| 85 Years and Over | 21 | 4.8% |
| Total | 439 | 100.0% |
Housing Finances in Marshallville
Median Income by Occupancy in Marshallville
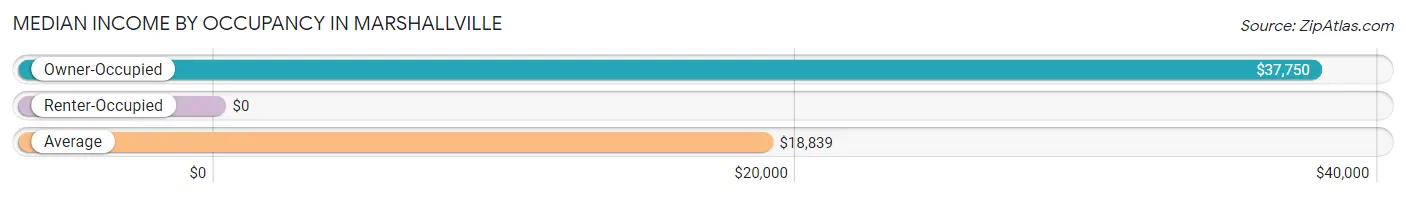
| Occupancy Type | # Households | Median Income |
| Owner-Occupied | 240 (54.7%) | $37,750 |
| Renter-Occupied | 199 (45.3%) | $0 |
| Average | 439 (100.0%) | $18,839 |
Occupancy by Householder Income Bracket in Marshallville
| Income Bracket | Owner-occupied | Renter-occupied |
| Less than $5,000 | 4 (1.7%) | 6 (3.0%) |
| $5,000 to $9,999 | 19 (7.9%) | 96 (48.2%) |
| $10,000 to $14,999 | 37 (15.4%) | 12 (6.0%) |
| $15,000 to $19,999 | 23 (9.6%) | 29 (14.6%) |
| $20,000 to $24,999 | 30 (12.5%) | 14 (7.0%) |
| $25,000 to $34,999 | 6 (2.5%) | 4 (2.0%) |
| $35,000 to $49,999 | 13 (5.4%) | 7 (3.5%) |
| $50,000 to $74,999 | 35 (14.6%) | 18 (9.0%) |
| $75,000 to $99,999 | 7 (2.9%) | 0 (0.0%) |
| $100,000 to $149,999 | 43 (17.9%) | 6 (3.0%) |
| $150,000 or more | 23 (9.6%) | 7 (3.5%) |
| Total | 240 (100.0%) | 199 (100.0%) |
Monthly Housing Cost Tiers in Marshallville
| Monthly Cost | Owner-occupied | Renter-occupied |
| Less than $300 | 46 (19.2%) | 10 (5.0%) |
| $300 to $499 | 51 (21.2%) | 41 (20.6%) |
| $500 to $799 | 57 (23.7%) | 33 (16.6%) |
| $800 to $999 | 27 (11.3%) | 6 (3.0%) |
| $1,000 to $1,499 | 12 (5.0%) | 7 (3.5%) |
| $1,500 to $1,999 | 22 (9.2%) | 0 (0.0%) |
| $2,000 to $2,499 | 14 (5.8%) | 0 (0.0%) |
| $2,500 to $2,999 | 0 (0.0%) | 0 (0.0%) |
| $3,000 or more | 11 (4.6%) | 0 (0.0%) |
| Total | 240 (100.0%) | 199 (100.0%) |
Physical Housing Characteristics in Marshallville
Housing Structures in Marshallville
| Structure Type | # Housing Units | % Housing Units |
| Single Unit, Detached | 371 | 84.5% |
| Single Unit, Attached | 3 | 0.7% |
| 2 Unit Apartments | 19 | 4.3% |
| 3 or 4 Unit Apartments | 3 | 0.7% |
| 5 to 9 Unit Apartments | 6 | 1.4% |
| 10 or more Apartments | 28 | 6.4% |
| Mobile Home / Other | 9 | 2.1% |
| Total | 439 | 100.0% |
Housing Structures by Occupancy in Marshallville
| Structure Type | Owner-occupied | Renter-occupied |
| Single Unit, Detached | 230 (62.0%) | 141 (38.0%) |
| Single Unit, Attached | 0 (0.0%) | 3 (100.0%) |
| 2 Unit Apartments | 1 (5.3%) | 18 (94.7%) |
| 3 or 4 Unit Apartments | 0 (0.0%) | 3 (100.0%) |
| 5 to 9 Unit Apartments | 0 (0.0%) | 6 (100.0%) |
| 10 or more Apartments | 0 (0.0%) | 28 (100.0%) |
| Mobile Home / Other | 9 (100.0%) | 0 (0.0%) |
| Total | 240 (54.7%) | 199 (45.3%) |
Housing Structures by Number of Rooms in Marshallville
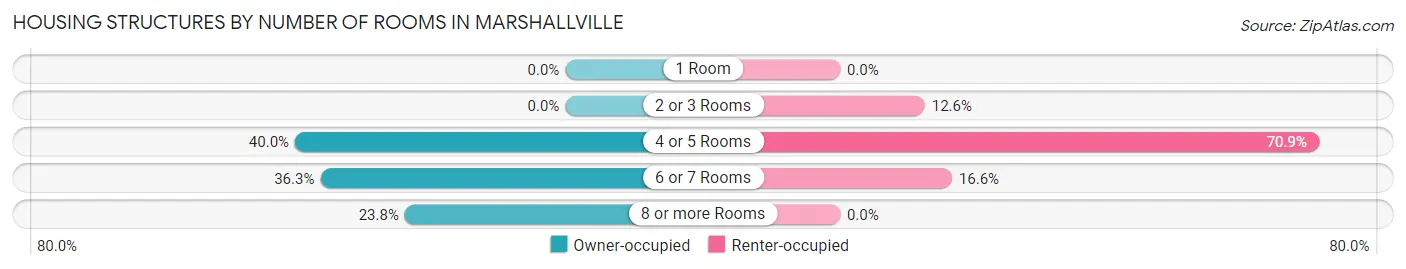
| Number of Rooms | Owner-occupied | Renter-occupied |
| 1 Room | 0 (0.0%) | 0 (0.0%) |
| 2 or 3 Rooms | 0 (0.0%) | 25 (12.6%) |
| 4 or 5 Rooms | 96 (40.0%) | 141 (70.9%) |
| 6 or 7 Rooms | 87 (36.2%) | 33 (16.6%) |
| 8 or more Rooms | 57 (23.7%) | 0 (0.0%) |
| Total | 240 (100.0%) | 199 (100.0%) |
Housing Structure by Heating Type in Marshallville
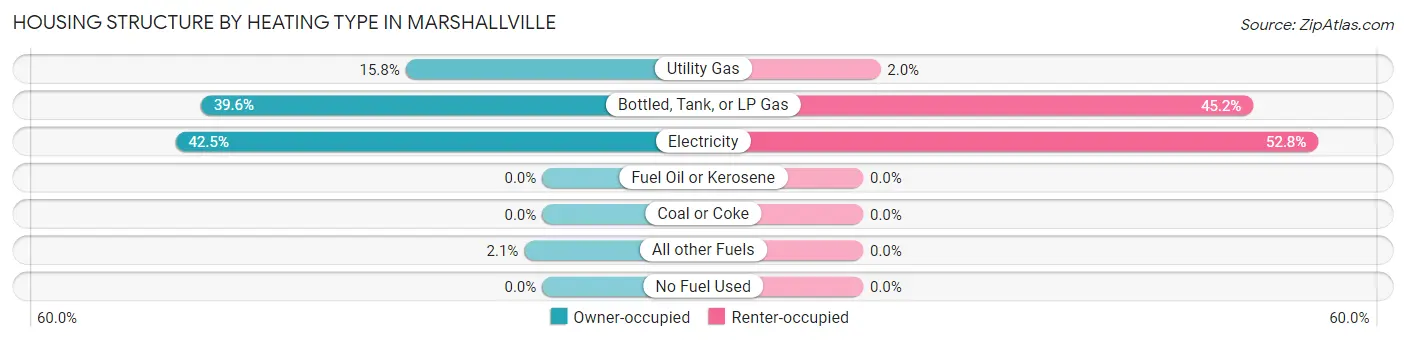
| Heating Type | Owner-occupied | Renter-occupied |
| Utility Gas | 38 (15.8%) | 4 (2.0%) |
| Bottled, Tank, or LP Gas | 95 (39.6%) | 90 (45.2%) |
| Electricity | 102 (42.5%) | 105 (52.8%) |
| Fuel Oil or Kerosene | 0 (0.0%) | 0 (0.0%) |
| Coal or Coke | 0 (0.0%) | 0 (0.0%) |
| All other Fuels | 5 (2.1%) | 0 (0.0%) |
| No Fuel Used | 0 (0.0%) | 0 (0.0%) |
| Total | 240 (100.0%) | 199 (100.0%) |
Household Vehicle Usage in Marshallville
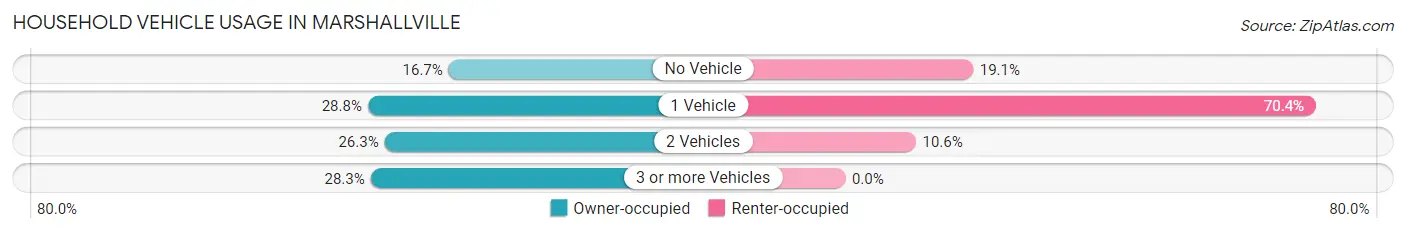
| Vehicles per Household | Owner-occupied | Renter-occupied |
| No Vehicle | 40 (16.7%) | 38 (19.1%) |
| 1 Vehicle | 69 (28.7%) | 140 (70.4%) |
| 2 Vehicles | 63 (26.3%) | 21 (10.5%) |
| 3 or more Vehicles | 68 (28.3%) | 0 (0.0%) |
| Total | 240 (100.0%) | 199 (100.0%) |
Real Estate & Mortgages in Marshallville
Real Estate and Mortgage Overview in Marshallville
| Characteristic | Without Mortgage | With Mortgage |
| Housing Units | 160 | 80 |
| Median Property Value | $57,200 | $135,000 |
| Median Household Income | $23,864 | $5 |
| Monthly Housing Costs | $380 | $0 |
| Real Estate Taxes | $644 | $0 |
Property Value by Mortgage Status in Marshallville
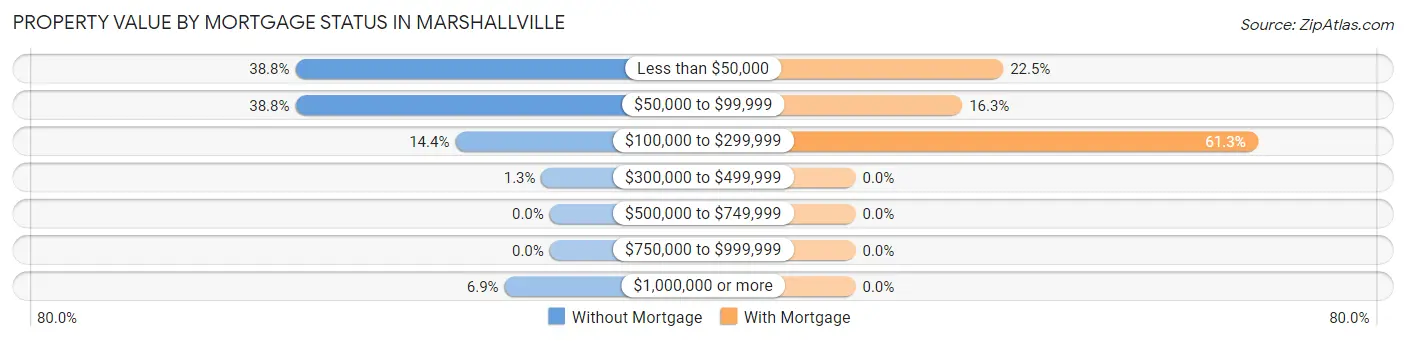
| Property Value | Without Mortgage | With Mortgage |
| Less than $50,000 | 62 (38.8%) | 18 (22.5%) |
| $50,000 to $99,999 | 62 (38.8%) | 13 (16.3%) |
| $100,000 to $299,999 | 23 (14.4%) | 49 (61.3%) |
| $300,000 to $499,999 | 2 (1.3%) | 0 (0.0%) |
| $500,000 to $749,999 | 0 (0.0%) | 0 (0.0%) |
| $750,000 to $999,999 | 0 (0.0%) | 0 (0.0%) |
| $1,000,000 or more | 11 (6.9%) | 0 (0.0%) |
| Total | 160 (100.0%) | 80 (100.0%) |
Household Income by Mortgage Status in Marshallville
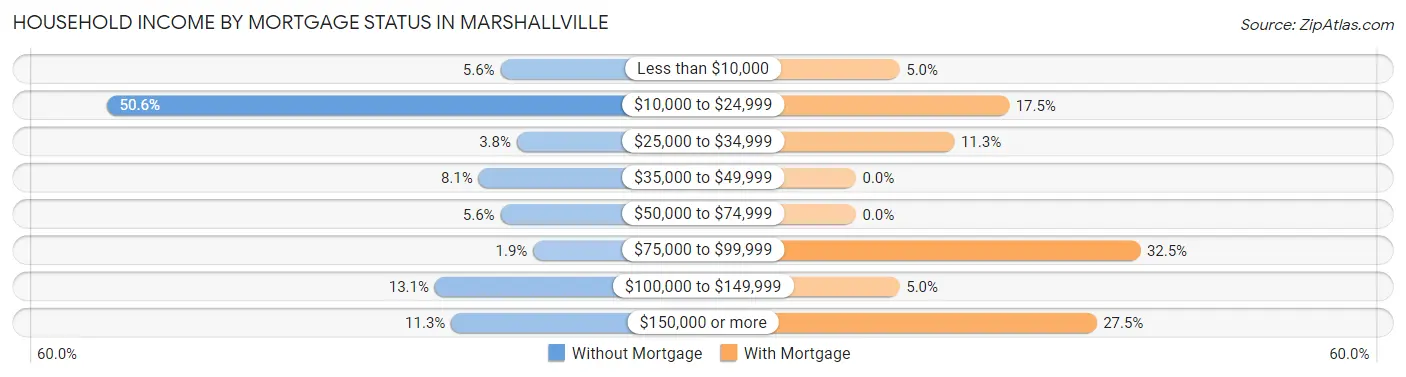
| Household Income | Without Mortgage | With Mortgage |
| Less than $10,000 | 9 (5.6%) | 4 (5.0%) |
| $10,000 to $24,999 | 81 (50.6%) | 14 (17.5%) |
| $25,000 to $34,999 | 6 (3.7%) | 9 (11.3%) |
| $35,000 to $49,999 | 13 (8.1%) | 0 (0.0%) |
| $50,000 to $74,999 | 9 (5.6%) | 0 (0.0%) |
| $75,000 to $99,999 | 3 (1.9%) | 26 (32.5%) |
| $100,000 to $149,999 | 21 (13.1%) | 4 (5.0%) |
| $150,000 or more | 18 (11.3%) | 22 (27.5%) |
| Total | 160 (100.0%) | 80 (100.0%) |
Property Value to Household Income Ratio in Marshallville
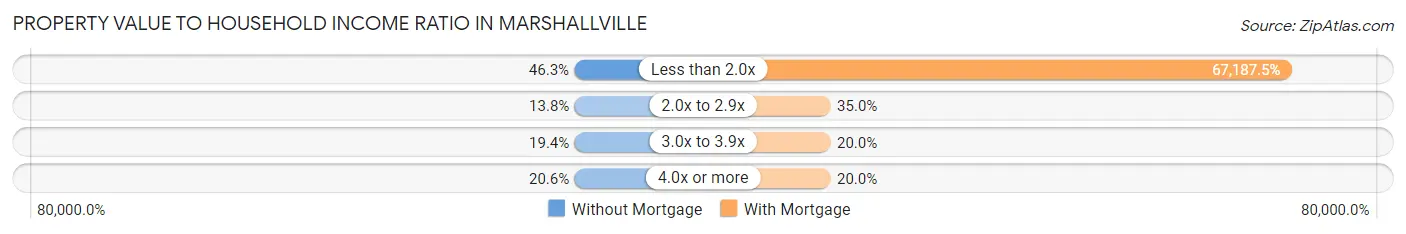
| Value-to-Income Ratio | Without Mortgage | With Mortgage |
| Less than 2.0x | 74 (46.3%) | 53,750 (67,187.5%) |
| 2.0x to 2.9x | 22 (13.8%) | 28 (35.0%) |
| 3.0x to 3.9x | 31 (19.4%) | 16 (20.0%) |
| 4.0x or more | 33 (20.6%) | 16 (20.0%) |
| Total | 160 (100.0%) | 80 (100.0%) |
Real Estate Taxes by Mortgage Status in Marshallville
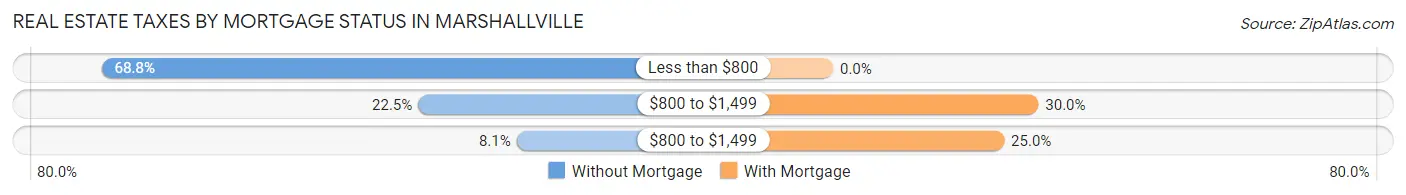
| Property Taxes | Without Mortgage | With Mortgage |
| Less than $800 | 110 (68.8%) | 0 (0.0%) |
| $800 to $1,499 | 36 (22.5%) | 24 (30.0%) |
| $800 to $1,499 | 13 (8.1%) | 20 (25.0%) |
| Total | 160 (100.0%) | 80 (100.0%) |
Health & Disability in Marshallville
Health Insurance Coverage by Age in Marshallville
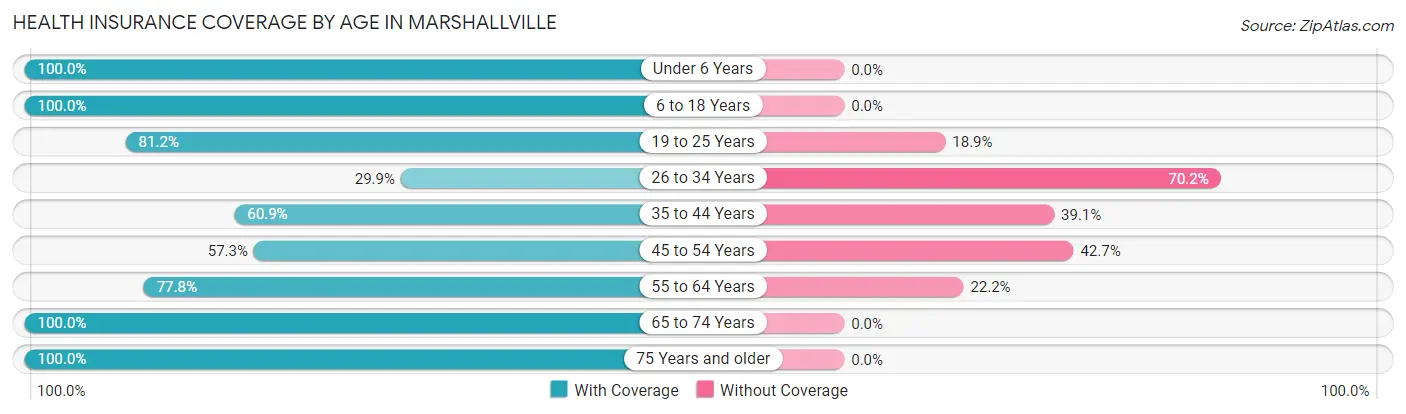
| Age Bracket | With Coverage | Without Coverage |
| Under 6 Years | 93 (100.0%) | 0 (0.0%) |
| 6 to 18 Years | 137 (100.0%) | 0 (0.0%) |
| 19 to 25 Years | 99 (81.1%) | 23 (18.9%) |
| 26 to 34 Years | 20 (29.8%) | 47 (70.2%) |
| 35 to 44 Years | 42 (60.9%) | 27 (39.1%) |
| 45 to 54 Years | 67 (57.3%) | 50 (42.7%) |
| 55 to 64 Years | 105 (77.8%) | 30 (22.2%) |
| 65 to 74 Years | 160 (100.0%) | 0 (0.0%) |
| 75 Years and older | 108 (100.0%) | 0 (0.0%) |
| Total | 831 (82.4%) | 177 (17.6%) |
Health Insurance Coverage by Citizenship Status in Marshallville
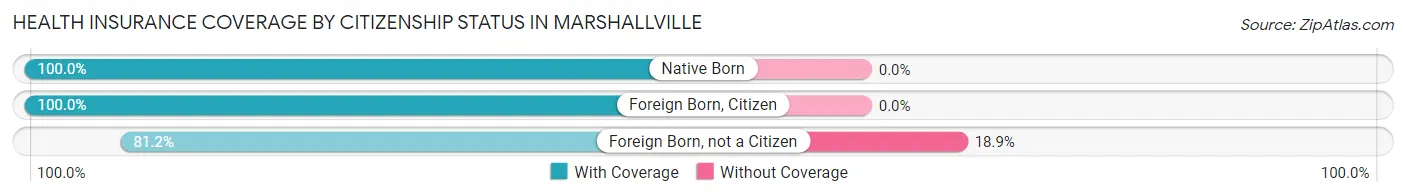
| Citizenship Status | With Coverage | Without Coverage |
| Native Born | 93 (100.0%) | 0 (0.0%) |
| Foreign Born, Citizen | 137 (100.0%) | 0 (0.0%) |
| Foreign Born, not a Citizen | 99 (81.1%) | 23 (18.9%) |
Health Insurance Coverage by Household Income in Marshallville
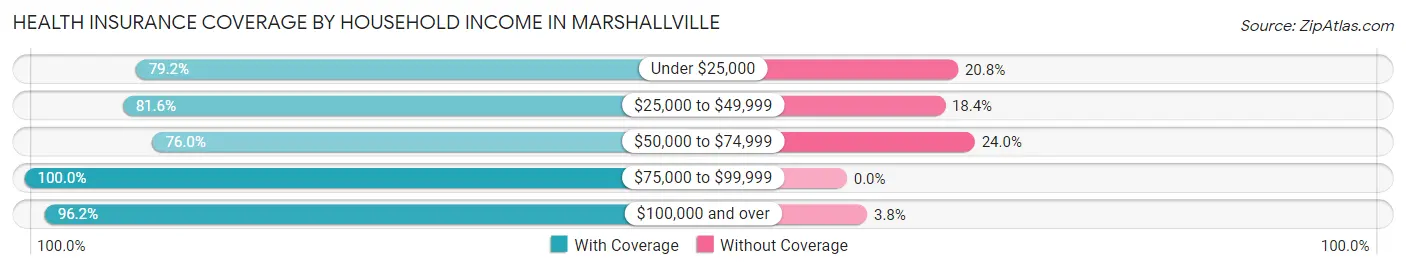
| Household Income | With Coverage | Without Coverage |
| Under $25,000 | 361 (79.2%) | 95 (20.8%) |
| $25,000 to $49,999 | 71 (81.6%) | 16 (18.4%) |
| $50,000 to $74,999 | 184 (76.0%) | 58 (24.0%) |
| $75,000 to $99,999 | 12 (100.0%) | 0 (0.0%) |
| $100,000 and over | 203 (96.2%) | 8 (3.8%) |
Public vs Private Health Insurance Coverage by Age in Marshallville
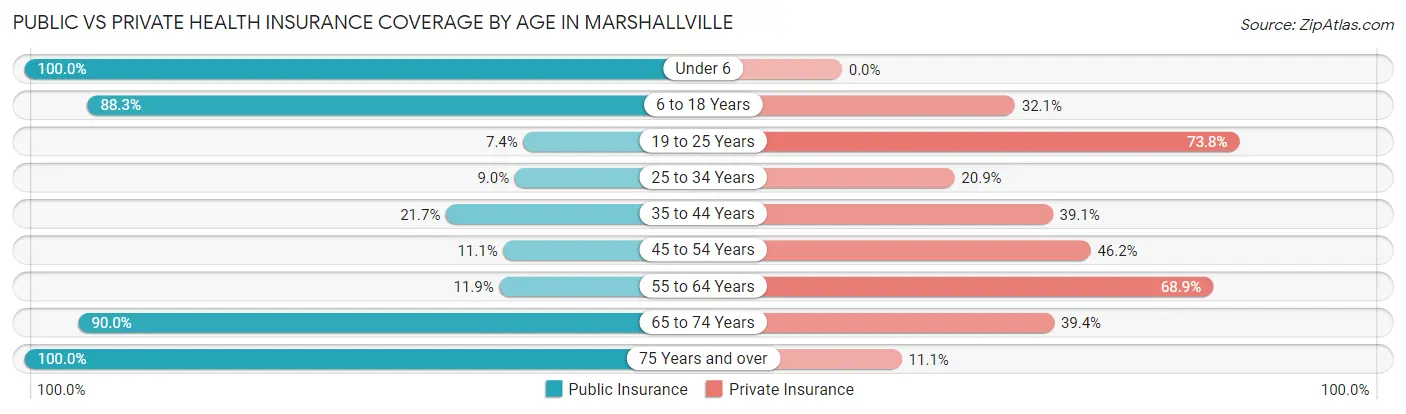
| Age Bracket | Public Insurance | Private Insurance |
| Under 6 | 93 (100.0%) | 0 (0.0%) |
| 6 to 18 Years | 121 (88.3%) | 44 (32.1%) |
| 19 to 25 Years | 9 (7.4%) | 90 (73.8%) |
| 25 to 34 Years | 6 (9.0%) | 14 (20.9%) |
| 35 to 44 Years | 15 (21.7%) | 27 (39.1%) |
| 45 to 54 Years | 13 (11.1%) | 54 (46.2%) |
| 55 to 64 Years | 16 (11.8%) | 93 (68.9%) |
| 65 to 74 Years | 144 (90.0%) | 63 (39.4%) |
| 75 Years and over | 108 (100.0%) | 12 (11.1%) |
| Total | 525 (52.1%) | 397 (39.4%) |
Disability Status by Sex by Age in Marshallville
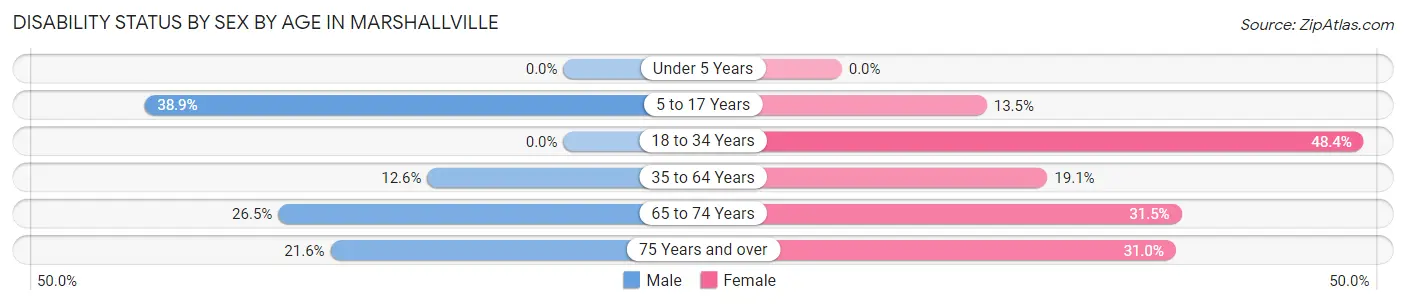
| Age Bracket | Male | Female |
| Under 5 Years | 0 (0.0%) | 0 (0.0%) |
| 5 to 17 Years | 21 (38.9%) | 7 (13.5%) |
| 18 to 34 Years | 0 (0.0%) | 77 (48.4%) |
| 35 to 64 Years | 24 (12.6%) | 25 (19.1%) |
| 65 to 74 Years | 18 (26.5%) | 29 (31.5%) |
| 75 Years and over | 8 (21.6%) | 22 (31.0%) |
Disability Class by Sex by Age in Marshallville
Disability Class: Hearing Difficulty
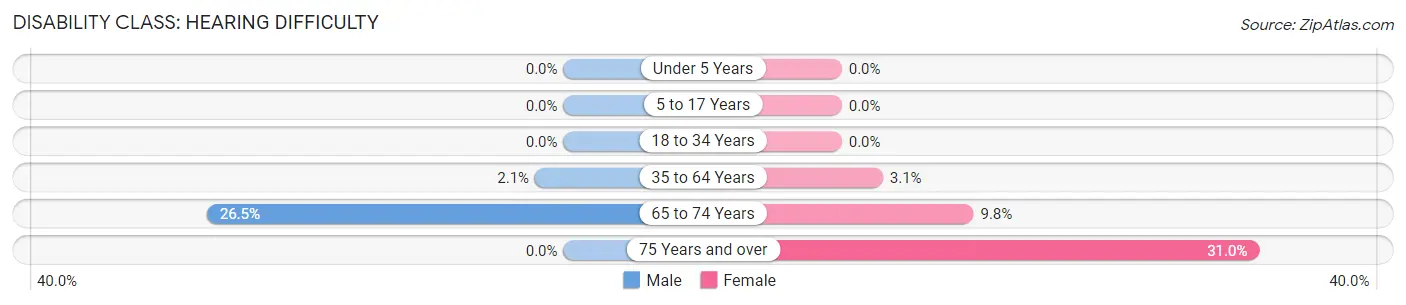
| Age Bracket | Male | Female |
| Under 5 Years | 0 (0.0%) | 0 (0.0%) |
| 5 to 17 Years | 0 (0.0%) | 0 (0.0%) |
| 18 to 34 Years | 0 (0.0%) | 0 (0.0%) |
| 35 to 64 Years | 4 (2.1%) | 4 (3.0%) |
| 65 to 74 Years | 18 (26.5%) | 9 (9.8%) |
| 75 Years and over | 0 (0.0%) | 22 (31.0%) |
Disability Class: Vision Difficulty
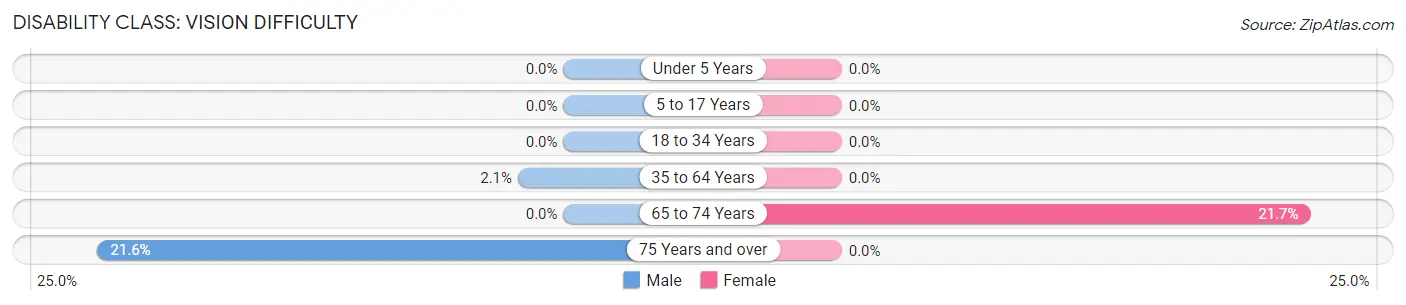
| Age Bracket | Male | Female |
| Under 5 Years | 0 (0.0%) | 0 (0.0%) |
| 5 to 17 Years | 0 (0.0%) | 0 (0.0%) |
| 18 to 34 Years | 0 (0.0%) | 0 (0.0%) |
| 35 to 64 Years | 4 (2.1%) | 0 (0.0%) |
| 65 to 74 Years | 0 (0.0%) | 20 (21.7%) |
| 75 Years and over | 8 (21.6%) | 0 (0.0%) |
Disability Class: Cognitive Difficulty
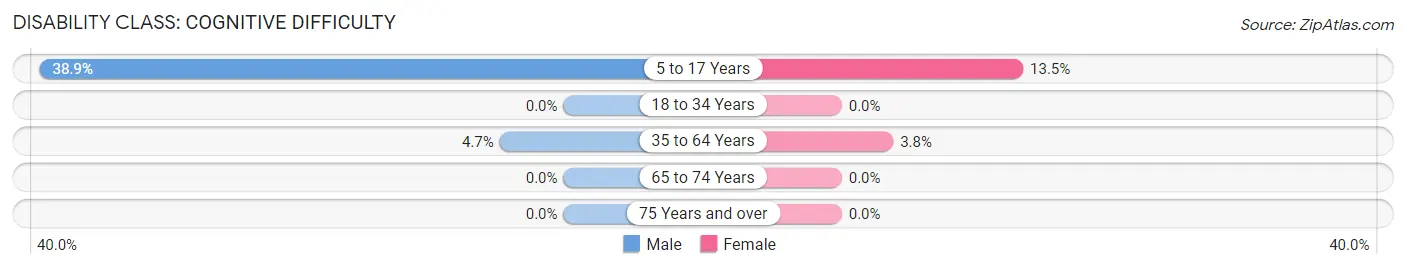
| Age Bracket | Male | Female |
| 5 to 17 Years | 21 (38.9%) | 7 (13.5%) |
| 18 to 34 Years | 0 (0.0%) | 0 (0.0%) |
| 35 to 64 Years | 9 (4.7%) | 5 (3.8%) |
| 65 to 74 Years | 0 (0.0%) | 0 (0.0%) |
| 75 Years and over | 0 (0.0%) | 0 (0.0%) |
Disability Class: Ambulatory Difficulty
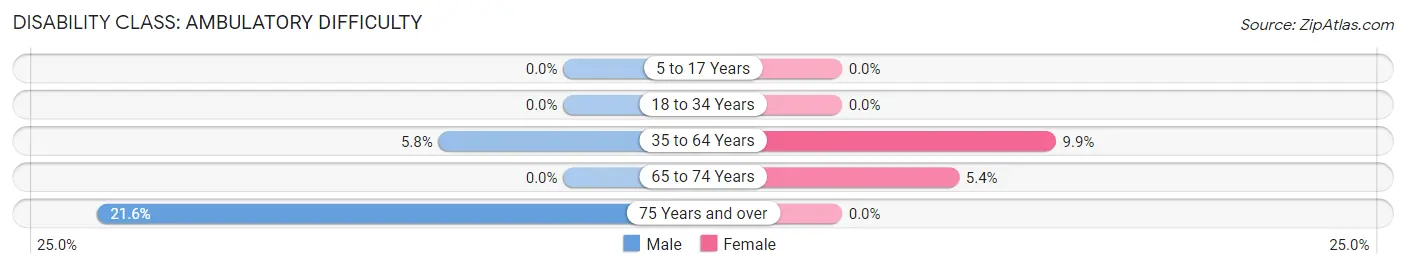
| Age Bracket | Male | Female |
| 5 to 17 Years | 0 (0.0%) | 0 (0.0%) |
| 18 to 34 Years | 0 (0.0%) | 0 (0.0%) |
| 35 to 64 Years | 11 (5.8%) | 13 (9.9%) |
| 65 to 74 Years | 0 (0.0%) | 5 (5.4%) |
| 75 Years and over | 8 (21.6%) | 0 (0.0%) |
Disability Class: Self-Care Difficulty
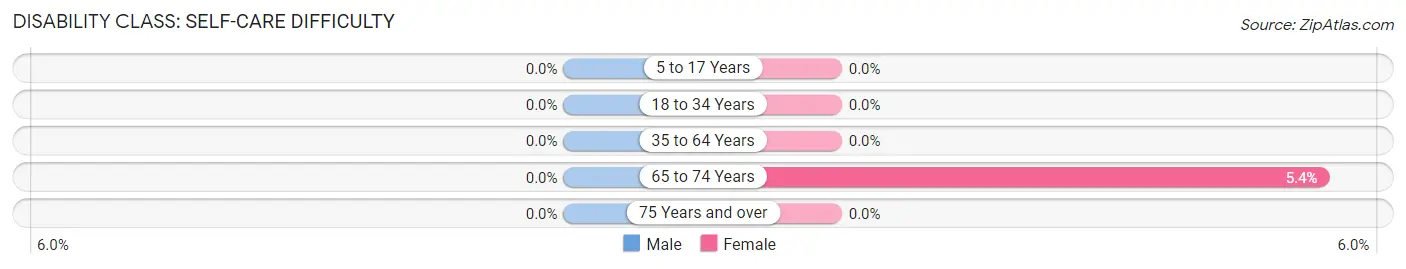
| Age Bracket | Male | Female |
| 5 to 17 Years | 0 (0.0%) | 0 (0.0%) |
| 18 to 34 Years | 0 (0.0%) | 0 (0.0%) |
| 35 to 64 Years | 0 (0.0%) | 0 (0.0%) |
| 65 to 74 Years | 0 (0.0%) | 5 (5.4%) |
| 75 Years and over | 0 (0.0%) | 0 (0.0%) |
Technology Access in Marshallville
Computing Device Access in Marshallville
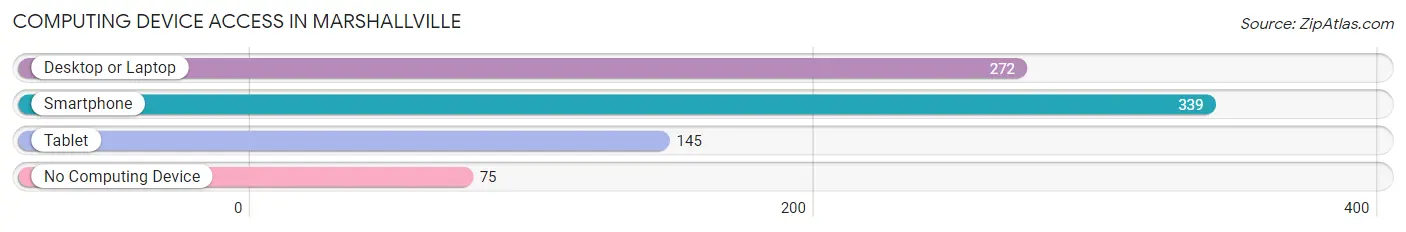
| Device Type | # Households | % Households |
| Desktop or Laptop | 272 | 62.0% |
| Smartphone | 339 | 77.2% |
| Tablet | 145 | 33.0% |
| No Computing Device | 75 | 17.1% |
| Total | 439 | 100.0% |
Internet Access in Marshallville
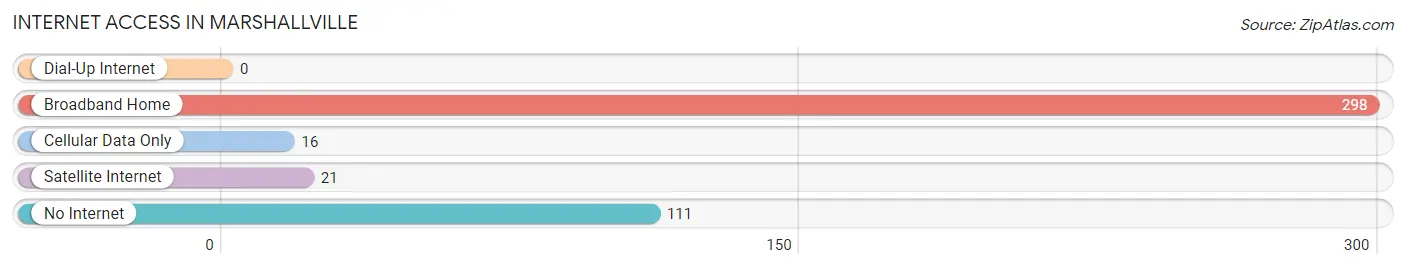
| Internet Type | # Households | % Households |
| Dial-Up Internet | 0 | 0.0% |
| Broadband Home | 298 | 67.9% |
| Cellular Data Only | 16 | 3.6% |
| Satellite Internet | 21 | 4.8% |
| No Internet | 111 | 25.3% |
| Total | 439 | 100.0% |
Marshallville Summary
Marshallville, Georgia is a small town located in the central part of the state, about an hour south of Macon. It is part of the Macon metropolitan area and is the county seat of Monroe County. The town has a population of 1,845 people, according to the 2010 census.
History
Marshallville was founded in 1820 by a group of settlers from North Carolina. The town was named after General William Marshall, a Revolutionary War hero. The town was incorporated in 1832 and quickly became a center of commerce and industry. The town was home to several cotton mills, a grist mill, and a sawmill. The town also had a railroad station, which connected it to other parts of the state.
In the late 19th century, Marshallville was a thriving agricultural center. The town was home to several large farms, which produced cotton, corn, and other crops. The town also had several stores, a bank, and a post office.
In the early 20th century, Marshallville began to decline. The cotton mills closed and the railroad station was abandoned. The town’s population began to decline as well. In the 1950s, the town was revitalized with the construction of a new highway, which connected it to Macon and other parts of the state.
Geography
Marshallville is located in the central part of Georgia, about an hour south of Macon. The town is situated in the Piedmont region of the state, which is characterized by rolling hills and forests. The town is located on the banks of the Ocmulgee River, which flows through the town.
The town has a total area of 2.2 square miles, all of which is land. The town has a humid subtropical climate, with hot, humid summers and mild winters.
Economy
Marshallville’s economy is largely based on agriculture. The town is home to several large farms, which produce cotton, corn, and other crops. The town also has several stores, a bank, and a post office.
The town is also home to several small businesses, including a furniture store, a hardware store, and a restaurant. The town is also home to a small manufacturing plant, which produces plastic products.
Demographics
According to the 2010 census, Marshallville has a population of 1,845 people. The town has a median household income of $30,000 and a median home value of $90,000. The town is predominantly white, with African Americans making up about 20% of the population. The town also has a small Hispanic population.
Conclusion
Marshallville, Georgia is a small town located in the central part of the state. The town was founded in 1820 and was once a thriving agricultural center. Today, the town’s economy is largely based on agriculture, with several large farms producing cotton, corn, and other crops. The town also has several small businesses, including a furniture store, a hardware store, and a restaurant. The town has a population of 1,845 people, with a median household income of $30,000 and a median home value of $90,000.
Common Questions
What is Per Capita Income in Marshallville?
Per Capita income in Marshallville is $49,276.
What is the Median Family Income in Marshallville?
Median Family Income in Marshallville is $50,156.
What is the Median Household income in Marshallville?
Median Household Income in Marshallville is $18,839.
What is Inequality or Gini Index in Marshallville?
Inequality or Gini Index in Marshallville is 0.80.
What is the Total Population of Marshallville?
Total Population of Marshallville is 1,014.
What is the Total Male Population of Marshallville?
Total Male Population of Marshallville is 438.
What is the Total Female Population of Marshallville?
Total Female Population of Marshallville is 576.
What is the Ratio of Males per 100 Females in Marshallville?
There are 76.04 Males per 100 Females in Marshallville.
What is the Ratio of Females per 100 Males in Marshallville?
There are 131.51 Females per 100 Males in Marshallville.
What is the Median Population Age in Marshallville?
Median Population Age in Marshallville is 47.2 Years.
What is the Average Family Size in Marshallville
Average Family Size in Marshallville is 3.3 People.
What is the Average Household Size in Marshallville
Average Household Size in Marshallville is 2.3 People.
How Large is the Labor Force in Marshallville?
There are 452 People in the Labor Forcein in Marshallville.
What is the Percentage of People in the Labor Force in Marshallville?
52.4% of People are in the Labor Force in Marshallville.
What is the Unemployment Rate in Marshallville?
Unemployment Rate in Marshallville is 13.0%.