Milledgeville, GA Map & Demographics
Milledgeville Map
Milledgeville Overview
$29,561
PER CAPITA INCOME
$63,511
AVG FAMILY INCOME
$40,672
AVG HOUSEHOLD INCOME
49.9%
WAGE / INCOME GAP [ % ]
50.1¢/ $1
WAGE / INCOME GAP [ $ ]
$12,828
FAMILY INCOME DEFICIT
0.68
INEQUALITY / GINI INDEX
17,021
TOTAL POPULATION
9,105
MALE POPULATION
7,916
FEMALE POPULATION
115.02
MALES / 100 FEMALES
86.94
FEMALES / 100 MALES
26.5
MEDIAN AGE
3.2
AVG FAMILY SIZE
2.4
AVG HOUSEHOLD SIZE
6,620
LABOR FORCE [ PEOPLE ]
43.6%
PERCENT IN LABOR FORCE
7.2%
UNEMPLOYMENT RATE
Milledgeville Area Codes
Income in Milledgeville
Income Overview in Milledgeville
Per Capita Income in Milledgeville is $29,561, while median incomes of families and households are $63,511 and $40,672 respectively.
| Characteristic | Number | Measure |
| Per Capita Income | 17,021 | $29,561 |
| Median Family Income | 2,417 | $63,511 |
| Mean Family Income | 2,417 | $142,943 |
| Median Household Income | 5,086 | $40,672 |
| Mean Household Income | 5,086 | $89,830 |
| Income Deficit | 2,417 | $12,828 |
| Wage / Income Gap (%) | 17,021 | 49.90% |
| Wage / Income Gap ($) | 17,021 | 50.10¢ per $1 |
| Gini / Inequality Index | 17,021 | 0.68 |
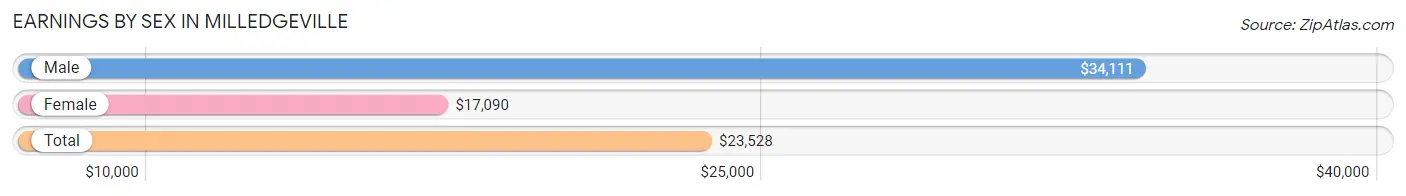
Earnings by Sex in Milledgeville
Average Earnings in Milledgeville are $23,528, $34,111 for men and $17,090 for women, a difference of 49.9%.
| Sex | Number | Average Earnings |
| Male | 3,586 (46.8%) | $34,111 |
| Female | 4,085 (53.2%) | $17,090 |
| Total | 7,671 (100.0%) | $23,528 |
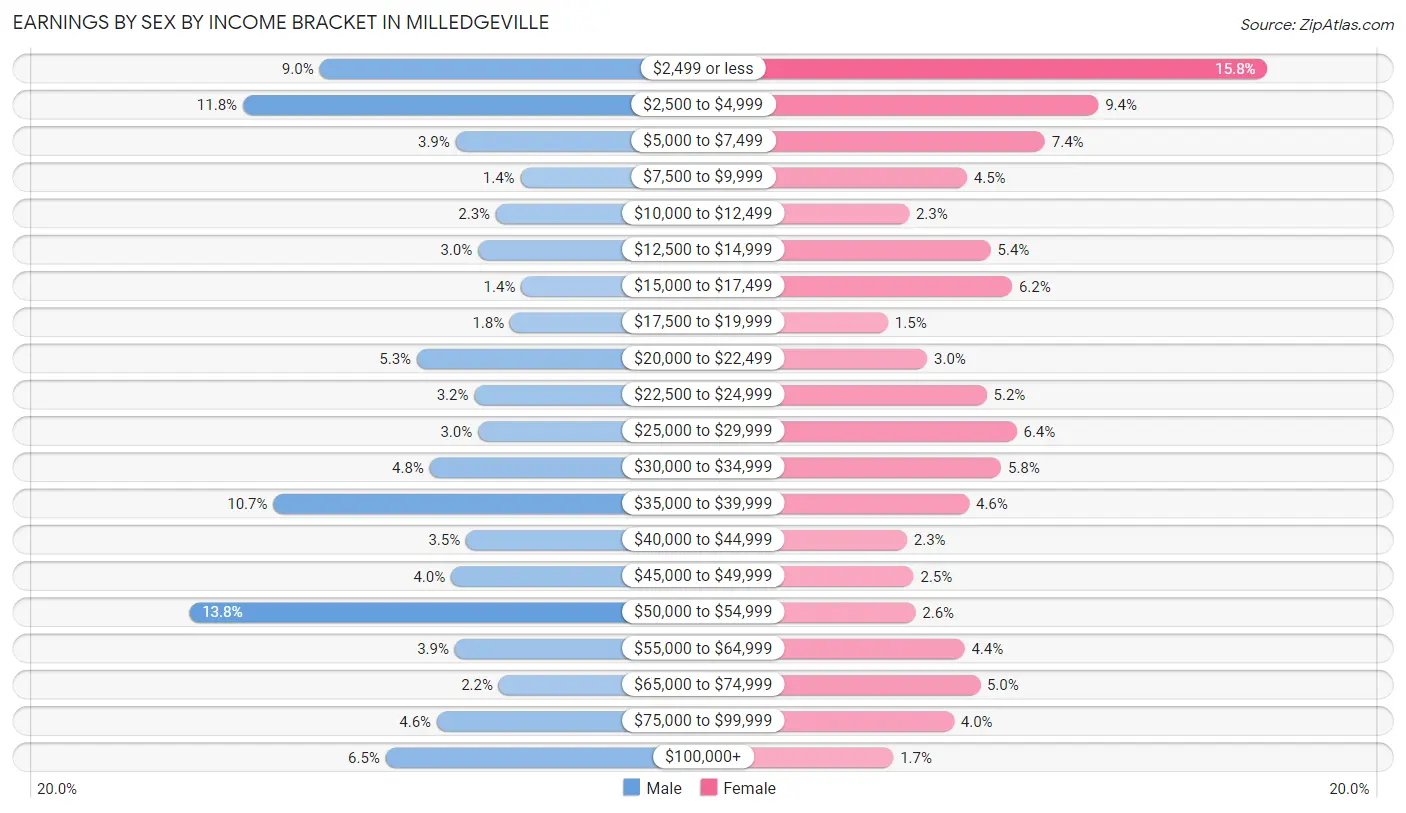
Earnings by Sex by Income Bracket in Milledgeville
The most common earnings brackets in Milledgeville are $50,000 to $54,999 for men (496 | 13.8%) and $2,499 or less for women (644 | 15.8%).
| Income | Male | Female |
| $2,499 or less | 321 (8.9%) | 644 (15.8%) |
| $2,500 to $4,999 | 424 (11.8%) | 385 (9.4%) |
| $5,000 to $7,499 | 138 (3.8%) | 303 (7.4%) |
| $7,500 to $9,999 | 51 (1.4%) | 184 (4.5%) |
| $10,000 to $12,499 | 84 (2.3%) | 95 (2.3%) |
| $12,500 to $14,999 | 108 (3.0%) | 220 (5.4%) |
| $15,000 to $17,499 | 50 (1.4%) | 253 (6.2%) |
| $17,500 to $19,999 | 65 (1.8%) | 63 (1.5%) |
| $20,000 to $22,499 | 190 (5.3%) | 123 (3.0%) |
| $22,500 to $24,999 | 113 (3.2%) | 214 (5.2%) |
| $25,000 to $29,999 | 108 (3.0%) | 260 (6.4%) |
| $30,000 to $34,999 | 173 (4.8%) | 236 (5.8%) |
| $35,000 to $39,999 | 383 (10.7%) | 187 (4.6%) |
| $40,000 to $44,999 | 124 (3.5%) | 92 (2.2%) |
| $45,000 to $49,999 | 144 (4.0%) | 102 (2.5%) |
| $50,000 to $54,999 | 496 (13.8%) | 105 (2.6%) |
| $55,000 to $64,999 | 139 (3.9%) | 180 (4.4%) |
| $65,000 to $74,999 | 80 (2.2%) | 204 (5.0%) |
| $75,000 to $99,999 | 163 (4.5%) | 164 (4.0%) |
| $100,000+ | 232 (6.5%) | 71 (1.7%) |
| Total | 3,586 (100.0%) | 4,085 (100.0%) |
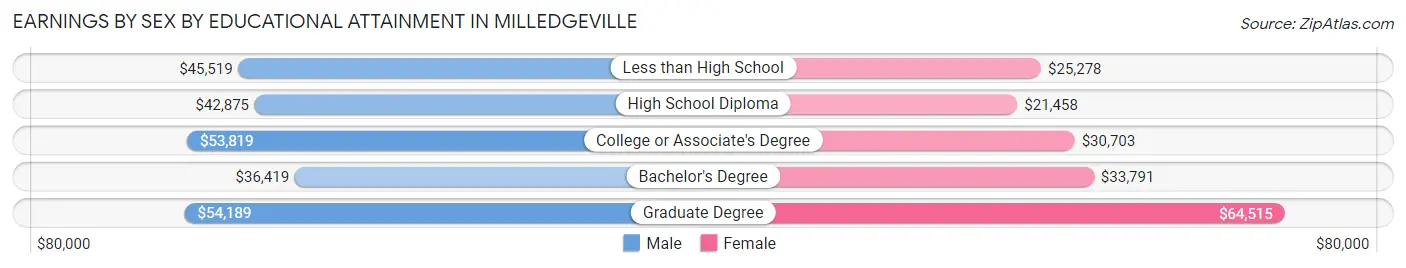
Earnings by Sex by Educational Attainment in Milledgeville
Average earnings in Milledgeville are $49,583 for men and $34,498 for women, a difference of 30.4%. Men with an educational attainment of graduate degree enjoy the highest average annual earnings of $54,189, while those with bachelor's degree education earn the least with $36,419. Women with an educational attainment of graduate degree earn the most with the average annual earnings of $64,515, while those with high school diploma education have the smallest earnings of $21,458.
| Educational Attainment | Male Income | Female Income |
| Less than High School | $45,519 | $25,278 |
| High School Diploma | $42,875 | $21,458 |
| College or Associate's Degree | $53,819 | $30,703 |
| Bachelor's Degree | $36,419 | $33,791 |
| Graduate Degree | $54,189 | $64,515 |
| Total | $49,583 | $34,498 |
Family Income in Milledgeville
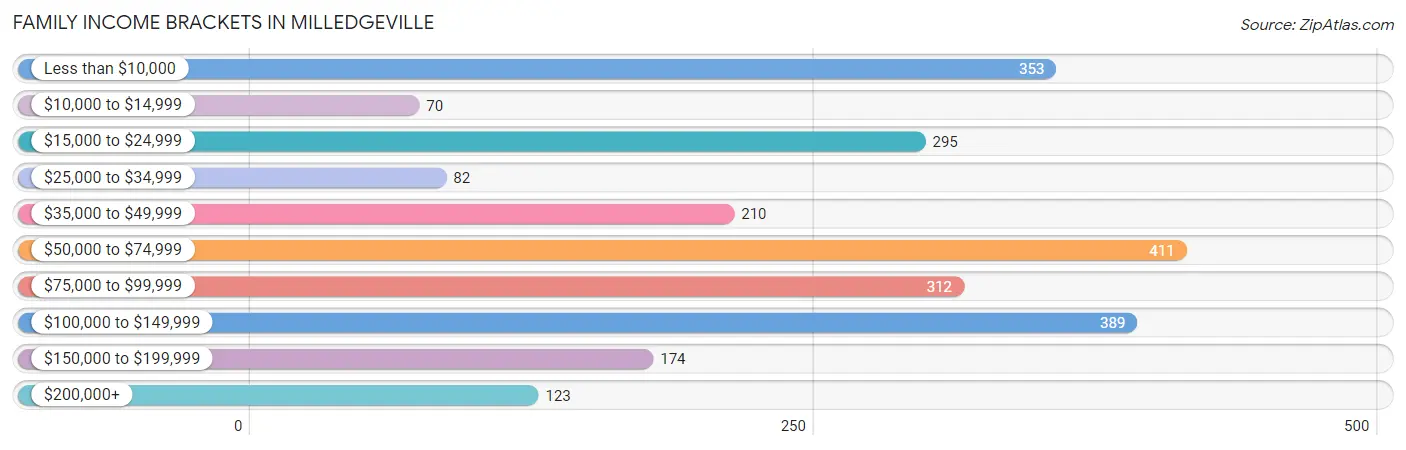
Family Income Brackets in Milledgeville
According to the Milledgeville family income data, there are 411 families falling into the $50,000 to $74,999 income range, which is the most common income bracket and makes up 17.0% of all families. Conversely, the $10,000 to $14,999 income bracket is the least frequent group with only 70 families (2.9%) belonging to this category.
| Income Bracket | # Families | % Families |
| Less than $10,000 | 353 | 14.6% |
| $10,000 to $14,999 | 70 | 2.9% |
| $15,000 to $24,999 | 295 | 12.2% |
| $25,000 to $34,999 | 82 | 3.4% |
| $35,000 to $49,999 | 210 | 8.7% |
| $50,000 to $74,999 | 411 | 17.0% |
| $75,000 to $99,999 | 312 | 12.9% |
| $100,000 to $149,999 | 389 | 16.1% |
| $150,000 to $199,999 | 174 | 7.2% |
| $200,000+ | 123 | 5.1% |
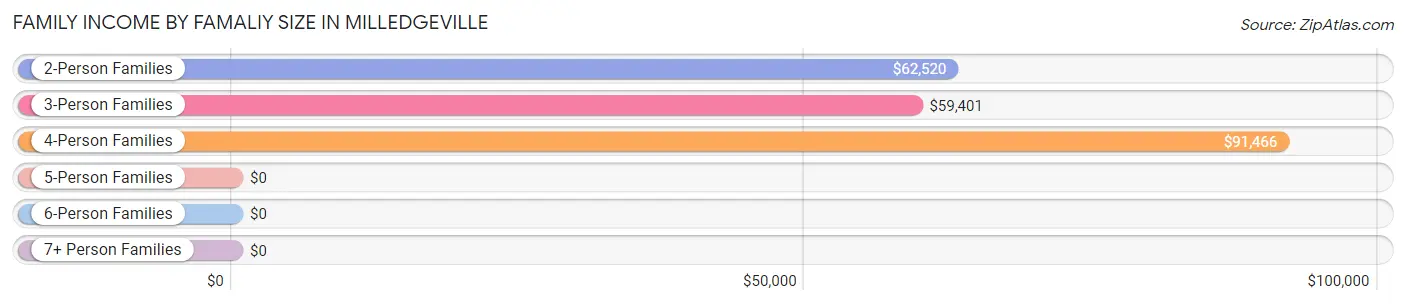
Family Income by Famaliy Size in Milledgeville
4-person families (411 | 17.0%) account for the highest median family income in Milledgeville with $91,466 per family, while 2-person families (1,233 | 51.0%) have the highest median income of $31,260 per family member.
| Income Bracket | # Families | Median Income |
| 2-Person Families | 1,233 (51.0%) | $62,520 |
| 3-Person Families | 442 (18.3%) | $59,401 |
| 4-Person Families | 411 (17.0%) | $91,466 |
| 5-Person Families | 291 (12.0%) | $0 |
| 6-Person Families | 23 (0.9%) | $0 |
| 7+ Person Families | 17 (0.7%) | $0 |
| Total | 2,417 (100.0%) | $63,511 |
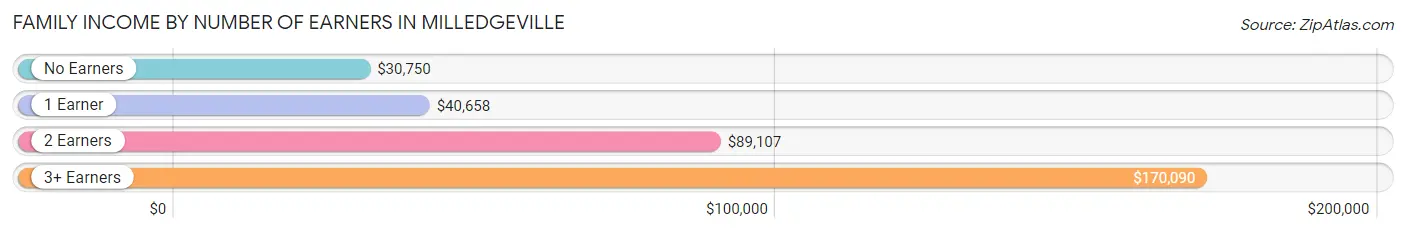
Family Income by Number of Earners in Milledgeville
The median family income in Milledgeville is $63,511, with families comprising 3+ earners (202) having the highest median family income of $170,090, while families with no earners (489) have the lowest median family income of $30,750, accounting for 8.4% and 20.2% of families, respectively.
| Number of Earners | # Families | Median Income |
| No Earners | 489 (20.2%) | $30,750 |
| 1 Earner | 984 (40.7%) | $40,658 |
| 2 Earners | 742 (30.7%) | $89,107 |
| 3+ Earners | 202 (8.4%) | $170,090 |
| Total | 2,417 (100.0%) | $63,511 |
Household Income in Milledgeville
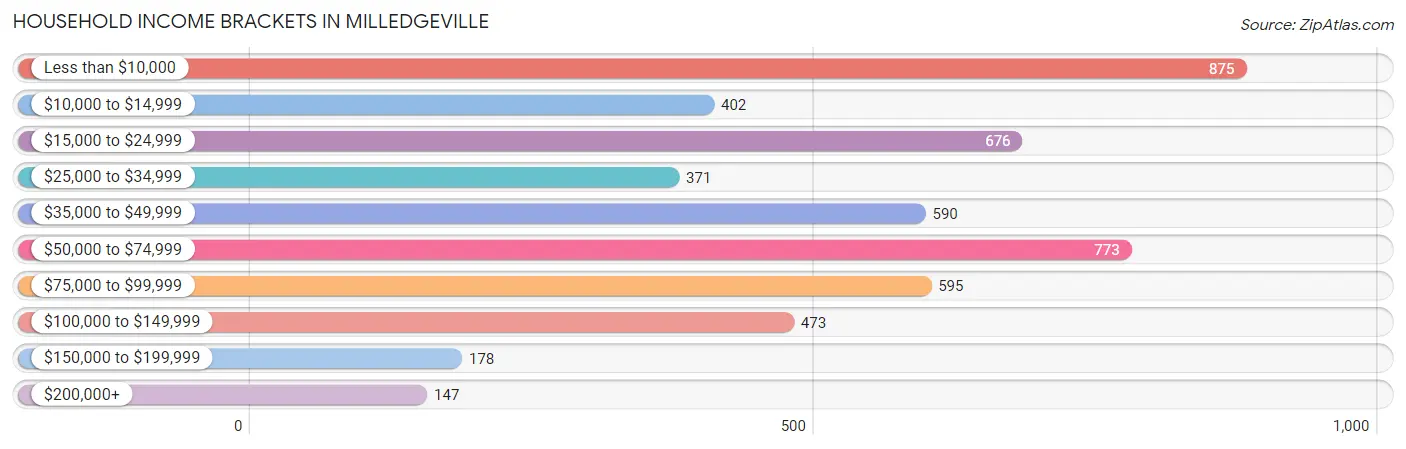
Household Income Brackets in Milledgeville
With 875 households falling in the category, the less than $10,000 income range is the most frequent in Milledgeville, accounting for 17.2% of all households. In contrast, only 147 households (2.9%) fall into the $200,000+ income bracket, making it the least populous group.
| Income Bracket | # Households | % Households |
| Less than $10,000 | 875 | 17.2% |
| $10,000 to $14,999 | 402 | 7.9% |
| $15,000 to $24,999 | 676 | 13.3% |
| $25,000 to $34,999 | 371 | 7.3% |
| $35,000 to $49,999 | 590 | 11.6% |
| $50,000 to $74,999 | 773 | 15.2% |
| $75,000 to $99,999 | 595 | 11.7% |
| $100,000 to $149,999 | 473 | 9.3% |
| $150,000 to $199,999 | 178 | 3.5% |
| $200,000+ | 147 | 2.9% |
Household Income by Householder Age in Milledgeville
The median household income in Milledgeville is $40,672, with the highest median household income of $55,160 found in the 45 to 64 years age bracket for the primary householder. A total of 1,402 households (27.6%) fall into this category. Meanwhile, the 15 to 24 years age bracket for the primary householder has the lowest median household income of $10,735, with 1,052 households (20.7%) in this group.
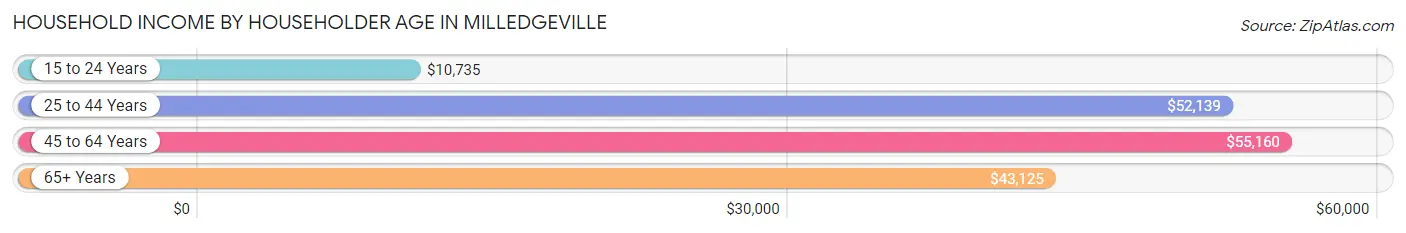
| Income Bracket | # Households | Median Income |
| 15 to 24 Years | 1,052 (20.7%) | $10,735 |
| 25 to 44 Years | 1,609 (31.6%) | $52,139 |
| 45 to 64 Years | 1,402 (27.6%) | $55,160 |
| 65+ Years | 1,023 (20.1%) | $43,125 |
| Total | 5,086 (100.0%) | $40,672 |
Poverty in Milledgeville
Income Below Poverty by Sex and Age in Milledgeville
With 37.8% poverty level for males and 42.0% for females among the residents of Milledgeville, 5 year old males and under 5 year old females are the most vulnerable to poverty, with 11 males (100.0%) and 274 females (83.5%) in their respective age groups living below the poverty level.
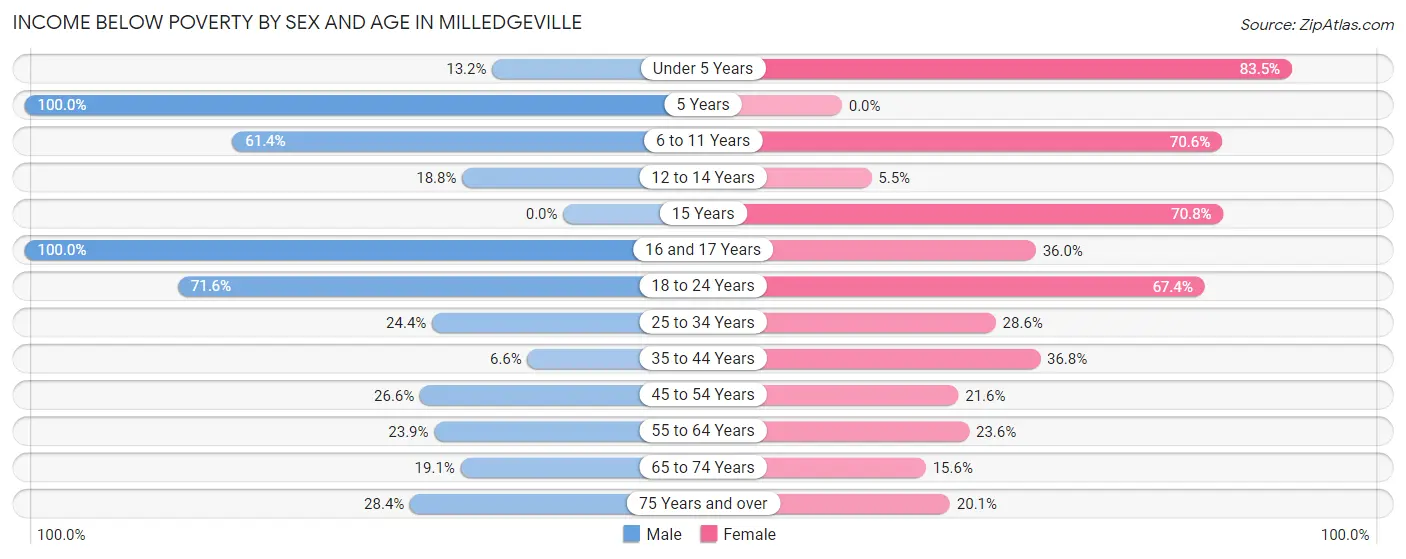
| Age Bracket | Male | Female |
| Under 5 Years | 43 (13.2%) | 274 (83.5%) |
| 5 Years | 11 (100.0%) | 0 (0.0%) |
| 6 to 11 Years | 215 (61.4%) | 211 (70.6%) |
| 12 to 14 Years | 51 (18.8%) | 8 (5.5%) |
| 15 Years | 0 (0.0%) | 17 (70.8%) |
| 16 and 17 Years | 36 (100.0%) | 104 (36.0%) |
| 18 to 24 Years | 1,207 (71.6%) | 1,164 (67.4%) |
| 25 to 34 Years | 348 (24.3%) | 273 (28.6%) |
| 35 to 44 Years | 25 (6.6%) | 259 (36.8%) |
| 45 to 54 Years | 96 (26.6%) | 101 (21.6%) |
| 55 to 64 Years | 164 (23.9%) | 188 (23.6%) |
| 65 to 74 Years | 69 (19.1%) | 69 (15.6%) |
| 75 Years and over | 93 (28.4%) | 68 (20.1%) |
| Total | 2,358 (37.8%) | 2,736 (42.0%) |
Income Above Poverty by Sex and Age in Milledgeville
According to the poverty statistics in Milledgeville, males aged 15 years and females aged 12 to 14 years are the age groups that are most secure financially, with 100.0% of males and 94.5% of females in these age groups living above the poverty line.
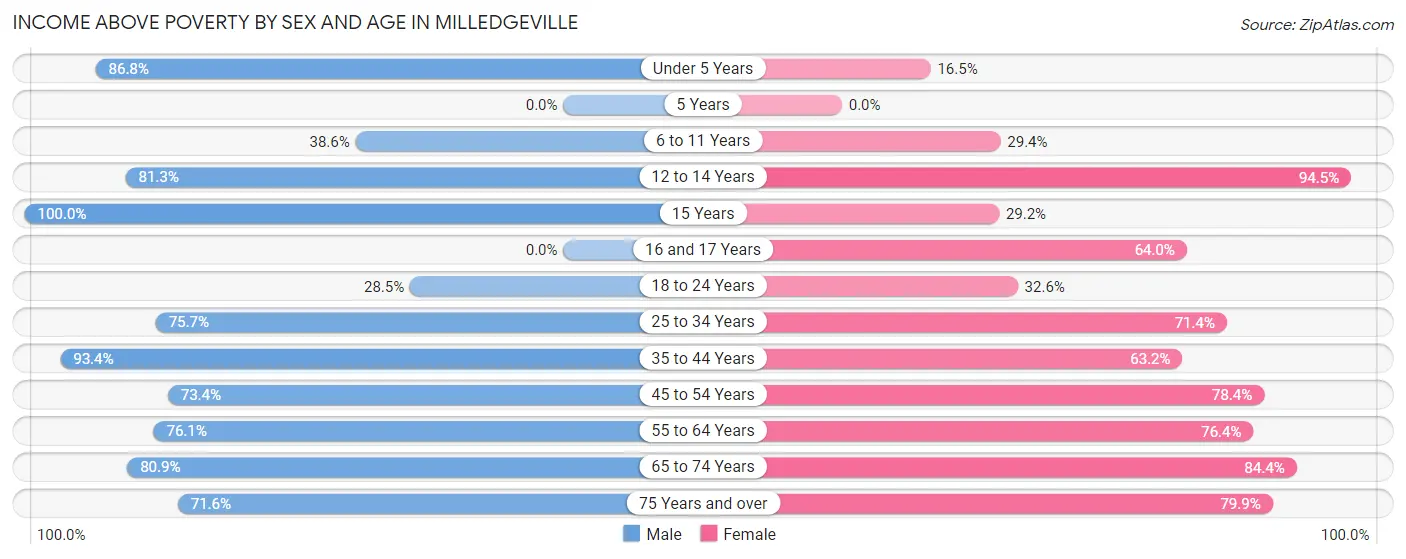
| Age Bracket | Male | Female |
| Under 5 Years | 283 (86.8%) | 54 (16.5%) |
| 5 Years | 0 (0.0%) | 0 (0.0%) |
| 6 to 11 Years | 135 (38.6%) | 88 (29.4%) |
| 12 to 14 Years | 221 (81.2%) | 138 (94.5%) |
| 15 Years | 16 (100.0%) | 7 (29.2%) |
| 16 and 17 Years | 0 (0.0%) | 185 (64.0%) |
| 18 to 24 Years | 480 (28.4%) | 564 (32.6%) |
| 25 to 34 Years | 1,081 (75.6%) | 683 (71.4%) |
| 35 to 44 Years | 352 (93.4%) | 445 (63.2%) |
| 45 to 54 Years | 265 (73.4%) | 366 (78.4%) |
| 55 to 64 Years | 521 (76.1%) | 608 (76.4%) |
| 65 to 74 Years | 293 (80.9%) | 374 (84.4%) |
| 75 Years and over | 234 (71.6%) | 271 (79.9%) |
| Total | 3,881 (62.2%) | 3,783 (58.0%) |
Income Below Poverty Among Married-Couple Families in Milledgeville
The poverty statistics for married-couple families in Milledgeville show that 7.9% or 110 of the total 1,388 families live below the poverty line. Families with no children have the highest poverty rate of 11.0%, comprising of 99 families. On the other hand, families with 3 or 4 children have the lowest poverty rate of 0.0%, which includes 0 families.
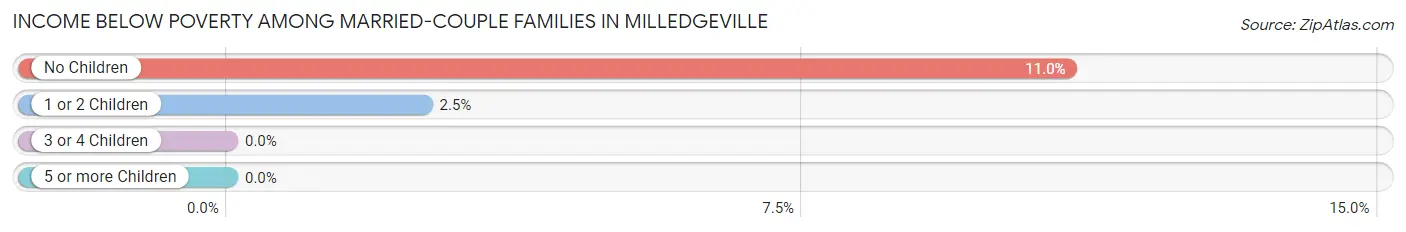
| Children | Above Poverty | Below Poverty |
| No Children | 804 (89.0%) | 99 (11.0%) |
| 1 or 2 Children | 422 (97.5%) | 11 (2.5%) |
| 3 or 4 Children | 52 (100.0%) | 0 (0.0%) |
| 5 or more Children | 0 (0.0%) | 0 (0.0%) |
| Total | 1,278 (92.1%) | 110 (7.9%) |
Income Below Poverty Among Single-Parent Households in Milledgeville
According to the poverty data in Milledgeville, 65.3% or 79 single-father households and 61.2% or 556 single-mother households are living below the poverty line. Among single-father households, those with no children have the highest poverty rate, with 79 households (73.8%) experiencing poverty. Likewise, among single-mother households, those with 3 or 4 children have the highest poverty rate, with 122 households (100.0%) falling below the poverty line.
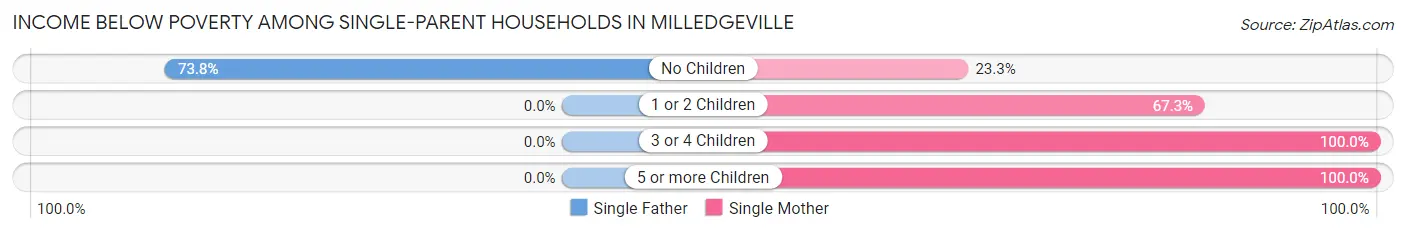
| Children | Single Father | Single Mother |
| No Children | 79 (73.8%) | 53 (23.3%) |
| 1 or 2 Children | 0 (0.0%) | 364 (67.3%) |
| 3 or 4 Children | 0 (0.0%) | 122 (100.0%) |
| 5 or more Children | 0 (0.0%) | 17 (100.0%) |
| Total | 79 (65.3%) | 556 (61.2%) |
Income Below Poverty Among Married-Couple vs Single-Parent Households in Milledgeville
The poverty data for Milledgeville shows that 110 of the married-couple family households (7.9%) and 635 of the single-parent households (61.7%) are living below the poverty level. Within the married-couple family households, those with no children have the highest poverty rate, with 99 households (11.0%) falling below the poverty line. Among the single-parent households, those with 3 or 4 children have the highest poverty rate, with 122 household (100.0%) living below poverty.
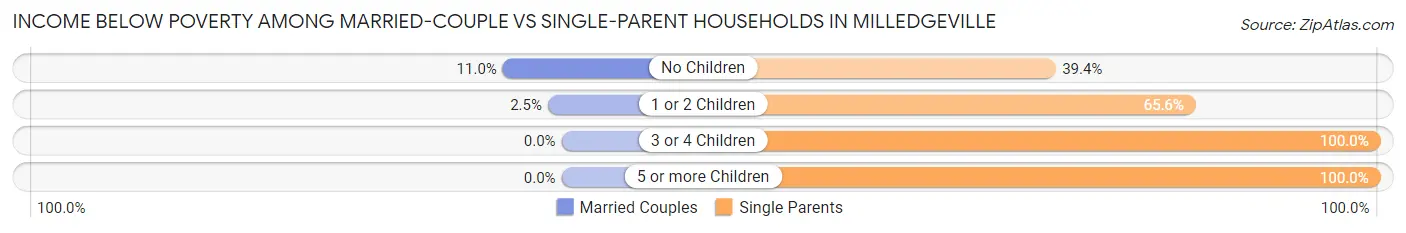
| Children | Married-Couple Families | Single-Parent Households |
| No Children | 99 (11.0%) | 132 (39.4%) |
| 1 or 2 Children | 11 (2.5%) | 364 (65.6%) |
| 3 or 4 Children | 0 (0.0%) | 122 (100.0%) |
| 5 or more Children | 0 (0.0%) | 17 (100.0%) |
| Total | 110 (7.9%) | 635 (61.7%) |
Race in Milledgeville
The most populous races in Milledgeville are White / Caucasian (8,242 | 48.4%), Black / African American (7,525 | 44.2%), and Asian (581 | 3.4%).
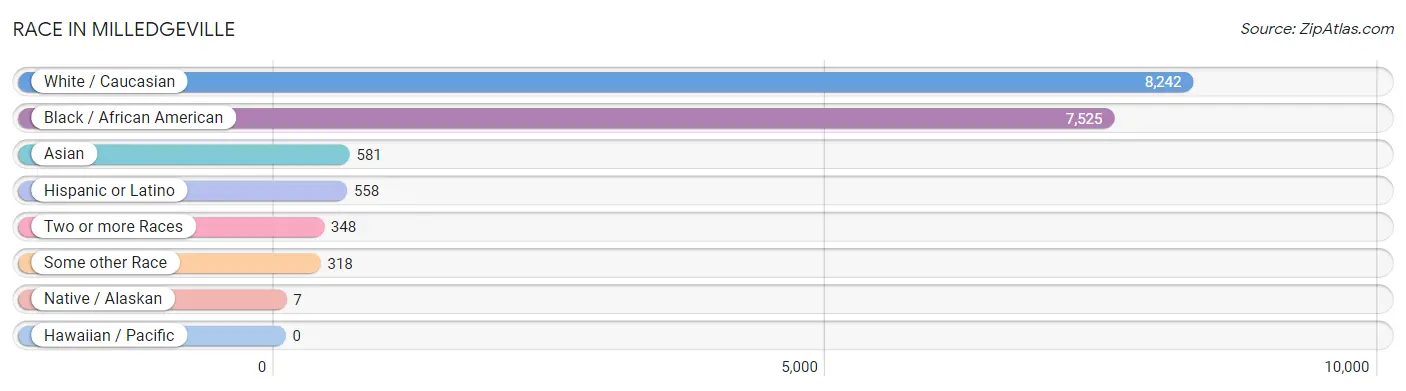
| Race | # Population | % Population |
| Asian | 581 | 3.4% |
| Black / African American | 7,525 | 44.2% |
| Hawaiian / Pacific | 0 | 0.0% |
| Hispanic or Latino | 558 | 3.3% |
| Native / Alaskan | 7 | 0.0% |
| White / Caucasian | 8,242 | 48.4% |
| Two or more Races | 348 | 2.0% |
| Some other Race | 318 | 1.9% |
| Total | 17,021 | 100.0% |
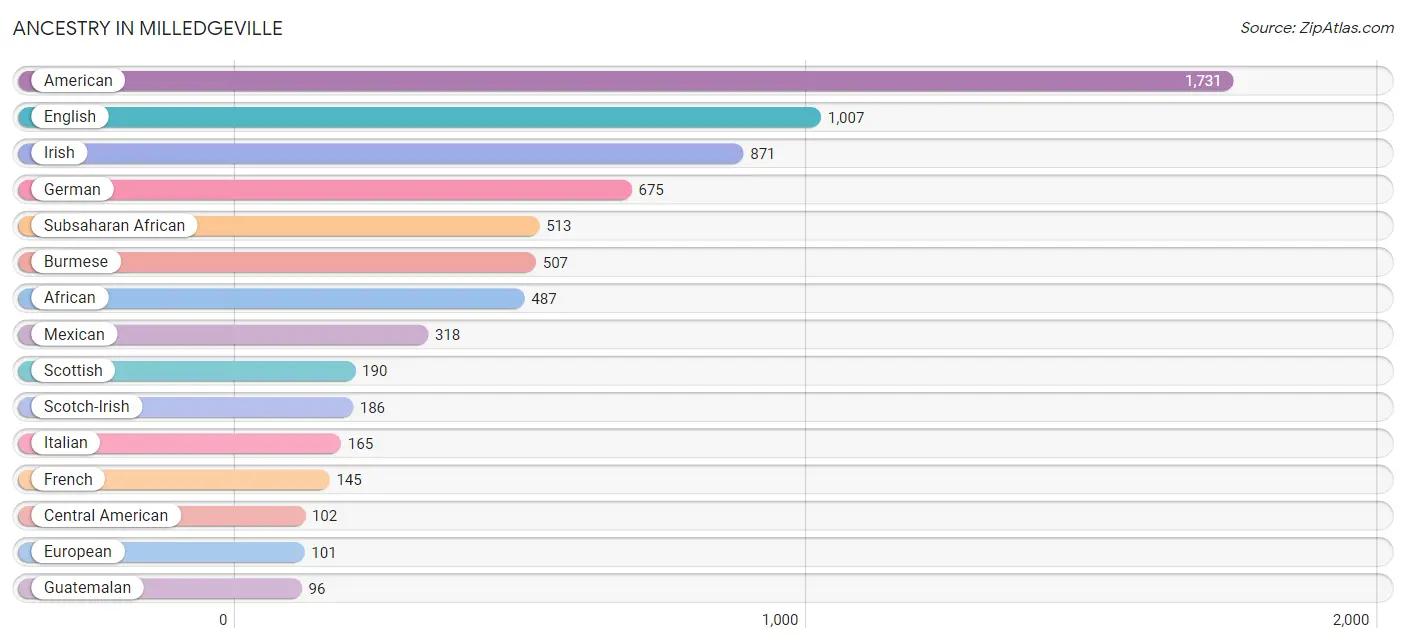
Ancestry in Milledgeville
The most populous ancestries reported in Milledgeville are American (1,731 | 10.2%), English (1,007 | 5.9%), Irish (871 | 5.1%), German (675 | 4.0%), and Subsaharan African (513 | 3.0%), together accounting for 28.2% of all Milledgeville residents.
| Ancestry | # Population | % Population |
| African | 487 | 2.9% |
| American | 1,731 | 10.2% |
| Arab | 93 | 0.5% |
| Bhutanese | 8 | 0.1% |
| British | 92 | 0.5% |
| Burmese | 507 | 3.0% |
| Central American | 102 | 0.6% |
| Cherokee | 16 | 0.1% |
| Choctaw | 7 | 0.0% |
| Colombian | 15 | 0.1% |
| Croatian | 10 | 0.1% |
| Cuban | 14 | 0.1% |
| Czech | 8 | 0.1% |
| Danish | 8 | 0.1% |
| Dominican | 7 | 0.0% |
| Dutch | 33 | 0.2% |
| English | 1,007 | 5.9% |
| European | 101 | 0.6% |
| Filipino | 18 | 0.1% |
| Finnish | 7 | 0.0% |
| French | 145 | 0.9% |
| French Canadian | 22 | 0.1% |
| German | 675 | 4.0% |
| Greek | 11 | 0.1% |
| Guatemalan | 96 | 0.6% |
| Haitian | 14 | 0.1% |
| Honduran | 6 | 0.0% |
| Hungarian | 35 | 0.2% |
| Indian (Asian) | 8 | 0.1% |
| Irish | 871 | 5.1% |
| Israeli | 4 | 0.0% |
| Italian | 165 | 1.0% |
| Jamaican | 38 | 0.2% |
| Lebanese | 30 | 0.2% |
| Lithuanian | 21 | 0.1% |
| Mexican | 318 | 1.9% |
| Moroccan | 35 | 0.2% |
| Native Hawaiian | 10 | 0.1% |
| Nigerian | 10 | 0.1% |
| Norwegian | 12 | 0.1% |
| Polish | 75 | 0.4% |
| Puerto Rican | 41 | 0.2% |
| Scandinavian | 31 | 0.2% |
| Scotch-Irish | 186 | 1.1% |
| Scottish | 190 | 1.1% |
| Slavic | 5 | 0.0% |
| South African | 6 | 0.0% |
| South American | 15 | 0.1% |
| Spaniard | 25 | 0.2% |
| Subsaharan African | 513 | 3.0% |
| Swedish | 47 | 0.3% |
| Swiss | 4 | 0.0% |
| Syrian | 28 | 0.2% |
| Thai | 48 | 0.3% |
| Welsh | 35 | 0.2% |
| West Indian | 7 | 0.0% | View All 56 Rows |
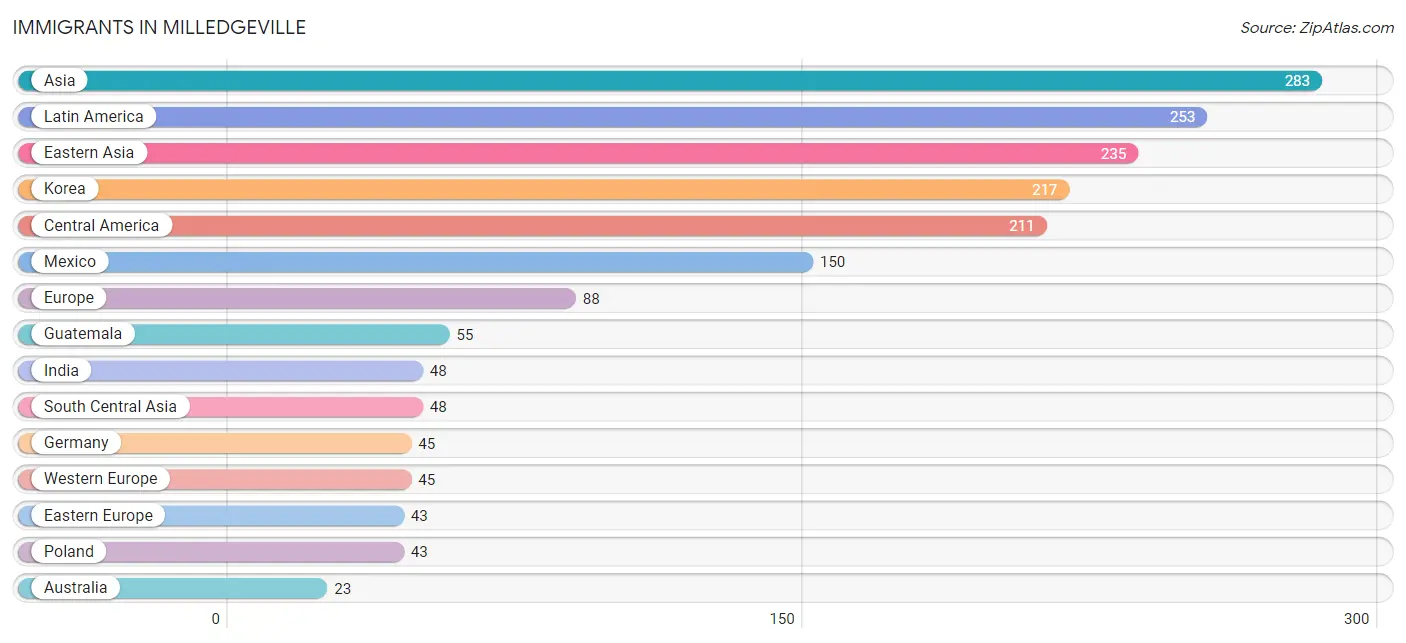
Immigrants in Milledgeville
The most numerous immigrant groups reported in Milledgeville came from Asia (283 | 1.7%), Latin America (253 | 1.5%), Eastern Asia (235 | 1.4%), Korea (217 | 1.3%), and Central America (211 | 1.2%), together accounting for 7.0% of all Milledgeville residents.
| Immigration Origin | # Population | % Population |
| Africa | 17 | 0.1% |
| Asia | 283 | 1.7% |
| Australia | 23 | 0.1% |
| Caribbean | 21 | 0.1% |
| Central America | 211 | 1.2% |
| China | 18 | 0.1% |
| Colombia | 15 | 0.1% |
| Cuba | 14 | 0.1% |
| Eastern Africa | 6 | 0.0% |
| Eastern Asia | 235 | 1.4% |
| Eastern Europe | 43 | 0.3% |
| Europe | 88 | 0.5% |
| Germany | 45 | 0.3% |
| Guatemala | 55 | 0.3% |
| Guyana | 6 | 0.0% |
| Honduras | 6 | 0.0% |
| India | 48 | 0.3% |
| Jamaica | 7 | 0.0% |
| Korea | 217 | 1.3% |
| Latin America | 253 | 1.5% |
| Mexico | 150 | 0.9% |
| Oceania | 23 | 0.1% |
| Poland | 43 | 0.3% |
| South Africa | 11 | 0.1% |
| South America | 21 | 0.1% |
| South Central Asia | 48 | 0.3% |
| Taiwan | 18 | 0.1% |
| Western Europe | 45 | 0.3% | View All 28 Rows |
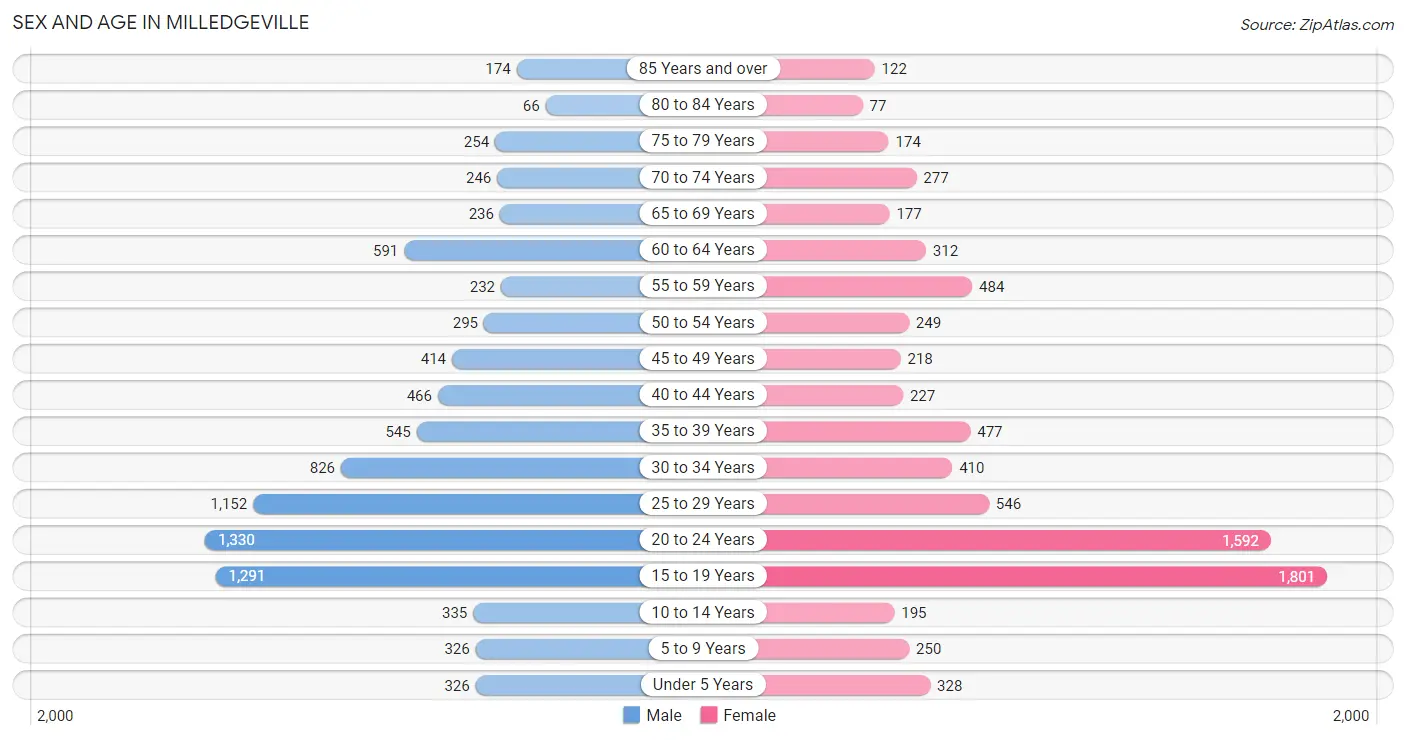
Sex and Age in Milledgeville
Sex and Age in Milledgeville
The most populous age groups in Milledgeville are 20 to 24 Years (1,330 | 14.6%) for men and 15 to 19 Years (1,801 | 22.8%) for women.
| Age Bracket | Male | Female |
| Under 5 Years | 326 (3.6%) | 328 (4.1%) |
| 5 to 9 Years | 326 (3.6%) | 250 (3.2%) |
| 10 to 14 Years | 335 (3.7%) | 195 (2.5%) |
| 15 to 19 Years | 1,291 (14.2%) | 1,801 (22.8%) |
| 20 to 24 Years | 1,330 (14.6%) | 1,592 (20.1%) |
| 25 to 29 Years | 1,152 (12.7%) | 546 (6.9%) |
| 30 to 34 Years | 826 (9.1%) | 410 (5.2%) |
| 35 to 39 Years | 545 (6.0%) | 477 (6.0%) |
| 40 to 44 Years | 466 (5.1%) | 227 (2.9%) |
| 45 to 49 Years | 414 (4.5%) | 218 (2.8%) |
| 50 to 54 Years | 295 (3.2%) | 249 (3.2%) |
| 55 to 59 Years | 232 (2.5%) | 484 (6.1%) |
| 60 to 64 Years | 591 (6.5%) | 312 (3.9%) |
| 65 to 69 Years | 236 (2.6%) | 177 (2.2%) |
| 70 to 74 Years | 246 (2.7%) | 277 (3.5%) |
| 75 to 79 Years | 254 (2.8%) | 174 (2.2%) |
| 80 to 84 Years | 66 (0.7%) | 77 (1.0%) |
| 85 Years and over | 174 (1.9%) | 122 (1.5%) |
| Total | 9,105 (100.0%) | 7,916 (100.0%) |
Families and Households in Milledgeville
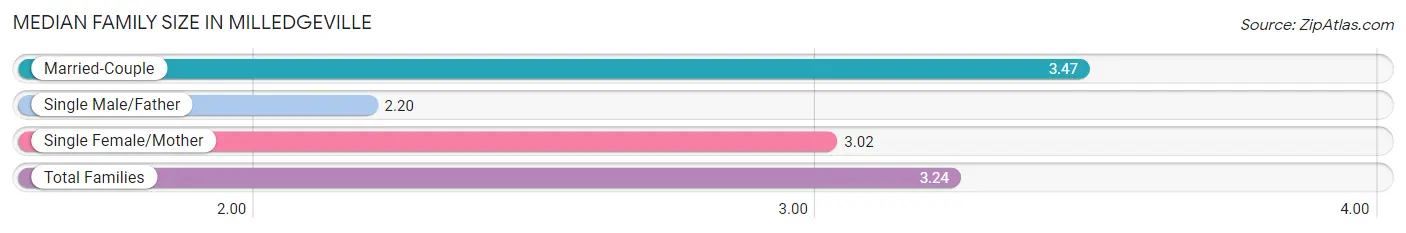
Median Family Size in Milledgeville
The median family size in Milledgeville is 3.24 persons per family, with married-couple families (1,388 | 57.4%) accounting for the largest median family size of 3.47 persons per family. On the other hand, single male/father families (121 | 5.0%) represent the smallest median family size with 2.20 persons per family.
| Family Type | # Families | Family Size |
| Married-Couple | 1,388 (57.4%) | 3.47 |
| Single Male/Father | 121 (5.0%) | 2.20 |
| Single Female/Mother | 908 (37.6%) | 3.02 |
| Total Families | 2,417 (100.0%) | 3.24 |
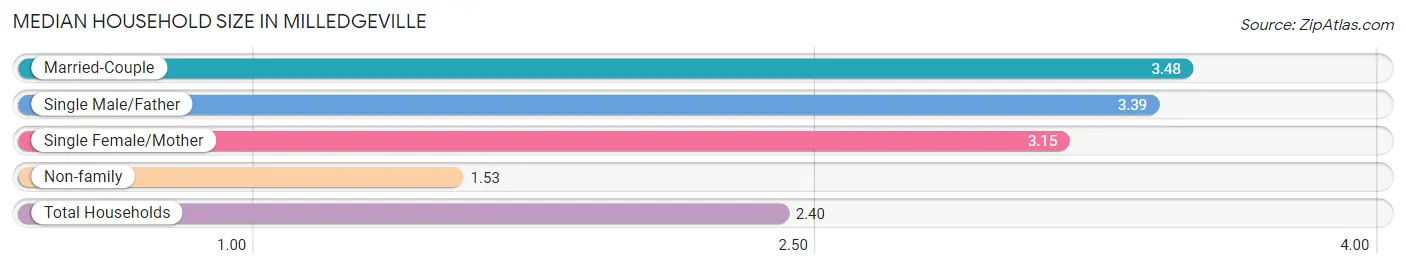
Median Household Size in Milledgeville
The median household size in Milledgeville is 2.40 persons per household, with married-couple households (1,388 | 27.3%) accounting for the largest median household size of 3.48 persons per household. non-family households (2,669 | 52.5%) represent the smallest median household size with 1.53 persons per household.
| Household Type | # Households | Household Size |
| Married-Couple | 1,388 (27.3%) | 3.48 |
| Single Male/Father | 121 (2.4%) | 3.39 |
| Single Female/Mother | 908 (17.8%) | 3.15 |
| Non-family | 2,669 (52.5%) | 1.53 |
| Total Households | 5,086 (100.0%) | 2.40 |
Household Size by Marriage Status in Milledgeville
Out of a total of 5,086 households in Milledgeville, 2,417 (47.5%) are family households, while 2,669 (52.5%) are nonfamily households. The most numerous type of family households are 2-person households, comprising 1,098, and the most common type of nonfamily households are 1-person households, comprising 1,804.
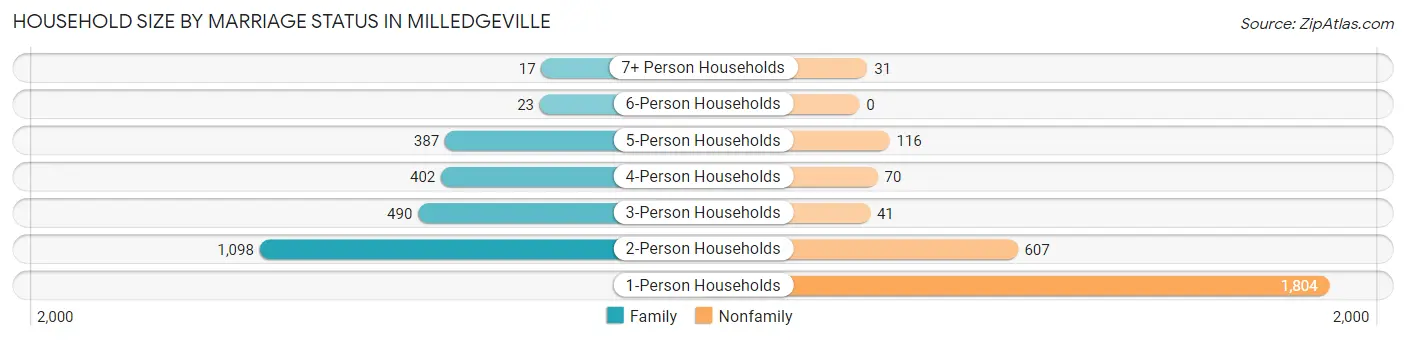
| Household Size | Family Households | Nonfamily Households |
| 1-Person Households | - | 1,804 (35.5%) |
| 2-Person Households | 1,098 (21.6%) | 607 (11.9%) |
| 3-Person Households | 490 (9.6%) | 41 (0.8%) |
| 4-Person Households | 402 (7.9%) | 70 (1.4%) |
| 5-Person Households | 387 (7.6%) | 116 (2.3%) |
| 6-Person Households | 23 (0.4%) | 0 (0.0%) |
| 7+ Person Households | 17 (0.3%) | 31 (0.6%) |
| Total | 2,417 (47.5%) | 2,669 (52.5%) |
Female Fertility in Milledgeville
Fertility by Age in Milledgeville
Average fertility rate in Milledgeville is 56.0 births per 1,000 women. Women in the age bracket of 20 to 34 years have the highest fertility rate with 105.0 births per 1,000 women. Women in the age bracket of 20 to 34 years acount for 90.2% of all women with births.
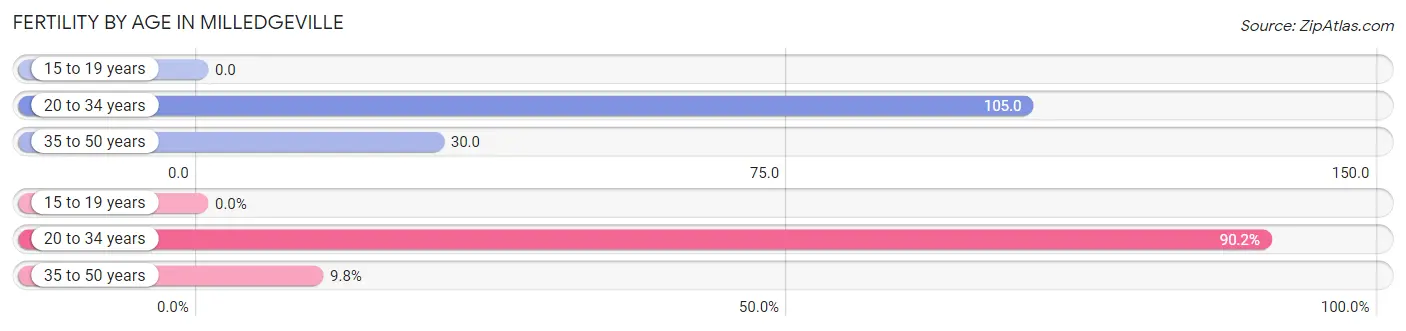
| Age Bracket | Women with Births | Births / 1,000 Women |
| 15 to 19 years | 0 (0.0%) | 0.0 |
| 20 to 34 years | 268 (90.2%) | 105.0 |
| 35 to 50 years | 29 (9.8%) | 30.0 |
| Total | 297 (100.0%) | 56.0 |
Fertility by Age by Marriage Status in Milledgeville
51.9% of women with births (297) in Milledgeville are married. The highest percentage of unmarried women with births falls into 20 to 34 years age bracket with 53.4% of them unmarried at the time of birth, while the lowest percentage of unmarried women with births belong to 35 to 50 years age bracket with 0.0% of them unmarried.
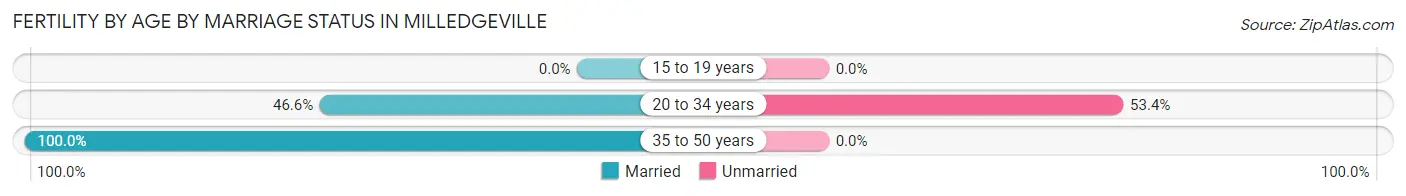
| Age Bracket | Married | Unmarried |
| 15 to 19 years | 0 (0.0%) | 0 (0.0%) |
| 20 to 34 years | 125 (46.6%) | 143 (53.4%) |
| 35 to 50 years | 29 (100.0%) | 0 (0.0%) |
| Total | 154 (51.8%) | 143 (48.1%) |
Fertility by Education in Milledgeville
Average fertility rate in Milledgeville is 56.0 births per 1,000 women. Women with the education attainment of bachelor's degree have the highest fertility rate of 212.0 births per 1,000 women, while women with the education attainment of graduate degree have the lowest fertility at 20.0 births per 1,000 women. Women with the education attainment of bachelor's degree represent 34.7% of all women with births.
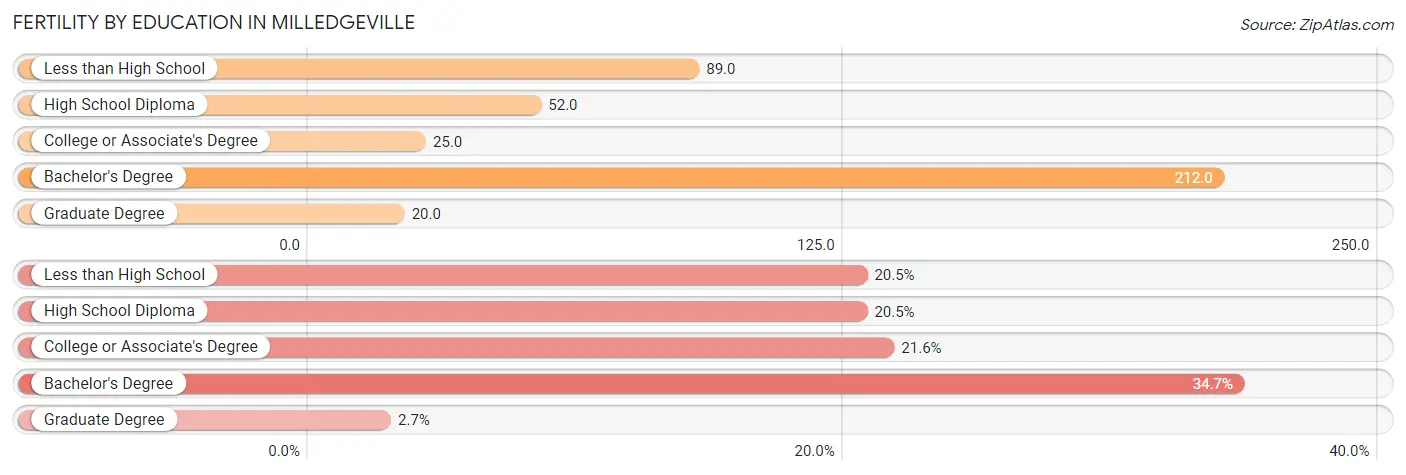
| Educational Attainment | Women with Births | Births / 1,000 Women |
| Less than High School | 61 (20.5%) | 89.0 |
| High School Diploma | 61 (20.5%) | 52.0 |
| College or Associate's Degree | 64 (21.5%) | 25.0 |
| Bachelor's Degree | 103 (34.7%) | 212.0 |
| Graduate Degree | 8 (2.7%) | 20.0 |
| Total | 297 (100.0%) | 56.0 |
Fertility by Education by Marriage Status in Milledgeville
48.1% of women with births in Milledgeville are unmarried. Women with the educational attainment of bachelor's degree are most likely to be married with 100.0% of them married at childbirth, while women with the educational attainment of less than high school are least likely to be married with 100.0% of them unmarried at childbirth.
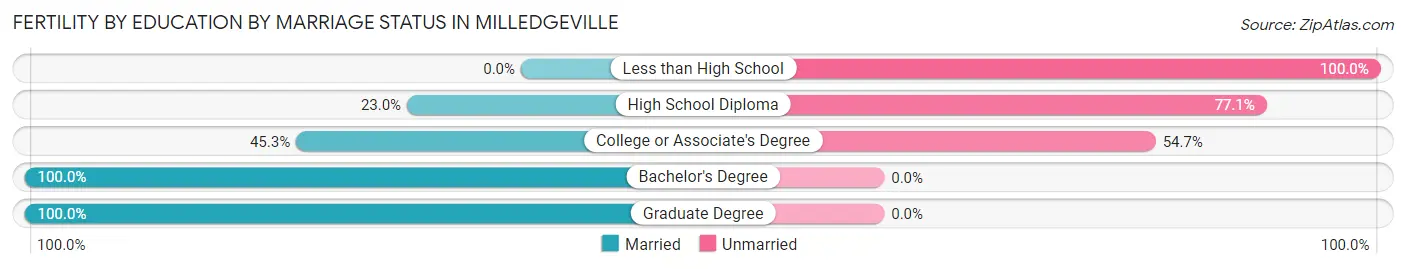
| Educational Attainment | Married | Unmarried |
| Less than High School | 0 (0.0%) | 61 (100.0%) |
| High School Diploma | 14 (23.0%) | 47 (77.0%) |
| College or Associate's Degree | 29 (45.3%) | 35 (54.7%) |
| Bachelor's Degree | 103 (100.0%) | 0 (0.0%) |
| Graduate Degree | 8 (100.0%) | 0 (0.0%) |
| Total | 154 (51.8%) | 143 (48.1%) |
Employment Characteristics in Milledgeville
Employment by Class of Employer in Milledgeville
Among the 5,869 employed individuals in Milledgeville, private company employees (3,911 | 66.6%), state government employees (790 | 13.5%), and local government employees (582 | 9.9%) make up the most common classes of employment.
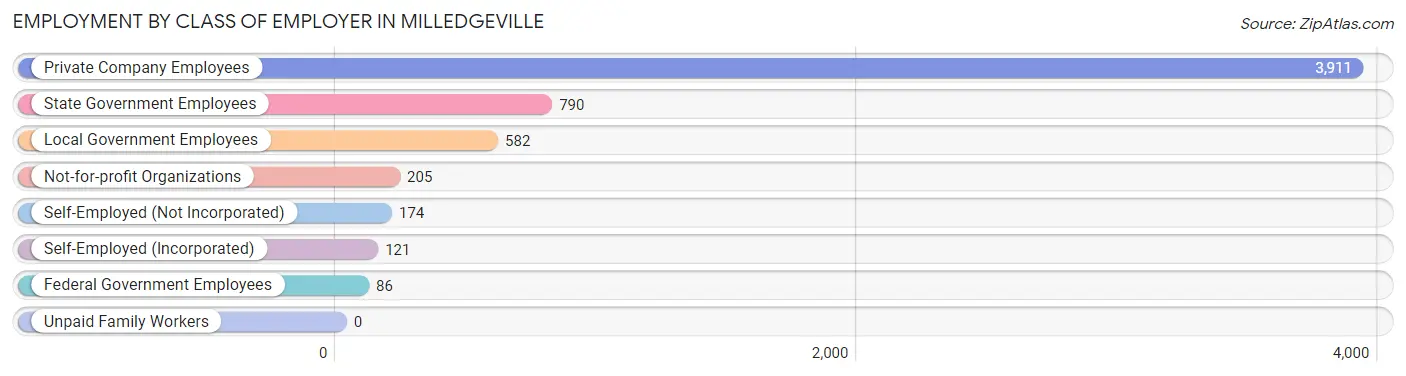
| Employer Class | # Employees | % Employees |
| Private Company Employees | 3,911 | 66.6% |
| Self-Employed (Incorporated) | 121 | 2.1% |
| Self-Employed (Not Incorporated) | 174 | 3.0% |
| Not-for-profit Organizations | 205 | 3.5% |
| Local Government Employees | 582 | 9.9% |
| State Government Employees | 790 | 13.5% |
| Federal Government Employees | 86 | 1.5% |
| Unpaid Family Workers | 0 | 0.0% |
| Total | 5,869 | 100.0% |
Employment Status by Age in Milledgeville
According to the labor force statistics for Milledgeville, out of the total population over 16 years of age (15,183), 43.6% or 6,620 individuals are in the labor force, with 7.2% or 477 of them unemployed. The age group with the highest labor force participation rate is 30 to 34 years, with 64.9% or 802 individuals in the labor force. Within the labor force, the 16 to 19 years age range has the highest percentage of unemployed individuals, with 33.0% or 207 of them being unemployed.
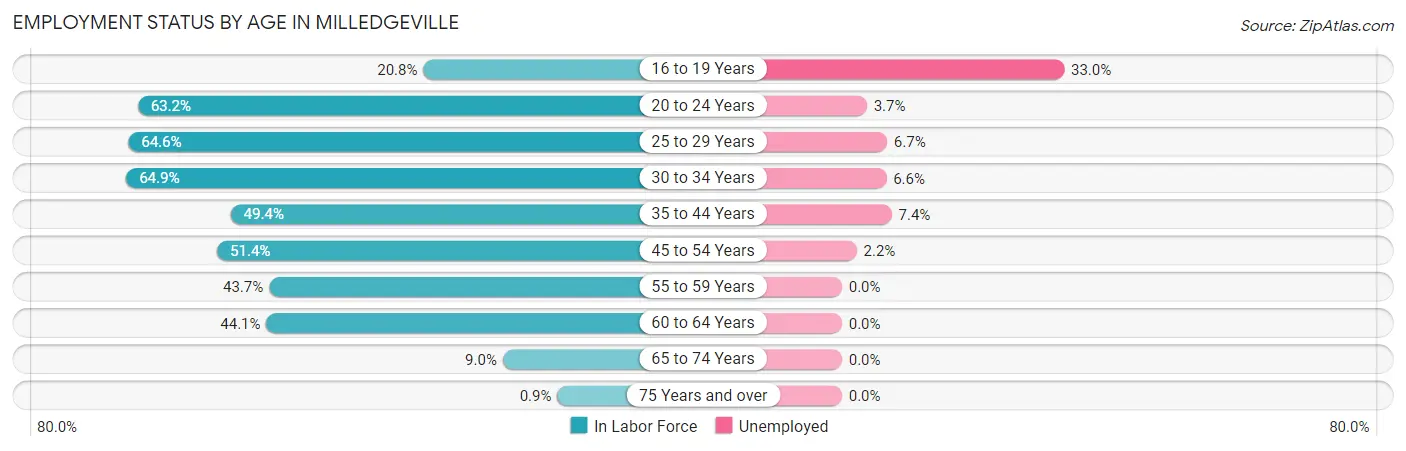
| Age Bracket | In Labor Force | Unemployed |
| 16 to 19 Years | 627 (20.8%) | 207 (33.0%) |
| 20 to 24 Years | 1,847 (63.2%) | 68 (3.7%) |
| 25 to 29 Years | 1,097 (64.6%) | 73 (6.7%) |
| 30 to 34 Years | 802 (64.9%) | 53 (6.6%) |
| 35 to 44 Years | 847 (49.4%) | 63 (7.4%) |
| 45 to 54 Years | 604 (51.4%) | 13 (2.2%) |
| 55 to 59 Years | 313 (43.7%) | 0 (0.0%) |
| 60 to 64 Years | 398 (44.1%) | 0 (0.0%) |
| 65 to 74 Years | 84 (9.0%) | 0 (0.0%) |
| 75 Years and over | 8 (0.9%) | 0 (0.0%) |
| Total | 6,620 (43.6%) | 477 (7.2%) |
Employment Status by Educational Attainment in Milledgeville
According to labor force statistics for Milledgeville, 54.6% of individuals (4,064) out of the total population between 25 and 64 years of age (7,444) are in the labor force, with 5.0% or 203 of them being unemployed. The group with the highest labor force participation rate are those with the educational attainment of bachelor's degree or higher, with 86.8% or 1,566 individuals in the labor force. Within the labor force, individuals with less than high school education have the highest percentage of unemployment, with 8.2% or 19 of them being unemployed.
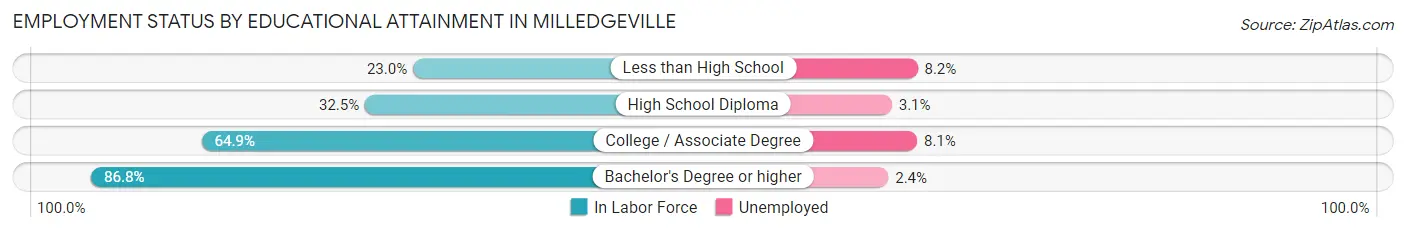
| Educational Attainment | In Labor Force | Unemployed |
| Less than High School | 231 (23.0%) | 82 (8.2%) |
| High School Diploma | 747 (32.5%) | 71 (3.1%) |
| College / Associate Degree | 1,515 (64.9%) | 189 (8.1%) |
| Bachelor's Degree or higher | 1,566 (86.8%) | 43 (2.4%) |
| Total | 4,064 (54.6%) | 372 (5.0%) |
Employment Occupations by Sex in Milledgeville
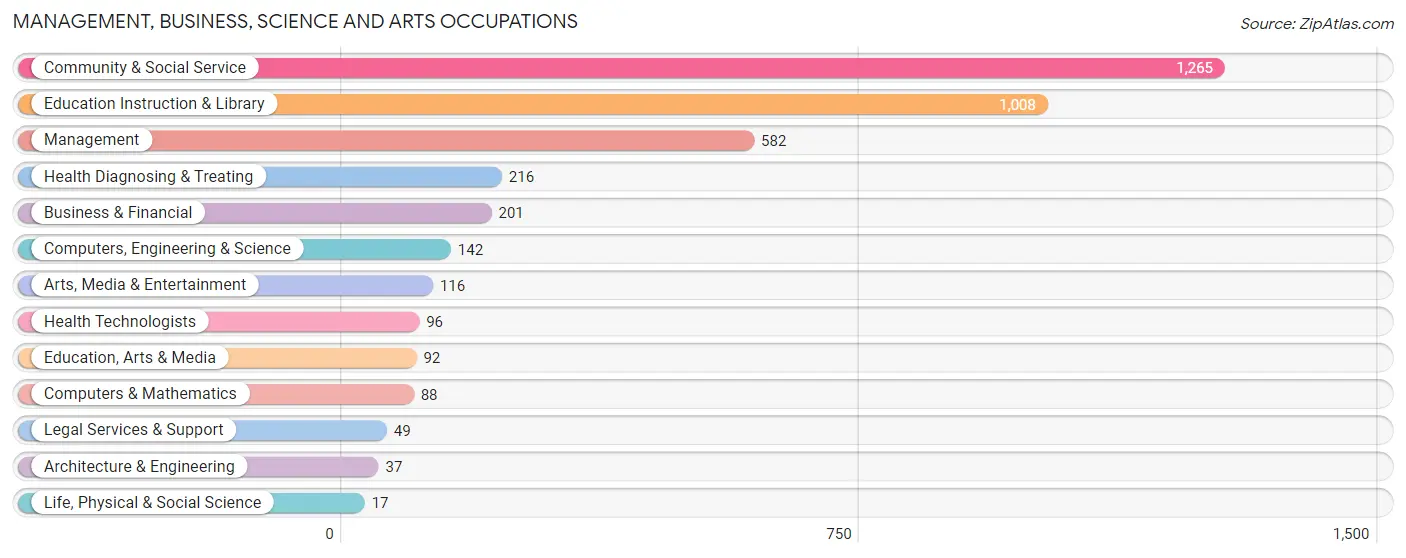
Management, Business, Science and Arts Occupations
The most common Management, Business, Science and Arts occupations in Milledgeville are Community & Social Service (1,265 | 20.6%), Education Instruction & Library (1,008 | 16.4%), Management (582 | 9.5%), Health Diagnosing & Treating (216 | 3.5%), and Business & Financial (201 | 3.3%).
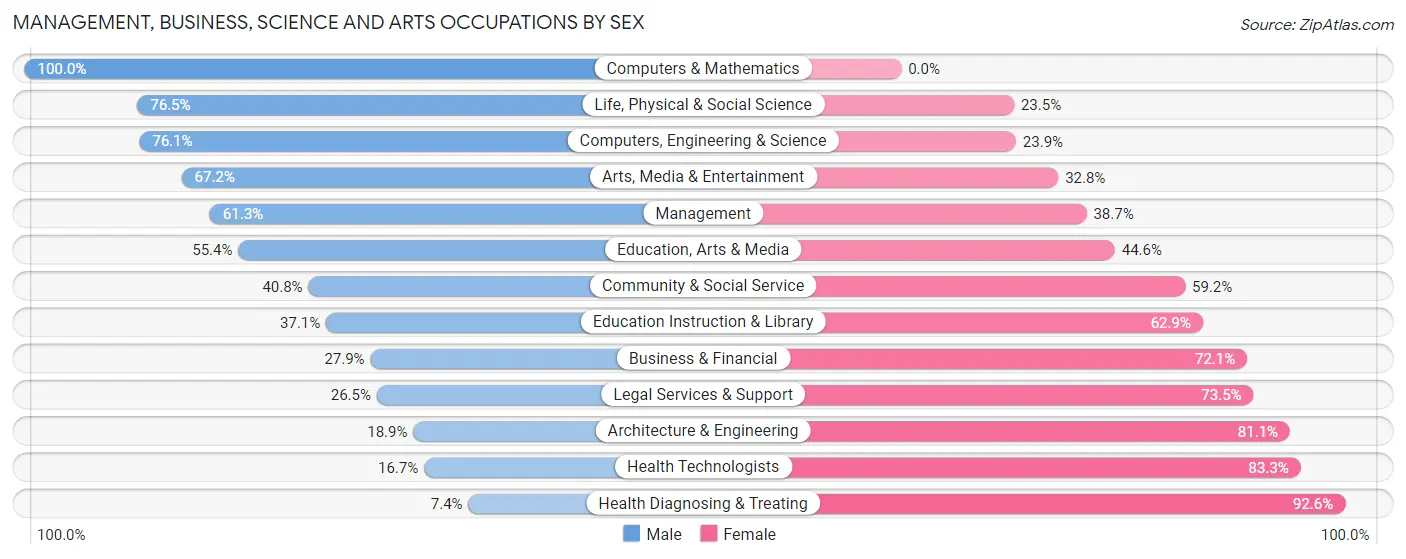
Management, Business, Science and Arts Occupations by Sex
Within the Management, Business, Science and Arts occupations in Milledgeville, the most male-oriented occupations are Computers & Mathematics (100.0%), Life, Physical & Social Science (76.5%), and Computers, Engineering & Science (76.1%), while the most female-oriented occupations are Health Diagnosing & Treating (92.6%), Health Technologists (83.3%), and Architecture & Engineering (81.1%).
| Occupation | Male | Female |
| Management | 357 (61.3%) | 225 (38.7%) |
| Business & Financial | 56 (27.9%) | 145 (72.1%) |
| Computers, Engineering & Science | 108 (76.1%) | 34 (23.9%) |
| Computers & Mathematics | 88 (100.0%) | 0 (0.0%) |
| Architecture & Engineering | 7 (18.9%) | 30 (81.1%) |
| Life, Physical & Social Science | 13 (76.5%) | 4 (23.5%) |
| Community & Social Service | 516 (40.8%) | 749 (59.2%) |
| Education, Arts & Media | 51 (55.4%) | 41 (44.6%) |
| Legal Services & Support | 13 (26.5%) | 36 (73.5%) |
| Education Instruction & Library | 374 (37.1%) | 634 (62.9%) |
| Arts, Media & Entertainment | 78 (67.2%) | 38 (32.8%) |
| Health Diagnosing & Treating | 16 (7.4%) | 200 (92.6%) |
| Health Technologists | 16 (16.7%) | 80 (83.3%) |
| Total (Category) | 1,053 (43.8%) | 1,353 (56.2%) |
| Total (Overall) | 2,975 (48.4%) | 3,174 (51.6%) |
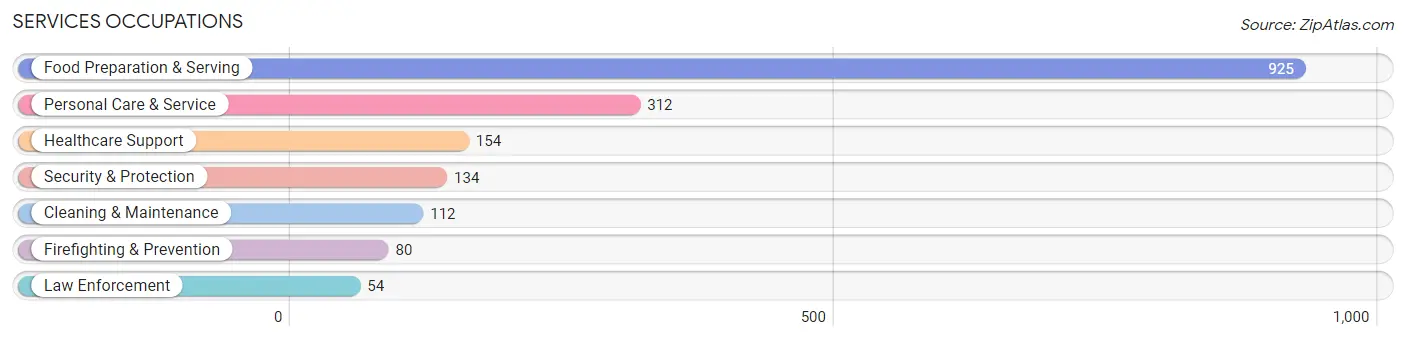
Services Occupations
The most common Services occupations in Milledgeville are Food Preparation & Serving (925 | 15.0%), Personal Care & Service (312 | 5.1%), Healthcare Support (154 | 2.5%), Security & Protection (134 | 2.2%), and Cleaning & Maintenance (112 | 1.8%).
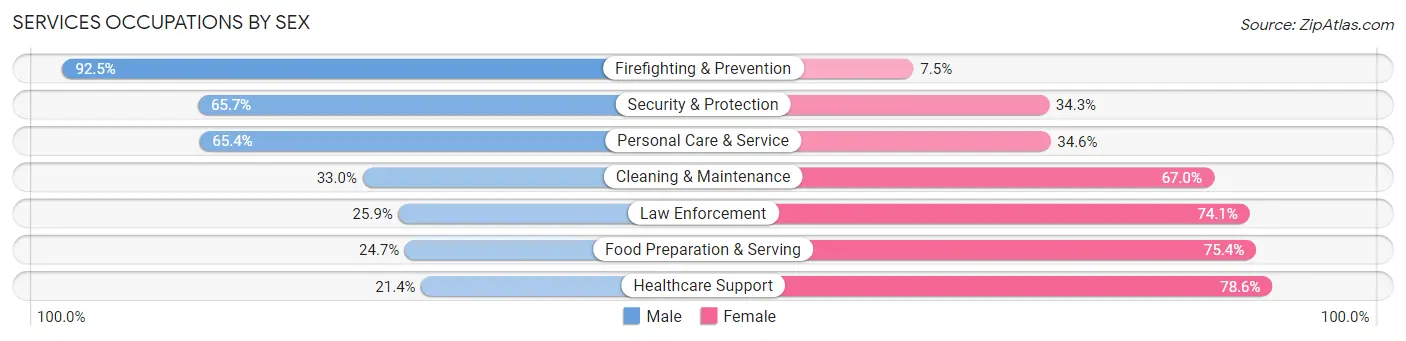
Services Occupations by Sex
Within the Services occupations in Milledgeville, the most male-oriented occupations are Firefighting & Prevention (92.5%), Security & Protection (65.7%), and Personal Care & Service (65.4%), while the most female-oriented occupations are Healthcare Support (78.6%), Food Preparation & Serving (75.3%), and Law Enforcement (74.1%).
| Occupation | Male | Female |
| Healthcare Support | 33 (21.4%) | 121 (78.6%) |
| Security & Protection | 88 (65.7%) | 46 (34.3%) |
| Firefighting & Prevention | 74 (92.5%) | 6 (7.5%) |
| Law Enforcement | 14 (25.9%) | 40 (74.1%) |
| Food Preparation & Serving | 228 (24.6%) | 697 (75.3%) |
| Cleaning & Maintenance | 37 (33.0%) | 75 (67.0%) |
| Personal Care & Service | 204 (65.4%) | 108 (34.6%) |
| Total (Category) | 590 (36.0%) | 1,047 (64.0%) |
| Total (Overall) | 2,975 (48.4%) | 3,174 (51.6%) |
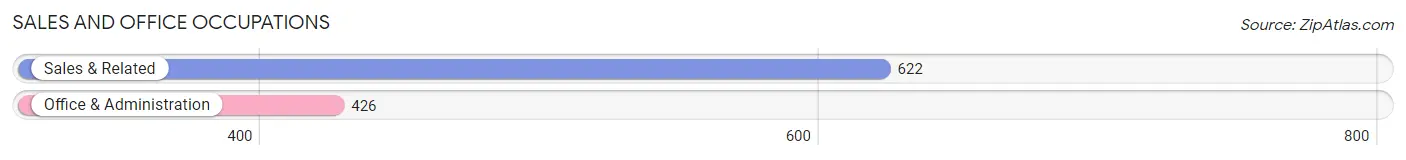
Sales and Office Occupations
The most common Sales and Office occupations in Milledgeville are Sales & Related (622 | 10.1%), and Office & Administration (426 | 6.9%).
Sales and Office Occupations by Sex
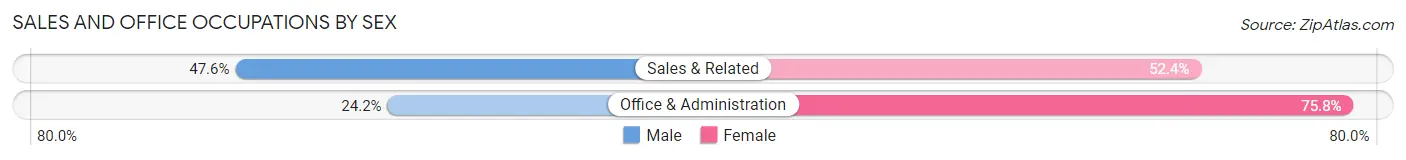
| Occupation | Male | Female |
| Sales & Related | 296 (47.6%) | 326 (52.4%) |
| Office & Administration | 103 (24.2%) | 323 (75.8%) |
| Total (Category) | 399 (38.1%) | 649 (61.9%) |
| Total (Overall) | 2,975 (48.4%) | 3,174 (51.6%) |
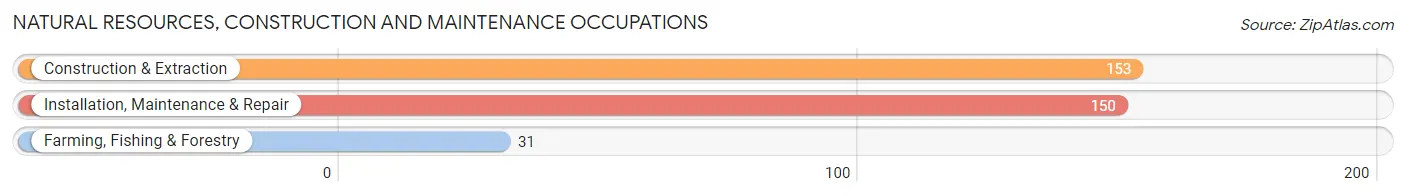
Natural Resources, Construction and Maintenance Occupations
The most common Natural Resources, Construction and Maintenance occupations in Milledgeville are Construction & Extraction (153 | 2.5%), Installation, Maintenance & Repair (150 | 2.4%), and Farming, Fishing & Forestry (31 | 0.5%).
Natural Resources, Construction and Maintenance Occupations by Sex
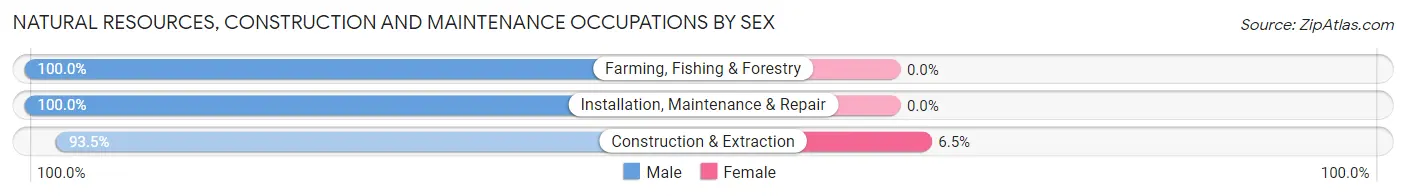
| Occupation | Male | Female |
| Farming, Fishing & Forestry | 31 (100.0%) | 0 (0.0%) |
| Construction & Extraction | 143 (93.5%) | 10 (6.5%) |
| Installation, Maintenance & Repair | 150 (100.0%) | 0 (0.0%) |
| Total (Category) | 324 (97.0%) | 10 (3.0%) |
| Total (Overall) | 2,975 (48.4%) | 3,174 (51.6%) |
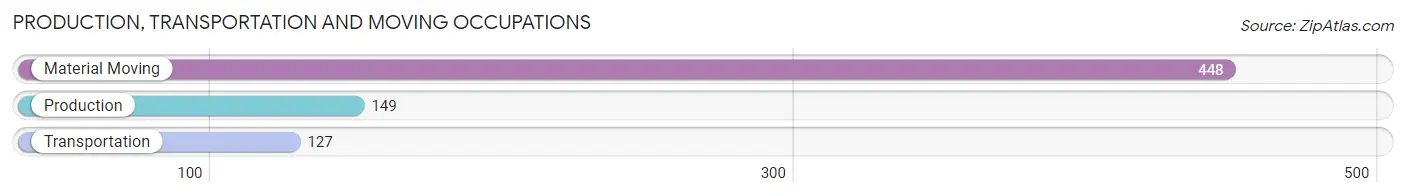
Production, Transportation and Moving Occupations
The most common Production, Transportation and Moving occupations in Milledgeville are Material Moving (448 | 7.3%), Production (149 | 2.4%), and Transportation (127 | 2.1%).
Production, Transportation and Moving Occupations by Sex
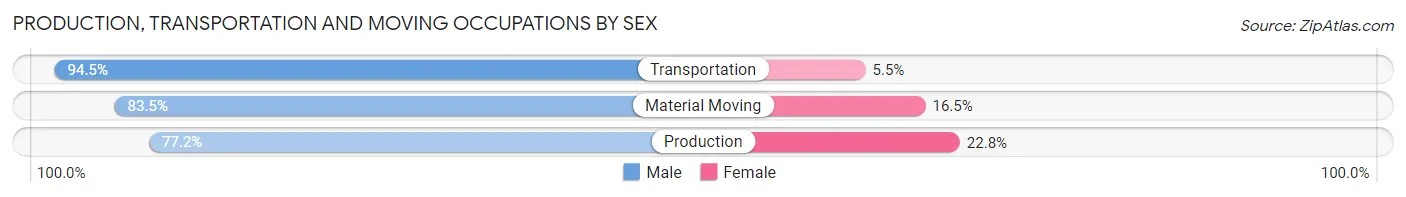
| Occupation | Male | Female |
| Production | 115 (77.2%) | 34 (22.8%) |
| Transportation | 120 (94.5%) | 7 (5.5%) |
| Material Moving | 374 (83.5%) | 74 (16.5%) |
| Total (Category) | 609 (84.1%) | 115 (15.9%) |
| Total (Overall) | 2,975 (48.4%) | 3,174 (51.6%) |
Employment Industries by Sex in Milledgeville
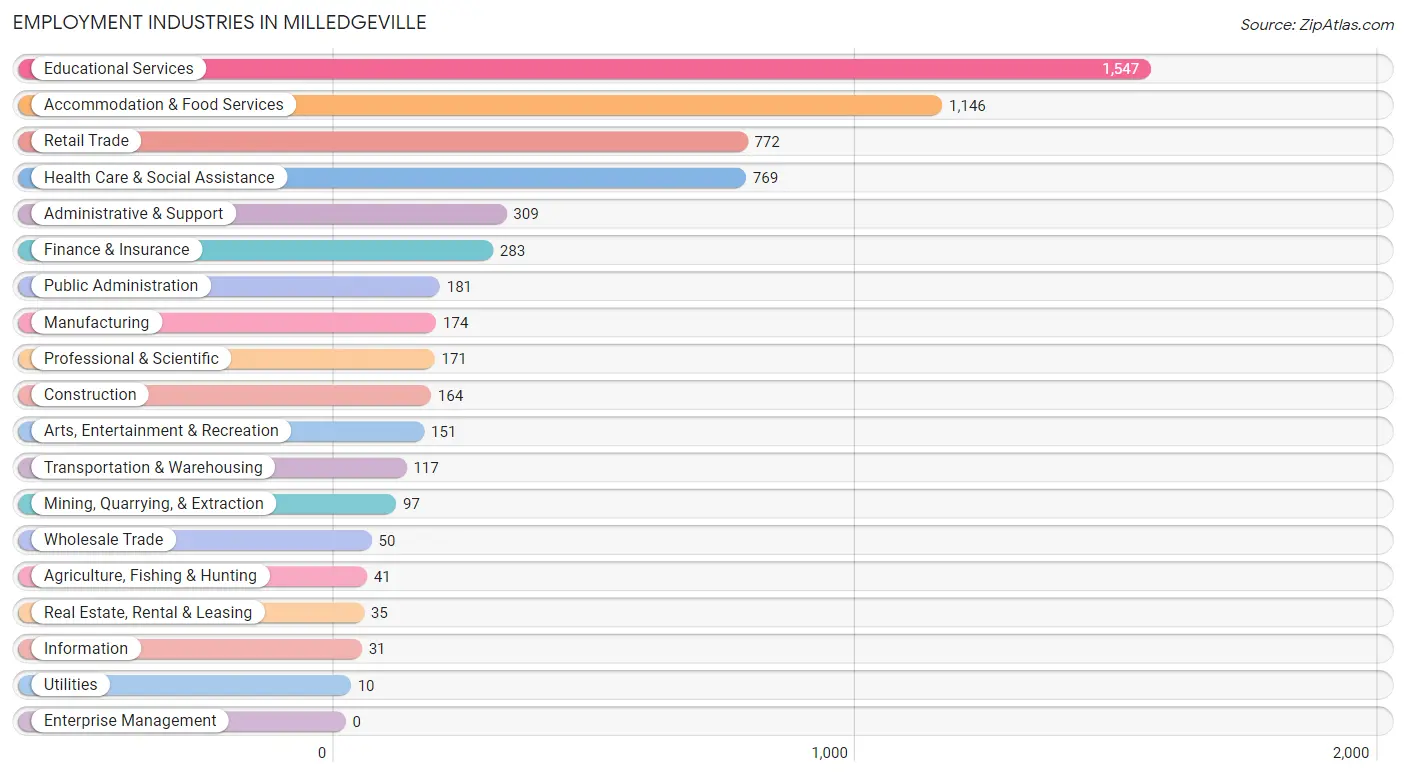
Employment Industries in Milledgeville
The major employment industries in Milledgeville include Educational Services (1,547 | 25.2%), Accommodation & Food Services (1,146 | 18.6%), Retail Trade (772 | 12.6%), Health Care & Social Assistance (769 | 12.5%), and Administrative & Support (309 | 5.0%).
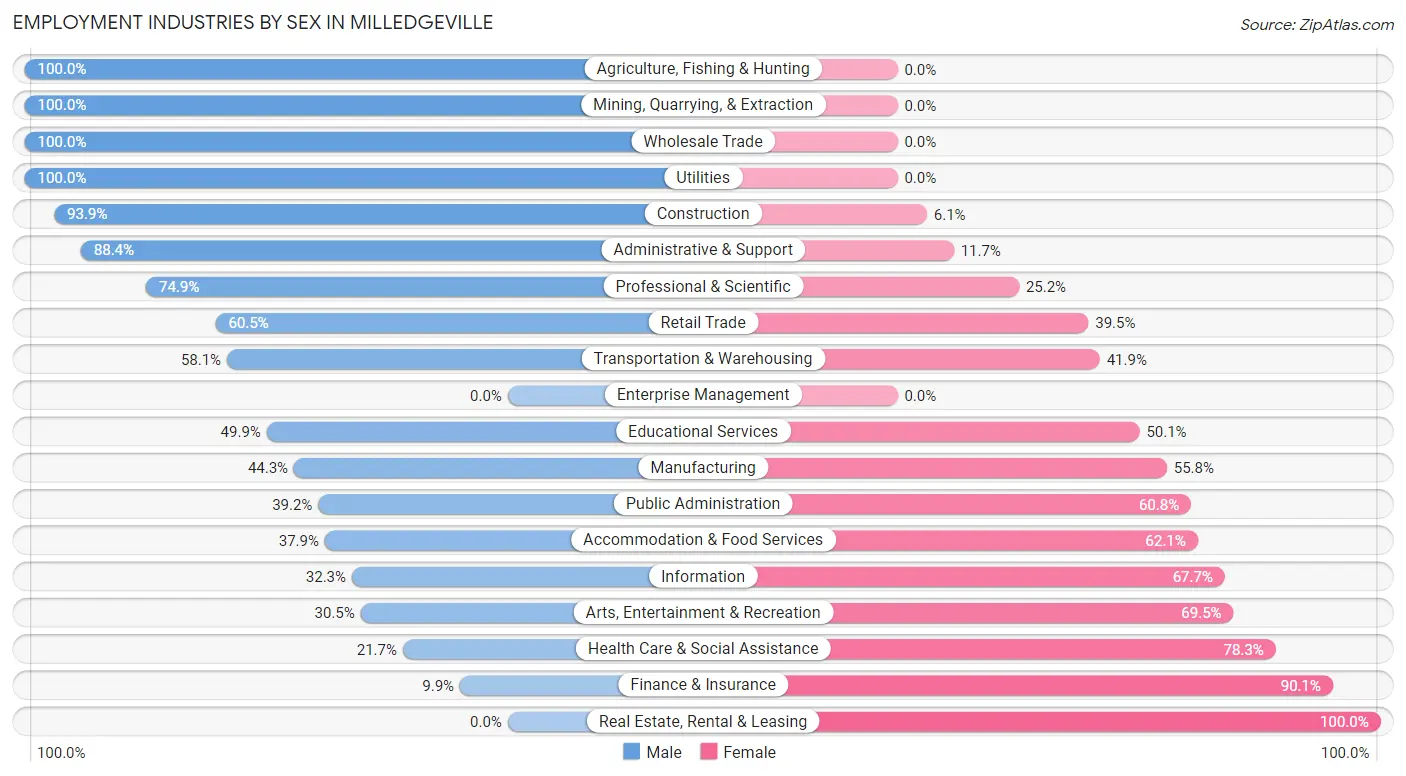
Employment Industries by Sex in Milledgeville
The Milledgeville industries that see more men than women are Agriculture, Fishing & Hunting (100.0%), Mining, Quarrying, & Extraction (100.0%), and Wholesale Trade (100.0%), whereas the industries that tend to have a higher number of women are Real Estate, Rental & Leasing (100.0%), Finance & Insurance (90.1%), and Health Care & Social Assistance (78.3%).
| Industry | Male | Female |
| Agriculture, Fishing & Hunting | 41 (100.0%) | 0 (0.0%) |
| Mining, Quarrying, & Extraction | 97 (100.0%) | 0 (0.0%) |
| Construction | 154 (93.9%) | 10 (6.1%) |
| Manufacturing | 77 (44.3%) | 97 (55.7%) |
| Wholesale Trade | 50 (100.0%) | 0 (0.0%) |
| Retail Trade | 467 (60.5%) | 305 (39.5%) |
| Transportation & Warehousing | 68 (58.1%) | 49 (41.9%) |
| Utilities | 10 (100.0%) | 0 (0.0%) |
| Information | 10 (32.3%) | 21 (67.7%) |
| Finance & Insurance | 28 (9.9%) | 255 (90.1%) |
| Real Estate, Rental & Leasing | 0 (0.0%) | 35 (100.0%) |
| Professional & Scientific | 128 (74.9%) | 43 (25.2%) |
| Enterprise Management | 0 (0.0%) | 0 (0.0%) |
| Administrative & Support | 273 (88.3%) | 36 (11.7%) |
| Educational Services | 772 (49.9%) | 775 (50.1%) |
| Health Care & Social Assistance | 167 (21.7%) | 602 (78.3%) |
| Arts, Entertainment & Recreation | 46 (30.5%) | 105 (69.5%) |
| Accommodation & Food Services | 434 (37.9%) | 712 (62.1%) |
| Public Administration | 71 (39.2%) | 110 (60.8%) |
| Total | 2,975 (48.4%) | 3,174 (51.6%) |
Education in Milledgeville
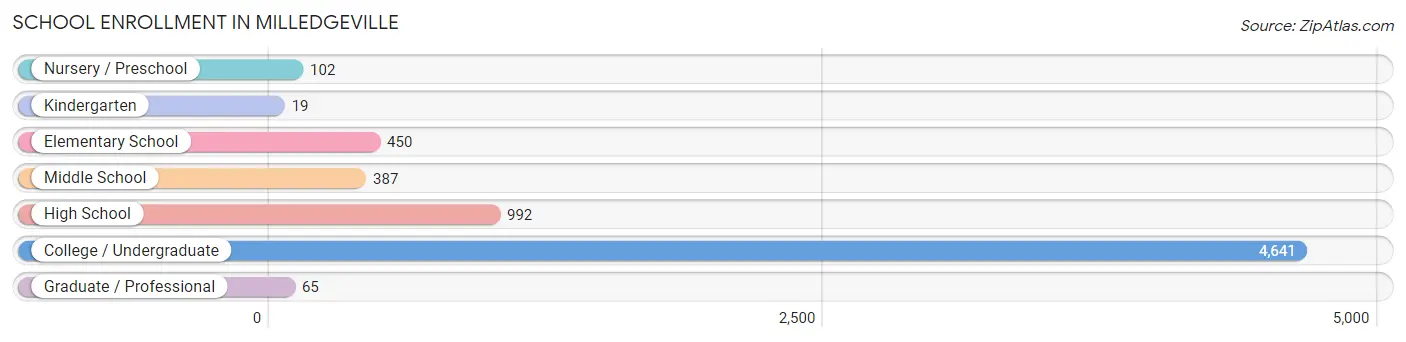
School Enrollment in Milledgeville
The most common levels of schooling among the 6,656 students in Milledgeville are college / undergraduate (4,641 | 69.7%), high school (992 | 14.9%), and elementary school (450 | 6.8%).
| School Level | # Students | % Students |
| Nursery / Preschool | 102 | 1.5% |
| Kindergarten | 19 | 0.3% |
| Elementary School | 450 | 6.8% |
| Middle School | 387 | 5.8% |
| High School | 992 | 14.9% |
| College / Undergraduate | 4,641 | 69.7% |
| Graduate / Professional | 65 | 1.0% |
| Total | 6,656 | 100.0% |
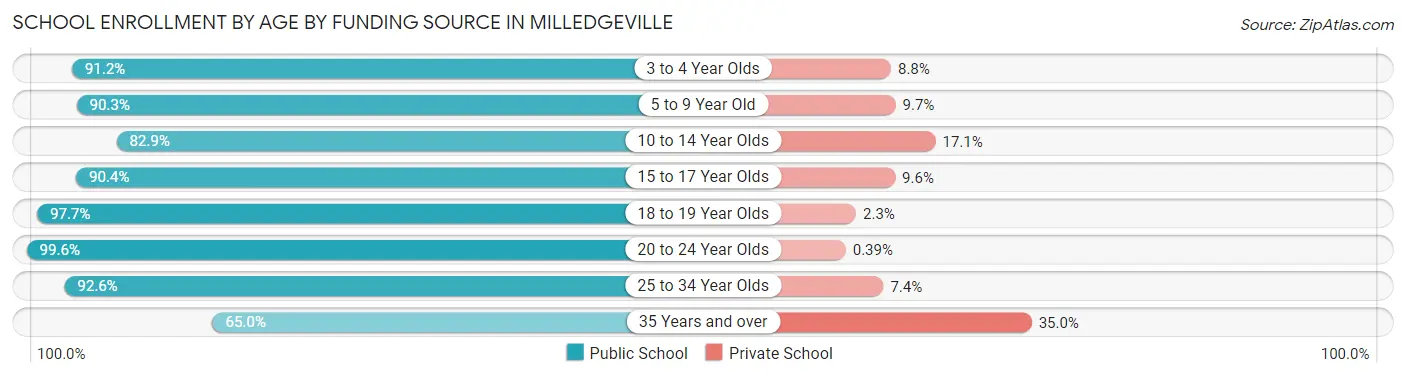
School Enrollment by Age by Funding Source in Milledgeville
Out of a total of 6,656 students who are enrolled in schools in Milledgeville, 386 (5.8%) attend a private institution, while the remaining 6,270 (94.2%) are enrolled in public schools. The age group of 35 years and over has the highest likelihood of being enrolled in private schools, with 97 (35.0% in the age bracket) enrolled. Conversely, the age group of 20 to 24 year olds has the lowest likelihood of being enrolled in a private school, with 1,778 (99.6% in the age bracket) attending a public institution.
| Age Bracket | Public School | Private School |
| 3 to 4 Year Olds | 93 (91.2%) | 9 (8.8%) |
| 5 to 9 Year Old | 429 (90.3%) | 46 (9.7%) |
| 10 to 14 Year Olds | 397 (82.9%) | 82 (17.1%) |
| 15 to 17 Year Olds | 462 (90.4%) | 49 (9.6%) |
| 18 to 19 Year Olds | 2,483 (97.7%) | 59 (2.3%) |
| 20 to 24 Year Olds | 1,778 (99.6%) | 7 (0.4%) |
| 25 to 34 Year Olds | 449 (92.6%) | 36 (7.4%) |
| 35 Years and over | 180 (65.0%) | 97 (35.0%) |
| Total | 6,270 (94.2%) | 386 (5.8%) |
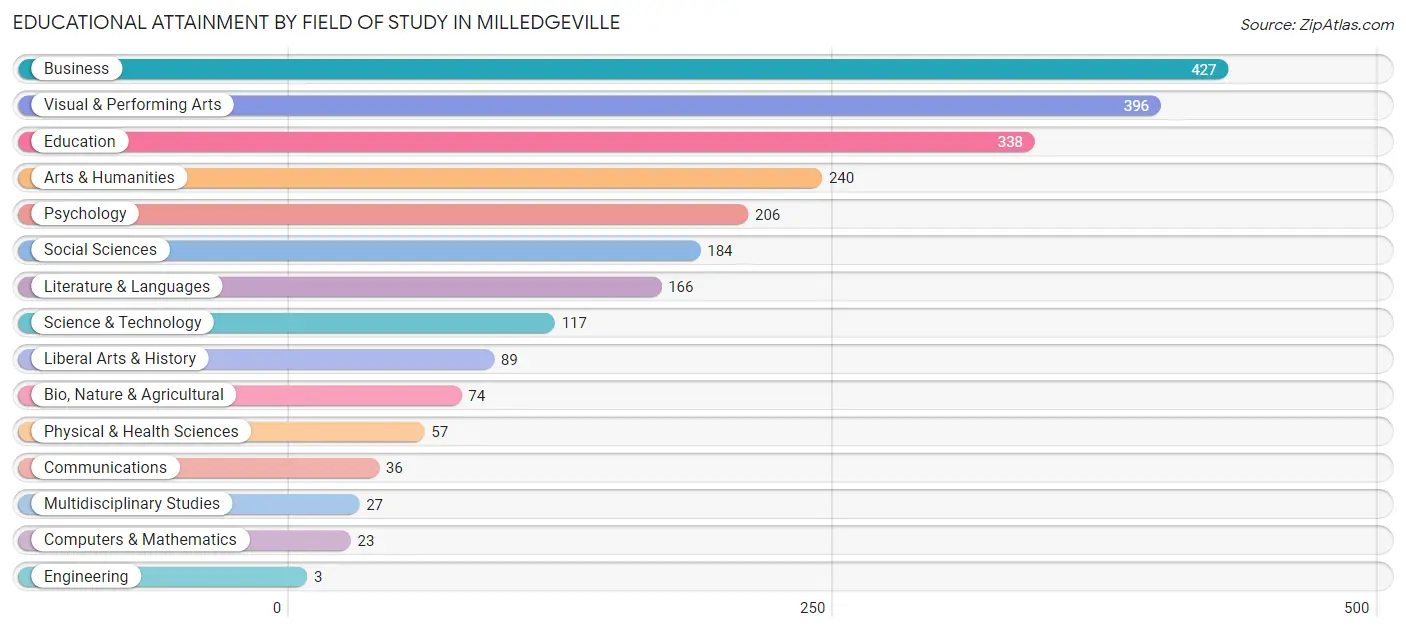
Educational Attainment by Field of Study in Milledgeville
Business (427 | 17.9%), visual & performing arts (396 | 16.6%), education (338 | 14.2%), arts & humanities (240 | 10.1%), and psychology (206 | 8.6%) are the most common fields of study among 2,383 individuals in Milledgeville who have obtained a bachelor's degree or higher.
| Field of Study | # Graduates | % Graduates |
| Computers & Mathematics | 23 | 1.0% |
| Bio, Nature & Agricultural | 74 | 3.1% |
| Physical & Health Sciences | 57 | 2.4% |
| Psychology | 206 | 8.6% |
| Social Sciences | 184 | 7.7% |
| Engineering | 3 | 0.1% |
| Multidisciplinary Studies | 27 | 1.1% |
| Science & Technology | 117 | 4.9% |
| Business | 427 | 17.9% |
| Education | 338 | 14.2% |
| Literature & Languages | 166 | 7.0% |
| Liberal Arts & History | 89 | 3.7% |
| Visual & Performing Arts | 396 | 16.6% |
| Communications | 36 | 1.5% |
| Arts & Humanities | 240 | 10.1% |
| Total | 2,383 | 100.0% |
Transportation & Commute in Milledgeville
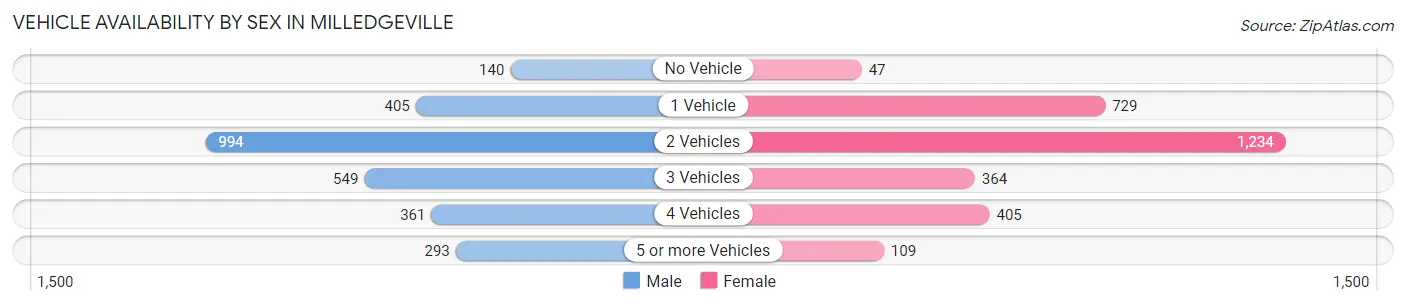
Vehicle Availability by Sex in Milledgeville
The most prevalent vehicle ownership categories in Milledgeville are males with 2 vehicles (994, accounting for 36.2%) and females with 2 vehicles (1,234, making up 34.4%).
| Vehicles Available | Male | Female |
| No Vehicle | 140 (5.1%) | 47 (1.6%) |
| 1 Vehicle | 405 (14.8%) | 729 (25.2%) |
| 2 Vehicles | 994 (36.2%) | 1,234 (42.7%) |
| 3 Vehicles | 549 (20.0%) | 364 (12.6%) |
| 4 Vehicles | 361 (13.2%) | 405 (14.0%) |
| 5 or more Vehicles | 293 (10.7%) | 109 (3.8%) |
| Total | 2,742 (100.0%) | 2,888 (100.0%) |
Commute Time in Milledgeville
The most frequently occuring commute durations in Milledgeville are 10 to 14 minutes (1,230 commuters, 22.1%), 5 to 9 minutes (971 commuters, 17.5%), and 15 to 19 minutes (923 commuters, 16.6%).
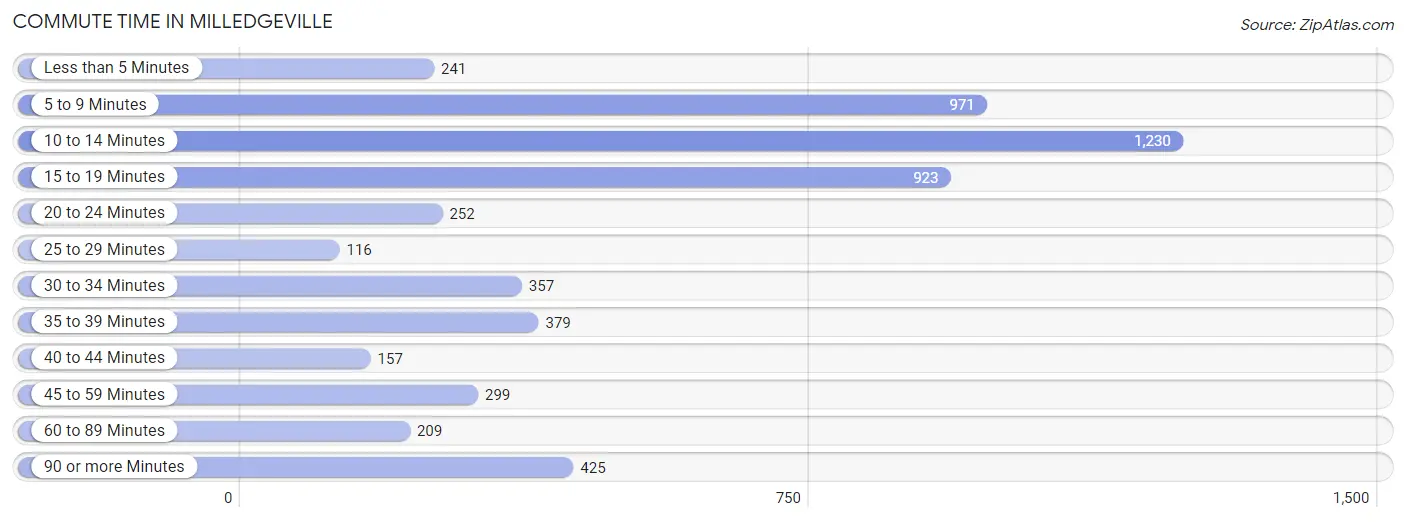
| Commute Time | # Commuters | % Commuters |
| Less than 5 Minutes | 241 | 4.3% |
| 5 to 9 Minutes | 971 | 17.5% |
| 10 to 14 Minutes | 1,230 | 22.1% |
| 15 to 19 Minutes | 923 | 16.6% |
| 20 to 24 Minutes | 252 | 4.5% |
| 25 to 29 Minutes | 116 | 2.1% |
| 30 to 34 Minutes | 357 | 6.4% |
| 35 to 39 Minutes | 379 | 6.8% |
| 40 to 44 Minutes | 157 | 2.8% |
| 45 to 59 Minutes | 299 | 5.4% |
| 60 to 89 Minutes | 209 | 3.8% |
| 90 or more Minutes | 425 | 7.6% |
Commute Time by Sex in Milledgeville
The most common commute times in Milledgeville are 10 to 14 minutes (754 commuters, 27.6%) for males and 5 to 9 minutes (656 commuters, 23.3%) for females.
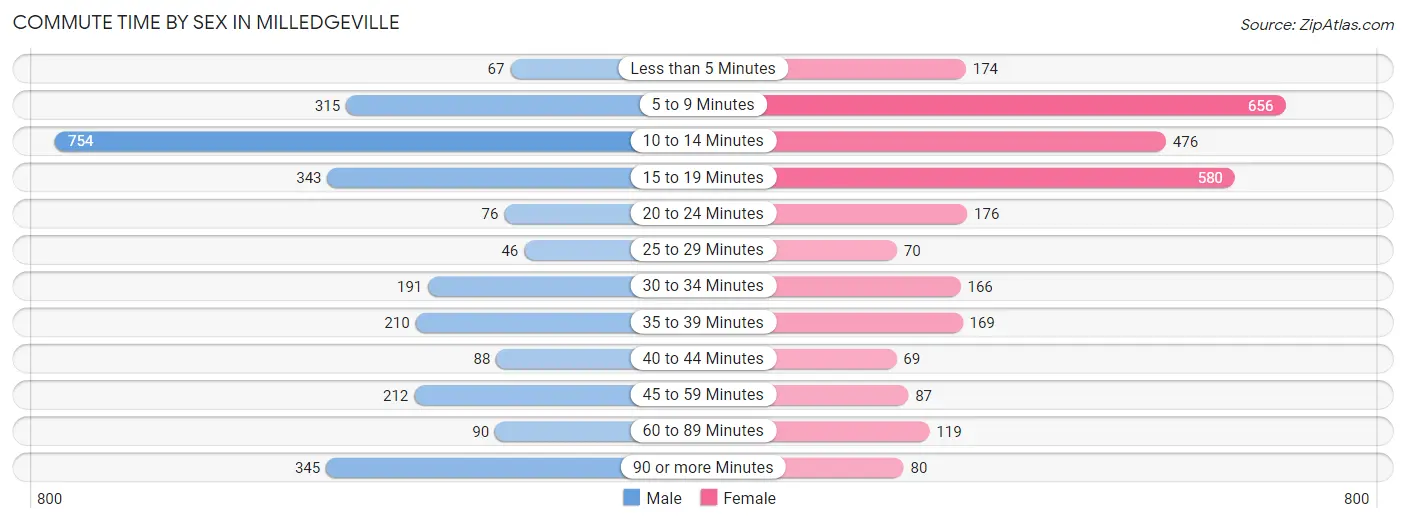
| Commute Time | Male | Female |
| Less than 5 Minutes | 67 (2.5%) | 174 (6.2%) |
| 5 to 9 Minutes | 315 (11.5%) | 656 (23.3%) |
| 10 to 14 Minutes | 754 (27.6%) | 476 (16.9%) |
| 15 to 19 Minutes | 343 (12.5%) | 580 (20.5%) |
| 20 to 24 Minutes | 76 (2.8%) | 176 (6.2%) |
| 25 to 29 Minutes | 46 (1.7%) | 70 (2.5%) |
| 30 to 34 Minutes | 191 (7.0%) | 166 (5.9%) |
| 35 to 39 Minutes | 210 (7.7%) | 169 (6.0%) |
| 40 to 44 Minutes | 88 (3.2%) | 69 (2.5%) |
| 45 to 59 Minutes | 212 (7.7%) | 87 (3.1%) |
| 60 to 89 Minutes | 90 (3.3%) | 119 (4.2%) |
| 90 or more Minutes | 345 (12.6%) | 80 (2.8%) |
Time of Departure to Work by Sex in Milledgeville
The most frequent times of departure to work in Milledgeville are 12:00 PM to 3:59 PM (375, 13.7%) for males and 6:30 AM to 6:59 AM (465, 16.5%) for females.
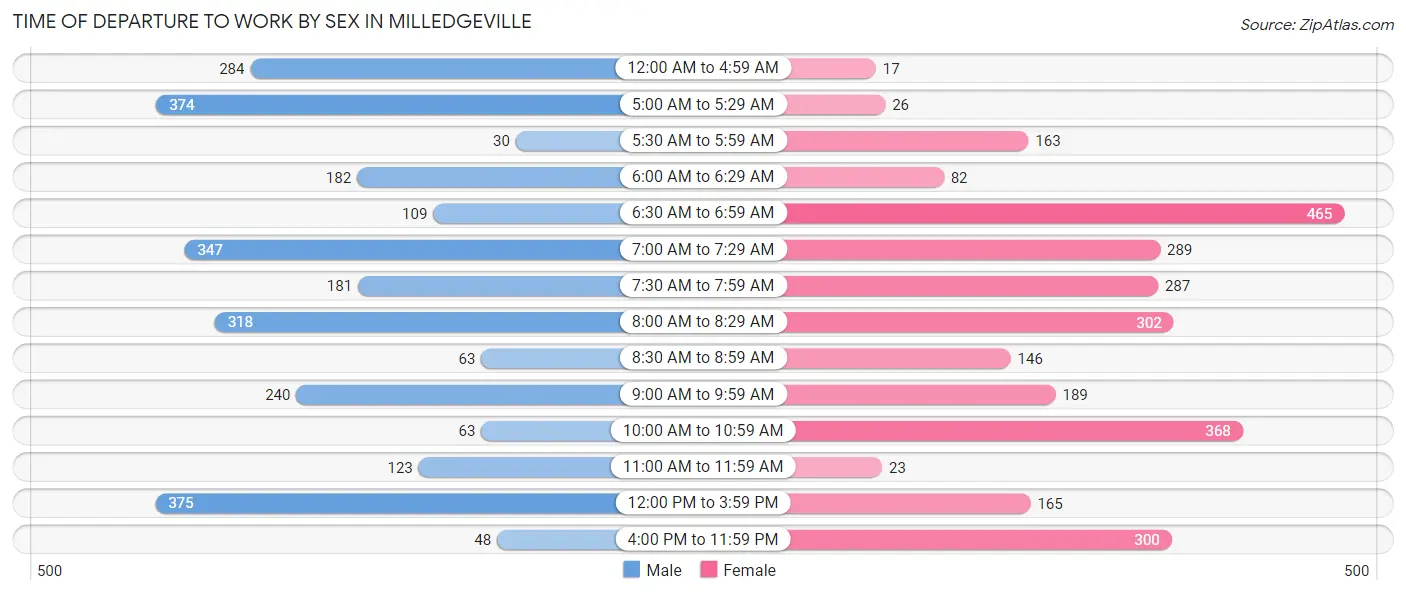
| Time of Departure | Male | Female |
| 12:00 AM to 4:59 AM | 284 (10.4%) | 17 (0.6%) |
| 5:00 AM to 5:29 AM | 374 (13.7%) | 26 (0.9%) |
| 5:30 AM to 5:59 AM | 30 (1.1%) | 163 (5.8%) |
| 6:00 AM to 6:29 AM | 182 (6.7%) | 82 (2.9%) |
| 6:30 AM to 6:59 AM | 109 (4.0%) | 465 (16.5%) |
| 7:00 AM to 7:29 AM | 347 (12.7%) | 289 (10.2%) |
| 7:30 AM to 7:59 AM | 181 (6.6%) | 287 (10.2%) |
| 8:00 AM to 8:29 AM | 318 (11.6%) | 302 (10.7%) |
| 8:30 AM to 8:59 AM | 63 (2.3%) | 146 (5.2%) |
| 9:00 AM to 9:59 AM | 240 (8.8%) | 189 (6.7%) |
| 10:00 AM to 10:59 AM | 63 (2.3%) | 368 (13.0%) |
| 11:00 AM to 11:59 AM | 123 (4.5%) | 23 (0.8%) |
| 12:00 PM to 3:59 PM | 375 (13.7%) | 165 (5.9%) |
| 4:00 PM to 11:59 PM | 48 (1.8%) | 300 (10.6%) |
| Total | 2,737 (100.0%) | 2,822 (100.0%) |
Housing Occupancy in Milledgeville
Occupancy by Ownership in Milledgeville
Of the total 5,086 dwellings in Milledgeville, owner-occupied units account for 1,756 (34.5%), while renter-occupied units make up 3,330 (65.5%).
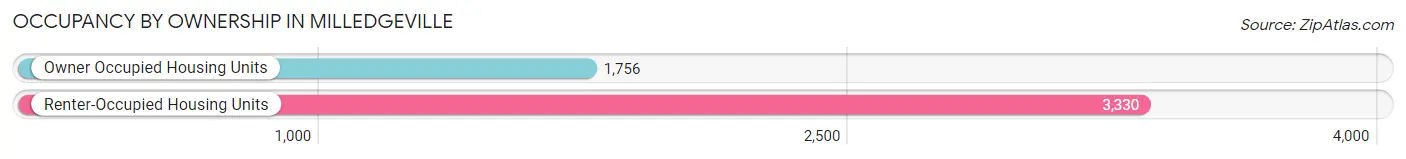
| Occupancy | # Housing Units | % Housing Units |
| Owner Occupied Housing Units | 1,756 | 34.5% |
| Renter-Occupied Housing Units | 3,330 | 65.5% |
| Total Occupied Housing Units | 5,086 | 100.0% |
Occupancy by Household Size in Milledgeville
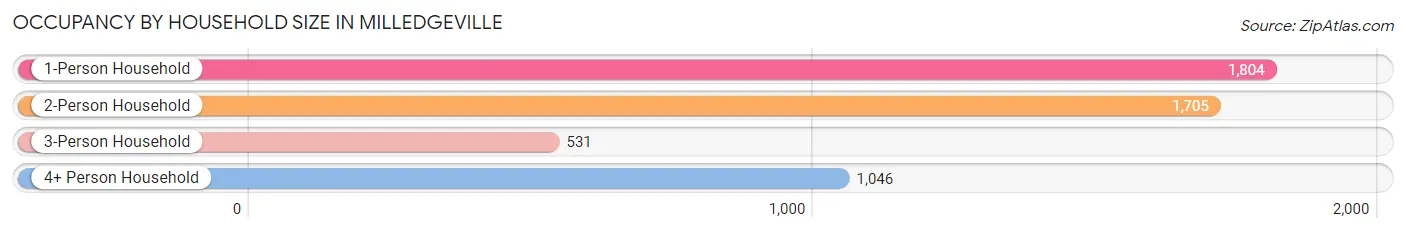
| Household Size | # Housing Units | % Housing Units |
| 1-Person Household | 1,804 | 35.5% |
| 2-Person Household | 1,705 | 33.5% |
| 3-Person Household | 531 | 10.4% |
| 4+ Person Household | 1,046 | 20.6% |
| Total Housing Units | 5,086 | 100.0% |
Occupancy by Ownership by Household Size in Milledgeville
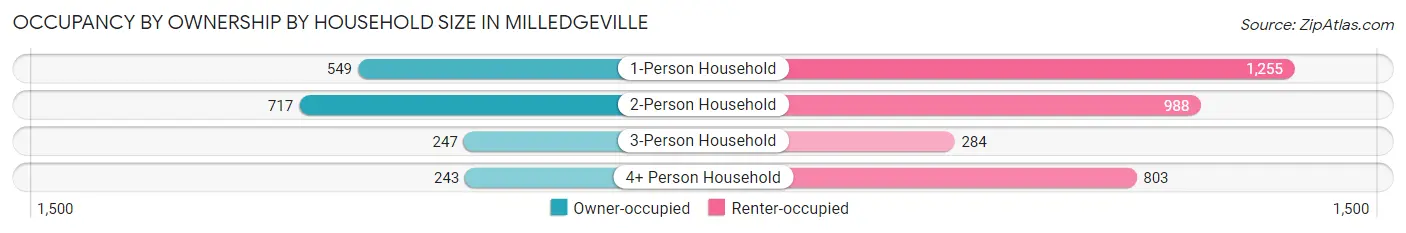
| Household Size | Owner-occupied | Renter-occupied |
| 1-Person Household | 549 (30.4%) | 1,255 (69.6%) |
| 2-Person Household | 717 (42.0%) | 988 (58.0%) |
| 3-Person Household | 247 (46.5%) | 284 (53.5%) |
| 4+ Person Household | 243 (23.2%) | 803 (76.8%) |
| Total Housing Units | 1,756 (34.5%) | 3,330 (65.5%) |
Occupancy by Educational Attainment in Milledgeville
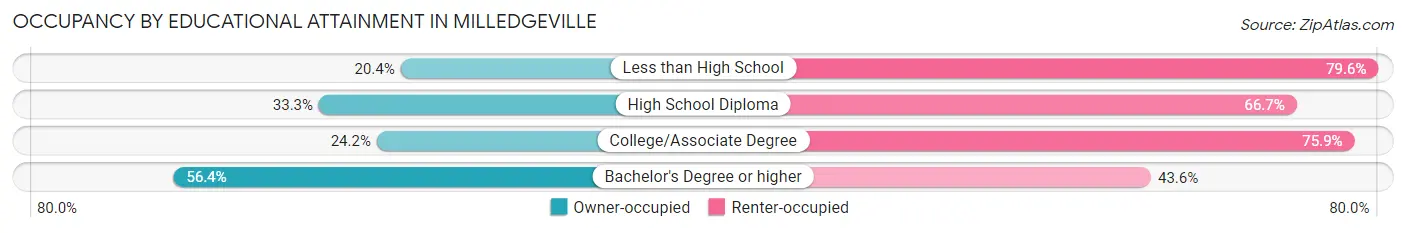
| Household Size | Owner-occupied | Renter-occupied |
| Less than High School | 110 (20.4%) | 430 (79.6%) |
| High School Diploma | 381 (33.3%) | 762 (66.7%) |
| College/Associate Degree | 490 (24.1%) | 1,539 (75.8%) |
| Bachelor's Degree or higher | 775 (56.4%) | 599 (43.6%) |
Occupancy by Age of Householder in Milledgeville
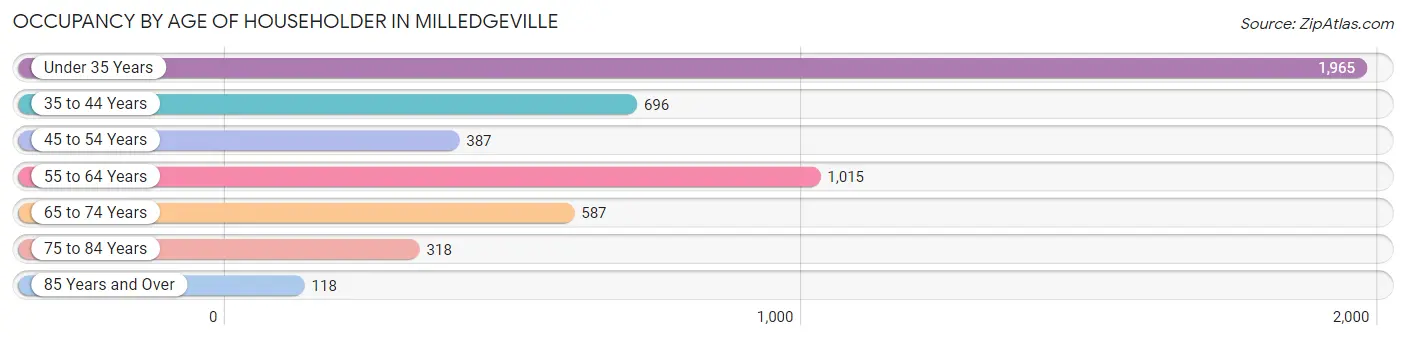
| Age Bracket | # Households | % Households |
| Under 35 Years | 1,965 | 38.6% |
| 35 to 44 Years | 696 | 13.7% |
| 45 to 54 Years | 387 | 7.6% |
| 55 to 64 Years | 1,015 | 20.0% |
| 65 to 74 Years | 587 | 11.5% |
| 75 to 84 Years | 318 | 6.2% |
| 85 Years and Over | 118 | 2.3% |
| Total | 5,086 | 100.0% |
Housing Finances in Milledgeville
Median Income by Occupancy in Milledgeville
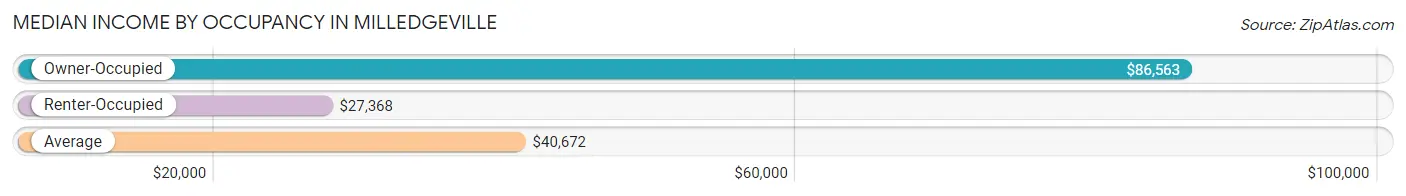
| Occupancy Type | # Households | Median Income |
| Owner-Occupied | 1,756 (34.5%) | $86,563 |
| Renter-Occupied | 3,330 (65.5%) | $27,368 |
| Average | 5,086 (100.0%) | $40,672 |
Occupancy by Householder Income Bracket in Milledgeville
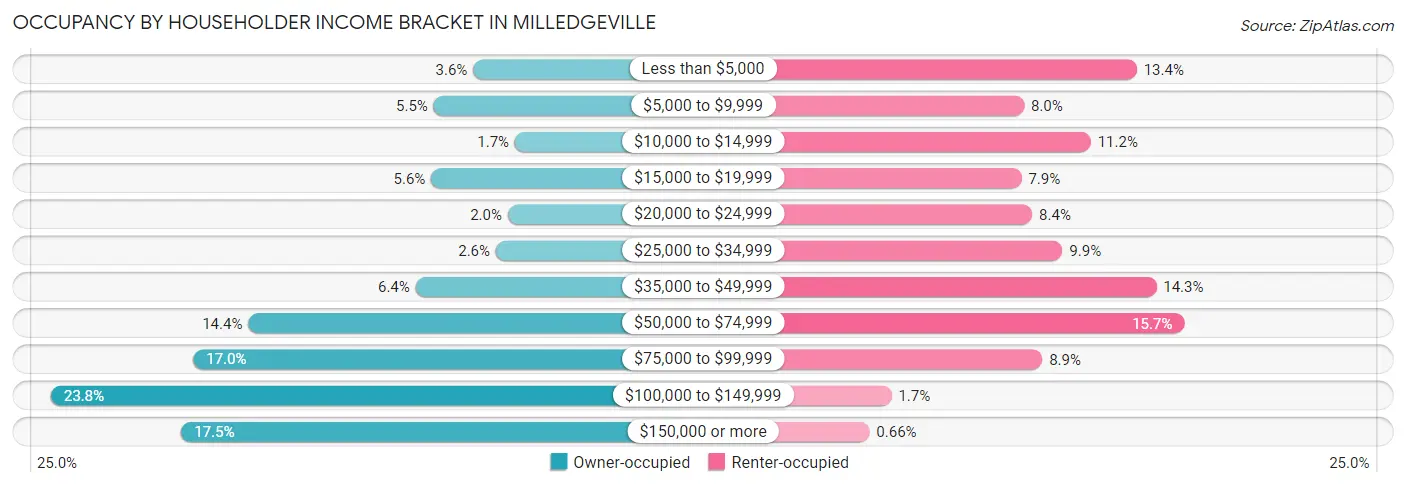
| Income Bracket | Owner-occupied | Renter-occupied |
| Less than $5,000 | 64 (3.6%) | 446 (13.4%) |
| $5,000 to $9,999 | 97 (5.5%) | 267 (8.0%) |
| $10,000 to $14,999 | 29 (1.7%) | 373 (11.2%) |
| $15,000 to $19,999 | 99 (5.6%) | 263 (7.9%) |
| $20,000 to $24,999 | 35 (2.0%) | 280 (8.4%) |
| $25,000 to $34,999 | 45 (2.6%) | 328 (9.9%) |
| $35,000 to $49,999 | 112 (6.4%) | 477 (14.3%) |
| $50,000 to $74,999 | 252 (14.3%) | 521 (15.7%) |
| $75,000 to $99,999 | 298 (17.0%) | 296 (8.9%) |
| $100,000 to $149,999 | 417 (23.7%) | 57 (1.7%) |
| $150,000 or more | 308 (17.5%) | 22 (0.7%) |
| Total | 1,756 (100.0%) | 3,330 (100.0%) |
Monthly Housing Cost Tiers in Milledgeville
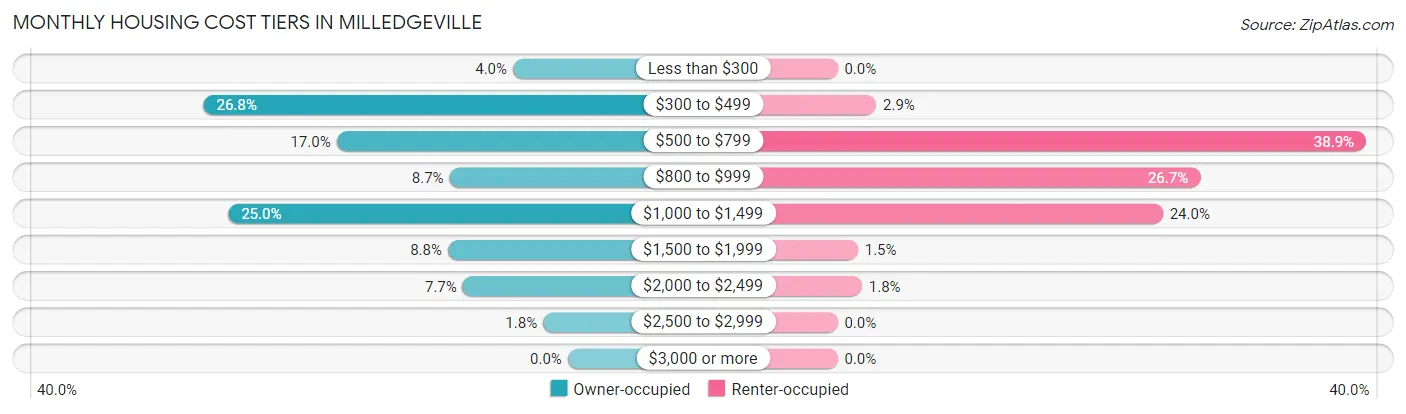
| Monthly Cost | Owner-occupied | Renter-occupied |
| Less than $300 | 71 (4.0%) | 0 (0.0%) |
| $300 to $499 | 471 (26.8%) | 95 (2.9%) |
| $500 to $799 | 299 (17.0%) | 1,296 (38.9%) |
| $800 to $999 | 153 (8.7%) | 889 (26.7%) |
| $1,000 to $1,499 | 439 (25.0%) | 798 (24.0%) |
| $1,500 to $1,999 | 155 (8.8%) | 50 (1.5%) |
| $2,000 to $2,499 | 136 (7.7%) | 60 (1.8%) |
| $2,500 to $2,999 | 32 (1.8%) | 0 (0.0%) |
| $3,000 or more | 0 (0.0%) | 0 (0.0%) |
| Total | 1,756 (100.0%) | 3,330 (100.0%) |
Physical Housing Characteristics in Milledgeville
Housing Structures in Milledgeville
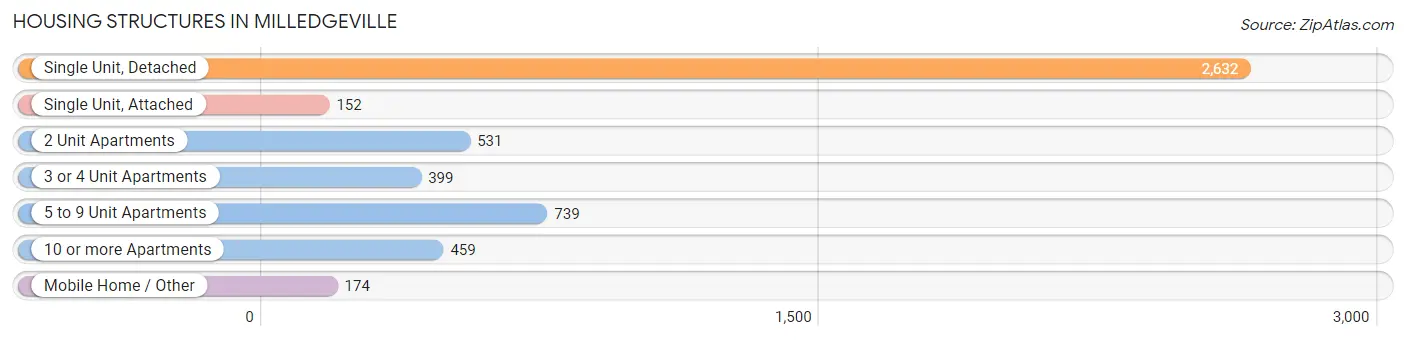
| Structure Type | # Housing Units | % Housing Units |
| Single Unit, Detached | 2,632 | 51.7% |
| Single Unit, Attached | 152 | 3.0% |
| 2 Unit Apartments | 531 | 10.4% |
| 3 or 4 Unit Apartments | 399 | 7.9% |
| 5 to 9 Unit Apartments | 739 | 14.5% |
| 10 or more Apartments | 459 | 9.0% |
| Mobile Home / Other | 174 | 3.4% |
| Total | 5,086 | 100.0% |
Housing Structures by Occupancy in Milledgeville
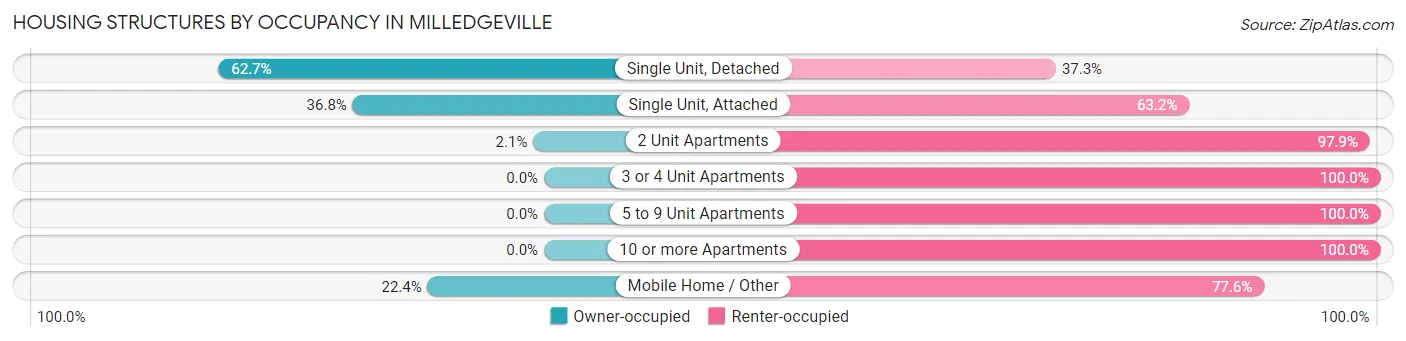
| Structure Type | Owner-occupied | Renter-occupied |
| Single Unit, Detached | 1,650 (62.7%) | 982 (37.3%) |
| Single Unit, Attached | 56 (36.8%) | 96 (63.2%) |
| 2 Unit Apartments | 11 (2.1%) | 520 (97.9%) |
| 3 or 4 Unit Apartments | 0 (0.0%) | 399 (100.0%) |
| 5 to 9 Unit Apartments | 0 (0.0%) | 739 (100.0%) |
| 10 or more Apartments | 0 (0.0%) | 459 (100.0%) |
| Mobile Home / Other | 39 (22.4%) | 135 (77.6%) |
| Total | 1,756 (34.5%) | 3,330 (65.5%) |
Housing Structures by Number of Rooms in Milledgeville
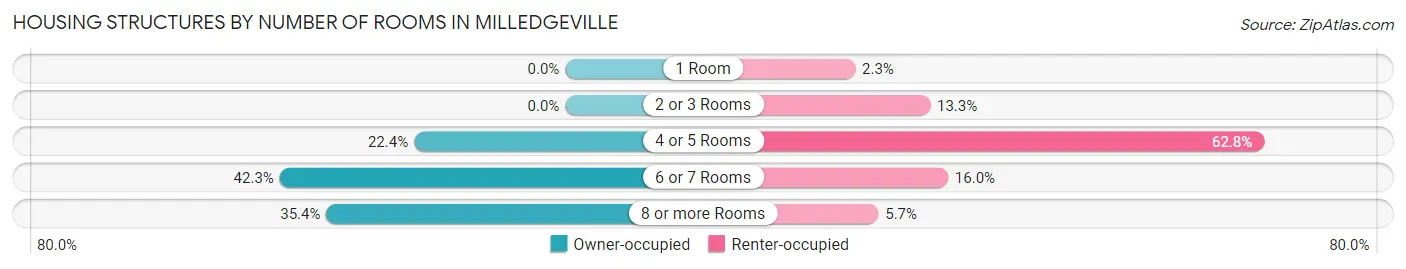
| Number of Rooms | Owner-occupied | Renter-occupied |
| 1 Room | 0 (0.0%) | 75 (2.2%) |
| 2 or 3 Rooms | 0 (0.0%) | 444 (13.3%) |
| 4 or 5 Rooms | 393 (22.4%) | 2,090 (62.8%) |
| 6 or 7 Rooms | 742 (42.3%) | 532 (16.0%) |
| 8 or more Rooms | 621 (35.4%) | 189 (5.7%) |
| Total | 1,756 (100.0%) | 3,330 (100.0%) |
Housing Structure by Heating Type in Milledgeville
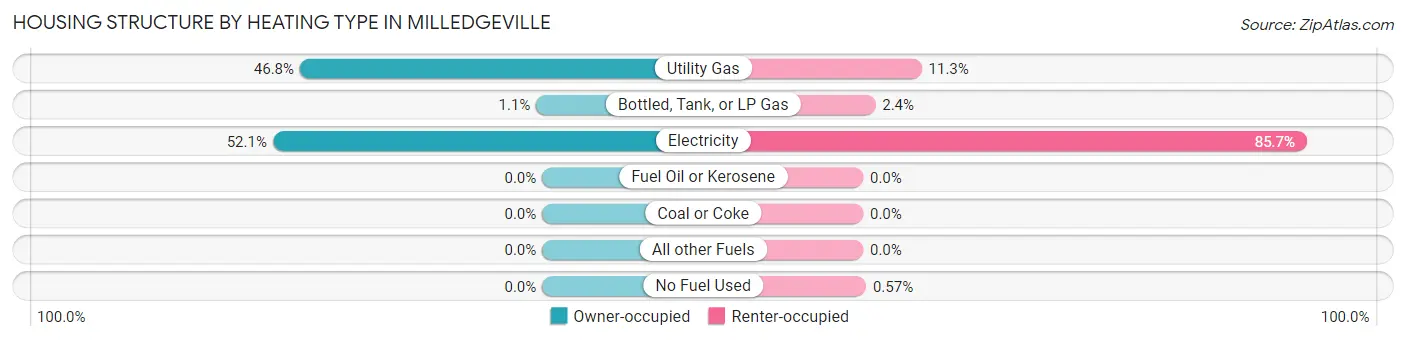
| Heating Type | Owner-occupied | Renter-occupied |
| Utility Gas | 822 (46.8%) | 377 (11.3%) |
| Bottled, Tank, or LP Gas | 20 (1.1%) | 79 (2.4%) |
| Electricity | 914 (52.0%) | 2,855 (85.7%) |
| Fuel Oil or Kerosene | 0 (0.0%) | 0 (0.0%) |
| Coal or Coke | 0 (0.0%) | 0 (0.0%) |
| All other Fuels | 0 (0.0%) | 0 (0.0%) |
| No Fuel Used | 0 (0.0%) | 19 (0.6%) |
| Total | 1,756 (100.0%) | 3,330 (100.0%) |
Household Vehicle Usage in Milledgeville
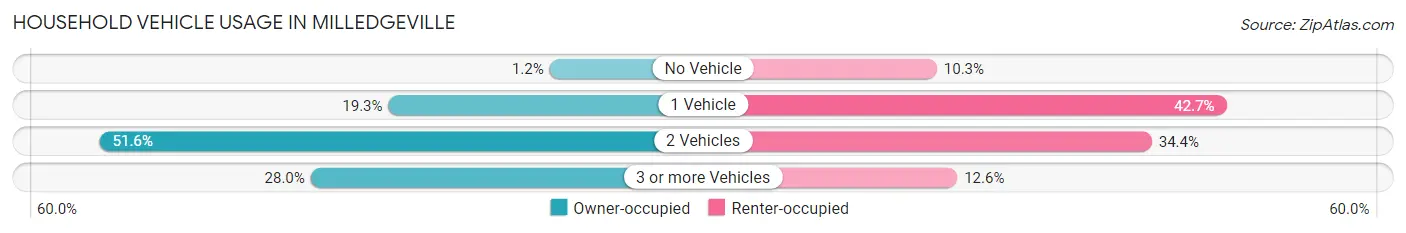
| Vehicles per Household | Owner-occupied | Renter-occupied |
| No Vehicle | 21 (1.2%) | 343 (10.3%) |
| 1 Vehicle | 338 (19.3%) | 1,423 (42.7%) |
| 2 Vehicles | 906 (51.6%) | 1,145 (34.4%) |
| 3 or more Vehicles | 491 (28.0%) | 419 (12.6%) |
| Total | 1,756 (100.0%) | 3,330 (100.0%) |
Real Estate & Mortgages in Milledgeville
Real Estate and Mortgage Overview in Milledgeville
| Characteristic | Without Mortgage | With Mortgage |
| Housing Units | 877 | 879 |
| Median Property Value | $164,400 | $159,200 |
| Median Household Income | $67,708 | $185 |
| Monthly Housing Costs | $468 | $0 |
| Real Estate Taxes | $1,496 | $90 |
Property Value by Mortgage Status in Milledgeville
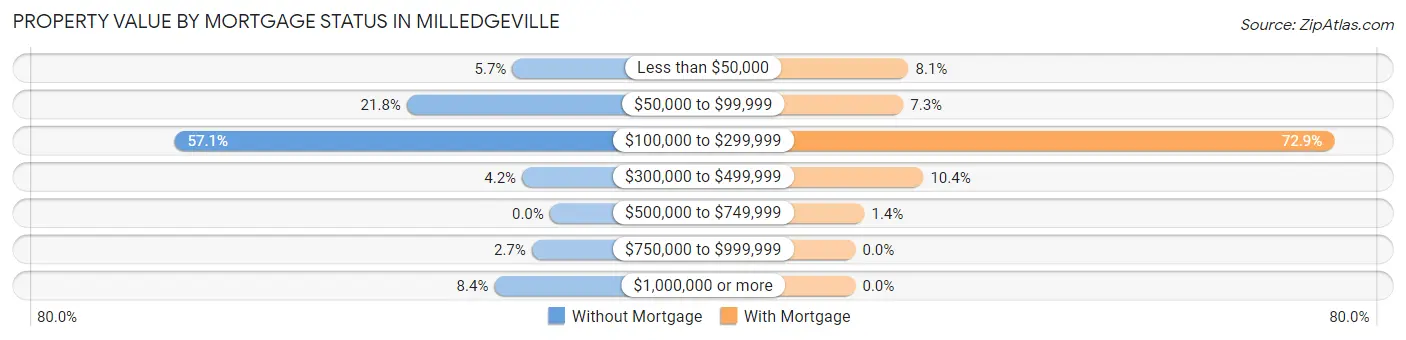
| Property Value | Without Mortgage | With Mortgage |
| Less than $50,000 | 50 (5.7%) | 71 (8.1%) |
| $50,000 to $99,999 | 191 (21.8%) | 64 (7.3%) |
| $100,000 to $299,999 | 501 (57.1%) | 641 (72.9%) |
| $300,000 to $499,999 | 37 (4.2%) | 91 (10.3%) |
| $500,000 to $749,999 | 0 (0.0%) | 12 (1.4%) |
| $750,000 to $999,999 | 24 (2.7%) | 0 (0.0%) |
| $1,000,000 or more | 74 (8.4%) | 0 (0.0%) |
| Total | 877 (100.0%) | 879 (100.0%) |
Household Income by Mortgage Status in Milledgeville
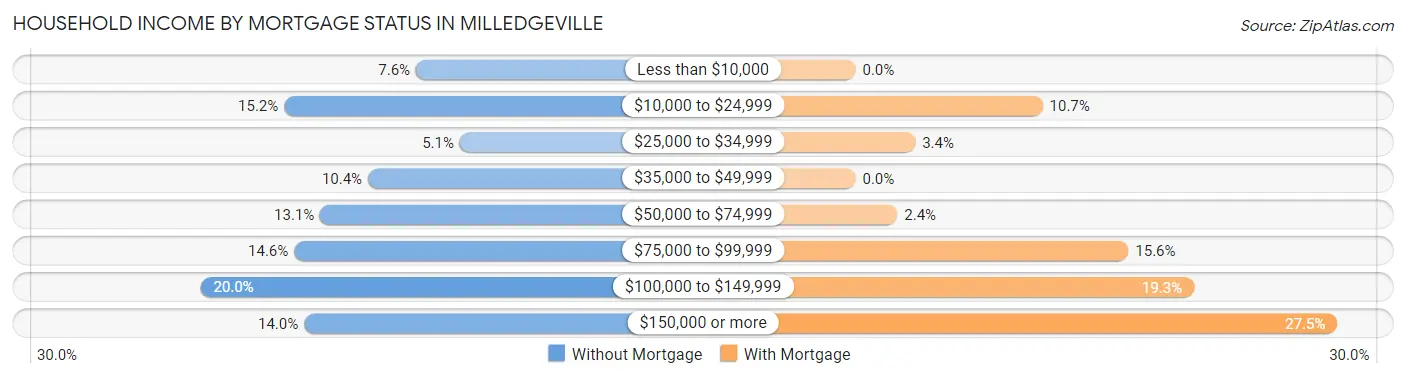
| Household Income | Without Mortgage | With Mortgage |
| Less than $10,000 | 67 (7.6%) | 0 (0.0%) |
| $10,000 to $24,999 | 133 (15.2%) | 94 (10.7%) |
| $25,000 to $34,999 | 45 (5.1%) | 30 (3.4%) |
| $35,000 to $49,999 | 91 (10.4%) | 0 (0.0%) |
| $50,000 to $74,999 | 115 (13.1%) | 21 (2.4%) |
| $75,000 to $99,999 | 128 (14.6%) | 137 (15.6%) |
| $100,000 to $149,999 | 175 (20.0%) | 170 (19.3%) |
| $150,000 or more | 123 (14.0%) | 242 (27.5%) |
| Total | 877 (100.0%) | 879 (100.0%) |
Property Value to Household Income Ratio in Milledgeville
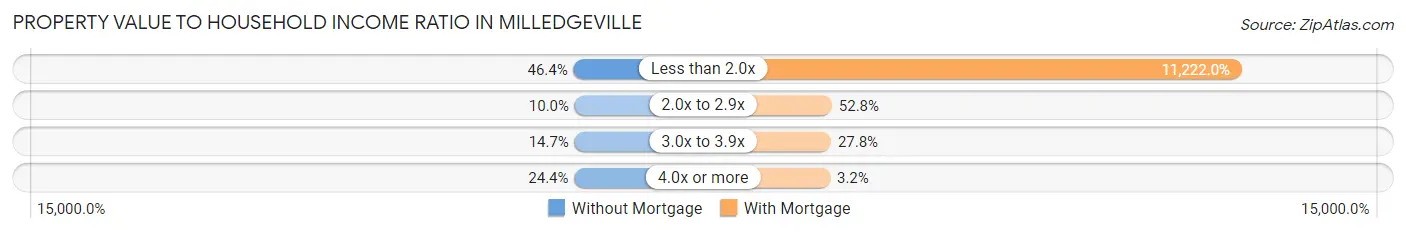
| Value-to-Income Ratio | Without Mortgage | With Mortgage |
| Less than 2.0x | 407 (46.4%) | 98,641 (11,222.0%) |
| 2.0x to 2.9x | 88 (10.0%) | 464 (52.8%) |
| 3.0x to 3.9x | 129 (14.7%) | 244 (27.8%) |
| 4.0x or more | 214 (24.4%) | 28 (3.2%) |
| Total | 877 (100.0%) | 879 (100.0%) |
Real Estate Taxes by Mortgage Status in Milledgeville
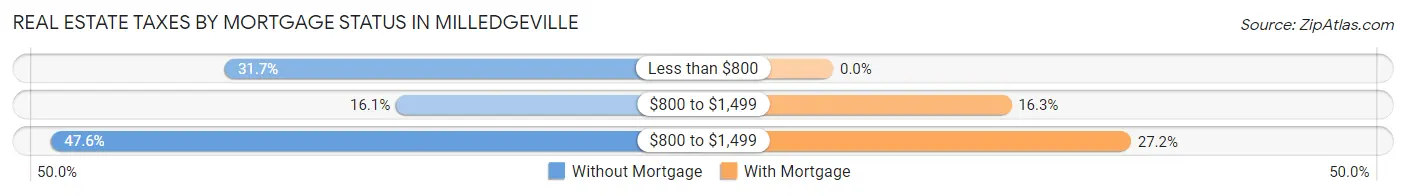
| Property Taxes | Without Mortgage | With Mortgage |
| Less than $800 | 278 (31.7%) | 0 (0.0%) |
| $800 to $1,499 | 141 (16.1%) | 143 (16.3%) |
| $800 to $1,499 | 417 (47.5%) | 239 (27.2%) |
| Total | 877 (100.0%) | 879 (100.0%) |
Health & Disability in Milledgeville
Health Insurance Coverage by Age in Milledgeville
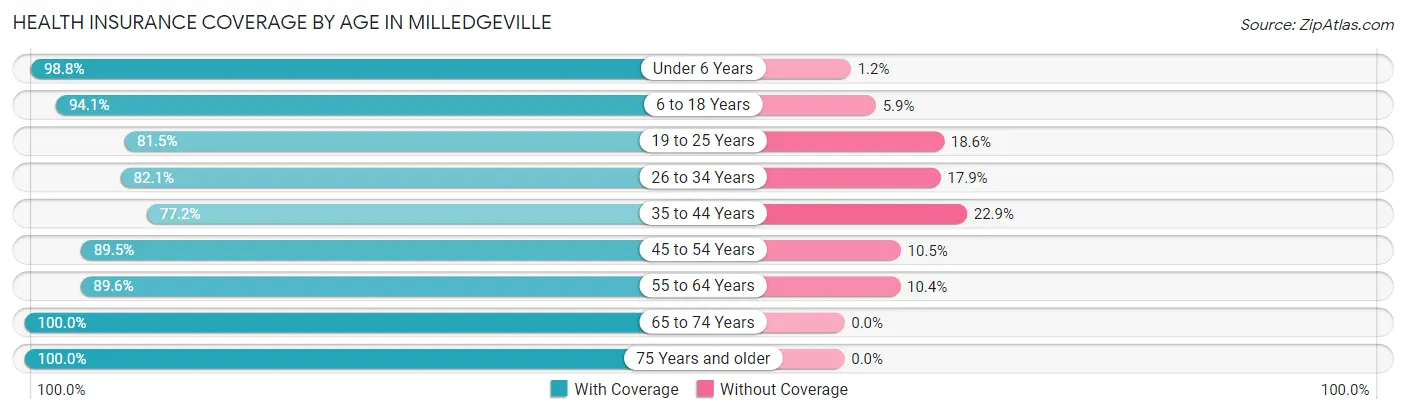
| Age Bracket | With Coverage | Without Coverage |
| Under 6 Years | 657 (98.8%) | 8 (1.2%) |
| 6 to 18 Years | 2,475 (94.1%) | 154 (5.9%) |
| 19 to 25 Years | 3,727 (81.5%) | 849 (18.5%) |
| 26 to 34 Years | 1,603 (82.1%) | 350 (17.9%) |
| 35 to 44 Years | 834 (77.1%) | 247 (22.9%) |
| 45 to 54 Years | 741 (89.5%) | 87 (10.5%) |
| 55 to 64 Years | 1,327 (89.6%) | 154 (10.4%) |
| 65 to 74 Years | 805 (100.0%) | 0 (0.0%) |
| 75 Years and older | 666 (100.0%) | 0 (0.0%) |
| Total | 12,835 (87.4%) | 1,849 (12.6%) |
Health Insurance Coverage by Citizenship Status in Milledgeville
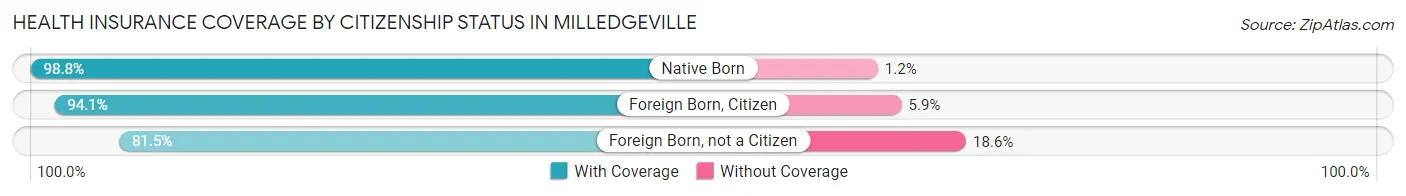
| Citizenship Status | With Coverage | Without Coverage |
| Native Born | 657 (98.8%) | 8 (1.2%) |
| Foreign Born, Citizen | 2,475 (94.1%) | 154 (5.9%) |
| Foreign Born, not a Citizen | 3,727 (81.5%) | 849 (18.5%) |
Health Insurance Coverage by Household Income in Milledgeville
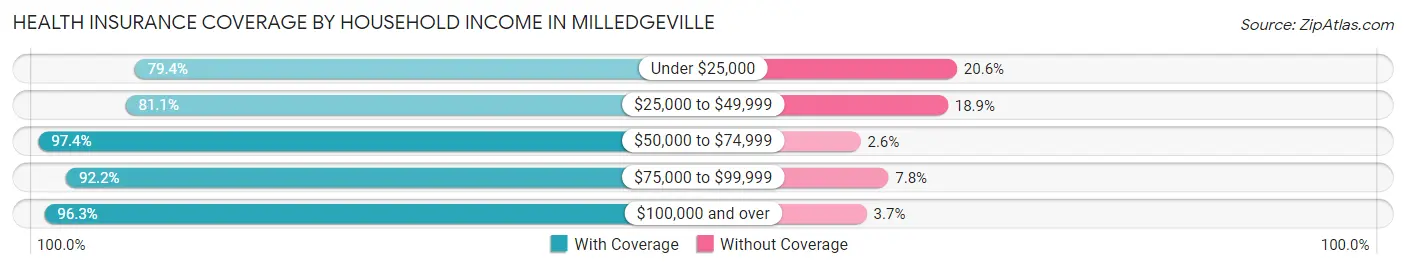
| Household Income | With Coverage | Without Coverage |
| Under $25,000 | 3,082 (79.4%) | 801 (20.6%) |
| $25,000 to $49,999 | 1,817 (81.1%) | 424 (18.9%) |
| $50,000 to $74,999 | 1,819 (97.4%) | 48 (2.6%) |
| $75,000 to $99,999 | 1,668 (92.2%) | 141 (7.8%) |
| $100,000 and over | 2,305 (96.3%) | 89 (3.7%) |
Public vs Private Health Insurance Coverage by Age in Milledgeville
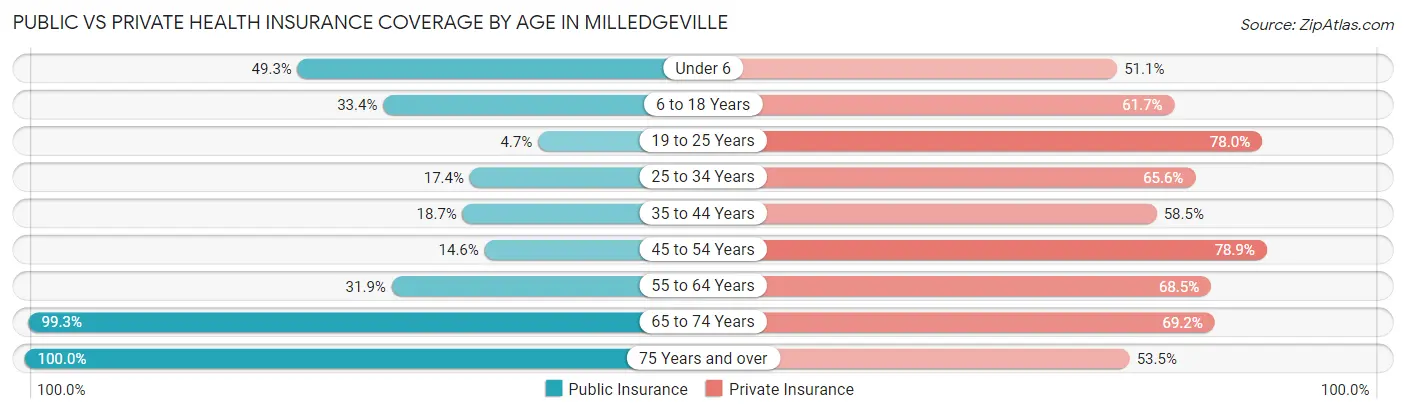
| Age Bracket | Public Insurance | Private Insurance |
| Under 6 | 328 (49.3%) | 340 (51.1%) |
| 6 to 18 Years | 879 (33.4%) | 1,623 (61.7%) |
| 19 to 25 Years | 215 (4.7%) | 3,569 (78.0%) |
| 25 to 34 Years | 339 (17.4%) | 1,281 (65.6%) |
| 35 to 44 Years | 202 (18.7%) | 632 (58.5%) |
| 45 to 54 Years | 121 (14.6%) | 653 (78.9%) |
| 55 to 64 Years | 472 (31.9%) | 1,015 (68.5%) |
| 65 to 74 Years | 799 (99.3%) | 557 (69.2%) |
| 75 Years and over | 666 (100.0%) | 356 (53.4%) |
| Total | 4,021 (27.4%) | 10,026 (68.3%) |
Disability Status by Sex by Age in Milledgeville
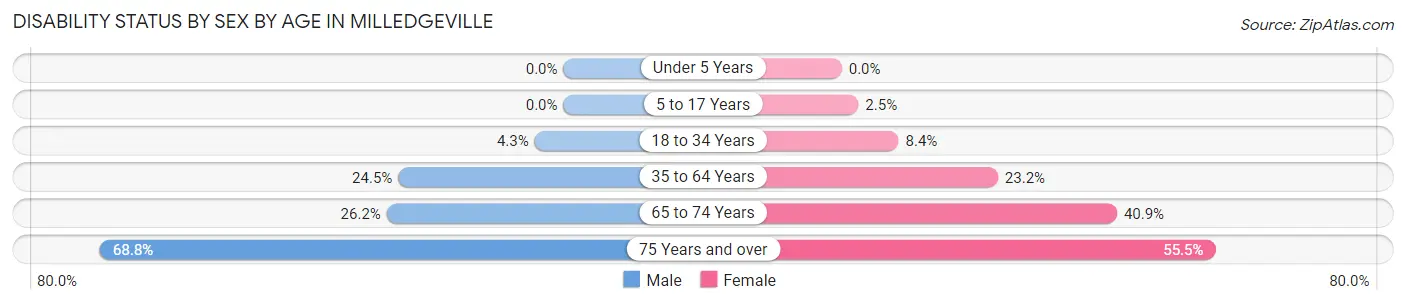
| Age Bracket | Male | Female |
| Under 5 Years | 0 (0.0%) | 0 (0.0%) |
| 5 to 17 Years | 0 (0.0%) | 19 (2.5%) |
| 18 to 34 Years | 159 (4.3%) | 337 (8.4%) |
| 35 to 64 Years | 349 (24.5%) | 456 (23.2%) |
| 65 to 74 Years | 95 (26.2%) | 181 (40.9%) |
| 75 Years and over | 225 (68.8%) | 188 (55.5%) |
Disability Class by Sex by Age in Milledgeville
Disability Class: Hearing Difficulty
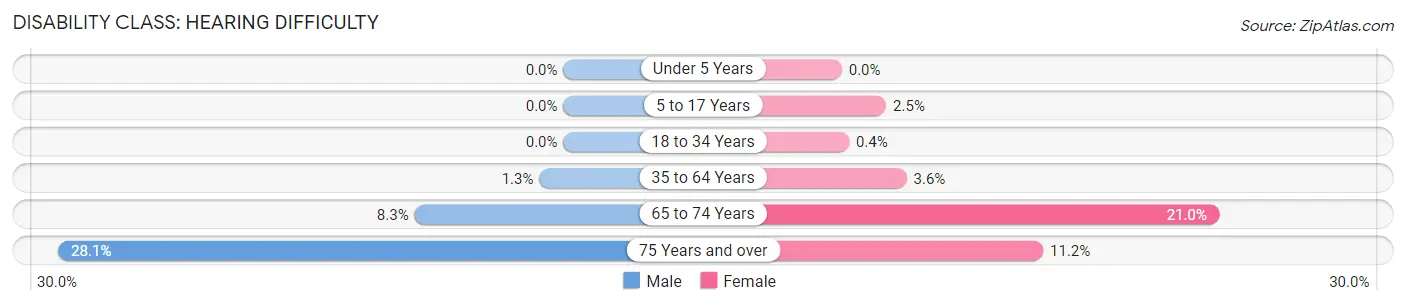
| Age Bracket | Male | Female |
| Under 5 Years | 0 (0.0%) | 0 (0.0%) |
| 5 to 17 Years | 0 (0.0%) | 19 (2.5%) |
| 18 to 34 Years | 0 (0.0%) | 16 (0.4%) |
| 35 to 64 Years | 19 (1.3%) | 71 (3.6%) |
| 65 to 74 Years | 30 (8.3%) | 93 (21.0%) |
| 75 Years and over | 92 (28.1%) | 38 (11.2%) |
Disability Class: Vision Difficulty
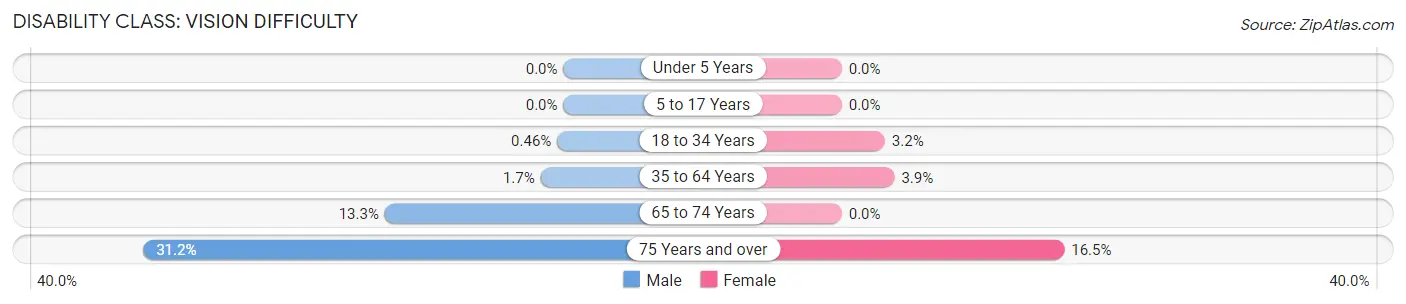
| Age Bracket | Male | Female |
| Under 5 Years | 0 (0.0%) | 0 (0.0%) |
| 5 to 17 Years | 0 (0.0%) | 0 (0.0%) |
| 18 to 34 Years | 17 (0.5%) | 128 (3.2%) |
| 35 to 64 Years | 24 (1.7%) | 77 (3.9%) |
| 65 to 74 Years | 48 (13.3%) | 0 (0.0%) |
| 75 Years and over | 102 (31.2%) | 56 (16.5%) |
Disability Class: Cognitive Difficulty
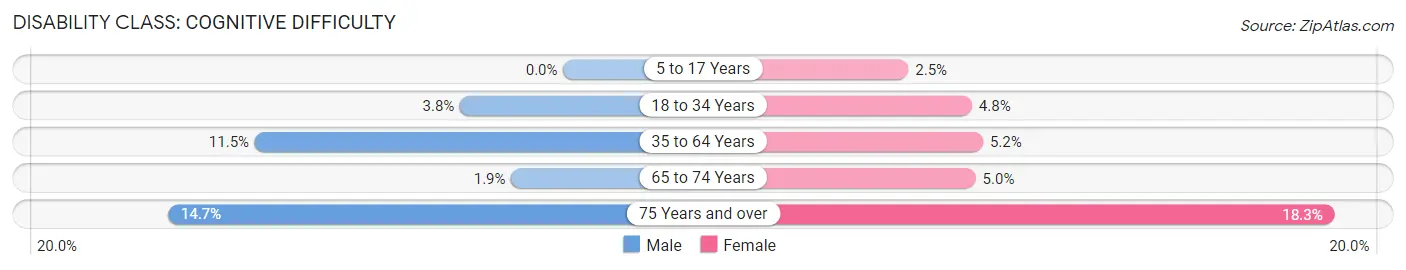
| Age Bracket | Male | Female |
| 5 to 17 Years | 0 (0.0%) | 19 (2.5%) |
| 18 to 34 Years | 142 (3.8%) | 193 (4.8%) |
| 35 to 64 Years | 163 (11.5%) | 103 (5.2%) |
| 65 to 74 Years | 7 (1.9%) | 22 (5.0%) |
| 75 Years and over | 48 (14.7%) | 62 (18.3%) |
Disability Class: Ambulatory Difficulty
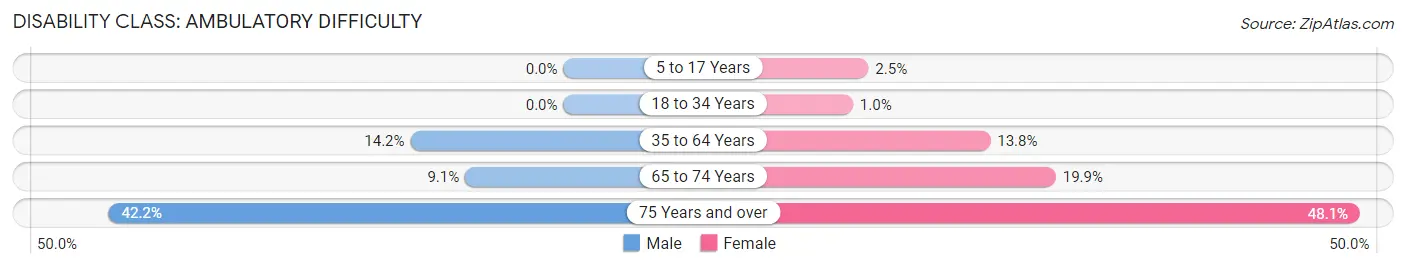
| Age Bracket | Male | Female |
| 5 to 17 Years | 0 (0.0%) | 19 (2.5%) |
| 18 to 34 Years | 0 (0.0%) | 41 (1.0%) |
| 35 to 64 Years | 202 (14.2%) | 271 (13.8%) |
| 65 to 74 Years | 33 (9.1%) | 88 (19.9%) |
| 75 Years and over | 138 (42.2%) | 163 (48.1%) |
Disability Class: Self-Care Difficulty
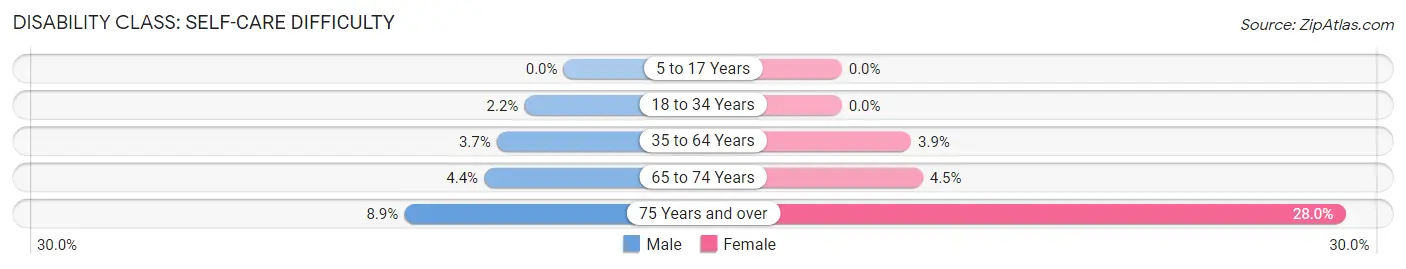
| Age Bracket | Male | Female |
| 5 to 17 Years | 0 (0.0%) | 0 (0.0%) |
| 18 to 34 Years | 81 (2.2%) | 0 (0.0%) |
| 35 to 64 Years | 53 (3.7%) | 76 (3.9%) |
| 65 to 74 Years | 16 (4.4%) | 20 (4.5%) |
| 75 Years and over | 29 (8.9%) | 95 (28.0%) |
Technology Access in Milledgeville
Computing Device Access in Milledgeville
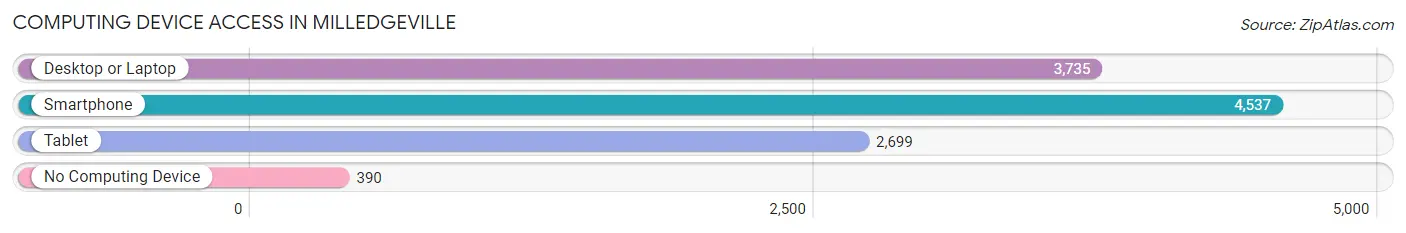
| Device Type | # Households | % Households |
| Desktop or Laptop | 3,735 | 73.4% |
| Smartphone | 4,537 | 89.2% |
| Tablet | 2,699 | 53.1% |
| No Computing Device | 390 | 7.7% |
| Total | 5,086 | 100.0% |
Internet Access in Milledgeville
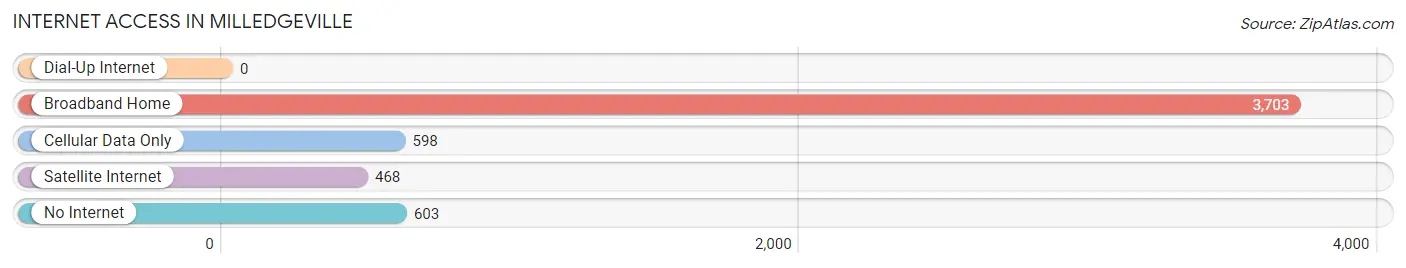
| Internet Type | # Households | % Households |
| Dial-Up Internet | 0 | 0.0% |
| Broadband Home | 3,703 | 72.8% |
| Cellular Data Only | 598 | 11.8% |
| Satellite Internet | 468 | 9.2% |
| No Internet | 603 | 11.9% |
| Total | 5,086 | 100.0% |
Milledgeville Summary
Milledgeville is a city located in the U.S. state of Georgia. It is the county seat of Baldwin County and is located in the central part of the state, about 90 miles southeast of Atlanta. The city has a population of 18,717 as of the 2010 census.
History
Milledgeville was founded in 1803 as the new capital of Georgia. It was named after John Milledge, the governor of Georgia at the time. The city was designed by surveyor John Habersham and was laid out in a grid pattern with wide streets and public squares. The city quickly became a center of government and commerce and was the site of the state legislature and the governor’s mansion.
During the Civil War, Milledgeville was the capital of the Confederate state of Georgia. The city was occupied by Union forces in 1864 and was the site of a major battle. After the war, the city was in decline until the late 19th century when it began to experience a revival. The city was the site of the Georgia State Normal School, which later became Georgia College & State University.
Geography
Milledgeville is located in the central part of Georgia, about 90 miles southeast of Atlanta. The city is situated on the Oconee River and is surrounded by rolling hills and forests. The city has a total area of 11.2 square miles, of which 11.1 square miles is land and 0.1 square miles is water.
Climate
Milledgeville has a humid subtropical climate, with hot, humid summers and mild winters. The average annual temperature is 64°F, with an average high of 87°F in July and an average low of 41°F in January. The average annual precipitation is 49.3 inches, with the wettest month being June, when an average of 6.3 inches of rain falls.
Economy
Milledgeville’s economy is largely based on government and education. The city is home to Georgia College & State University, which is the fifth-largest employer in the city. Other major employers include the state government, the Baldwin County Board of Education, and the Oconee Regional Medical Center. The city also has a growing tourism industry, with many visitors coming to explore the city’s historic sites and natural beauty.
Demographics
As of the 2010 census, Milledgeville had a population of 18,717. The racial makeup of the city was 57.2% White, 36.2% African American, 0.4% Native American, 1.7% Asian, 0.1% Pacific Islander, 2.2% from other races, and 2.2% from two or more races. Hispanic or Latino of any race were 4.3% of the population.
The median income for a household in Milledgeville was $30,945, and the median income for a family was $41,945. The per capita income for the city was $17,845. About 17.2% of families and 22.2% of the population were below the poverty line, including 28.2% of those under age 18 and 16.2% of those age 65 or over.
Common Questions
What is Per Capita Income in Milledgeville?
Per Capita income in Milledgeville is $29,561.
What is the Median Family Income in Milledgeville?
Median Family Income in Milledgeville is $63,511.
What is the Median Household income in Milledgeville?
Median Household Income in Milledgeville is $40,672.
What is Income or Wage Gap in Milledgeville?
Income or Wage Gap in Milledgeville is 49.9%.
Women in Milledgeville earn 50.1 cents for every dollar earned by a man.
What is Family Income Deficit in Milledgeville?
Family Income Deficit in Milledgeville is $12,828.
Families that are below poverty line in Milledgeville earn $12,828 less on average than the poverty threshold level.
What is Inequality or Gini Index in Milledgeville?
Inequality or Gini Index in Milledgeville is 0.68.
What is the Total Population of Milledgeville?
Total Population of Milledgeville is 17,021.
What is the Total Male Population of Milledgeville?
Total Male Population of Milledgeville is 9,105.
What is the Total Female Population of Milledgeville?
Total Female Population of Milledgeville is 7,916.
What is the Ratio of Males per 100 Females in Milledgeville?
There are 115.02 Males per 100 Females in Milledgeville.
What is the Ratio of Females per 100 Males in Milledgeville?
There are 86.94 Females per 100 Males in Milledgeville.
What is the Median Population Age in Milledgeville?
Median Population Age in Milledgeville is 26.5 Years.
What is the Average Family Size in Milledgeville
Average Family Size in Milledgeville is 3.2 People.
What is the Average Household Size in Milledgeville
Average Household Size in Milledgeville is 2.4 People.
How Large is the Labor Force in Milledgeville?
There are 6,620 People in the Labor Forcein in Milledgeville.
What is the Percentage of People in the Labor Force in Milledgeville?
43.6% of People are in the Labor Force in Milledgeville.
What is the Unemployment Rate in Milledgeville?
Unemployment Rate in Milledgeville is 7.2%.