Skidmore, MO Map & Demographics
Skidmore Map
Skidmore Overview
$50,297
PER CAPITA INCOME
$73,750
AVG FAMILY INCOME
$41,544
AVG HOUSEHOLD INCOME
20.8%
WAGE / INCOME GAP [ % ]
79.2¢/ $1
WAGE / INCOME GAP [ $ ]
0.68
INEQUALITY / GINI INDEX
227
TOTAL POPULATION
110
MALE POPULATION
117
FEMALE POPULATION
94.02
MALES / 100 FEMALES
106.36
FEMALES / 100 MALES
43.9
MEDIAN AGE
3.3
AVG FAMILY SIZE
1.9
AVG HOUSEHOLD SIZE
108
LABOR FORCE [ PEOPLE ]
55.7%
PERCENT IN LABOR FORCE
6.5%
UNEMPLOYMENT RATE
Skidmore Zip Codes
Skidmore Area Codes
Income in Skidmore
Income Overview in Skidmore
Per Capita Income in Skidmore is $50,297, while median incomes of families and households are $73,750 and $41,544 respectively.
| Characteristic | Number | Measure |
| Per Capita Income | 227 | $50,297 |
| Median Family Income | 45 | $73,750 |
| Mean Family Income | 45 | $187,216 |
| Median Household Income | 117 | $41,544 |
| Mean Household Income | 117 | $95,785 |
| Income Deficit | 45 | $0 |
| Wage / Income Gap (%) | 227 | 20.79% |
| Wage / Income Gap ($) | 227 | 79.21¢ per $1 |
| Gini / Inequality Index | 227 | 0.68 |
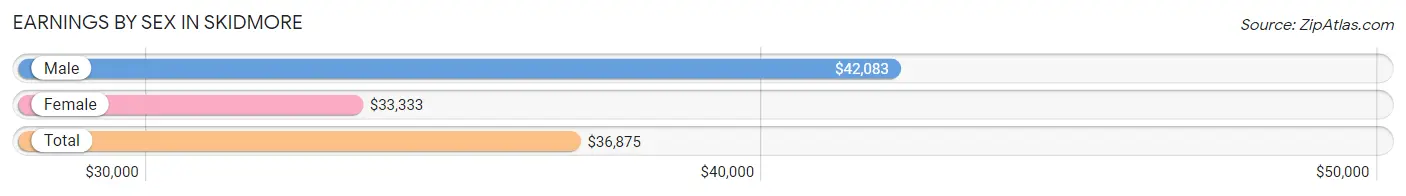
Earnings by Sex in Skidmore
Average Earnings in Skidmore are $36,875, $42,083 for men and $33,333 for women, a difference of 20.8%.
| Sex | Number | Average Earnings |
| Male | 54 (50.0%) | $42,083 |
| Female | 54 (50.0%) | $33,333 |
| Total | 108 (100.0%) | $36,875 |
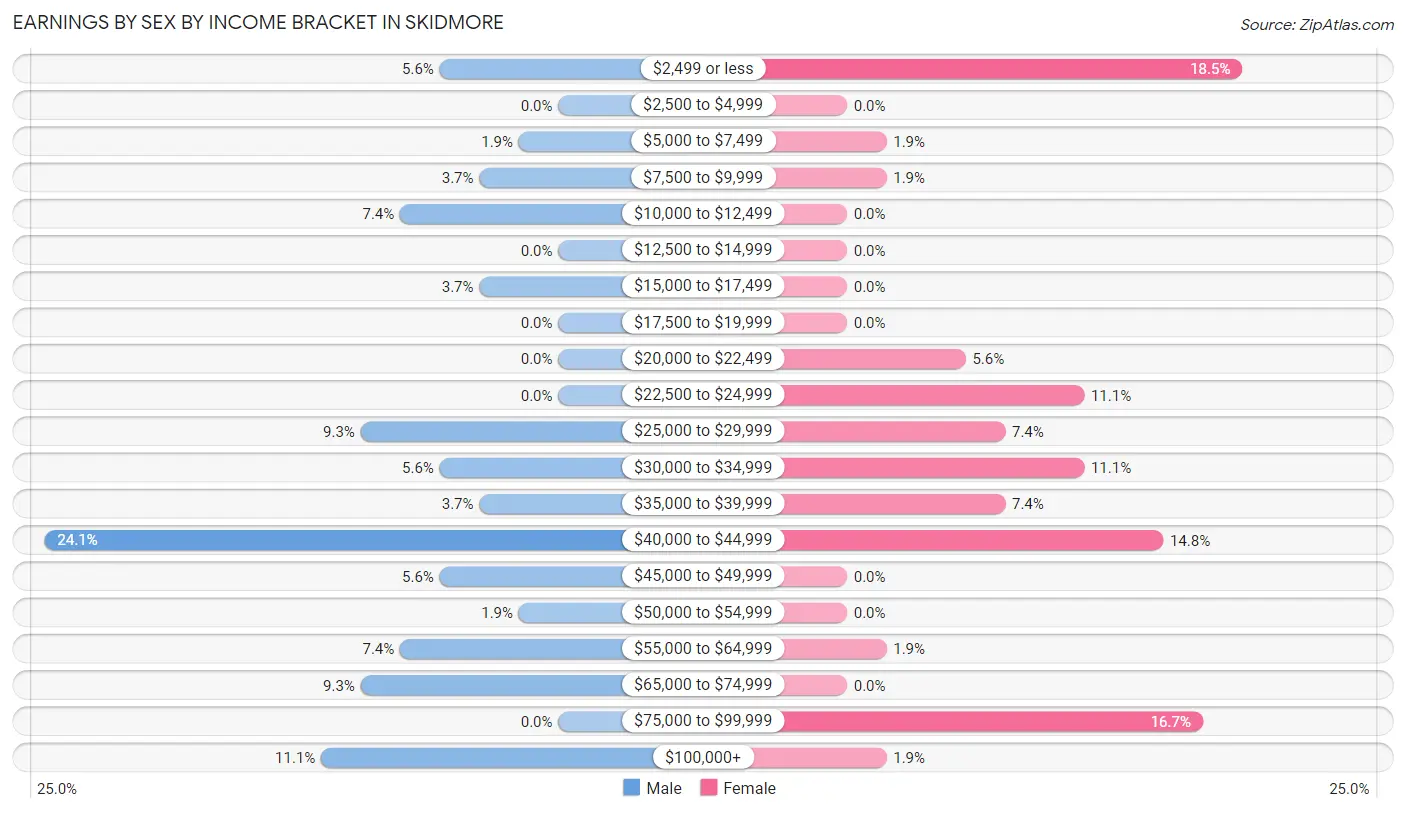
Earnings by Sex by Income Bracket in Skidmore
The most common earnings brackets in Skidmore are $40,000 to $44,999 for men (13 | 24.1%) and $2,499 or less for women (10 | 18.5%).
| Income | Male | Female |
| $2,499 or less | 3 (5.6%) | 10 (18.5%) |
| $2,500 to $4,999 | 0 (0.0%) | 0 (0.0%) |
| $5,000 to $7,499 | 1 (1.8%) | 1 (1.8%) |
| $7,500 to $9,999 | 2 (3.7%) | 1 (1.8%) |
| $10,000 to $12,499 | 4 (7.4%) | 0 (0.0%) |
| $12,500 to $14,999 | 0 (0.0%) | 0 (0.0%) |
| $15,000 to $17,499 | 2 (3.7%) | 0 (0.0%) |
| $17,500 to $19,999 | 0 (0.0%) | 0 (0.0%) |
| $20,000 to $22,499 | 0 (0.0%) | 3 (5.6%) |
| $22,500 to $24,999 | 0 (0.0%) | 6 (11.1%) |
| $25,000 to $29,999 | 5 (9.3%) | 4 (7.4%) |
| $30,000 to $34,999 | 3 (5.6%) | 6 (11.1%) |
| $35,000 to $39,999 | 2 (3.7%) | 4 (7.4%) |
| $40,000 to $44,999 | 13 (24.1%) | 8 (14.8%) |
| $45,000 to $49,999 | 3 (5.6%) | 0 (0.0%) |
| $50,000 to $54,999 | 1 (1.8%) | 0 (0.0%) |
| $55,000 to $64,999 | 4 (7.4%) | 1 (1.8%) |
| $65,000 to $74,999 | 5 (9.3%) | 0 (0.0%) |
| $75,000 to $99,999 | 0 (0.0%) | 9 (16.7%) |
| $100,000+ | 6 (11.1%) | 1 (1.8%) |
| Total | 54 (100.0%) | 54 (100.0%) |
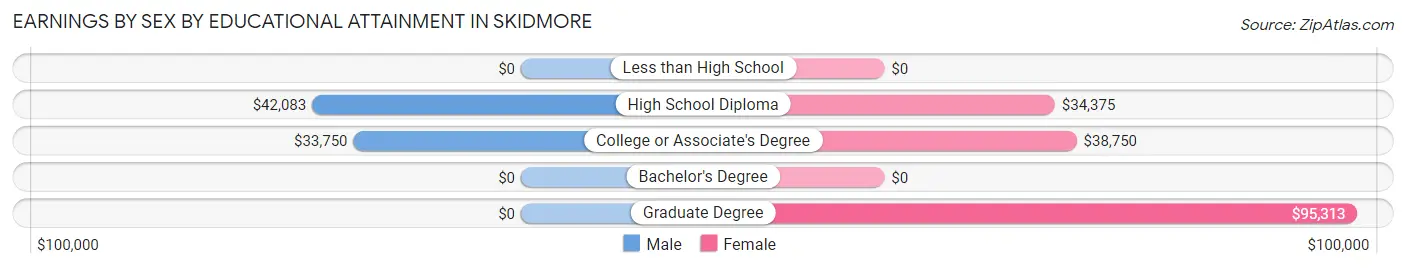
Earnings by Sex by Educational Attainment in Skidmore
Average earnings in Skidmore are $41,458 for men and $37,500 for women, a difference of 9.6%. Men with an educational attainment of high school diploma enjoy the highest average annual earnings of $42,083, while those with college or associate's degree education earn the least with $33,750. Women with an educational attainment of graduate degree earn the most with the average annual earnings of $95,313, while those with high school diploma education have the smallest earnings of $34,375.
| Educational Attainment | Male Income | Female Income |
| Less than High School | - | - |
| High School Diploma | $42,083 | $34,375 |
| College or Associate's Degree | $33,750 | $38,750 |
| Bachelor's Degree | - | - |
| Graduate Degree | - | - |
| Total | $41,458 | $37,500 |
Family Income in Skidmore
Family Income Brackets in Skidmore
According to the Skidmore family income data, there are 12 families falling into the $35,000 to $49,999 income range, which is the most common income bracket and makes up 26.7% of all families.
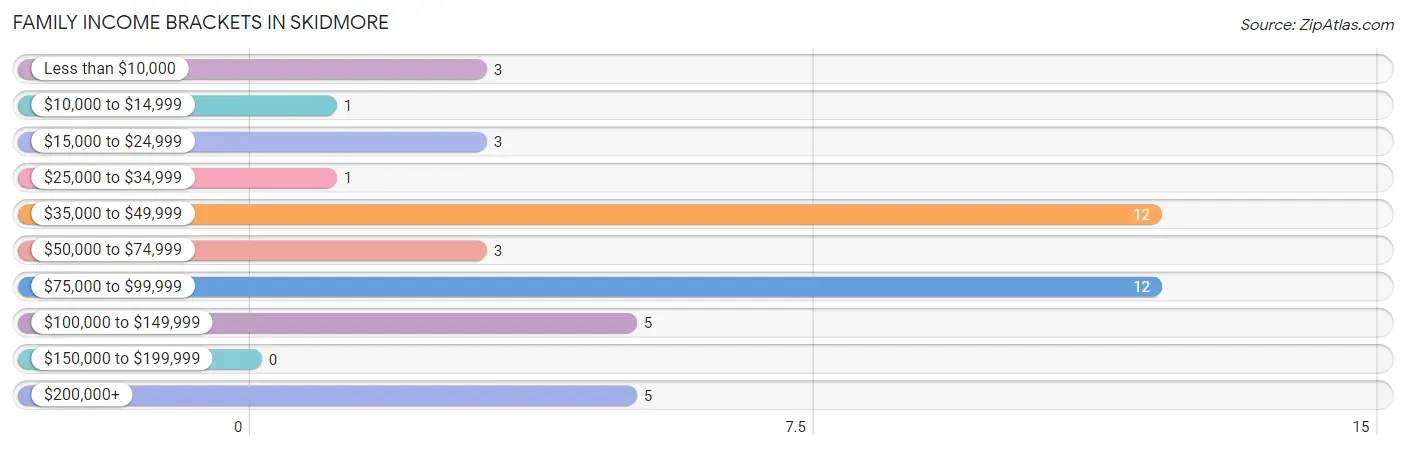
| Income Bracket | # Families | % Families |
| Less than $10,000 | 3 | 6.7% |
| $10,000 to $14,999 | 1 | 2.2% |
| $15,000 to $24,999 | 3 | 6.7% |
| $25,000 to $34,999 | 1 | 2.2% |
| $35,000 to $49,999 | 12 | 26.7% |
| $50,000 to $74,999 | 3 | 6.7% |
| $75,000 to $99,999 | 12 | 26.7% |
| $100,000 to $149,999 | 5 | 11.1% |
| $150,000 to $199,999 | 0 | 0.0% |
| $200,000+ | 5 | 11.1% |
Family Income by Famaliy Size in Skidmore
2-person families (29 | 64.4%) account for the highest median family income in Skidmore with $81,875 per family, while 2-person families (29 | 64.4%) have the highest median income of $40,938 per family member.
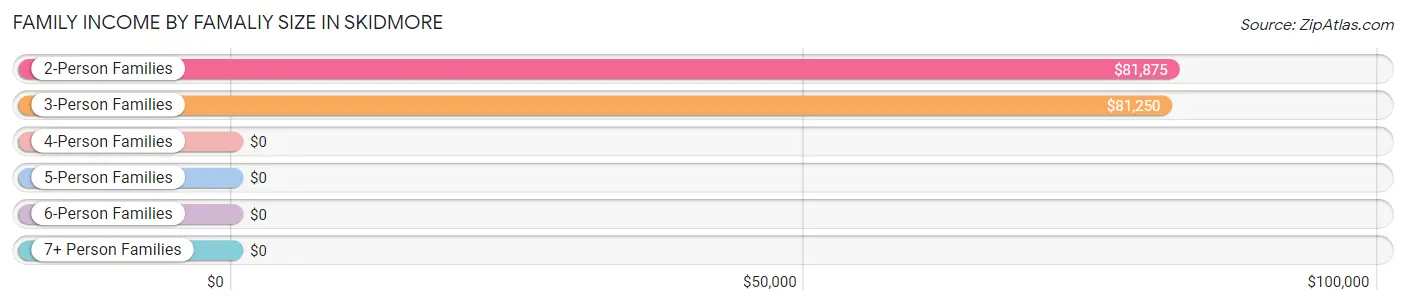
| Income Bracket | # Families | Median Income |
| 2-Person Families | 29 (64.4%) | $81,875 |
| 3-Person Families | 4 (8.9%) | $81,250 |
| 4-Person Families | 5 (11.1%) | $0 |
| 5-Person Families | 4 (8.9%) | $0 |
| 6-Person Families | 0 (0.0%) | $0 |
| 7+ Person Families | 3 (6.7%) | $0 |
| Total | 45 (100.0%) | $73,750 |
Family Income by Number of Earners in Skidmore
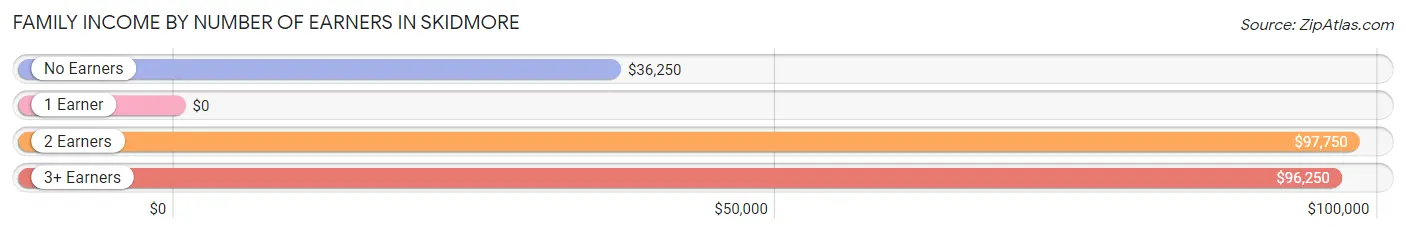
| Number of Earners | # Families | Median Income |
| No Earners | 13 (28.9%) | $36,250 |
| 1 Earner | 7 (15.6%) | $0 |
| 2 Earners | 21 (46.7%) | $97,750 |
| 3+ Earners | 4 (8.9%) | $96,250 |
| Total | 45 (100.0%) | $73,750 |
Household Income in Skidmore
Household Income Brackets in Skidmore
With 27 households falling in the category, the $35,000 to $49,999 income range is the most frequent in Skidmore, accounting for 23.1% of all households. In contrast, only 2 households (1.7%) fall into the $150,000 to $199,999 income bracket, making it the least populous group.
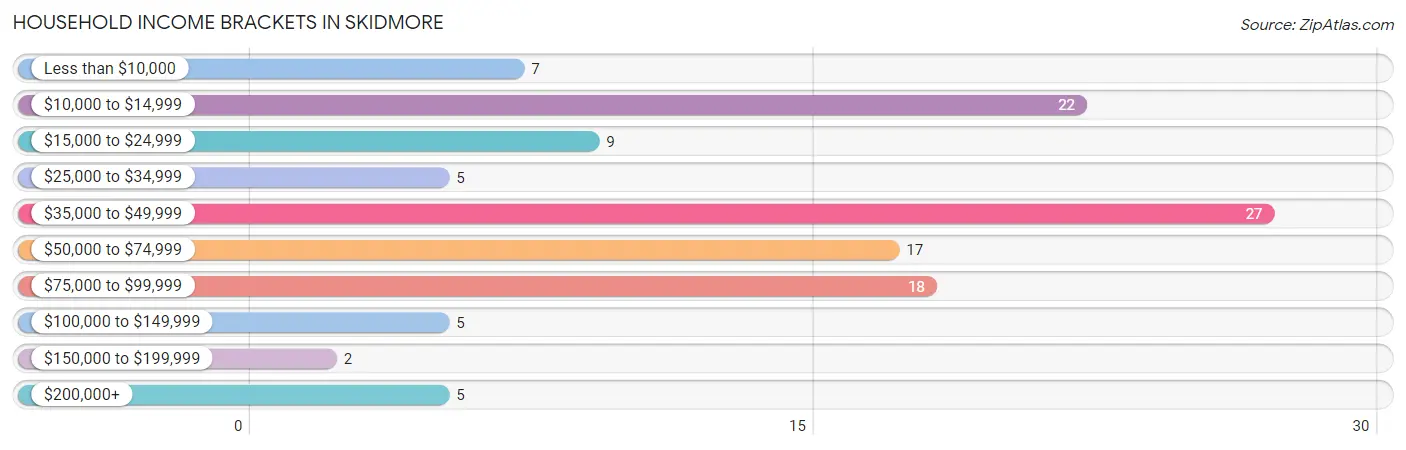
| Income Bracket | # Households | % Households |
| Less than $10,000 | 7 | 6.0% |
| $10,000 to $14,999 | 22 | 18.8% |
| $15,000 to $24,999 | 9 | 7.7% |
| $25,000 to $34,999 | 5 | 4.3% |
| $35,000 to $49,999 | 27 | 23.1% |
| $50,000 to $74,999 | 17 | 14.5% |
| $75,000 to $99,999 | 18 | 15.4% |
| $100,000 to $149,999 | 5 | 4.3% |
| $150,000 to $199,999 | 2 | 1.7% |
| $200,000+ | 5 | 4.3% |
Household Income by Householder Age in Skidmore
The median household income in Skidmore is $41,544, with the highest median household income of $73,750 found in the 45 to 64 years age bracket for the primary householder. A total of 45 households (38.5%) fall into this category. Meanwhile, the 15 to 24 years age bracket for the primary householder has the lowest median household income of $0, with 7 households (6.0%) in this group.
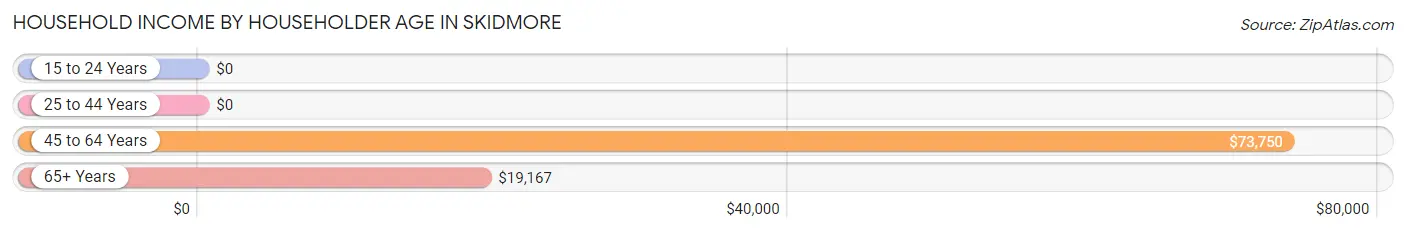
| Income Bracket | # Households | Median Income |
| 15 to 24 Years | 7 (6.0%) | $0 |
| 25 to 44 Years | 29 (24.8%) | $0 |
| 45 to 64 Years | 45 (38.5%) | $73,750 |
| 65+ Years | 36 (30.8%) | $19,167 |
| Total | 117 (100.0%) | $41,544 |
Poverty in Skidmore
Income Below Poverty by Sex and Age in Skidmore
With 25.5% poverty level for males and 35.9% for females among the residents of Skidmore, 6 to 11 year old males and 5 year old females are the most vulnerable to poverty, with 7 males (100.0%) and 2 females (100.0%) in their respective age groups living below the poverty level.
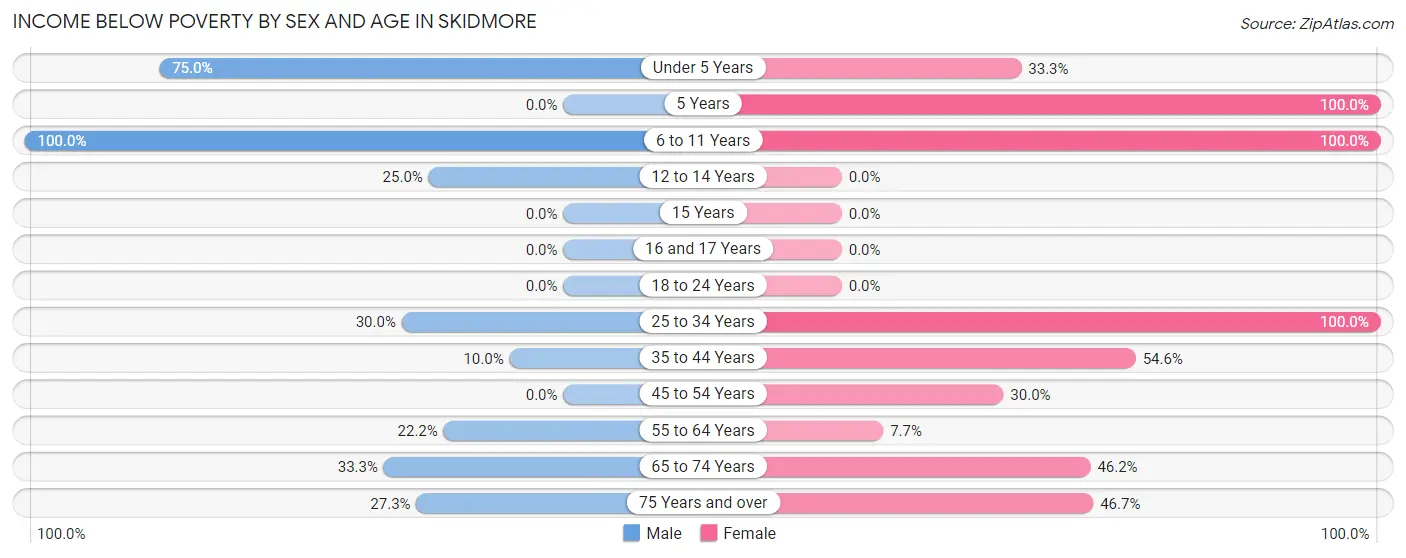
| Age Bracket | Male | Female |
| Under 5 Years | 3 (75.0%) | 1 (33.3%) |
| 5 Years | 0 (0.0%) | 2 (100.0%) |
| 6 to 11 Years | 7 (100.0%) | 4 (100.0%) |
| 12 to 14 Years | 2 (25.0%) | 0 (0.0%) |
| 15 Years | 0 (0.0%) | 0 (0.0%) |
| 16 and 17 Years | 0 (0.0%) | 0 (0.0%) |
| 18 to 24 Years | 0 (0.0%) | 0 (0.0%) |
| 25 to 34 Years | 6 (30.0%) | 5 (100.0%) |
| 35 to 44 Years | 1 (10.0%) | 12 (54.5%) |
| 45 to 54 Years | 0 (0.0%) | 3 (30.0%) |
| 55 to 64 Years | 2 (22.2%) | 2 (7.7%) |
| 65 to 74 Years | 4 (33.3%) | 6 (46.2%) |
| 75 Years and over | 3 (27.3%) | 7 (46.7%) |
| Total | 28 (25.5%) | 42 (35.9%) |
Income Above Poverty by Sex and Age in Skidmore
According to the poverty statistics in Skidmore, males aged 18 to 24 years and females aged 12 to 14 years are the age groups that are most secure financially, with 100.0% of males and 100.0% of females in these age groups living above the poverty line.
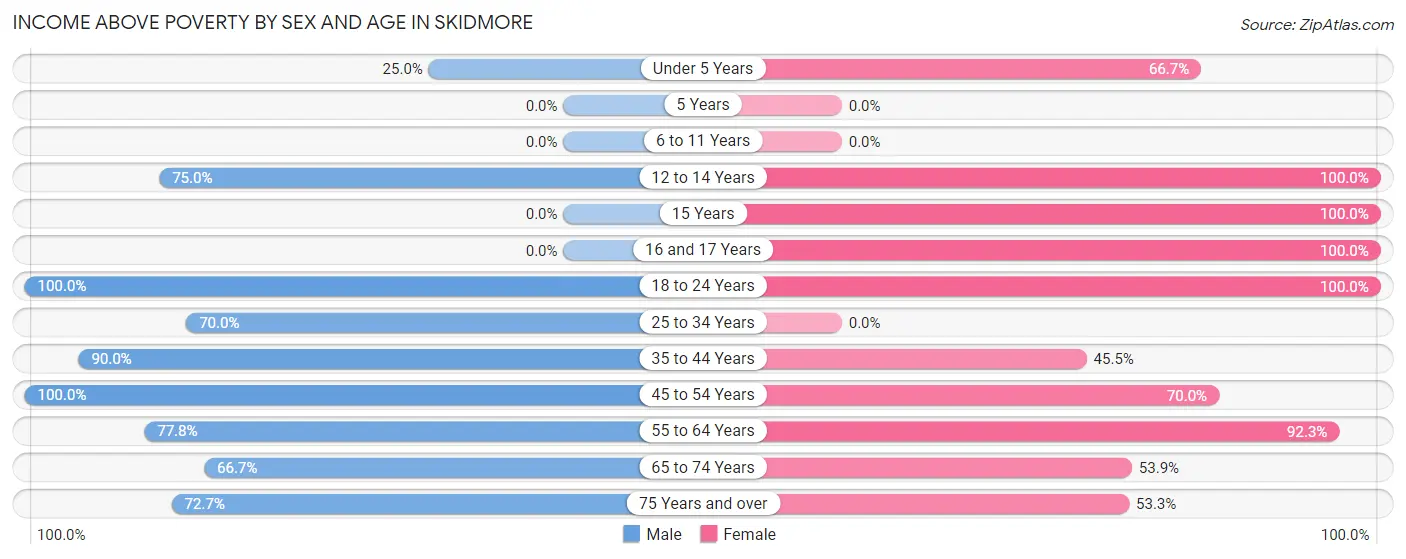
| Age Bracket | Male | Female |
| Under 5 Years | 1 (25.0%) | 2 (66.7%) |
| 5 Years | 0 (0.0%) | 0 (0.0%) |
| 6 to 11 Years | 0 (0.0%) | 0 (0.0%) |
| 12 to 14 Years | 6 (75.0%) | 4 (100.0%) |
| 15 Years | 0 (0.0%) | 1 (100.0%) |
| 16 and 17 Years | 0 (0.0%) | 5 (100.0%) |
| 18 to 24 Years | 13 (100.0%) | 7 (100.0%) |
| 25 to 34 Years | 14 (70.0%) | 0 (0.0%) |
| 35 to 44 Years | 9 (90.0%) | 10 (45.5%) |
| 45 to 54 Years | 16 (100.0%) | 7 (70.0%) |
| 55 to 64 Years | 7 (77.8%) | 24 (92.3%) |
| 65 to 74 Years | 8 (66.7%) | 7 (53.8%) |
| 75 Years and over | 8 (72.7%) | 8 (53.3%) |
| Total | 82 (74.6%) | 75 (64.1%) |
Income Below Poverty Among Married-Couple Families in Skidmore
The poverty statistics for married-couple families in Skidmore show that 17.6% or 6 of the total 34 families live below the poverty line. Families with 3 or 4 children have the highest poverty rate of 100.0%, comprising of 1 families. On the other hand, families with 1 or 2 children have the lowest poverty rate of 0.0%, which includes 0 families.
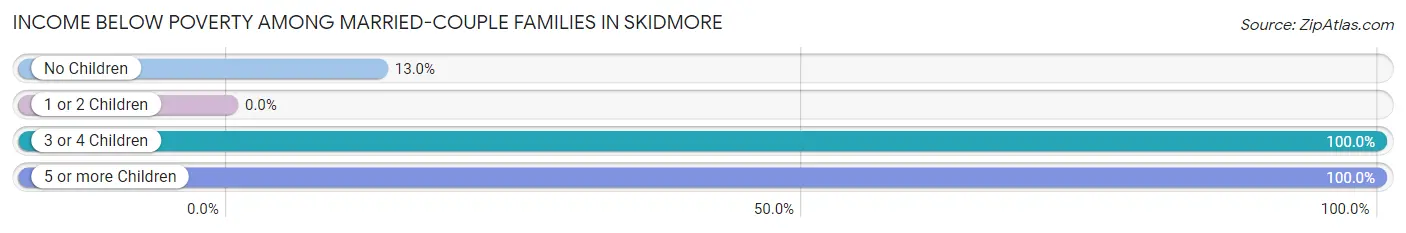
| Children | Above Poverty | Below Poverty |
| No Children | 20 (87.0%) | 3 (13.0%) |
| 1 or 2 Children | 8 (100.0%) | 0 (0.0%) |
| 3 or 4 Children | 0 (0.0%) | 1 (100.0%) |
| 5 or more Children | 0 (0.0%) | 2 (100.0%) |
| Total | 28 (82.4%) | 6 (17.6%) |
Income Below Poverty Among Single-Parent Households in Skidmore
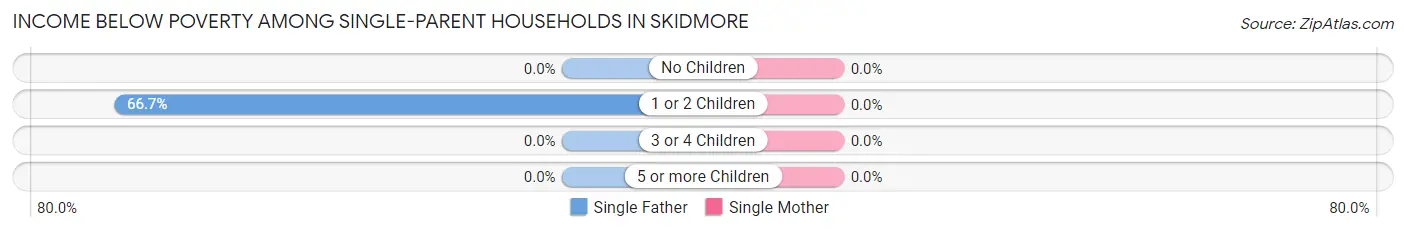
| Children | Single Father | Single Mother |
| No Children | 0 (0.0%) | 0 (0.0%) |
| 1 or 2 Children | 2 (66.7%) | 0 (0.0%) |
| 3 or 4 Children | 0 (0.0%) | 0 (0.0%) |
| 5 or more Children | 0 (0.0%) | 0 (0.0%) |
| Total | 2 (50.0%) | 0 (0.0%) |
Income Below Poverty Among Married-Couple vs Single-Parent Households in Skidmore
The poverty data for Skidmore shows that 6 of the married-couple family households (17.6%) and 2 of the single-parent households (18.2%) are living below the poverty level. Within the married-couple family households, those with 3 or 4 children have the highest poverty rate, with 1 households (100.0%) falling below the poverty line. Among the single-parent households, those with 1 or 2 children have the highest poverty rate, with 2 household (28.6%) living below poverty.
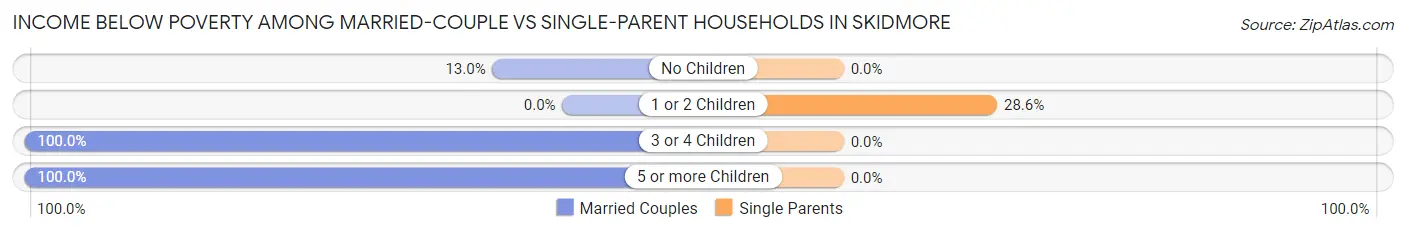
| Children | Married-Couple Families | Single-Parent Households |
| No Children | 3 (13.0%) | 0 (0.0%) |
| 1 or 2 Children | 0 (0.0%) | 2 (28.6%) |
| 3 or 4 Children | 1 (100.0%) | 0 (0.0%) |
| 5 or more Children | 2 (100.0%) | 0 (0.0%) |
| Total | 6 (17.6%) | 2 (18.2%) |
Race in Skidmore
The most populous races in Skidmore are White / Caucasian (195 | 85.9%), Two or more Races (30 | 13.2%), and Hispanic or Latino (3 | 1.3%).
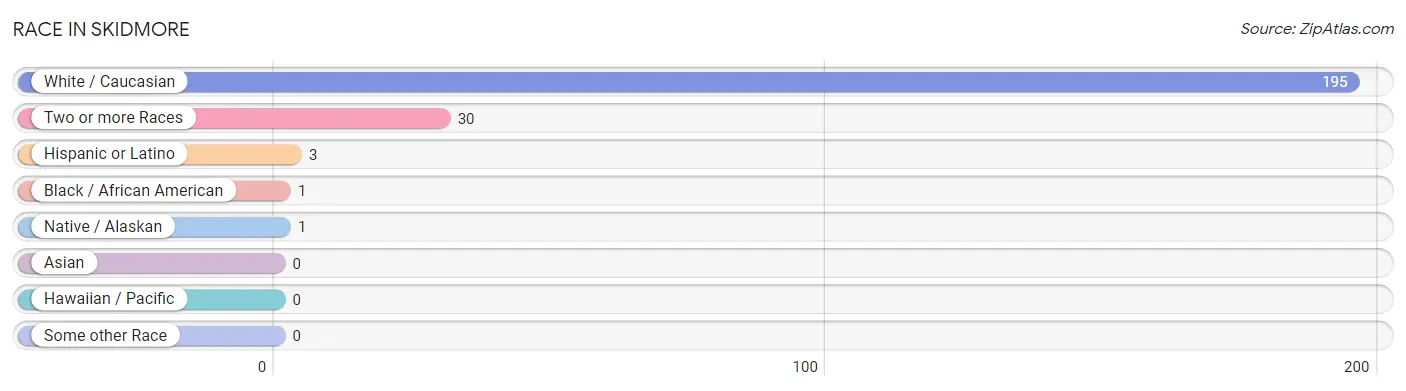
| Race | # Population | % Population |
| Asian | 0 | 0.0% |
| Black / African American | 1 | 0.4% |
| Hawaiian / Pacific | 0 | 0.0% |
| Hispanic or Latino | 3 | 1.3% |
| Native / Alaskan | 1 | 0.4% |
| White / Caucasian | 195 | 85.9% |
| Two or more Races | 30 | 13.2% |
| Some other Race | 0 | 0.0% |
| Total | 227 | 100.0% |
Ancestry in Skidmore
The most populous ancestries reported in Skidmore are German (71 | 31.3%), Irish (32 | 14.1%), American (30 | 13.2%), English (7 | 3.1%), and Dutch (6 | 2.6%), together accounting for 64.3% of all Skidmore residents.
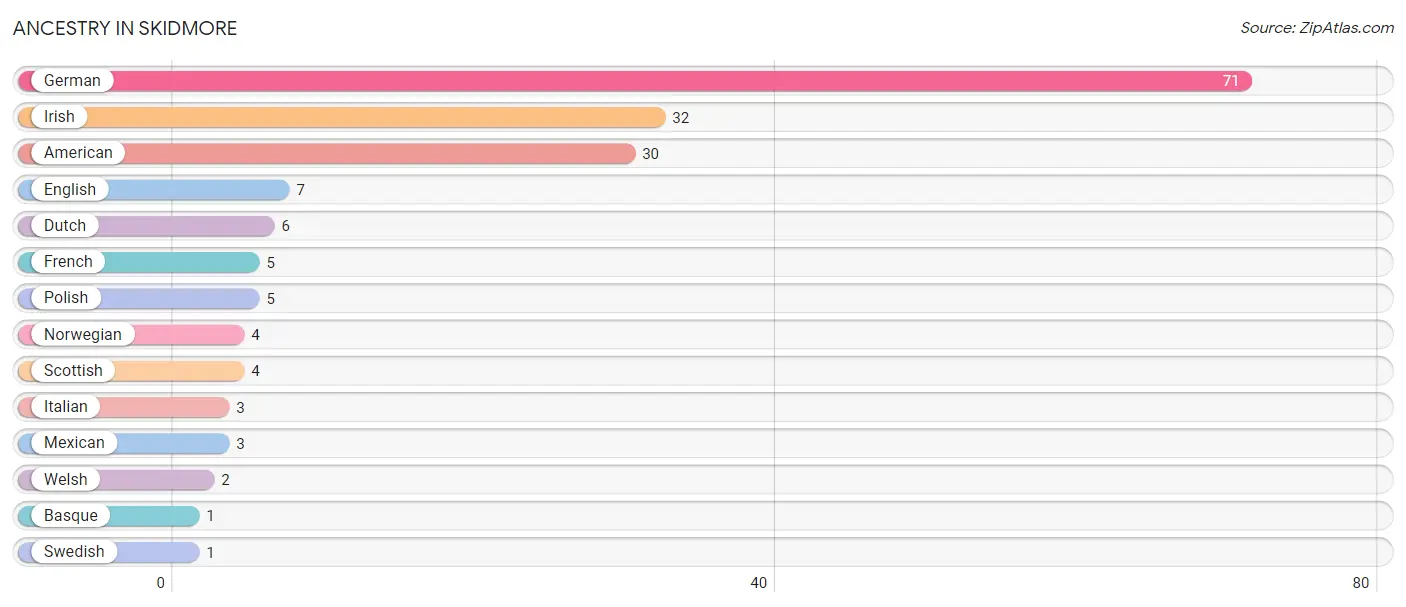
| Ancestry | # Population | % Population |
| American | 30 | 13.2% |
| Basque | 1 | 0.4% |
| Dutch | 6 | 2.6% |
| English | 7 | 3.1% |
| French | 5 | 2.2% |
| German | 71 | 31.3% |
| Irish | 32 | 14.1% |
| Italian | 3 | 1.3% |
| Mexican | 3 | 1.3% |
| Norwegian | 4 | 1.8% |
| Polish | 5 | 2.2% |
| Scottish | 4 | 1.8% |
| Swedish | 1 | 0.4% |
| Welsh | 2 | 0.9% | View All 14 Rows |
Immigrants in Skidmore

| Immigration Origin | # Population | % Population | View All 0 Rows |
Sex and Age in Skidmore
Sex and Age in Skidmore
The most populous age groups in Skidmore are 50 to 54 Years (12 | 10.9%) for men and 35 to 39 Years (17 | 14.5%) for women.
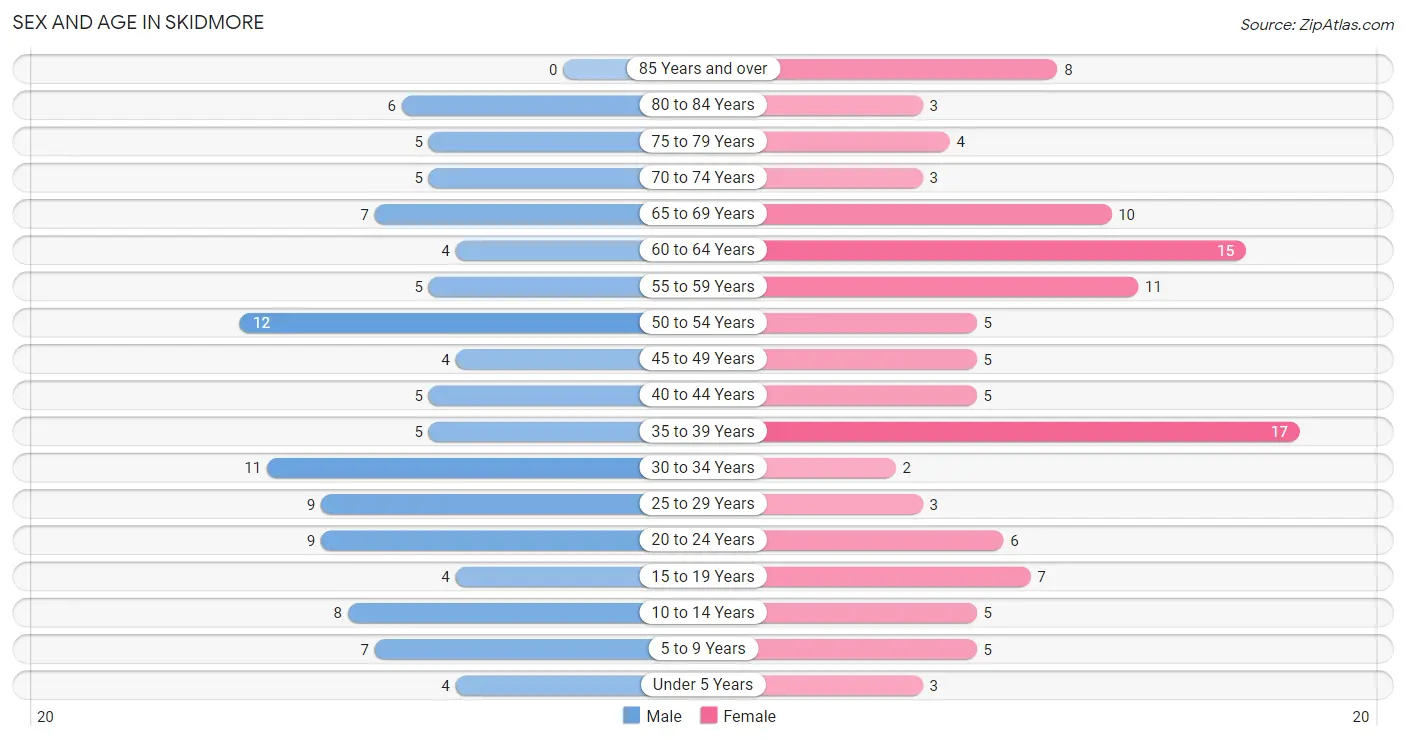
| Age Bracket | Male | Female |
| Under 5 Years | 4 (3.6%) | 3 (2.6%) |
| 5 to 9 Years | 7 (6.4%) | 5 (4.3%) |
| 10 to 14 Years | 8 (7.3%) | 5 (4.3%) |
| 15 to 19 Years | 4 (3.6%) | 7 (6.0%) |
| 20 to 24 Years | 9 (8.2%) | 6 (5.1%) |
| 25 to 29 Years | 9 (8.2%) | 3 (2.6%) |
| 30 to 34 Years | 11 (10.0%) | 2 (1.7%) |
| 35 to 39 Years | 5 (4.5%) | 17 (14.5%) |
| 40 to 44 Years | 5 (4.5%) | 5 (4.3%) |
| 45 to 49 Years | 4 (3.6%) | 5 (4.3%) |
| 50 to 54 Years | 12 (10.9%) | 5 (4.3%) |
| 55 to 59 Years | 5 (4.5%) | 11 (9.4%) |
| 60 to 64 Years | 4 (3.6%) | 15 (12.8%) |
| 65 to 69 Years | 7 (6.4%) | 10 (8.6%) |
| 70 to 74 Years | 5 (4.5%) | 3 (2.6%) |
| 75 to 79 Years | 5 (4.5%) | 4 (3.4%) |
| 80 to 84 Years | 6 (5.4%) | 3 (2.6%) |
| 85 Years and over | 0 (0.0%) | 8 (6.8%) |
| Total | 110 (100.0%) | 117 (100.0%) |
Families and Households in Skidmore
Median Family Size in Skidmore
The median family size in Skidmore is 3.27 persons per family, with single male/father families (4 | 8.9%) accounting for the largest median family size of 4.5 persons per family. On the other hand, single female/mother families (7 | 15.6%) represent the smallest median family size with 2.29 persons per family.
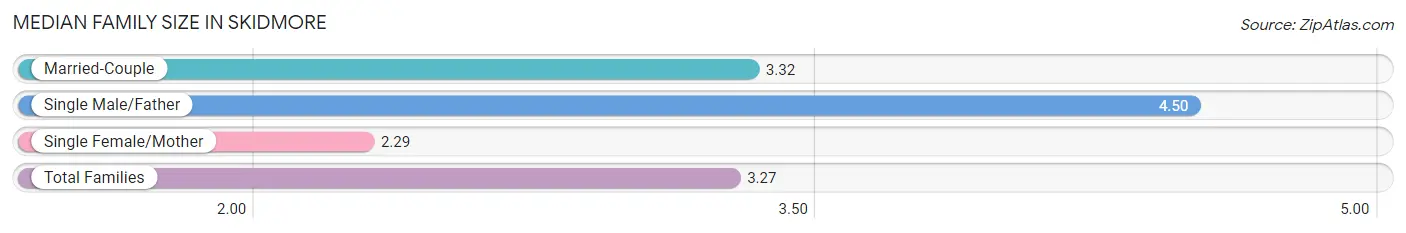
| Family Type | # Families | Family Size |
| Married-Couple | 34 (75.6%) | 3.32 |
| Single Male/Father | 4 (8.9%) | 4.50 |
| Single Female/Mother | 7 (15.6%) | 2.29 |
| Total Families | 45 (100.0%) | 3.27 |
Median Household Size in Skidmore
The median household size in Skidmore is 1.94 persons per household, with single male/father households (4 | 3.4%) accounting for the largest median household size of 4.75 persons per household. non-family households (72 | 61.5%) represent the smallest median household size with 1.10 persons per household.
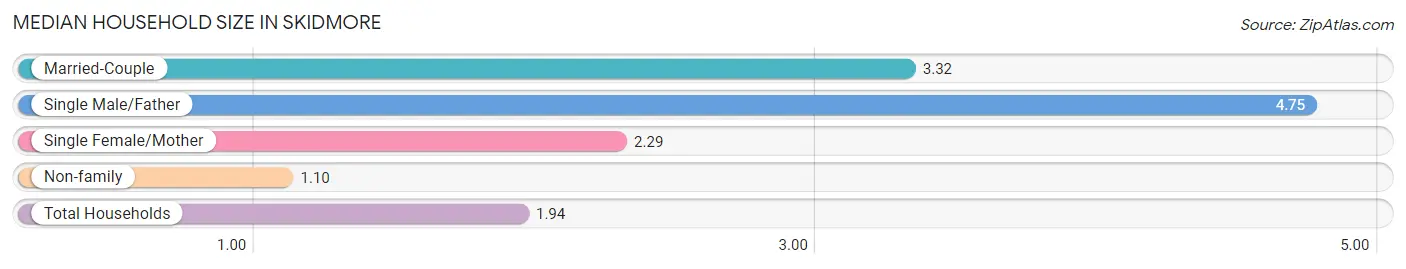
| Household Type | # Households | Household Size |
| Married-Couple | 34 (29.1%) | 3.32 |
| Single Male/Father | 4 (3.4%) | 4.75 |
| Single Female/Mother | 7 (6.0%) | 2.29 |
| Non-family | 72 (61.5%) | 1.10 |
| Total Households | 117 (100.0%) | 1.94 |
Household Size by Marriage Status in Skidmore
Out of a total of 117 households in Skidmore, 45 (38.5%) are family households, while 72 (61.5%) are nonfamily households. The most numerous type of family households are 2-person households, comprising 28, and the most common type of nonfamily households are 1-person households, comprising 65.
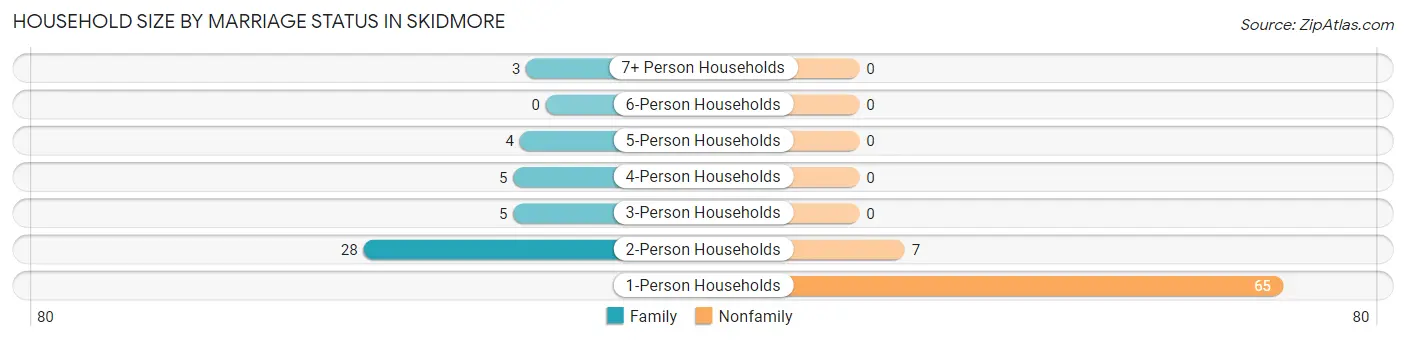
| Household Size | Family Households | Nonfamily Households |
| 1-Person Households | - | 65 (55.6%) |
| 2-Person Households | 28 (23.9%) | 7 (6.0%) |
| 3-Person Households | 5 (4.3%) | 0 (0.0%) |
| 4-Person Households | 5 (4.3%) | 0 (0.0%) |
| 5-Person Households | 4 (3.4%) | 0 (0.0%) |
| 6-Person Households | 0 (0.0%) | 0 (0.0%) |
| 7+ Person Households | 3 (2.6%) | 0 (0.0%) |
| Total | 45 (38.5%) | 72 (61.5%) |
Female Fertility in Skidmore
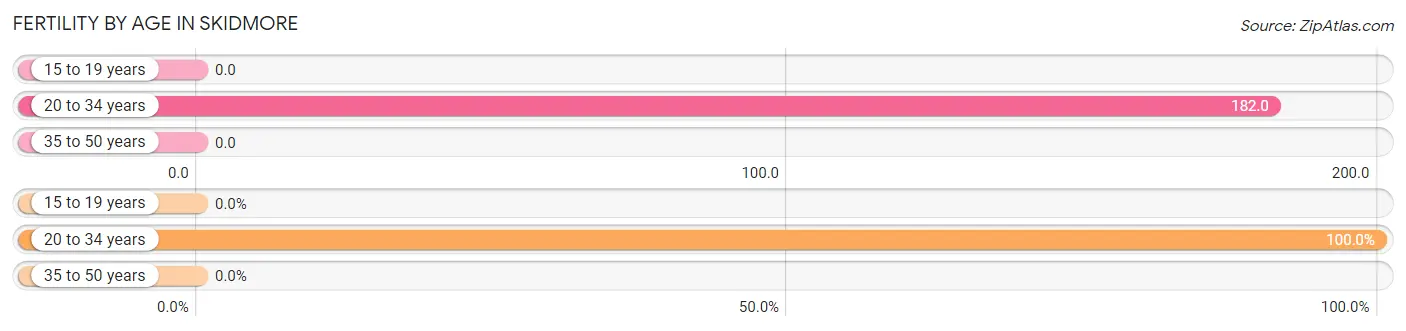
Fertility by Age in Skidmore
Average fertility rate in Skidmore is 43.0 births per 1,000 women. Women in the age bracket of 20 to 34 years have the highest fertility rate with 182.0 births per 1,000 women. Women in the age bracket of 20 to 34 years acount for 100.0% of all women with births.
| Age Bracket | Women with Births | Births / 1,000 Women |
| 15 to 19 years | 0 (0.0%) | 0.0 |
| 20 to 34 years | 2 (100.0%) | 182.0 |
| 35 to 50 years | 0 (0.0%) | 0.0 |
| Total | 2 (100.0%) | 43.0 |
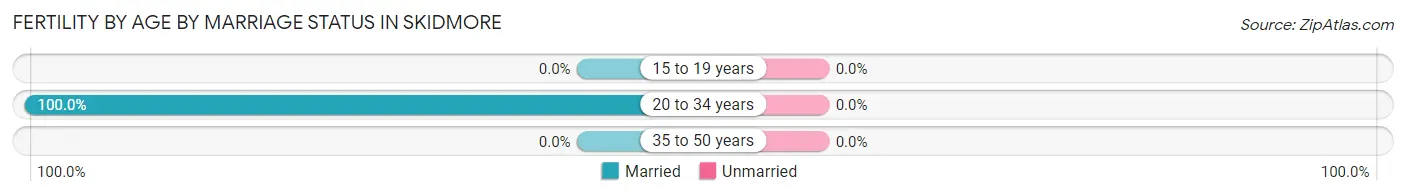
Fertility by Age by Marriage Status in Skidmore
| Age Bracket | Married | Unmarried |
| 15 to 19 years | 0 (0.0%) | 0 (0.0%) |
| 20 to 34 years | 2 (100.0%) | 0 (0.0%) |
| 35 to 50 years | 0 (0.0%) | 0 (0.0%) |
| Total | 2 (100.0%) | 0 (0.0%) |
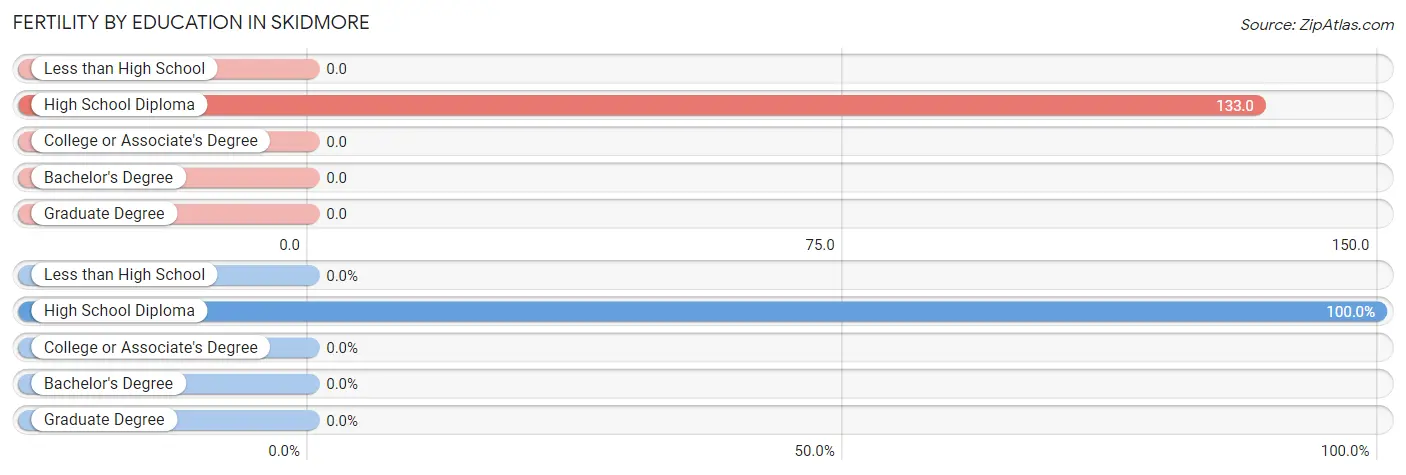
Fertility by Education in Skidmore
| Educational Attainment | Women with Births | Births / 1,000 Women |
| Less than High School | 0 (0.0%) | 0.0 |
| High School Diploma | 2 (100.0%) | 133.0 |
| College or Associate's Degree | 0 (0.0%) | 0.0 |
| Bachelor's Degree | 0 (0.0%) | 0.0 |
| Graduate Degree | 0 (0.0%) | 0.0 |
| Total | 2 (100.0%) | 43.0 |
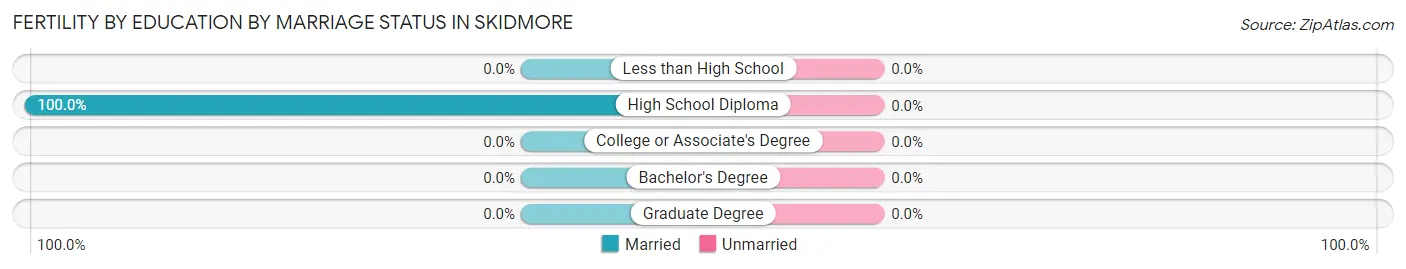
Fertility by Education by Marriage Status in Skidmore
| Educational Attainment | Married | Unmarried |
| Less than High School | 0 (0.0%) | 0 (0.0%) |
| High School Diploma | 2 (100.0%) | 0 (0.0%) |
| College or Associate's Degree | 0 (0.0%) | 0 (0.0%) |
| Bachelor's Degree | 0 (0.0%) | 0 (0.0%) |
| Graduate Degree | 0 (0.0%) | 0 (0.0%) |
| Total | 2 (100.0%) | 0 (0.0%) |
Employment Characteristics in Skidmore
Employment by Class of Employer in Skidmore
Among the 99 employed individuals in Skidmore, private company employees (81 | 81.8%), state government employees (6 | 6.1%), and self-employed (incorporated) (5 | 5.1%) make up the most common classes of employment.
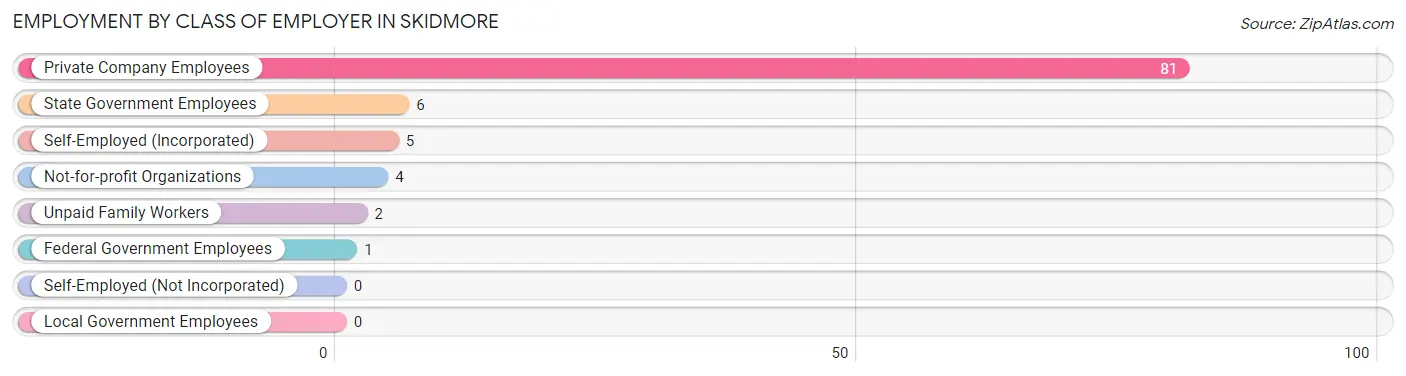
| Employer Class | # Employees | % Employees |
| Private Company Employees | 81 | 81.8% |
| Self-Employed (Incorporated) | 5 | 5.1% |
| Self-Employed (Not Incorporated) | 0 | 0.0% |
| Not-for-profit Organizations | 4 | 4.0% |
| Local Government Employees | 0 | 0.0% |
| State Government Employees | 6 | 6.1% |
| Federal Government Employees | 1 | 1.0% |
| Unpaid Family Workers | 2 | 2.0% |
| Total | 99 | 100.0% |
Employment Status by Age in Skidmore
According to the labor force statistics for Skidmore, out of the total population over 16 years of age (194), 55.7% or 108 individuals are in the labor force, with 6.5% or 7 of them unemployed. The age group with the highest labor force participation rate is 20 to 24 years, with 100.0% or 15 individuals in the labor force. Within the labor force, the 75 years and over age range has the highest percentage of unemployed individuals, with 33.3% or 1 of them being unemployed.
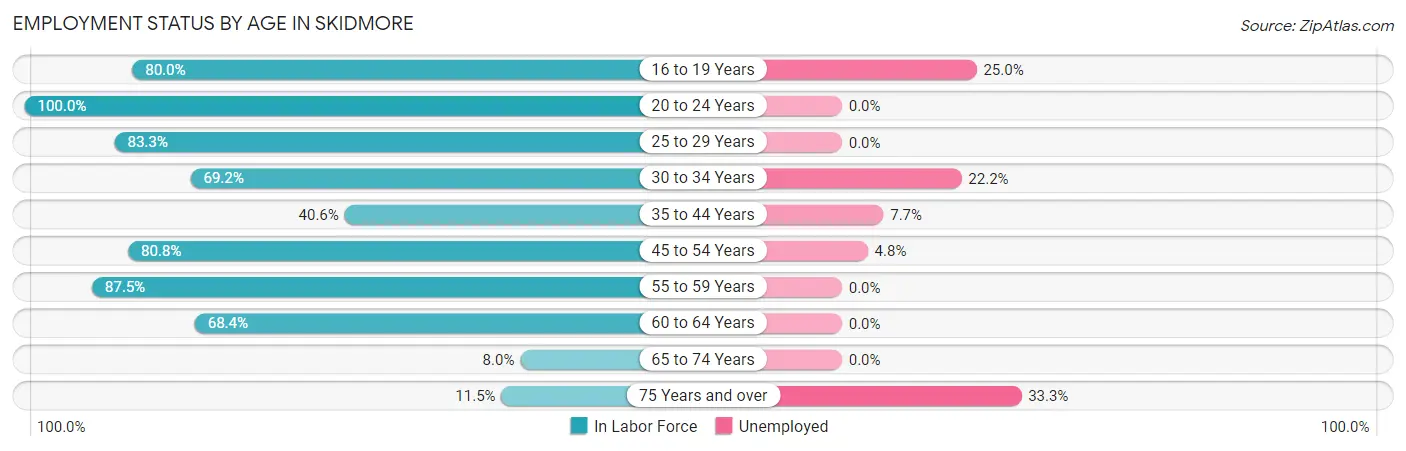
| Age Bracket | In Labor Force | Unemployed |
| 16 to 19 Years | 8 (80.0%) | 2 (25.0%) |
| 20 to 24 Years | 15 (100.0%) | 0 (0.0%) |
| 25 to 29 Years | 10 (83.3%) | 0 (0.0%) |
| 30 to 34 Years | 9 (69.2%) | 2 (22.2%) |
| 35 to 44 Years | 13 (40.6%) | 1 (7.7%) |
| 45 to 54 Years | 21 (80.8%) | 1 (4.8%) |
| 55 to 59 Years | 14 (87.5%) | 0 (0.0%) |
| 60 to 64 Years | 13 (68.4%) | 0 (0.0%) |
| 65 to 74 Years | 2 (8.0%) | 0 (0.0%) |
| 75 Years and over | 3 (11.5%) | 1 (33.3%) |
| Total | 108 (55.7%) | 7 (6.5%) |
Employment Status by Educational Attainment in Skidmore
According to labor force statistics for Skidmore, 67.8% of individuals (80) out of the total population between 25 and 64 years of age (118) are in the labor force, with 5.0% or 4 of them being unemployed. The group with the highest labor force participation rate are those with the educational attainment of high school diploma, with 69.1% or 38 individuals in the labor force. Within the labor force, individuals with college / associate degree education have the highest percentage of unemployment, with 10.3% or 3 of them being unemployed.
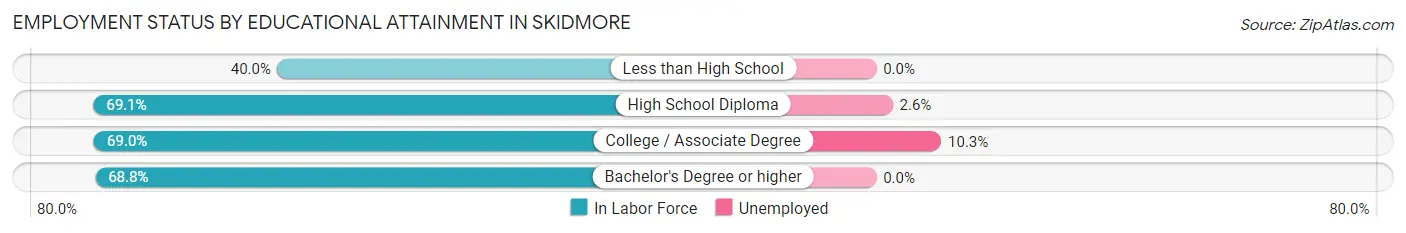
| Educational Attainment | In Labor Force | Unemployed |
| Less than High School | 2 (40.0%) | 0 (0.0%) |
| High School Diploma | 38 (69.1%) | 1 (2.6%) |
| College / Associate Degree | 29 (69.0%) | 4 (10.3%) |
| Bachelor's Degree or higher | 11 (68.8%) | 0 (0.0%) |
| Total | 80 (67.8%) | 6 (5.0%) |
Employment Occupations by Sex in Skidmore
Management, Business, Science and Arts Occupations
The most common Management, Business, Science and Arts occupations in Skidmore are Health Diagnosing & Treating (14 | 13.9%), Computers, Engineering & Science (4 | 4.0%), Management (3 | 3.0%), Computers & Mathematics (2 | 2.0%), and Architecture & Engineering (2 | 2.0%).
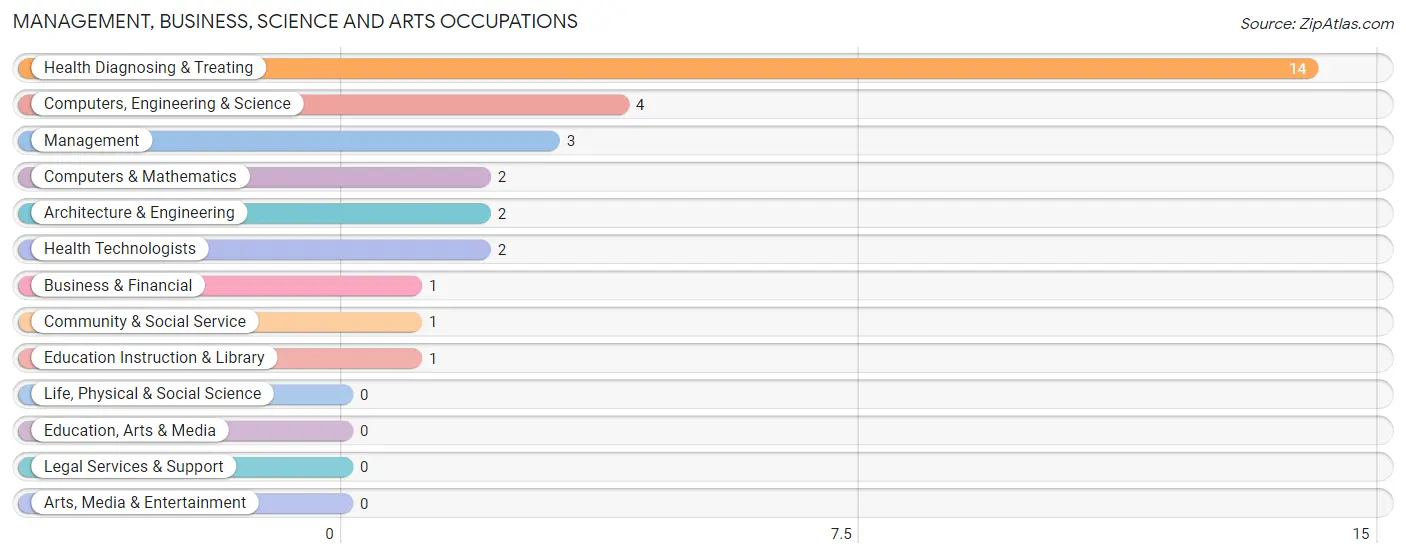
Management, Business, Science and Arts Occupations by Sex
Within the Management, Business, Science and Arts occupations in Skidmore, the most male-oriented occupations are Business & Financial (100.0%), Computers, Engineering & Science (100.0%), and Computers & Mathematics (100.0%), while the most female-oriented occupations are Management (100.0%), Community & Social Service (100.0%), and Education Instruction & Library (100.0%).
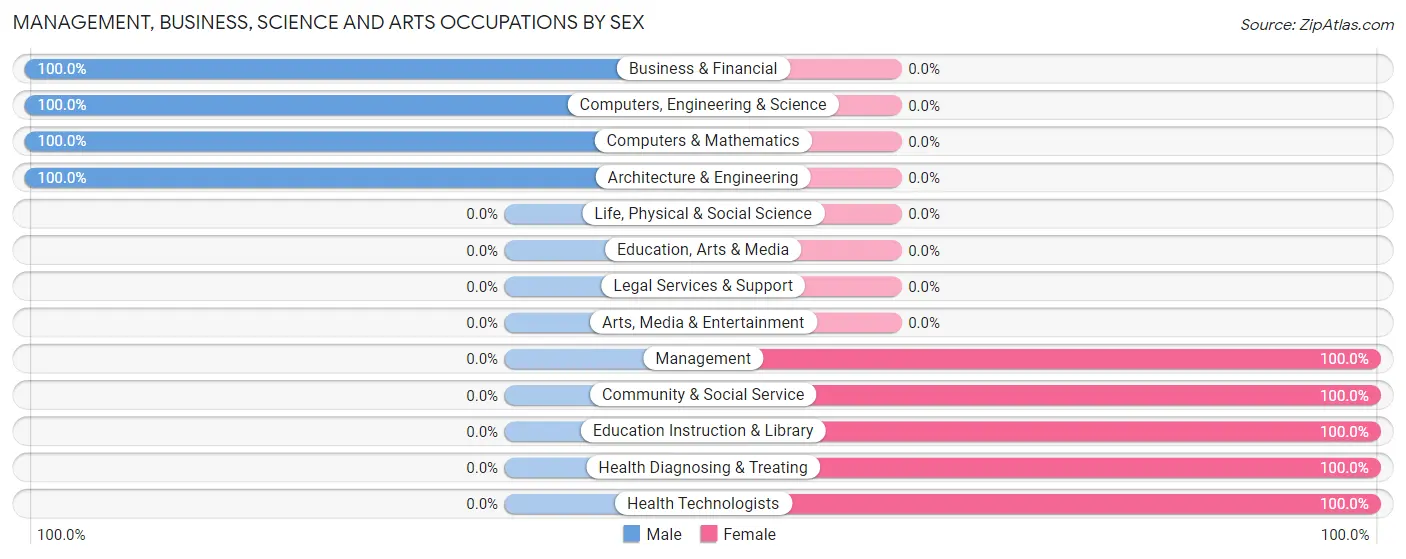
| Occupation | Male | Female |
| Management | 0 (0.0%) | 3 (100.0%) |
| Business & Financial | 1 (100.0%) | 0 (0.0%) |
| Computers, Engineering & Science | 4 (100.0%) | 0 (0.0%) |
| Computers & Mathematics | 2 (100.0%) | 0 (0.0%) |
| Architecture & Engineering | 2 (100.0%) | 0 (0.0%) |
| Life, Physical & Social Science | 0 (0.0%) | 0 (0.0%) |
| Community & Social Service | 0 (0.0%) | 1 (100.0%) |
| Education, Arts & Media | 0 (0.0%) | 0 (0.0%) |
| Legal Services & Support | 0 (0.0%) | 0 (0.0%) |
| Education Instruction & Library | 0 (0.0%) | 1 (100.0%) |
| Arts, Media & Entertainment | 0 (0.0%) | 0 (0.0%) |
| Health Diagnosing & Treating | 0 (0.0%) | 14 (100.0%) |
| Health Technologists | 0 (0.0%) | 2 (100.0%) |
| Total (Category) | 5 (21.7%) | 18 (78.3%) |
| Total (Overall) | 51 (50.5%) | 50 (49.5%) |
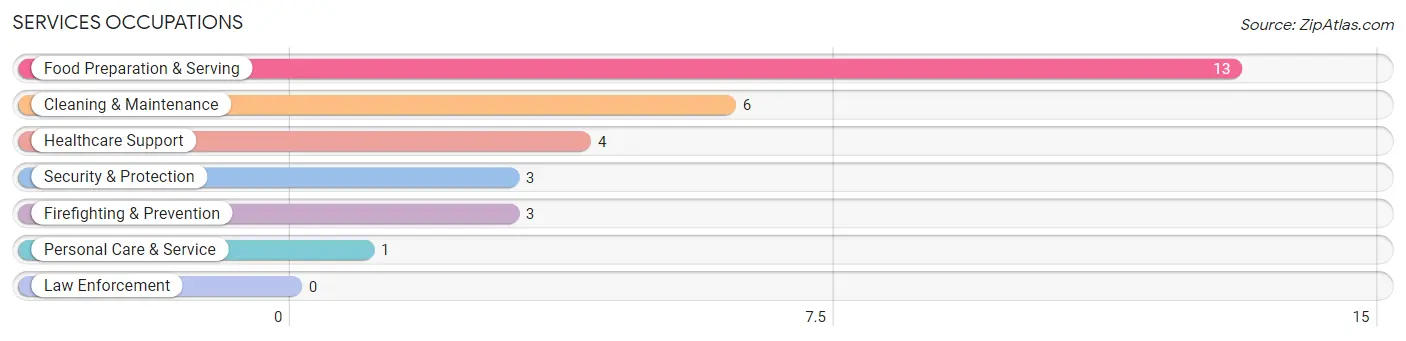
Services Occupations
The most common Services occupations in Skidmore are Food Preparation & Serving (13 | 12.9%), Cleaning & Maintenance (6 | 5.9%), Healthcare Support (4 | 4.0%), Security & Protection (3 | 3.0%), and Firefighting & Prevention (3 | 3.0%).
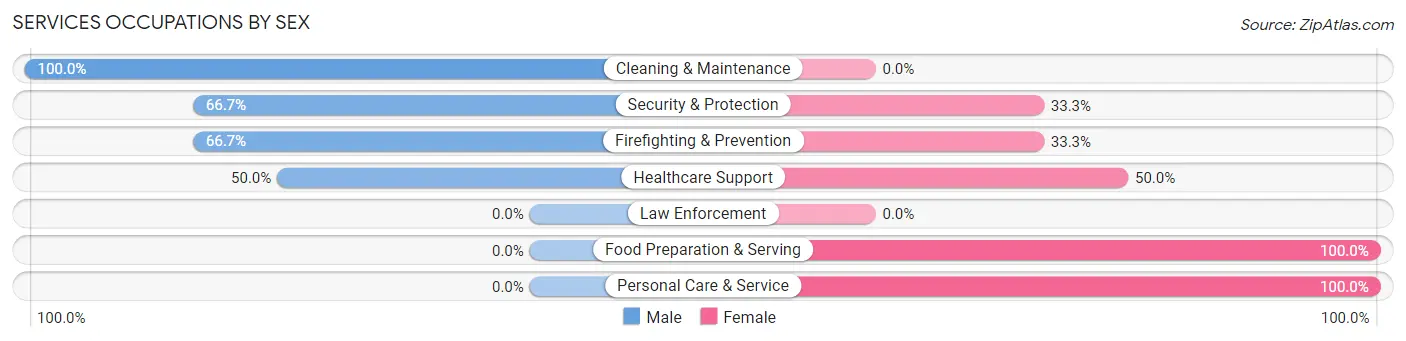
Services Occupations by Sex
Within the Services occupations in Skidmore, the most male-oriented occupations are Cleaning & Maintenance (100.0%), Security & Protection (66.7%), and Firefighting & Prevention (66.7%), while the most female-oriented occupations are Food Preparation & Serving (100.0%), Personal Care & Service (100.0%), and Healthcare Support (50.0%).
| Occupation | Male | Female |
| Healthcare Support | 2 (50.0%) | 2 (50.0%) |
| Security & Protection | 2 (66.7%) | 1 (33.3%) |
| Firefighting & Prevention | 2 (66.7%) | 1 (33.3%) |
| Law Enforcement | 0 (0.0%) | 0 (0.0%) |
| Food Preparation & Serving | 0 (0.0%) | 13 (100.0%) |
| Cleaning & Maintenance | 6 (100.0%) | 0 (0.0%) |
| Personal Care & Service | 0 (0.0%) | 1 (100.0%) |
| Total (Category) | 10 (37.0%) | 17 (63.0%) |
| Total (Overall) | 51 (50.5%) | 50 (49.5%) |
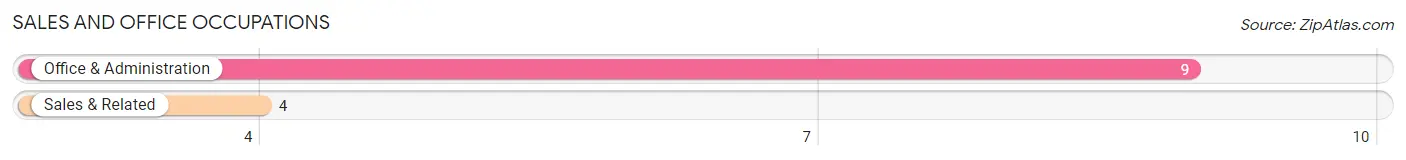
Sales and Office Occupations
The most common Sales and Office occupations in Skidmore are Office & Administration (9 | 8.9%), and Sales & Related (4 | 4.0%).
Sales and Office Occupations by Sex
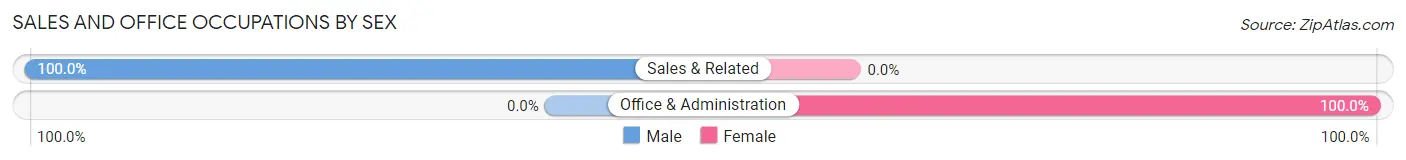
| Occupation | Male | Female |
| Sales & Related | 4 (100.0%) | 0 (0.0%) |
| Office & Administration | 0 (0.0%) | 9 (100.0%) |
| Total (Category) | 4 (30.8%) | 9 (69.2%) |
| Total (Overall) | 51 (50.5%) | 50 (49.5%) |
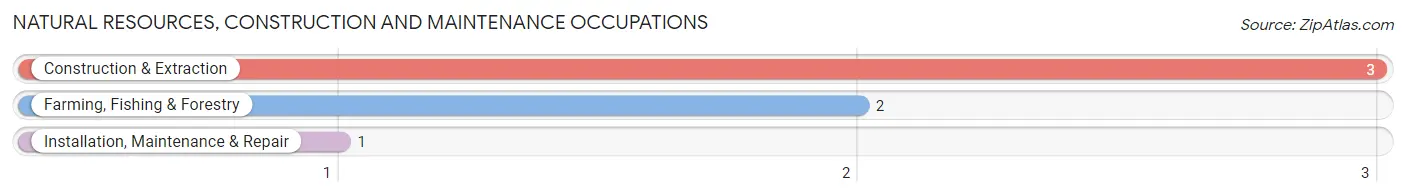
Natural Resources, Construction and Maintenance Occupations
The most common Natural Resources, Construction and Maintenance occupations in Skidmore are Construction & Extraction (3 | 3.0%), Farming, Fishing & Forestry (2 | 2.0%), and Installation, Maintenance & Repair (1 | 1.0%).
Natural Resources, Construction and Maintenance Occupations by Sex
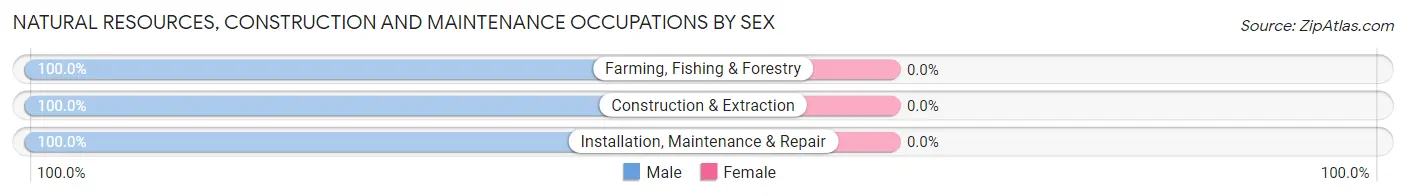
| Occupation | Male | Female |
| Farming, Fishing & Forestry | 2 (100.0%) | 0 (0.0%) |
| Construction & Extraction | 3 (100.0%) | 0 (0.0%) |
| Installation, Maintenance & Repair | 1 (100.0%) | 0 (0.0%) |
| Total (Category) | 6 (100.0%) | 0 (0.0%) |
| Total (Overall) | 51 (50.5%) | 50 (49.5%) |
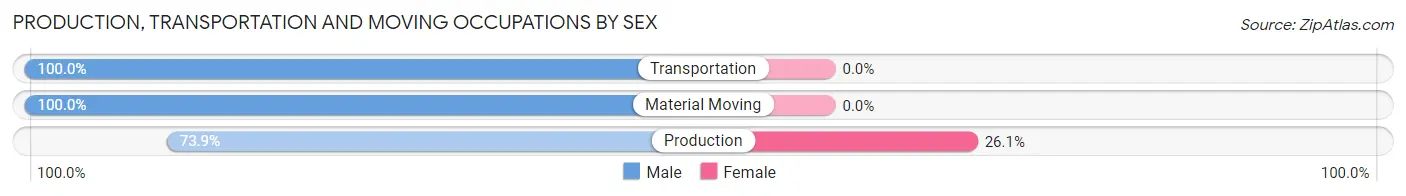
Production, Transportation and Moving Occupations
The most common Production, Transportation and Moving occupations in Skidmore are Production (23 | 22.8%), Transportation (6 | 5.9%), and Material Moving (3 | 3.0%).
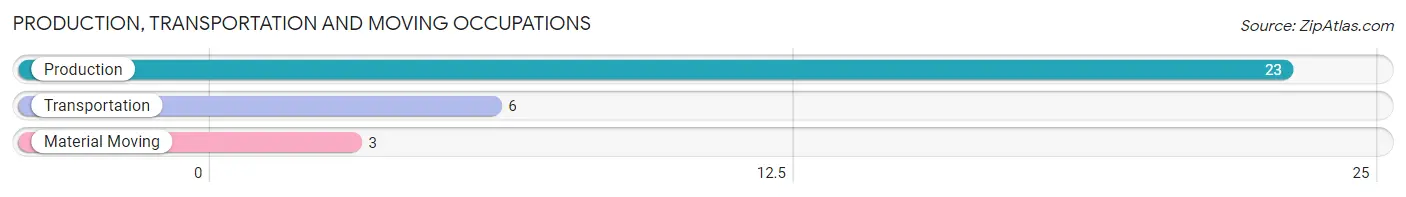
Production, Transportation and Moving Occupations by Sex
| Occupation | Male | Female |
| Production | 17 (73.9%) | 6 (26.1%) |
| Transportation | 6 (100.0%) | 0 (0.0%) |
| Material Moving | 3 (100.0%) | 0 (0.0%) |
| Total (Category) | 26 (81.2%) | 6 (18.8%) |
| Total (Overall) | 51 (50.5%) | 50 (49.5%) |
Employment Industries by Sex in Skidmore
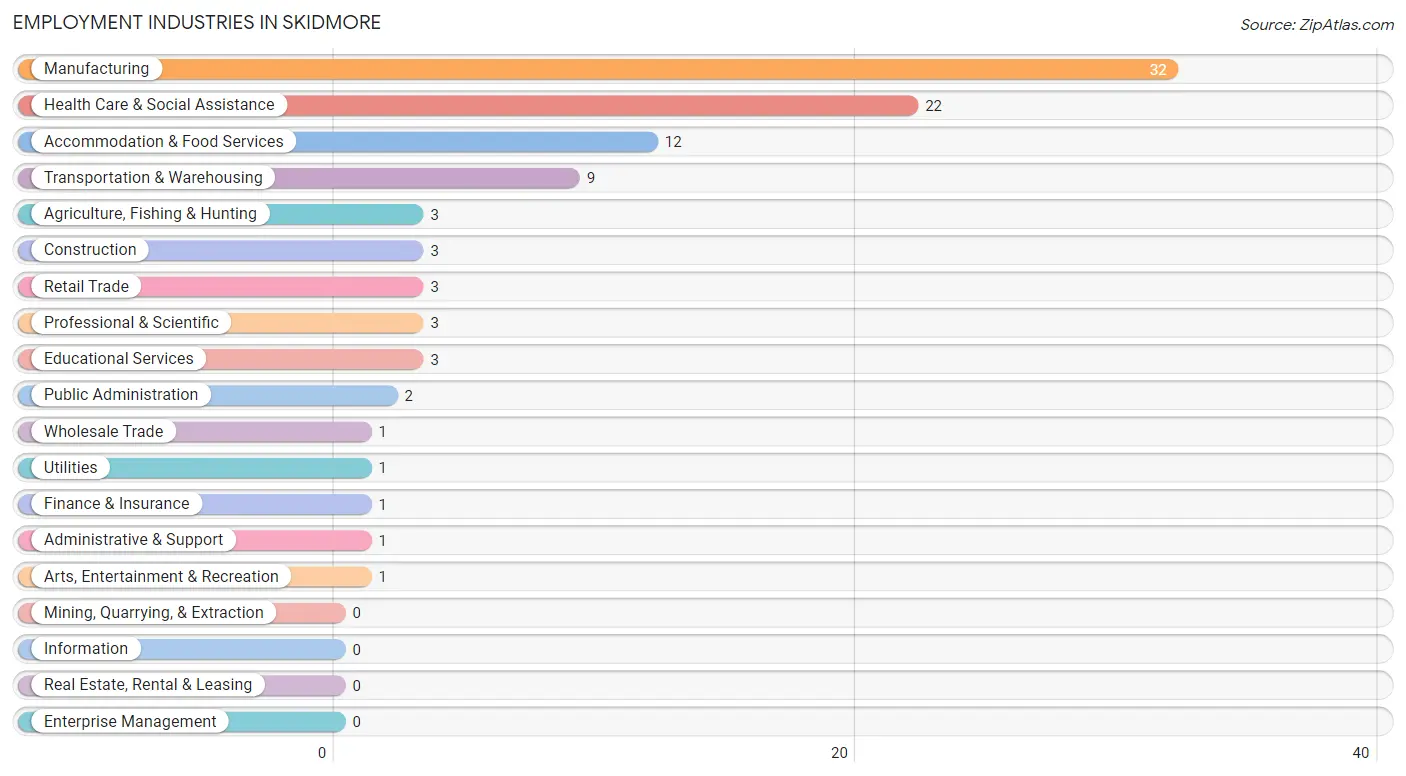
Employment Industries in Skidmore
The major employment industries in Skidmore include Manufacturing (32 | 31.7%), Health Care & Social Assistance (22 | 21.8%), Accommodation & Food Services (12 | 11.9%), Transportation & Warehousing (9 | 8.9%), and Agriculture, Fishing & Hunting (3 | 3.0%).
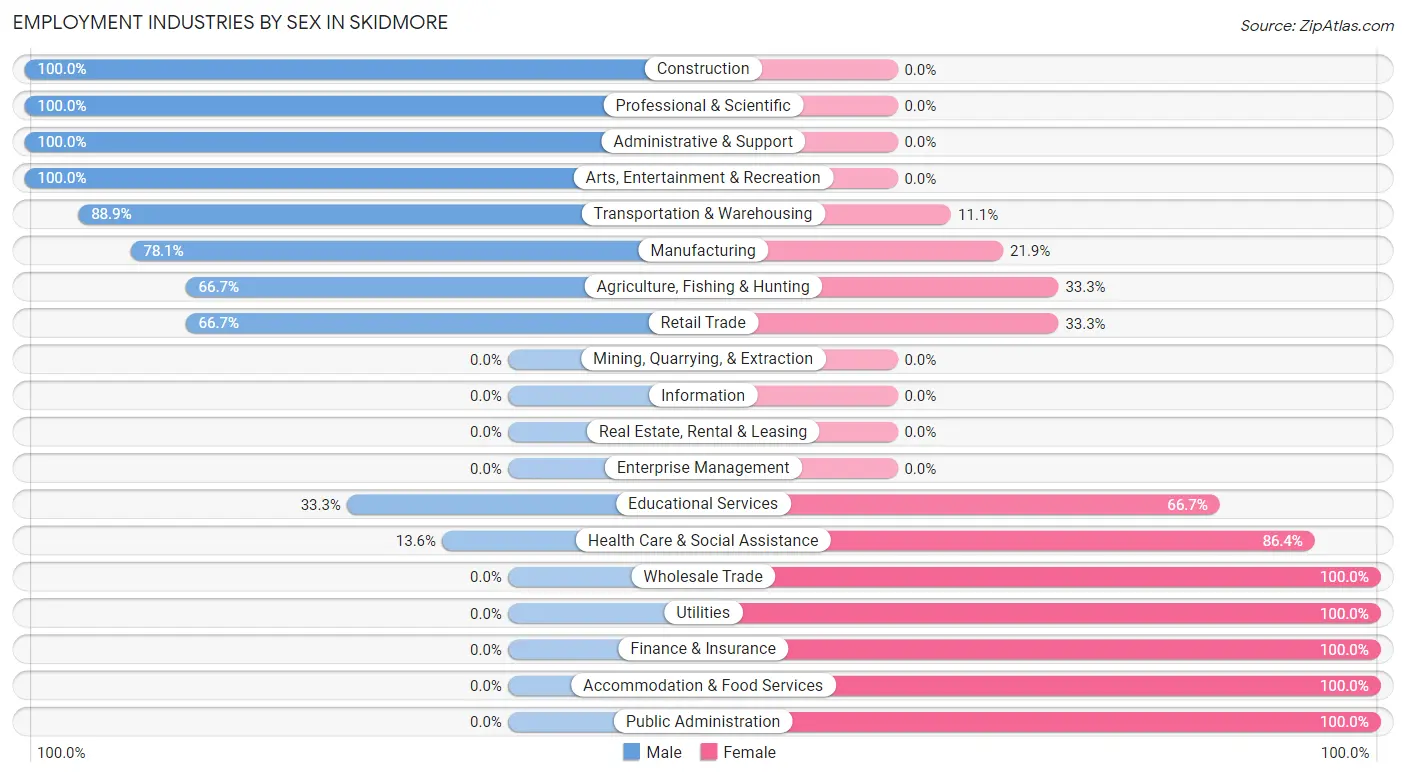
Employment Industries by Sex in Skidmore
The Skidmore industries that see more men than women are Construction (100.0%), Professional & Scientific (100.0%), and Administrative & Support (100.0%), whereas the industries that tend to have a higher number of women are Wholesale Trade (100.0%), Utilities (100.0%), and Finance & Insurance (100.0%).
| Industry | Male | Female |
| Agriculture, Fishing & Hunting | 2 (66.7%) | 1 (33.3%) |
| Mining, Quarrying, & Extraction | 0 (0.0%) | 0 (0.0%) |
| Construction | 3 (100.0%) | 0 (0.0%) |
| Manufacturing | 25 (78.1%) | 7 (21.9%) |
| Wholesale Trade | 0 (0.0%) | 1 (100.0%) |
| Retail Trade | 2 (66.7%) | 1 (33.3%) |
| Transportation & Warehousing | 8 (88.9%) | 1 (11.1%) |
| Utilities | 0 (0.0%) | 1 (100.0%) |
| Information | 0 (0.0%) | 0 (0.0%) |
| Finance & Insurance | 0 (0.0%) | 1 (100.0%) |
| Real Estate, Rental & Leasing | 0 (0.0%) | 0 (0.0%) |
| Professional & Scientific | 3 (100.0%) | 0 (0.0%) |
| Enterprise Management | 0 (0.0%) | 0 (0.0%) |
| Administrative & Support | 1 (100.0%) | 0 (0.0%) |
| Educational Services | 1 (33.3%) | 2 (66.7%) |
| Health Care & Social Assistance | 3 (13.6%) | 19 (86.4%) |
| Arts, Entertainment & Recreation | 1 (100.0%) | 0 (0.0%) |
| Accommodation & Food Services | 0 (0.0%) | 12 (100.0%) |
| Public Administration | 0 (0.0%) | 2 (100.0%) |
| Total | 51 (50.5%) | 50 (49.5%) |
Education in Skidmore
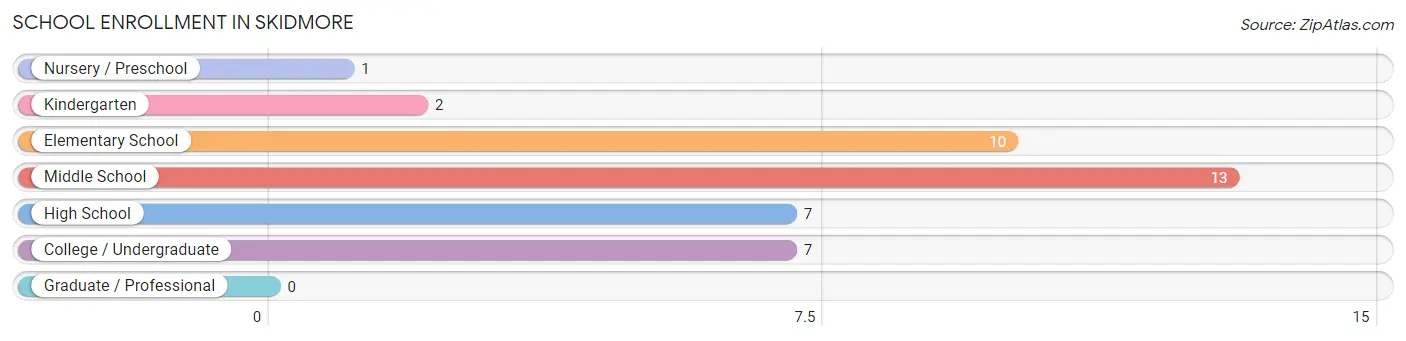
School Enrollment in Skidmore
The most common levels of schooling among the 40 students in Skidmore are middle school (13 | 32.5%), elementary school (10 | 25.0%), and high school (7 | 17.5%).
| School Level | # Students | % Students |
| Nursery / Preschool | 1 | 2.5% |
| Kindergarten | 2 | 5.0% |
| Elementary School | 10 | 25.0% |
| Middle School | 13 | 32.5% |
| High School | 7 | 17.5% |
| College / Undergraduate | 7 | 17.5% |
| Graduate / Professional | 0 | 0.0% |
| Total | 40 | 100.0% |
School Enrollment by Age by Funding Source in Skidmore
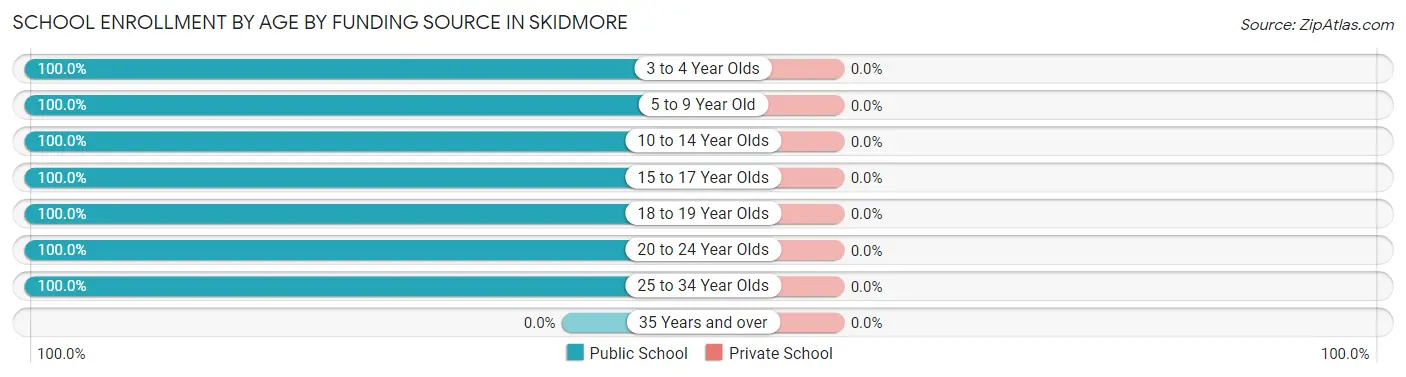
| Age Bracket | Public School | Private School |
| 3 to 4 Year Olds | 1 (100.0%) | 0 (0.0%) |
| 5 to 9 Year Old | 12 (100.0%) | 0 (0.0%) |
| 10 to 14 Year Olds | 13 (100.0%) | 0 (0.0%) |
| 15 to 17 Year Olds | 6 (100.0%) | 0 (0.0%) |
| 18 to 19 Year Olds | 1 (100.0%) | 0 (0.0%) |
| 20 to 24 Year Olds | 5 (100.0%) | 0 (0.0%) |
| 25 to 34 Year Olds | 2 (100.0%) | 0 (0.0%) |
| 35 Years and over | 0 (0.0%) | 0 (0.0%) |
| Total | 40 (100.0%) | 0 (0.0%) |
Educational Attainment by Field of Study in Skidmore
Science & technology (5 | 22.7%), bio, nature & agricultural (3 | 13.6%), business (3 | 13.6%), education (3 | 13.6%), and social sciences (2 | 9.1%) are the most common fields of study among 22 individuals in Skidmore who have obtained a bachelor's degree or higher.
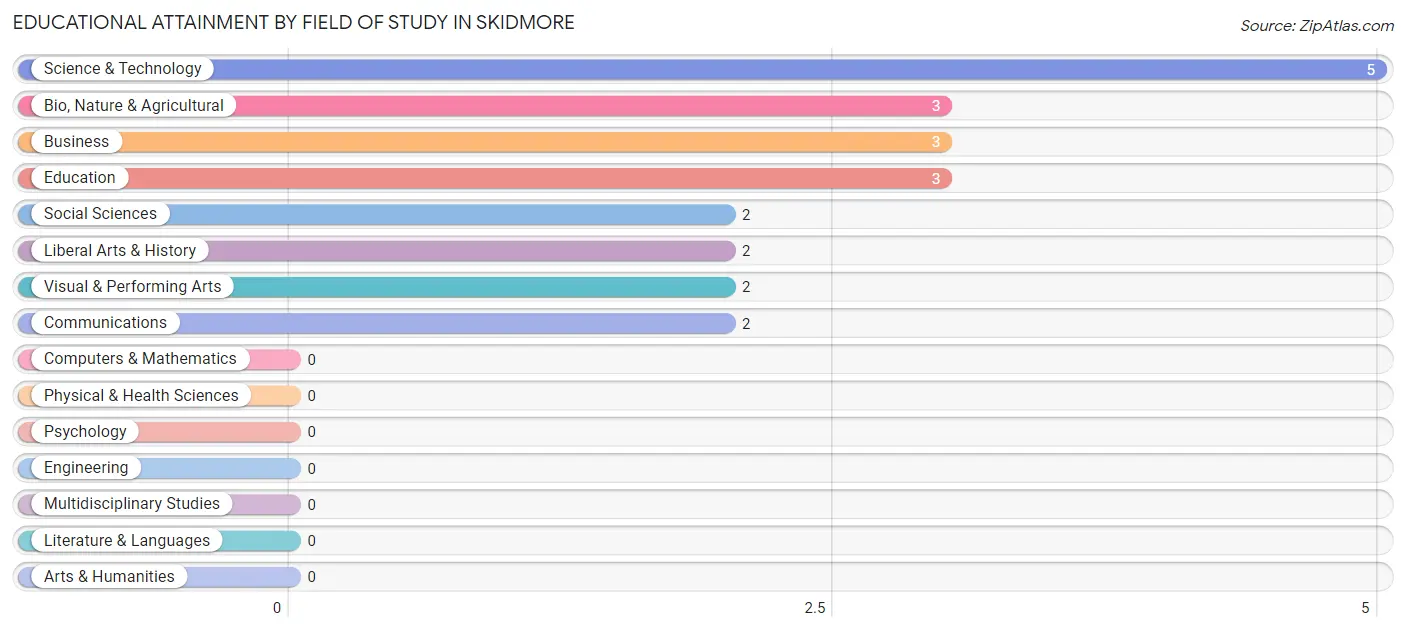
| Field of Study | # Graduates | % Graduates |
| Computers & Mathematics | 0 | 0.0% |
| Bio, Nature & Agricultural | 3 | 13.6% |
| Physical & Health Sciences | 0 | 0.0% |
| Psychology | 0 | 0.0% |
| Social Sciences | 2 | 9.1% |
| Engineering | 0 | 0.0% |
| Multidisciplinary Studies | 0 | 0.0% |
| Science & Technology | 5 | 22.7% |
| Business | 3 | 13.6% |
| Education | 3 | 13.6% |
| Literature & Languages | 0 | 0.0% |
| Liberal Arts & History | 2 | 9.1% |
| Visual & Performing Arts | 2 | 9.1% |
| Communications | 2 | 9.1% |
| Arts & Humanities | 0 | 0.0% |
| Total | 22 | 100.0% |
Transportation & Commute in Skidmore
Vehicle Availability by Sex in Skidmore
The most prevalent vehicle ownership categories in Skidmore are males with 2 vehicles (17, accounting for 33.3%) and females with 2 vehicles (19, making up 35.4%).
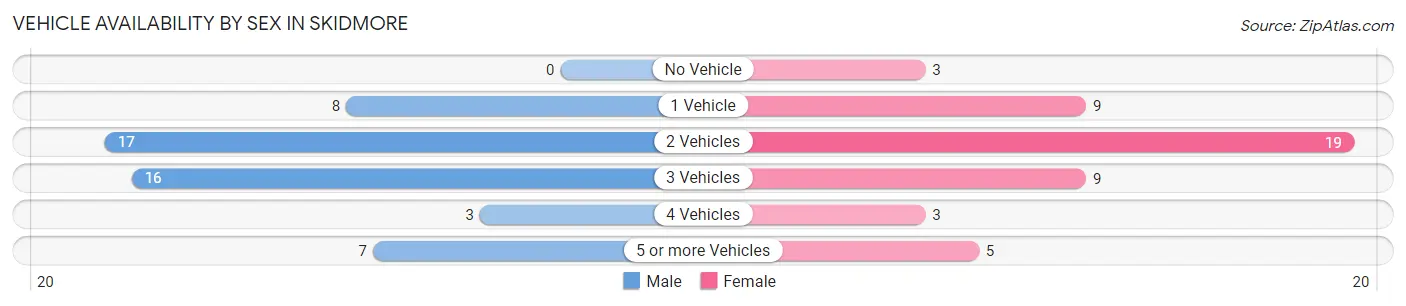
| Vehicles Available | Male | Female |
| No Vehicle | 0 (0.0%) | 3 (6.2%) |
| 1 Vehicle | 8 (15.7%) | 9 (18.8%) |
| 2 Vehicles | 17 (33.3%) | 19 (39.6%) |
| 3 Vehicles | 16 (31.4%) | 9 (18.8%) |
| 4 Vehicles | 3 (5.9%) | 3 (6.2%) |
| 5 or more Vehicles | 7 (13.7%) | 5 (10.4%) |
| Total | 51 (100.0%) | 48 (100.0%) |
Commute Time in Skidmore
The most frequently occuring commute durations in Skidmore are 15 to 19 minutes (22 commuters, 23.4%), 20 to 24 minutes (20 commuters, 21.3%), and 60 to 89 minutes (15 commuters, 16.0%).
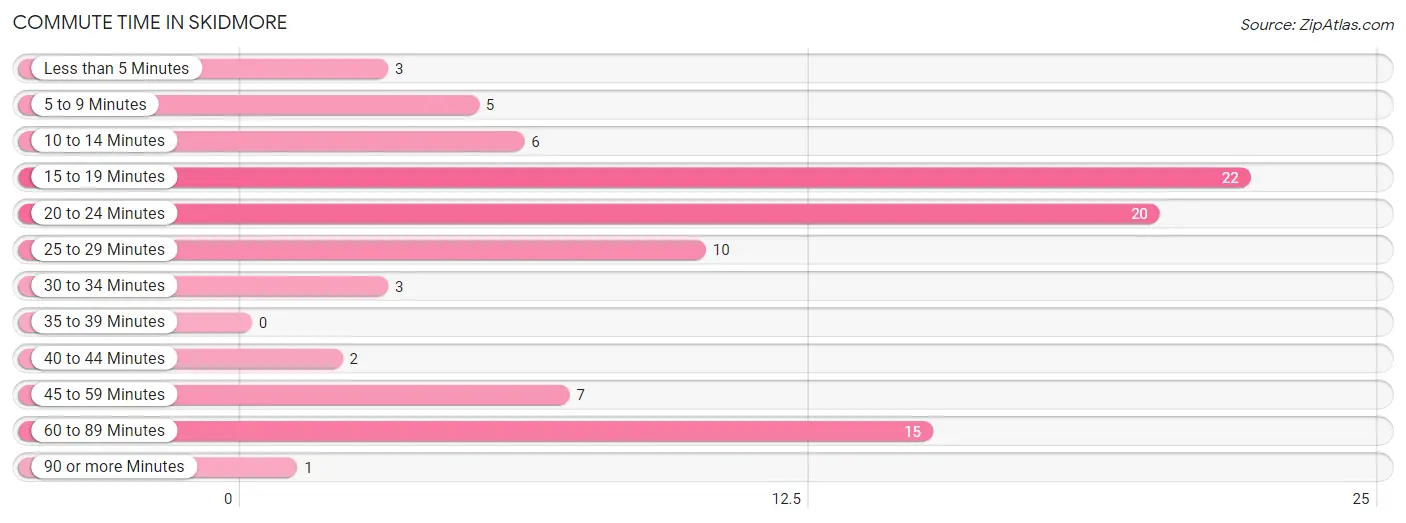
| Commute Time | # Commuters | % Commuters |
| Less than 5 Minutes | 3 | 3.2% |
| 5 to 9 Minutes | 5 | 5.3% |
| 10 to 14 Minutes | 6 | 6.4% |
| 15 to 19 Minutes | 22 | 23.4% |
| 20 to 24 Minutes | 20 | 21.3% |
| 25 to 29 Minutes | 10 | 10.6% |
| 30 to 34 Minutes | 3 | 3.2% |
| 35 to 39 Minutes | 0 | 0.0% |
| 40 to 44 Minutes | 2 | 2.1% |
| 45 to 59 Minutes | 7 | 7.4% |
| 60 to 89 Minutes | 15 | 16.0% |
| 90 or more Minutes | 1 | 1.1% |
Commute Time by Sex in Skidmore
The most common commute times in Skidmore are 15 to 19 minutes (11 commuters, 23.4%) for males and 15 to 19 minutes (11 commuters, 23.4%) for females.
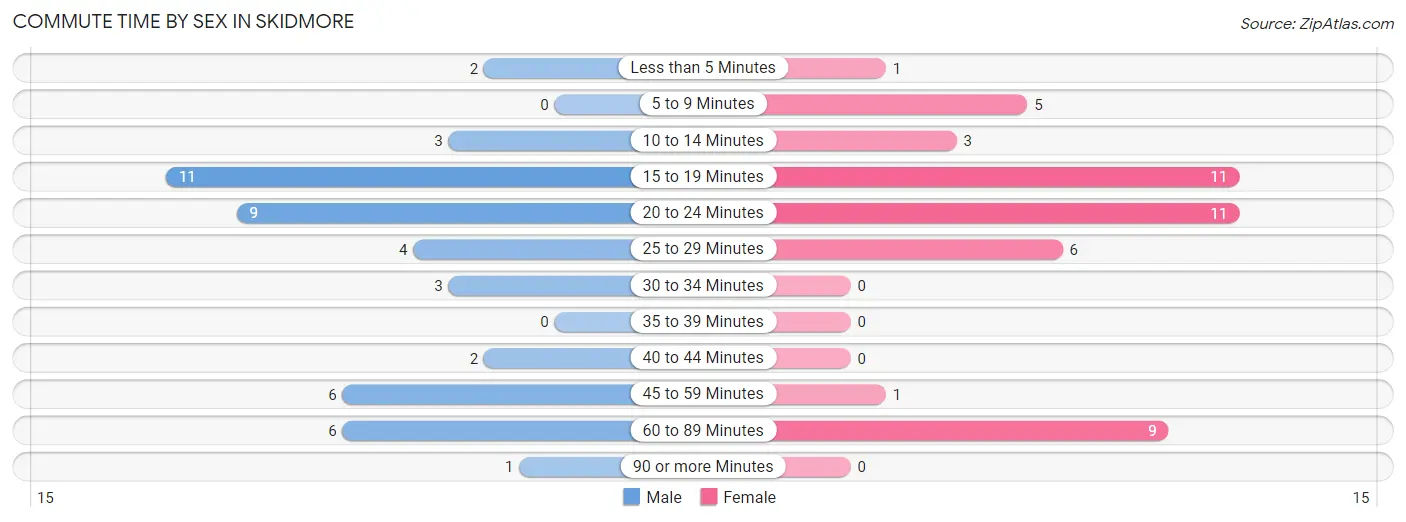
| Commute Time | Male | Female |
| Less than 5 Minutes | 2 (4.3%) | 1 (2.1%) |
| 5 to 9 Minutes | 0 (0.0%) | 5 (10.6%) |
| 10 to 14 Minutes | 3 (6.4%) | 3 (6.4%) |
| 15 to 19 Minutes | 11 (23.4%) | 11 (23.4%) |
| 20 to 24 Minutes | 9 (19.2%) | 11 (23.4%) |
| 25 to 29 Minutes | 4 (8.5%) | 6 (12.8%) |
| 30 to 34 Minutes | 3 (6.4%) | 0 (0.0%) |
| 35 to 39 Minutes | 0 (0.0%) | 0 (0.0%) |
| 40 to 44 Minutes | 2 (4.3%) | 0 (0.0%) |
| 45 to 59 Minutes | 6 (12.8%) | 1 (2.1%) |
| 60 to 89 Minutes | 6 (12.8%) | 9 (19.2%) |
| 90 or more Minutes | 1 (2.1%) | 0 (0.0%) |
Time of Departure to Work by Sex in Skidmore
The most frequent times of departure to work in Skidmore are 12:00 AM to 4:59 AM (10, 21.3%) for males and 5:00 AM to 5:29 AM (14, 29.8%) for females.
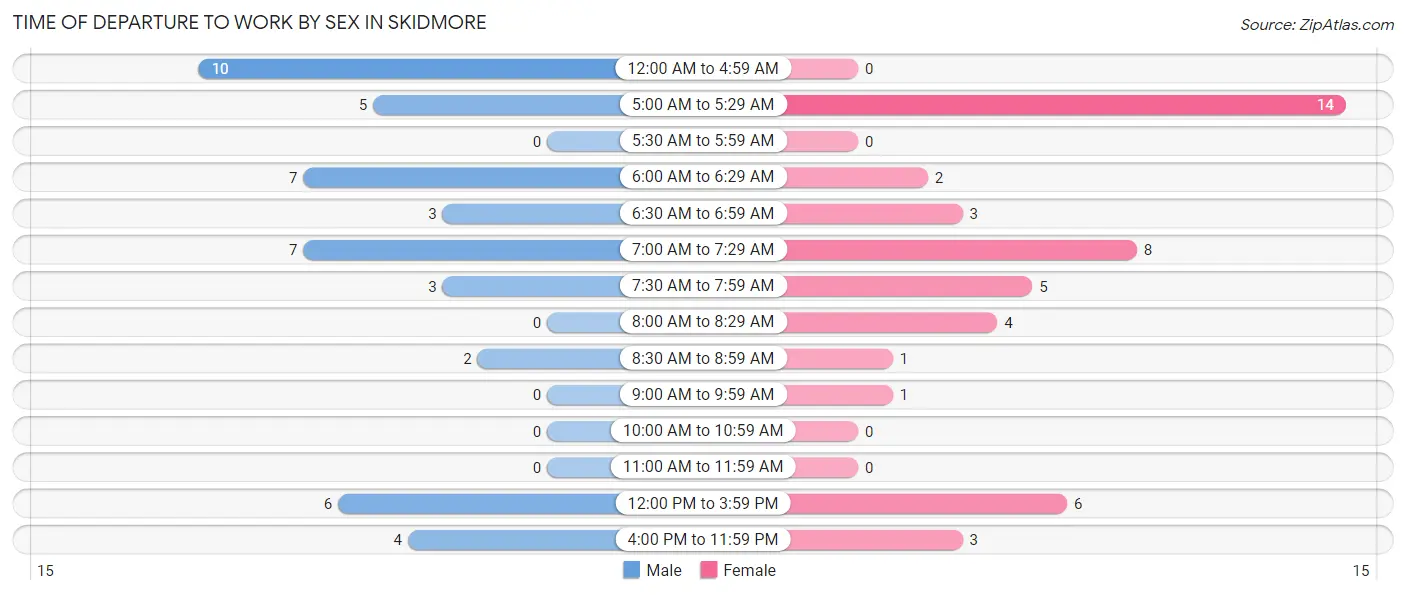
| Time of Departure | Male | Female |
| 12:00 AM to 4:59 AM | 10 (21.3%) | 0 (0.0%) |
| 5:00 AM to 5:29 AM | 5 (10.6%) | 14 (29.8%) |
| 5:30 AM to 5:59 AM | 0 (0.0%) | 0 (0.0%) |
| 6:00 AM to 6:29 AM | 7 (14.9%) | 2 (4.3%) |
| 6:30 AM to 6:59 AM | 3 (6.4%) | 3 (6.4%) |
| 7:00 AM to 7:29 AM | 7 (14.9%) | 8 (17.0%) |
| 7:30 AM to 7:59 AM | 3 (6.4%) | 5 (10.6%) |
| 8:00 AM to 8:29 AM | 0 (0.0%) | 4 (8.5%) |
| 8:30 AM to 8:59 AM | 2 (4.3%) | 1 (2.1%) |
| 9:00 AM to 9:59 AM | 0 (0.0%) | 1 (2.1%) |
| 10:00 AM to 10:59 AM | 0 (0.0%) | 0 (0.0%) |
| 11:00 AM to 11:59 AM | 0 (0.0%) | 0 (0.0%) |
| 12:00 PM to 3:59 PM | 6 (12.8%) | 6 (12.8%) |
| 4:00 PM to 11:59 PM | 4 (8.5%) | 3 (6.4%) |
| Total | 47 (100.0%) | 47 (100.0%) |
Housing Occupancy in Skidmore
Occupancy by Ownership in Skidmore
Of the total 117 dwellings in Skidmore, owner-occupied units account for 101 (86.3%), while renter-occupied units make up 16 (13.7%).
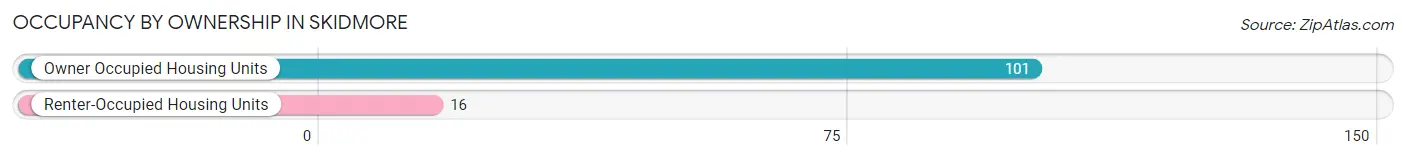
| Occupancy | # Housing Units | % Housing Units |
| Owner Occupied Housing Units | 101 | 86.3% |
| Renter-Occupied Housing Units | 16 | 13.7% |
| Total Occupied Housing Units | 117 | 100.0% |
Occupancy by Household Size in Skidmore
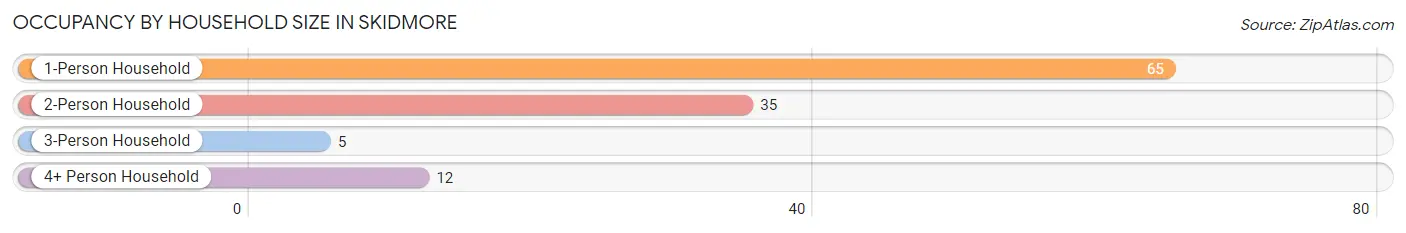
| Household Size | # Housing Units | % Housing Units |
| 1-Person Household | 65 | 55.6% |
| 2-Person Household | 35 | 29.9% |
| 3-Person Household | 5 | 4.3% |
| 4+ Person Household | 12 | 10.3% |
| Total Housing Units | 117 | 100.0% |
Occupancy by Ownership by Household Size in Skidmore
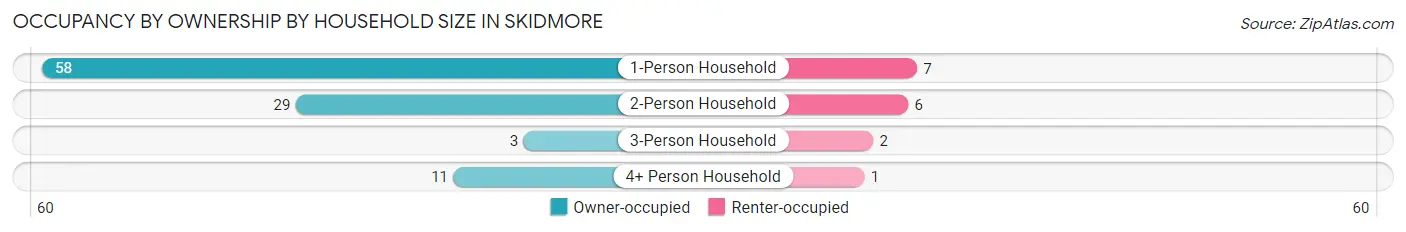
| Household Size | Owner-occupied | Renter-occupied |
| 1-Person Household | 58 (89.2%) | 7 (10.8%) |
| 2-Person Household | 29 (82.9%) | 6 (17.1%) |
| 3-Person Household | 3 (60.0%) | 2 (40.0%) |
| 4+ Person Household | 11 (91.7%) | 1 (8.3%) |
| Total Housing Units | 101 (86.3%) | 16 (13.7%) |
Occupancy by Educational Attainment in Skidmore
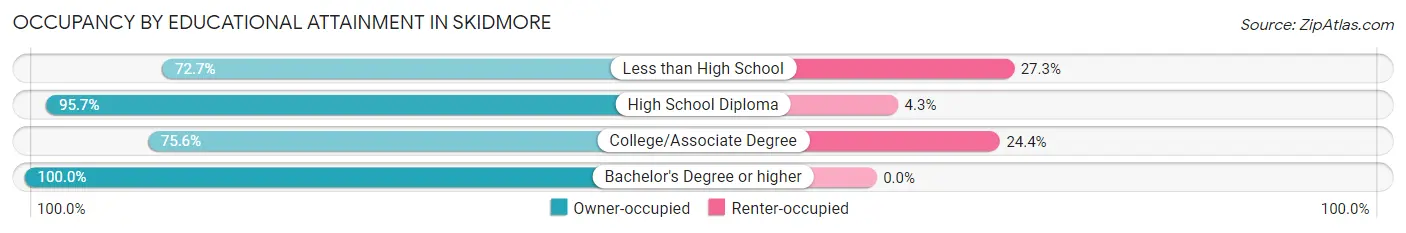
| Household Size | Owner-occupied | Renter-occupied |
| Less than High School | 8 (72.7%) | 3 (27.3%) |
| High School Diploma | 45 (95.7%) | 2 (4.3%) |
| College/Associate Degree | 34 (75.6%) | 11 (24.4%) |
| Bachelor's Degree or higher | 14 (100.0%) | 0 (0.0%) |
Occupancy by Age of Householder in Skidmore
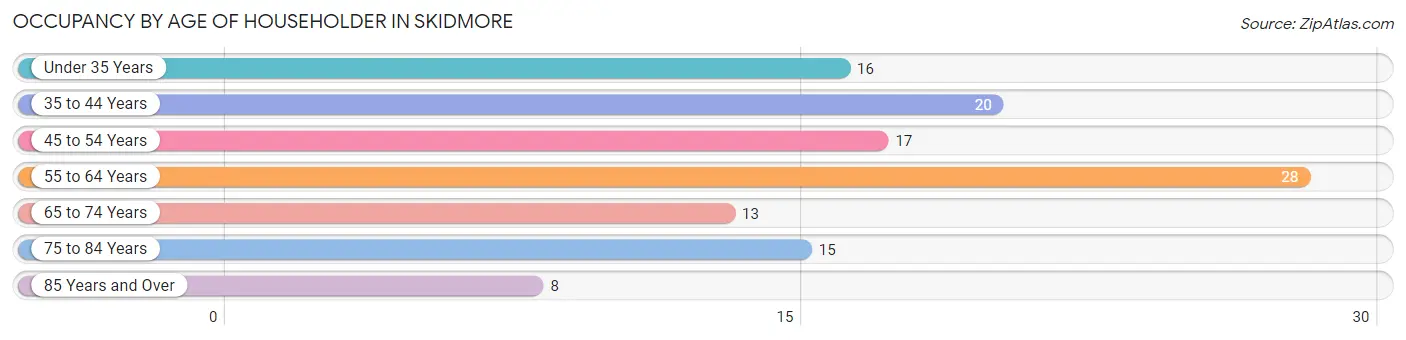
| Age Bracket | # Households | % Households |
| Under 35 Years | 16 | 13.7% |
| 35 to 44 Years | 20 | 17.1% |
| 45 to 54 Years | 17 | 14.5% |
| 55 to 64 Years | 28 | 23.9% |
| 65 to 74 Years | 13 | 11.1% |
| 75 to 84 Years | 15 | 12.8% |
| 85 Years and Over | 8 | 6.8% |
| Total | 117 | 100.0% |
Housing Finances in Skidmore
Median Income by Occupancy in Skidmore
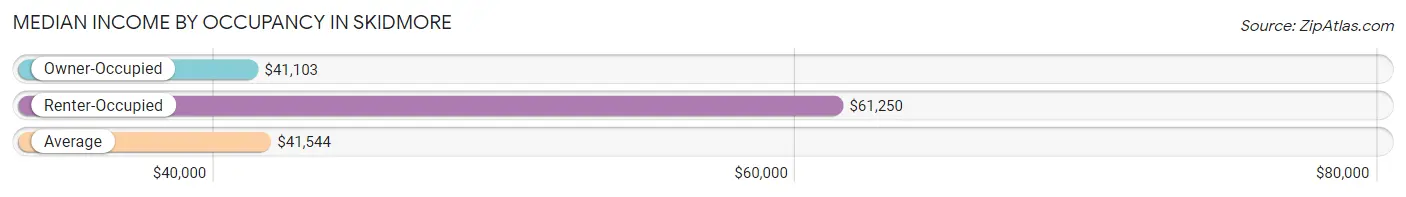
| Occupancy Type | # Households | Median Income |
| Owner-Occupied | 101 (86.3%) | $41,103 |
| Renter-Occupied | 16 (13.7%) | $61,250 |
| Average | 117 (100.0%) | $41,544 |
Occupancy by Householder Income Bracket in Skidmore
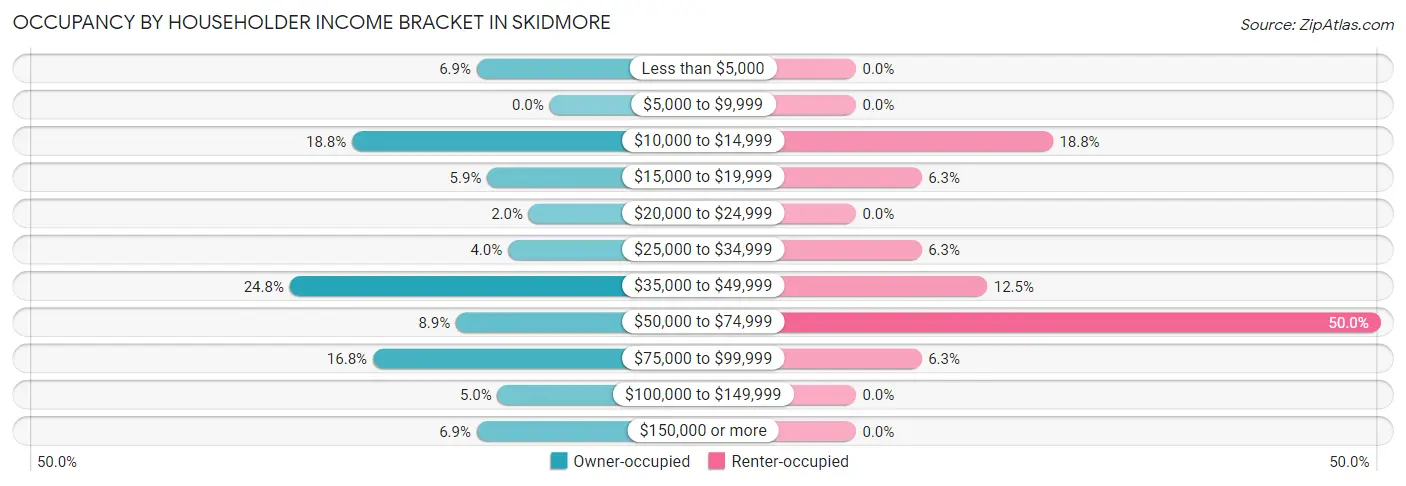
| Income Bracket | Owner-occupied | Renter-occupied |
| Less than $5,000 | 7 (6.9%) | 0 (0.0%) |
| $5,000 to $9,999 | 0 (0.0%) | 0 (0.0%) |
| $10,000 to $14,999 | 19 (18.8%) | 3 (18.8%) |
| $15,000 to $19,999 | 6 (5.9%) | 1 (6.2%) |
| $20,000 to $24,999 | 2 (2.0%) | 0 (0.0%) |
| $25,000 to $34,999 | 4 (4.0%) | 1 (6.2%) |
| $35,000 to $49,999 | 25 (24.7%) | 2 (12.5%) |
| $50,000 to $74,999 | 9 (8.9%) | 8 (50.0%) |
| $75,000 to $99,999 | 17 (16.8%) | 1 (6.2%) |
| $100,000 to $149,999 | 5 (5.0%) | 0 (0.0%) |
| $150,000 or more | 7 (6.9%) | 0 (0.0%) |
| Total | 101 (100.0%) | 16 (100.0%) |
Monthly Housing Cost Tiers in Skidmore
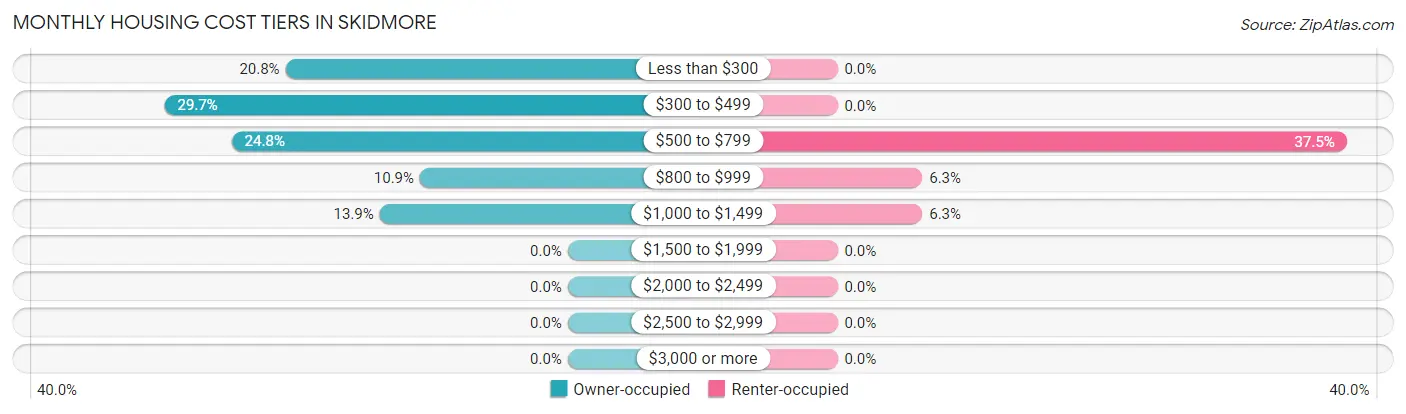
| Monthly Cost | Owner-occupied | Renter-occupied |
| Less than $300 | 21 (20.8%) | 0 (0.0%) |
| $300 to $499 | 30 (29.7%) | 0 (0.0%) |
| $500 to $799 | 25 (24.7%) | 6 (37.5%) |
| $800 to $999 | 11 (10.9%) | 1 (6.2%) |
| $1,000 to $1,499 | 14 (13.9%) | 1 (6.2%) |
| $1,500 to $1,999 | 0 (0.0%) | 0 (0.0%) |
| $2,000 to $2,499 | 0 (0.0%) | 0 (0.0%) |
| $2,500 to $2,999 | 0 (0.0%) | 0 (0.0%) |
| $3,000 or more | 0 (0.0%) | 0 (0.0%) |
| Total | 101 (100.0%) | 16 (100.0%) |
Physical Housing Characteristics in Skidmore
Housing Structures in Skidmore
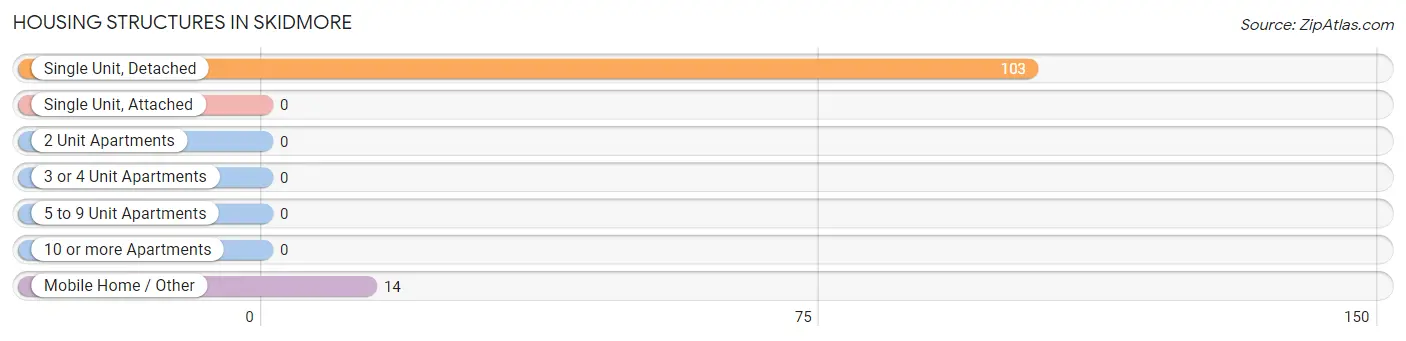
| Structure Type | # Housing Units | % Housing Units |
| Single Unit, Detached | 103 | 88.0% |
| Single Unit, Attached | 0 | 0.0% |
| 2 Unit Apartments | 0 | 0.0% |
| 3 or 4 Unit Apartments | 0 | 0.0% |
| 5 to 9 Unit Apartments | 0 | 0.0% |
| 10 or more Apartments | 0 | 0.0% |
| Mobile Home / Other | 14 | 12.0% |
| Total | 117 | 100.0% |
Housing Structures by Occupancy in Skidmore
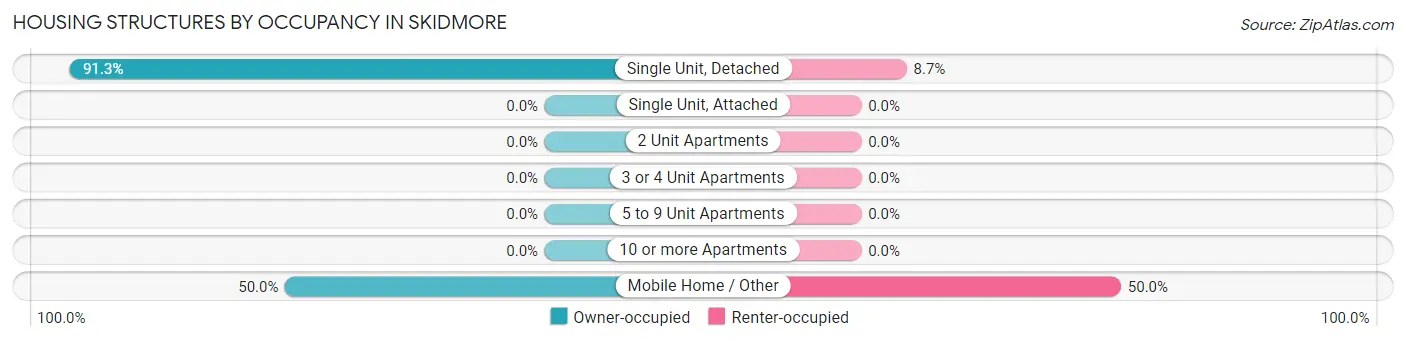
| Structure Type | Owner-occupied | Renter-occupied |
| Single Unit, Detached | 94 (91.3%) | 9 (8.7%) |
| Single Unit, Attached | 0 (0.0%) | 0 (0.0%) |
| 2 Unit Apartments | 0 (0.0%) | 0 (0.0%) |
| 3 or 4 Unit Apartments | 0 (0.0%) | 0 (0.0%) |
| 5 to 9 Unit Apartments | 0 (0.0%) | 0 (0.0%) |
| 10 or more Apartments | 0 (0.0%) | 0 (0.0%) |
| Mobile Home / Other | 7 (50.0%) | 7 (50.0%) |
| Total | 101 (86.3%) | 16 (13.7%) |
Housing Structures by Number of Rooms in Skidmore
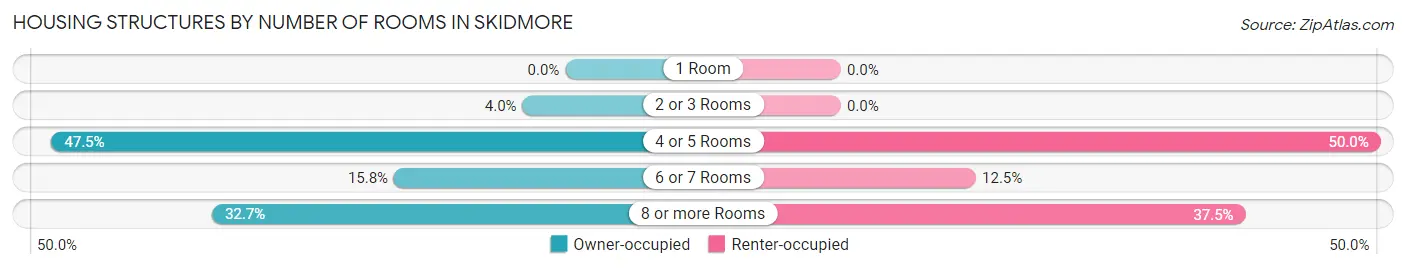
| Number of Rooms | Owner-occupied | Renter-occupied |
| 1 Room | 0 (0.0%) | 0 (0.0%) |
| 2 or 3 Rooms | 4 (4.0%) | 0 (0.0%) |
| 4 or 5 Rooms | 48 (47.5%) | 8 (50.0%) |
| 6 or 7 Rooms | 16 (15.8%) | 2 (12.5%) |
| 8 or more Rooms | 33 (32.7%) | 6 (37.5%) |
| Total | 101 (100.0%) | 16 (100.0%) |
Housing Structure by Heating Type in Skidmore
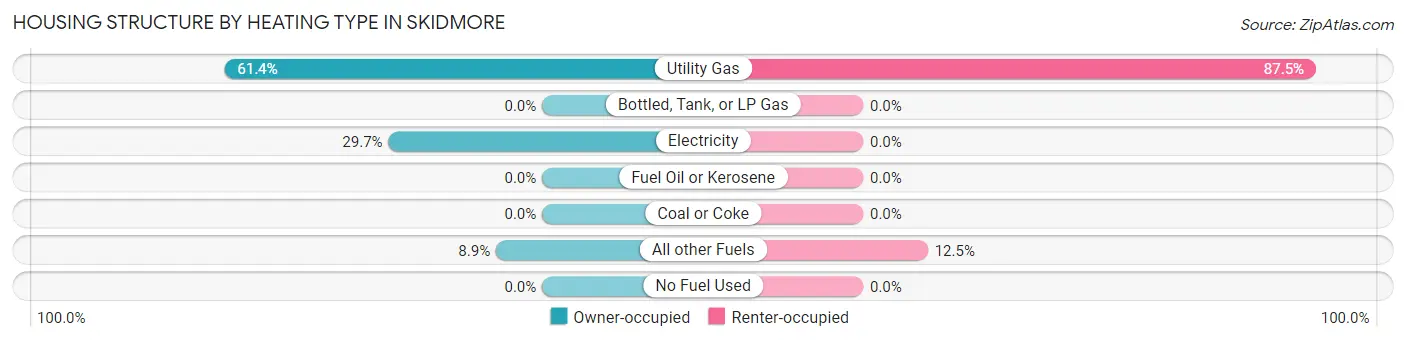
| Heating Type | Owner-occupied | Renter-occupied |
| Utility Gas | 62 (61.4%) | 14 (87.5%) |
| Bottled, Tank, or LP Gas | 0 (0.0%) | 0 (0.0%) |
| Electricity | 30 (29.7%) | 0 (0.0%) |
| Fuel Oil or Kerosene | 0 (0.0%) | 0 (0.0%) |
| Coal or Coke | 0 (0.0%) | 0 (0.0%) |
| All other Fuels | 9 (8.9%) | 2 (12.5%) |
| No Fuel Used | 0 (0.0%) | 0 (0.0%) |
| Total | 101 (100.0%) | 16 (100.0%) |
Household Vehicle Usage in Skidmore
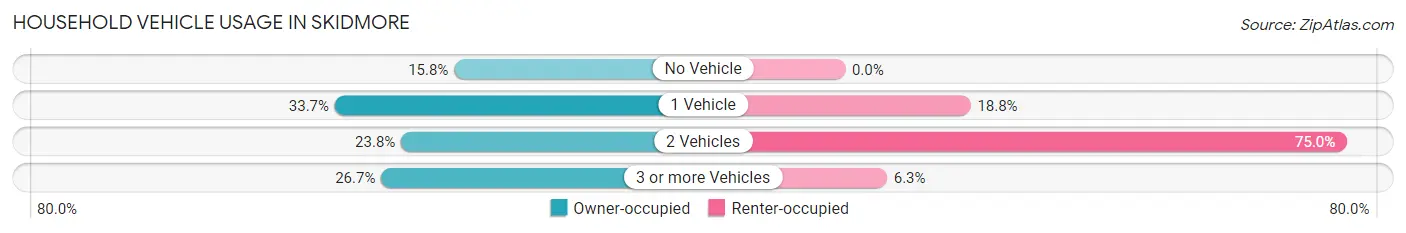
| Vehicles per Household | Owner-occupied | Renter-occupied |
| No Vehicle | 16 (15.8%) | 0 (0.0%) |
| 1 Vehicle | 34 (33.7%) | 3 (18.8%) |
| 2 Vehicles | 24 (23.8%) | 12 (75.0%) |
| 3 or more Vehicles | 27 (26.7%) | 1 (6.2%) |
| Total | 101 (100.0%) | 16 (100.0%) |
Real Estate & Mortgages in Skidmore
Real Estate and Mortgage Overview in Skidmore
| Characteristic | Without Mortgage | With Mortgage |
| Housing Units | 54 | 47 |
| Median Property Value | $53,800 | $55,600 |
| Median Household Income | - | - |
| Monthly Housing Costs | $350 | $0 |
| Real Estate Taxes | $490 | $1 |
Property Value by Mortgage Status in Skidmore
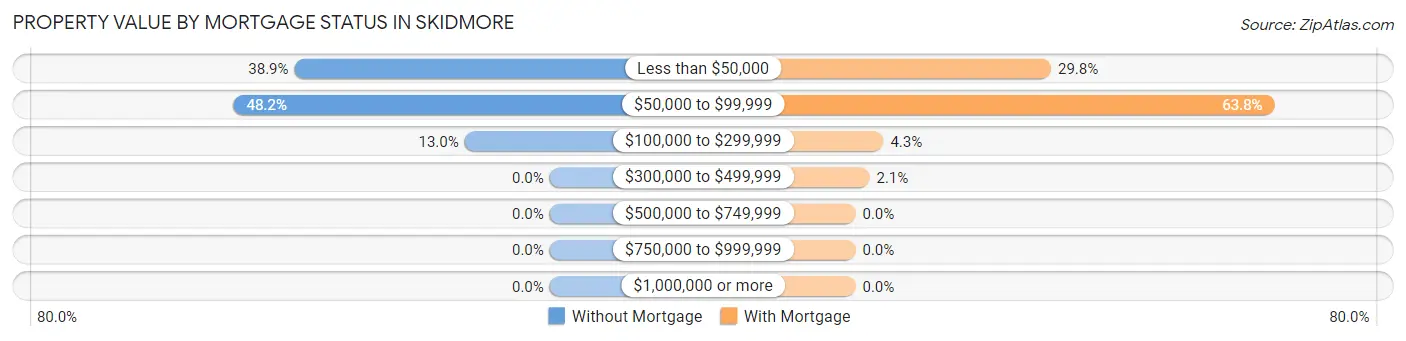
| Property Value | Without Mortgage | With Mortgage |
| Less than $50,000 | 21 (38.9%) | 14 (29.8%) |
| $50,000 to $99,999 | 26 (48.1%) | 30 (63.8%) |
| $100,000 to $299,999 | 7 (13.0%) | 2 (4.3%) |
| $300,000 to $499,999 | 0 (0.0%) | 1 (2.1%) |
| $500,000 to $749,999 | 0 (0.0%) | 0 (0.0%) |
| $750,000 to $999,999 | 0 (0.0%) | 0 (0.0%) |
| $1,000,000 or more | 0 (0.0%) | 0 (0.0%) |
| Total | 54 (100.0%) | 47 (100.0%) |
Household Income by Mortgage Status in Skidmore
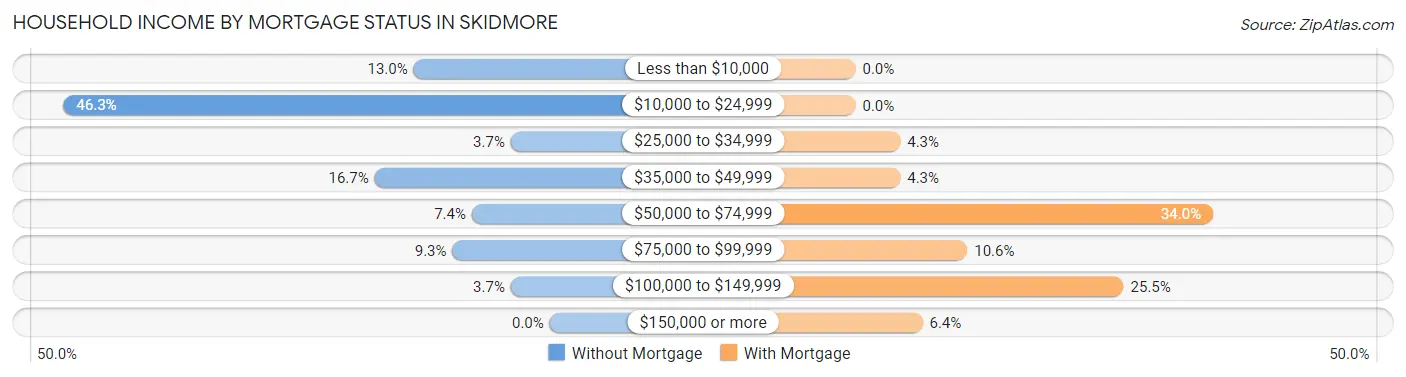
| Household Income | Without Mortgage | With Mortgage |
| Less than $10,000 | 7 (13.0%) | 0 (0.0%) |
| $10,000 to $24,999 | 25 (46.3%) | 0 (0.0%) |
| $25,000 to $34,999 | 2 (3.7%) | 2 (4.3%) |
| $35,000 to $49,999 | 9 (16.7%) | 2 (4.3%) |
| $50,000 to $74,999 | 4 (7.4%) | 16 (34.0%) |
| $75,000 to $99,999 | 5 (9.3%) | 5 (10.6%) |
| $100,000 to $149,999 | 2 (3.7%) | 12 (25.5%) |
| $150,000 or more | 0 (0.0%) | 3 (6.4%) |
| Total | 54 (100.0%) | 47 (100.0%) |
Property Value to Household Income Ratio in Skidmore
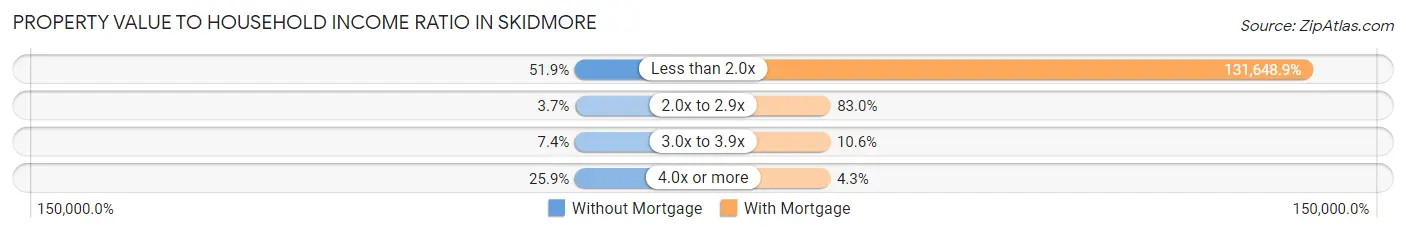
| Value-to-Income Ratio | Without Mortgage | With Mortgage |
| Less than 2.0x | 28 (51.8%) | 61,875 (131,648.9%) |
| 2.0x to 2.9x | 2 (3.7%) | 39 (83.0%) |
| 3.0x to 3.9x | 4 (7.4%) | 5 (10.6%) |
| 4.0x or more | 14 (25.9%) | 2 (4.3%) |
| Total | 54 (100.0%) | 47 (100.0%) |
Real Estate Taxes by Mortgage Status in Skidmore
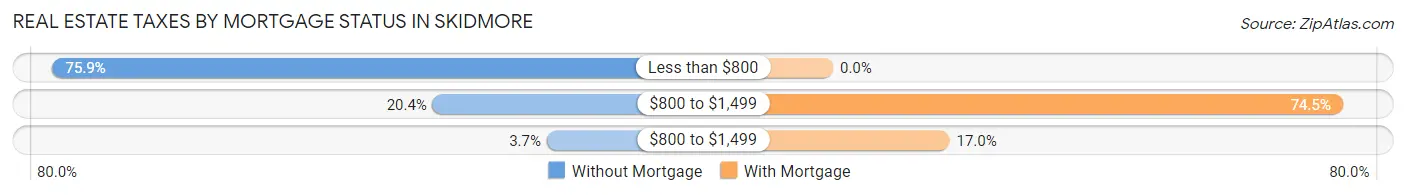
| Property Taxes | Without Mortgage | With Mortgage |
| Less than $800 | 41 (75.9%) | 0 (0.0%) |
| $800 to $1,499 | 11 (20.4%) | 35 (74.5%) |
| $800 to $1,499 | 2 (3.7%) | 8 (17.0%) |
| Total | 54 (100.0%) | 47 (100.0%) |
Health & Disability in Skidmore
Health Insurance Coverage by Age in Skidmore
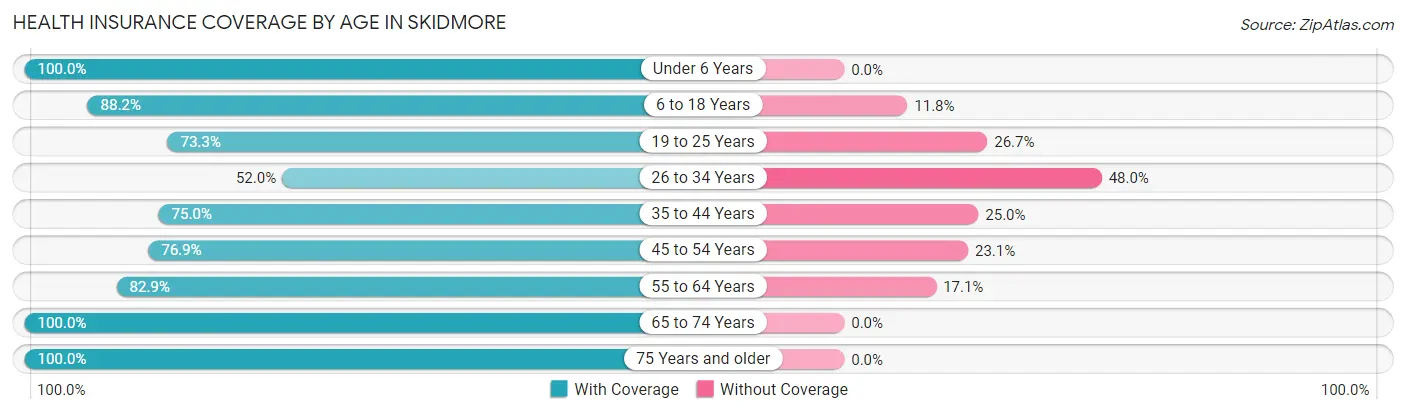
| Age Bracket | With Coverage | Without Coverage |
| Under 6 Years | 9 (100.0%) | 0 (0.0%) |
| 6 to 18 Years | 30 (88.2%) | 4 (11.8%) |
| 19 to 25 Years | 11 (73.3%) | 4 (26.7%) |
| 26 to 34 Years | 13 (52.0%) | 12 (48.0%) |
| 35 to 44 Years | 24 (75.0%) | 8 (25.0%) |
| 45 to 54 Years | 20 (76.9%) | 6 (23.1%) |
| 55 to 64 Years | 29 (82.9%) | 6 (17.1%) |
| 65 to 74 Years | 25 (100.0%) | 0 (0.0%) |
| 75 Years and older | 26 (100.0%) | 0 (0.0%) |
| Total | 187 (82.4%) | 40 (17.6%) |
Health Insurance Coverage by Citizenship Status in Skidmore
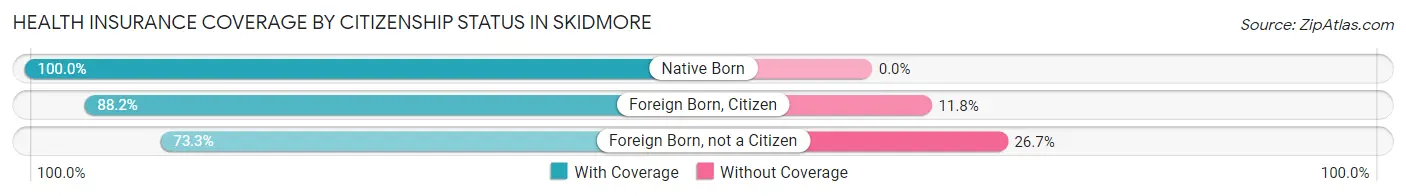
| Citizenship Status | With Coverage | Without Coverage |
| Native Born | 9 (100.0%) | 0 (0.0%) |
| Foreign Born, Citizen | 30 (88.2%) | 4 (11.8%) |
| Foreign Born, not a Citizen | 11 (73.3%) | 4 (26.7%) |
Health Insurance Coverage by Household Income in Skidmore
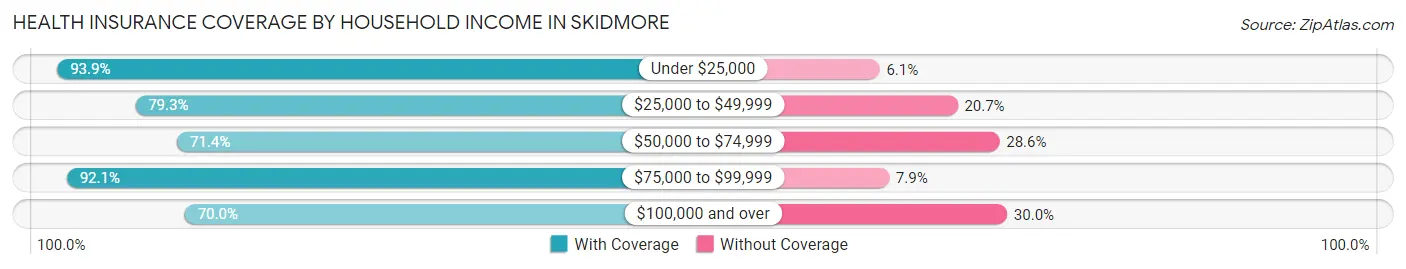
| Household Income | With Coverage | Without Coverage |
| Under $25,000 | 46 (93.9%) | 3 (6.1%) |
| $25,000 to $49,999 | 65 (79.3%) | 17 (20.7%) |
| $50,000 to $74,999 | 20 (71.4%) | 8 (28.6%) |
| $75,000 to $99,999 | 35 (92.1%) | 3 (7.9%) |
| $100,000 and over | 21 (70.0%) | 9 (30.0%) |
Public vs Private Health Insurance Coverage by Age in Skidmore
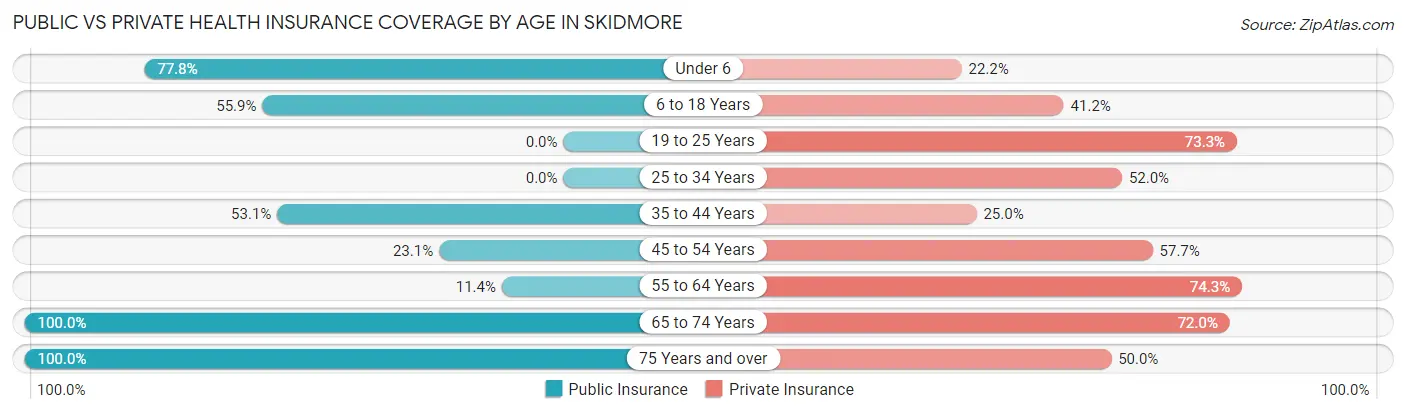
| Age Bracket | Public Insurance | Private Insurance |
| Under 6 | 7 (77.8%) | 2 (22.2%) |
| 6 to 18 Years | 19 (55.9%) | 14 (41.2%) |
| 19 to 25 Years | 0 (0.0%) | 11 (73.3%) |
| 25 to 34 Years | 0 (0.0%) | 13 (52.0%) |
| 35 to 44 Years | 17 (53.1%) | 8 (25.0%) |
| 45 to 54 Years | 6 (23.1%) | 15 (57.7%) |
| 55 to 64 Years | 4 (11.4%) | 26 (74.3%) |
| 65 to 74 Years | 25 (100.0%) | 18 (72.0%) |
| 75 Years and over | 26 (100.0%) | 13 (50.0%) |
| Total | 104 (45.8%) | 120 (52.9%) |
Disability Status by Sex by Age in Skidmore
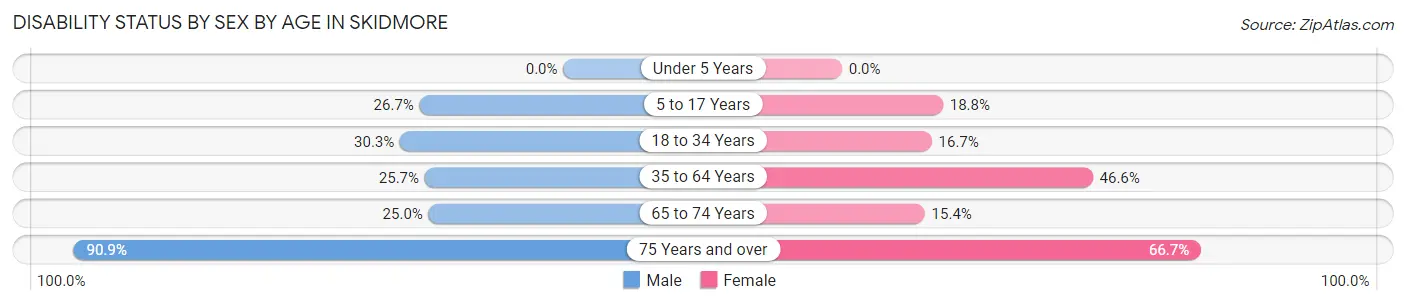
| Age Bracket | Male | Female |
| Under 5 Years | 0 (0.0%) | 0 (0.0%) |
| 5 to 17 Years | 4 (26.7%) | 3 (18.8%) |
| 18 to 34 Years | 10 (30.3%) | 2 (16.7%) |
| 35 to 64 Years | 9 (25.7%) | 27 (46.6%) |
| 65 to 74 Years | 3 (25.0%) | 2 (15.4%) |
| 75 Years and over | 10 (90.9%) | 10 (66.7%) |
Disability Class by Sex by Age in Skidmore
Disability Class: Hearing Difficulty
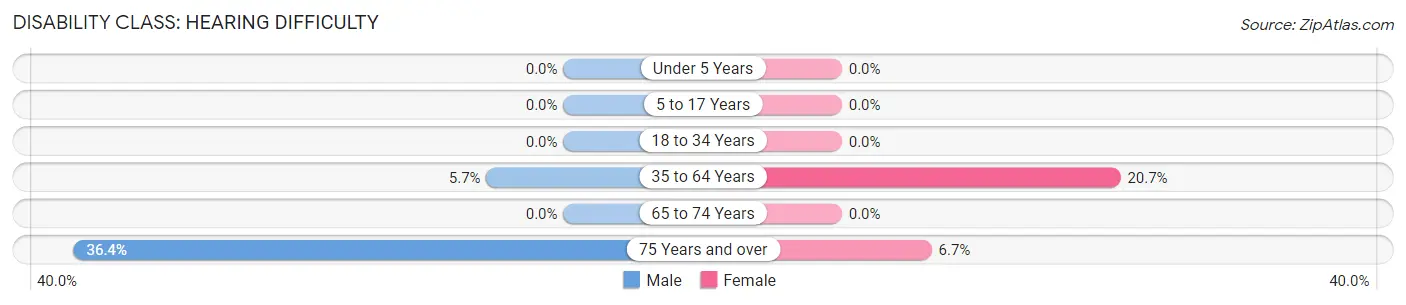
| Age Bracket | Male | Female |
| Under 5 Years | 0 (0.0%) | 0 (0.0%) |
| 5 to 17 Years | 0 (0.0%) | 0 (0.0%) |
| 18 to 34 Years | 0 (0.0%) | 0 (0.0%) |
| 35 to 64 Years | 2 (5.7%) | 12 (20.7%) |
| 65 to 74 Years | 0 (0.0%) | 0 (0.0%) |
| 75 Years and over | 4 (36.4%) | 1 (6.7%) |
Disability Class: Vision Difficulty
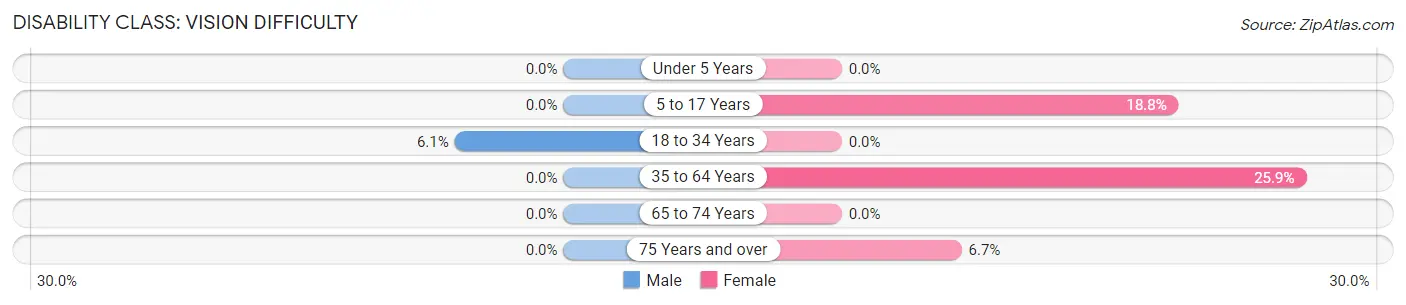
| Age Bracket | Male | Female |
| Under 5 Years | 0 (0.0%) | 0 (0.0%) |
| 5 to 17 Years | 0 (0.0%) | 3 (18.8%) |
| 18 to 34 Years | 2 (6.1%) | 0 (0.0%) |
| 35 to 64 Years | 0 (0.0%) | 15 (25.9%) |
| 65 to 74 Years | 0 (0.0%) | 0 (0.0%) |
| 75 Years and over | 0 (0.0%) | 1 (6.7%) |
Disability Class: Cognitive Difficulty
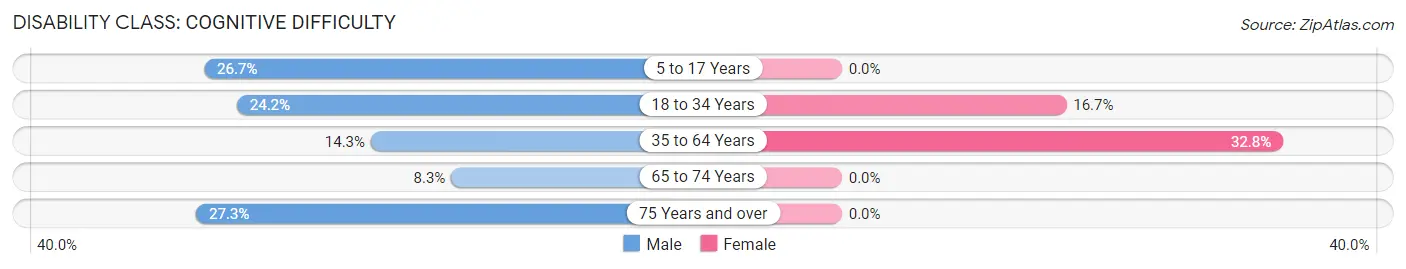
| Age Bracket | Male | Female |
| 5 to 17 Years | 4 (26.7%) | 0 (0.0%) |
| 18 to 34 Years | 8 (24.2%) | 2 (16.7%) |
| 35 to 64 Years | 5 (14.3%) | 19 (32.8%) |
| 65 to 74 Years | 1 (8.3%) | 0 (0.0%) |
| 75 Years and over | 3 (27.3%) | 0 (0.0%) |
Disability Class: Ambulatory Difficulty
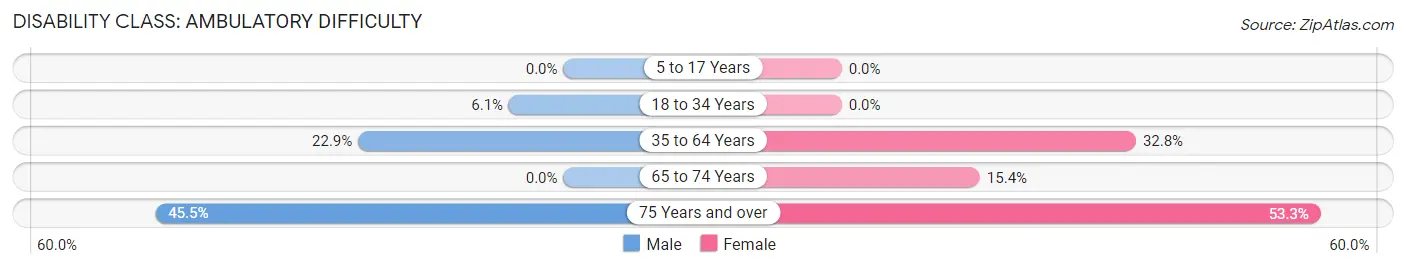
| Age Bracket | Male | Female |
| 5 to 17 Years | 0 (0.0%) | 0 (0.0%) |
| 18 to 34 Years | 2 (6.1%) | 0 (0.0%) |
| 35 to 64 Years | 8 (22.9%) | 19 (32.8%) |
| 65 to 74 Years | 0 (0.0%) | 2 (15.4%) |
| 75 Years and over | 5 (45.5%) | 8 (53.3%) |
Disability Class: Self-Care Difficulty
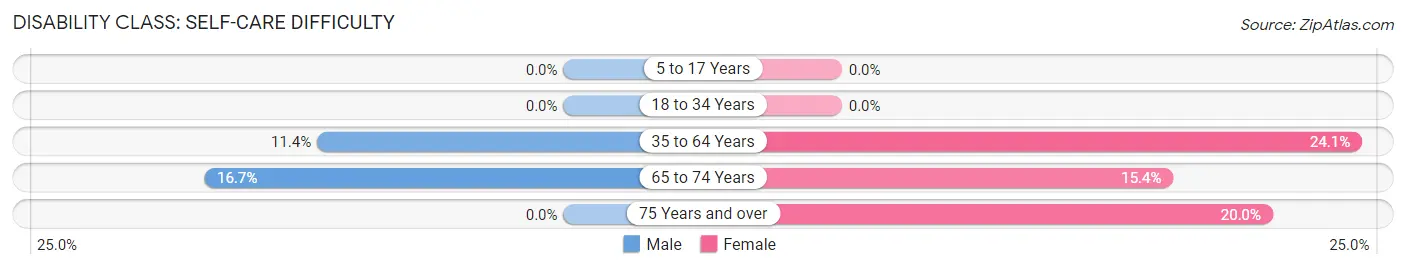
| Age Bracket | Male | Female |
| 5 to 17 Years | 0 (0.0%) | 0 (0.0%) |
| 18 to 34 Years | 0 (0.0%) | 0 (0.0%) |
| 35 to 64 Years | 4 (11.4%) | 14 (24.1%) |
| 65 to 74 Years | 2 (16.7%) | 2 (15.4%) |
| 75 Years and over | 0 (0.0%) | 3 (20.0%) |
Technology Access in Skidmore
Computing Device Access in Skidmore
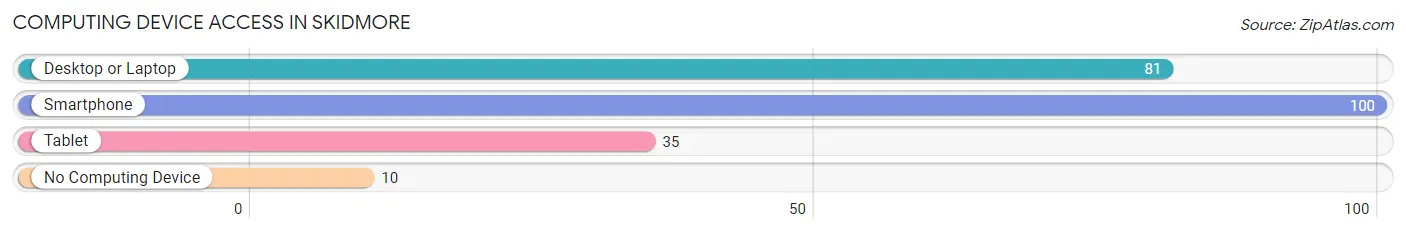
| Device Type | # Households | % Households |
| Desktop or Laptop | 81 | 69.2% |
| Smartphone | 100 | 85.5% |
| Tablet | 35 | 29.9% |
| No Computing Device | 10 | 8.6% |
| Total | 117 | 100.0% |
Internet Access in Skidmore
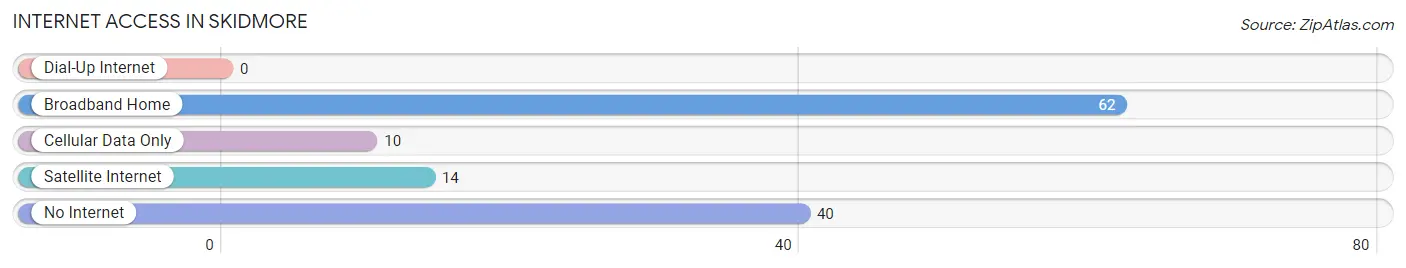
| Internet Type | # Households | % Households |
| Dial-Up Internet | 0 | 0.0% |
| Broadband Home | 62 | 53.0% |
| Cellular Data Only | 10 | 8.6% |
| Satellite Internet | 14 | 12.0% |
| No Internet | 40 | 34.2% |
| Total | 117 | 100.0% |
Skidmore Summary
Skidmore, Missouri is a small town located in Nodaway County in the northwest corner of the state. It is situated on the banks of the Nodaway River, about 25 miles south of Maryville. The town was founded in 1872 and was named after the Skidmore family, who were early settlers in the area.
Geography
Skidmore is located at 40°25'N 94°45'W. It is situated on the banks of the Nodaway River, about 25 miles south of Maryville. The town is located in the northwest corner of Missouri, and is part of the Platte Purchase region. The town is surrounded by rolling hills and farmland, and is located in a rural area. The nearest major city is St. Joseph, which is about 50 miles away.
The climate in Skidmore is typical of the Midwest, with hot summers and cold winters. The average temperature in the summer is around 80 degrees Fahrenheit, and the average temperature in the winter is around 30 degrees Fahrenheit. The average annual precipitation is around 40 inches.
Economy
Skidmore has a small economy, with most of the businesses located in the downtown area. The main industries in the town are agriculture and manufacturing. The town is home to several small businesses, including a grocery store, a hardware store, a restaurant, and a few other small shops. The town also has a few small manufacturing plants, which produce a variety of products, including furniture, clothing, and automotive parts.
The town is also home to a few small farms, which produce a variety of crops, including corn, soybeans, and wheat. The town also has a few small businesses that provide services, such as auto repair, plumbing, and electrical work.
Demographics
As of the 2010 census, the population of Skidmore was 1,093. The population is predominantly white, with a small percentage of African Americans and Hispanics. The median household income is around $35,000, and the median home value is around $90,000. The town has a high rate of poverty, with around 25% of the population living below the poverty line.
Conclusion
Skidmore, Missouri is a small town located in Nodaway County in the northwest corner of the state. It is situated on the banks of the Nodaway River, about 25 miles south of Maryville. The town was founded in 1872 and was named after the Skidmore family, who were early settlers in the area. The town has a small economy, with most of the businesses located in the downtown area. The main industries in the town are agriculture and manufacturing. The population of Skidmore is predominantly white, with a small percentage of African Americans and Hispanics. The median household income is around $35,000, and the median home value is around $90,000. The town has a high rate of poverty, with around 25% of the population living below the poverty line.
Common Questions
What is Per Capita Income in Skidmore?
Per Capita income in Skidmore is $50,297.
What is the Median Family Income in Skidmore?
Median Family Income in Skidmore is $73,750.
What is the Median Household income in Skidmore?
Median Household Income in Skidmore is $41,544.
What is Income or Wage Gap in Skidmore?
Income or Wage Gap in Skidmore is 20.8%.
Women in Skidmore earn 79.2 cents for every dollar earned by a man.
What is Inequality or Gini Index in Skidmore?
Inequality or Gini Index in Skidmore is 0.68.
What is the Total Population of Skidmore?
Total Population of Skidmore is 227.
What is the Total Male Population of Skidmore?
Total Male Population of Skidmore is 110.
What is the Total Female Population of Skidmore?
Total Female Population of Skidmore is 117.
What is the Ratio of Males per 100 Females in Skidmore?
There are 94.02 Males per 100 Females in Skidmore.
What is the Ratio of Females per 100 Males in Skidmore?
There are 106.36 Females per 100 Males in Skidmore.
What is the Median Population Age in Skidmore?
Median Population Age in Skidmore is 43.9 Years.
What is the Average Family Size in Skidmore
Average Family Size in Skidmore is 3.3 People.
What is the Average Household Size in Skidmore
Average Household Size in Skidmore is 1.9 People.
How Large is the Labor Force in Skidmore?
There are 108 People in the Labor Forcein in Skidmore.
What is the Percentage of People in the Labor Force in Skidmore?
55.7% of People are in the Labor Force in Skidmore.
What is the Unemployment Rate in Skidmore?
Unemployment Rate in Skidmore is 6.5%.