Banquete, TX Map & Demographics
Banquete Map
Banquete Overview
$22,636
PER CAPITA INCOME
0.46
INEQUALITY / GINI INDEX
455
TOTAL POPULATION
299
MALE POPULATION
156
FEMALE POPULATION
191.67
MALES / 100 FEMALES
52.17
FEMALES / 100 MALES
39.0
MEDIAN AGE
3.5
AVG FAMILY SIZE
2.7
AVG HOUSEHOLD SIZE
209
LABOR FORCE [ PEOPLE ]
62.8%
PERCENT IN LABOR FORCE
17.2%
UNEMPLOYMENT RATE
Banquete Zip Codes
Banquete Area Codes
Income in Banquete
Income Overview in Banquete
| Characteristic | Number | Measure |
| Per Capita Income | 455 | $22,636 |
| Median Family Income | 113 | $0 |
| Mean Family Income | 113 | $67,748 |
| Median Household Income | 170 | $0 |
| Mean Household Income | 170 | $57,031 |
| Income Deficit | 113 | $0 |
| Wage / Income Gap (%) | 455 | 0.00% |
| Wage / Income Gap ($) | 455 | 100.00¢ per $1 |
| Gini / Inequality Index | 455 | 0.46 |
Earnings by Sex in Banquete
| Sex | Number | Average Earnings |
| Male | 146 (69.9%) | $0 |
| Female | 63 (30.1%) | $0 |
| Total | 209 (100.0%) | $0 |
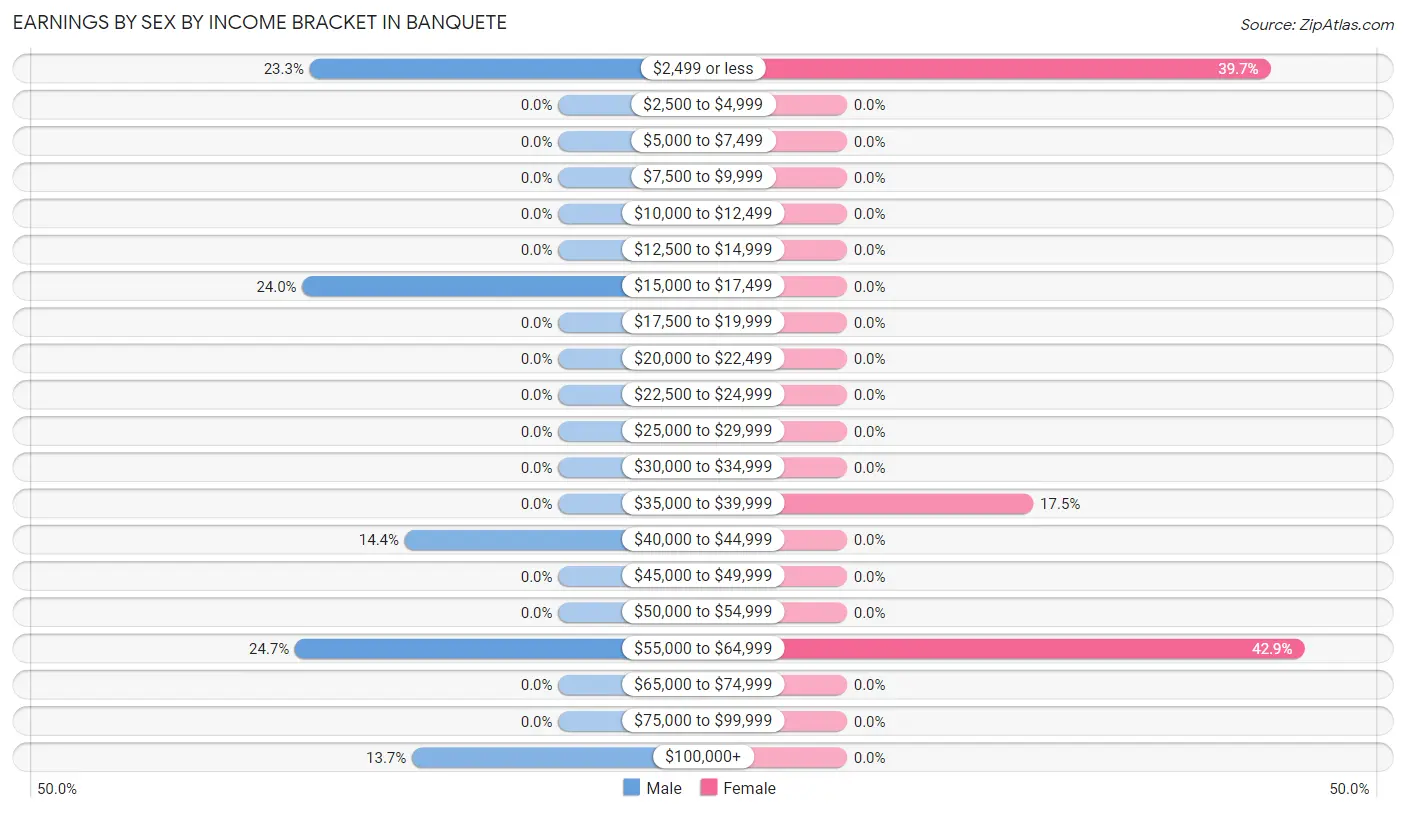
Earnings by Sex by Income Bracket in Banquete
The most common earnings brackets in Banquete are $55,000 to $64,999 for men (36 | 24.7%) and $55,000 to $64,999 for women (27 | 42.9%).
| Income | Male | Female |
| $2,499 or less | 34 (23.3%) | 25 (39.7%) |
| $2,500 to $4,999 | 0 (0.0%) | 0 (0.0%) |
| $5,000 to $7,499 | 0 (0.0%) | 0 (0.0%) |
| $7,500 to $9,999 | 0 (0.0%) | 0 (0.0%) |
| $10,000 to $12,499 | 0 (0.0%) | 0 (0.0%) |
| $12,500 to $14,999 | 0 (0.0%) | 0 (0.0%) |
| $15,000 to $17,499 | 35 (24.0%) | 0 (0.0%) |
| $17,500 to $19,999 | 0 (0.0%) | 0 (0.0%) |
| $20,000 to $22,499 | 0 (0.0%) | 0 (0.0%) |
| $22,500 to $24,999 | 0 (0.0%) | 0 (0.0%) |
| $25,000 to $29,999 | 0 (0.0%) | 0 (0.0%) |
| $30,000 to $34,999 | 0 (0.0%) | 0 (0.0%) |
| $35,000 to $39,999 | 0 (0.0%) | 11 (17.5%) |
| $40,000 to $44,999 | 21 (14.4%) | 0 (0.0%) |
| $45,000 to $49,999 | 0 (0.0%) | 0 (0.0%) |
| $50,000 to $54,999 | 0 (0.0%) | 0 (0.0%) |
| $55,000 to $64,999 | 36 (24.7%) | 27 (42.9%) |
| $65,000 to $74,999 | 0 (0.0%) | 0 (0.0%) |
| $75,000 to $99,999 | 0 (0.0%) | 0 (0.0%) |
| $100,000+ | 20 (13.7%) | 0 (0.0%) |
| Total | 146 (100.0%) | 63 (100.0%) |
Earnings by Sex by Educational Attainment in Banquete
| Educational Attainment | Male Income | Female Income |
| Less than High School | - | - |
| High School Diploma | - | - |
| College or Associate's Degree | - | - |
| Bachelor's Degree | - | - |
| Graduate Degree | - | - |
| Total | - | - |
Family Income in Banquete
Family Income Brackets in Banquete
According to the Banquete family income data, there are 35 families falling into the $15,000 to $24,999 income range, which is the most common income bracket and makes up 31.0% of all families.
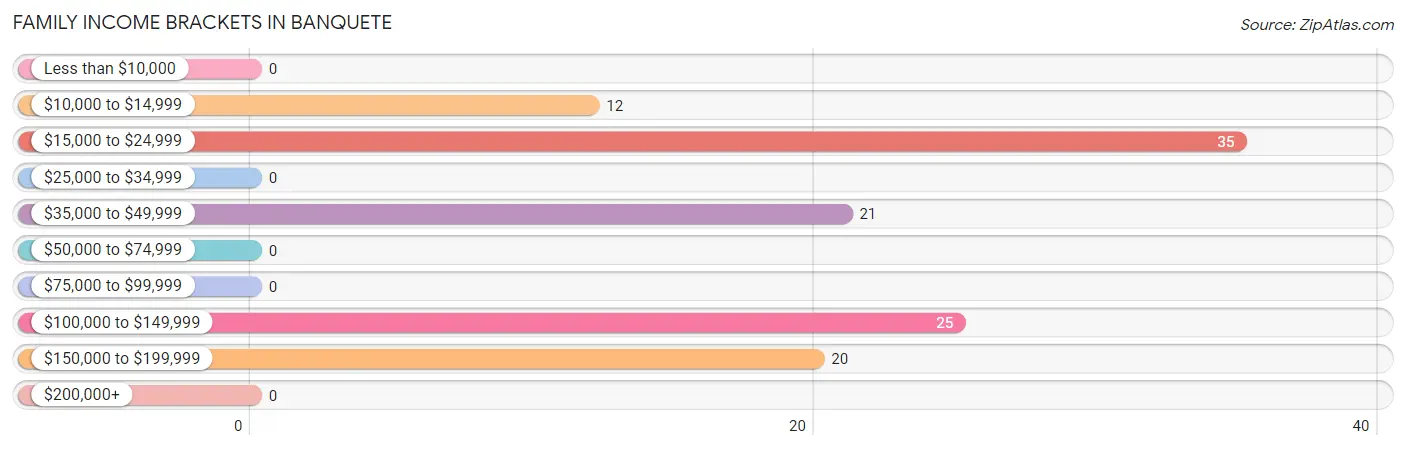
| Income Bracket | # Families | % Families |
| Less than $10,000 | 0 | 0.0% |
| $10,000 to $14,999 | 12 | 10.6% |
| $15,000 to $24,999 | 35 | 31.0% |
| $25,000 to $34,999 | 0 | 0.0% |
| $35,000 to $49,999 | 21 | 18.6% |
| $50,000 to $74,999 | 0 | 0.0% |
| $75,000 to $99,999 | 0 | 0.0% |
| $100,000 to $149,999 | 25 | 22.1% |
| $150,000 to $199,999 | 20 | 17.7% |
| $200,000+ | 0 | 0.0% |
Family Income by Famaliy Size in Banquete
| Income Bracket | # Families | Median Income |
| 2-Person Families | 35 (31.0%) | $0 |
| 3-Person Families | 58 (51.3%) | $0 |
| 4-Person Families | 0 (0.0%) | $0 |
| 5-Person Families | 20 (17.7%) | $0 |
| 6-Person Families | 0 (0.0%) | $0 |
| 7+ Person Families | 0 (0.0%) | $0 |
| Total | 113 (100.0%) | $0 |
Family Income by Number of Earners in Banquete
| Number of Earners | # Families | Median Income |
| No Earners | 12 (10.6%) | $0 |
| 1 Earner | 56 (49.6%) | $0 |
| 2 Earners | 20 (17.7%) | $0 |
| 3+ Earners | 25 (22.1%) | $0 |
| Total | 113 (100.0%) | $0 |
Household Income in Banquete
Household Income Brackets in Banquete
With 42 households falling in the category, the $10,000 to $14,999 income range is the most frequent in Banquete, accounting for 24.7% of all households.
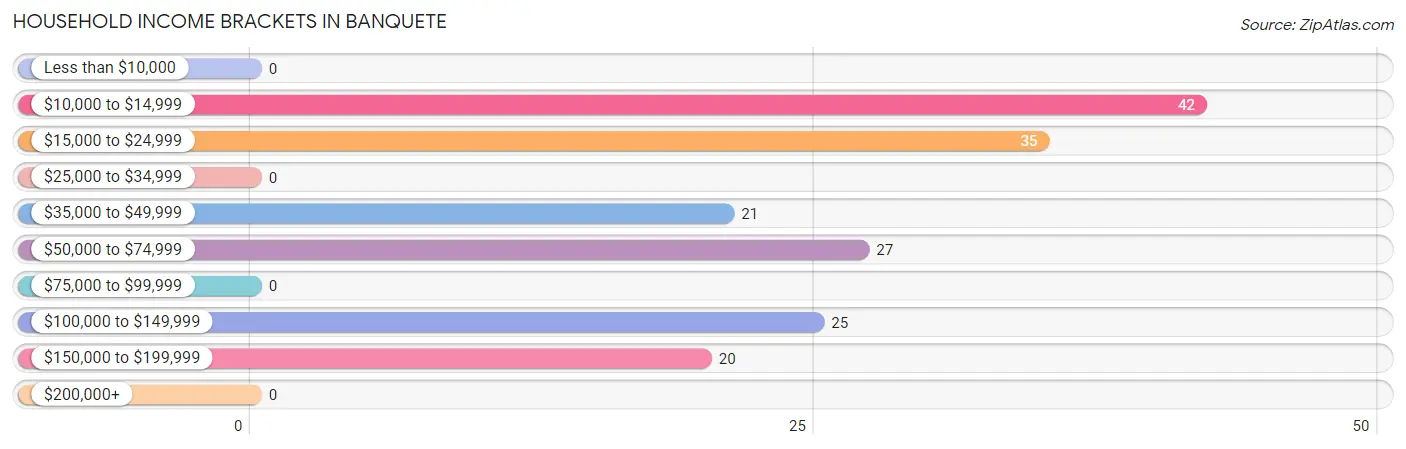
| Income Bracket | # Households | % Households |
| Less than $10,000 | 0 | 0.0% |
| $10,000 to $14,999 | 42 | 24.7% |
| $15,000 to $24,999 | 35 | 20.6% |
| $25,000 to $34,999 | 0 | 0.0% |
| $35,000 to $49,999 | 21 | 12.4% |
| $50,000 to $74,999 | 27 | 15.9% |
| $75,000 to $99,999 | 0 | 0.0% |
| $100,000 to $149,999 | 25 | 14.7% |
| $150,000 to $199,999 | 20 | 11.8% |
| $200,000+ | 0 | 0.0% |
Household Income by Householder Age in Banquete
| Income Bracket | # Households | Median Income |
| 15 to 24 Years | 0 (0.0%) | $0 |
| 25 to 44 Years | 76 (44.7%) | $0 |
| 45 to 64 Years | 27 (15.9%) | $0 |
| 65+ Years | 67 (39.4%) | $0 |
| Total | 170 (100.0%) | $0 |
Poverty in Banquete
Income Below Poverty by Sex and Age in Banquete
With 40.5% poverty level for males and 46.8% for females among the residents of Banquete, 5 year old males and 6 to 11 year old females are the most vulnerable to poverty, with 24 males (100.0%) and 31 females (100.0%) in their respective age groups living below the poverty level.
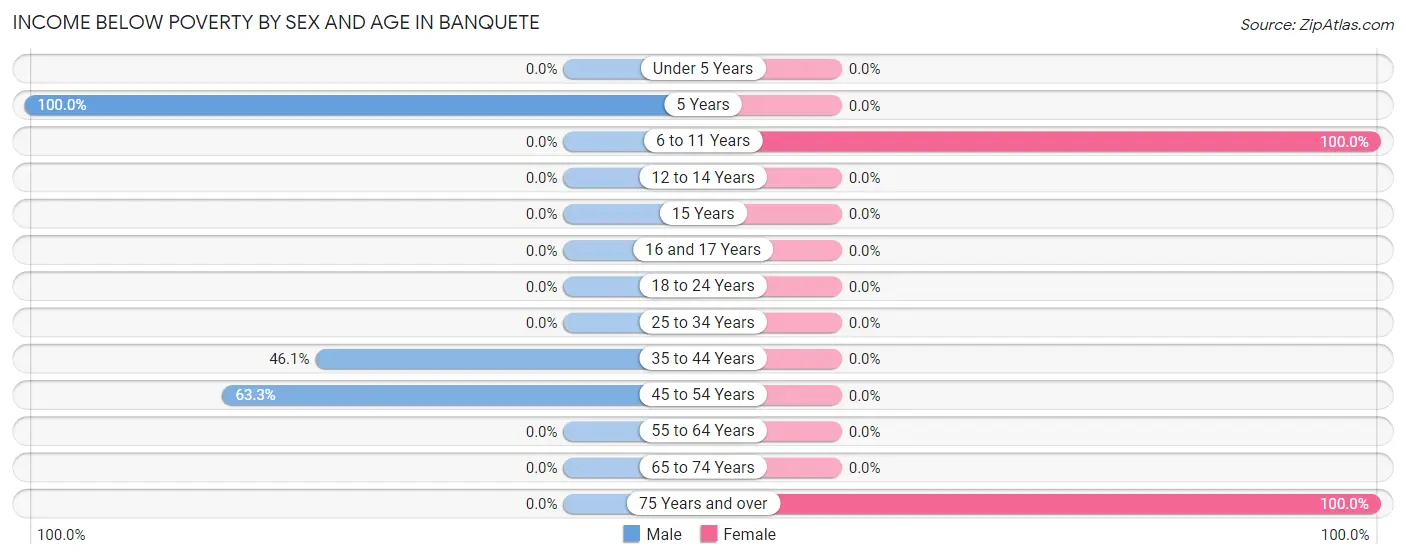
| Age Bracket | Male | Female |
| Under 5 Years | 0 (0.0%) | 0 (0.0%) |
| 5 Years | 24 (100.0%) | 0 (0.0%) |
| 6 to 11 Years | 0 (0.0%) | 31 (100.0%) |
| 12 to 14 Years | 0 (0.0%) | 0 (0.0%) |
| 15 Years | 0 (0.0%) | 0 (0.0%) |
| 16 and 17 Years | 0 (0.0%) | 0 (0.0%) |
| 18 to 24 Years | 0 (0.0%) | 0 (0.0%) |
| 25 to 34 Years | 0 (0.0%) | 0 (0.0%) |
| 35 to 44 Years | 35 (46.1%) | 0 (0.0%) |
| 45 to 54 Years | 62 (63.3%) | 0 (0.0%) |
| 55 to 64 Years | 0 (0.0%) | 0 (0.0%) |
| 65 to 74 Years | 0 (0.0%) | 0 (0.0%) |
| 75 Years and over | 0 (0.0%) | 42 (100.0%) |
| Total | 121 (40.5%) | 73 (46.8%) |
Income Above Poverty by Sex and Age in Banquete
According to the poverty statistics in Banquete, males aged under 5 years and females aged 25 to 34 years are the age groups that are most secure financially, with 100.0% of males and 100.0% of females in these age groups living above the poverty line.
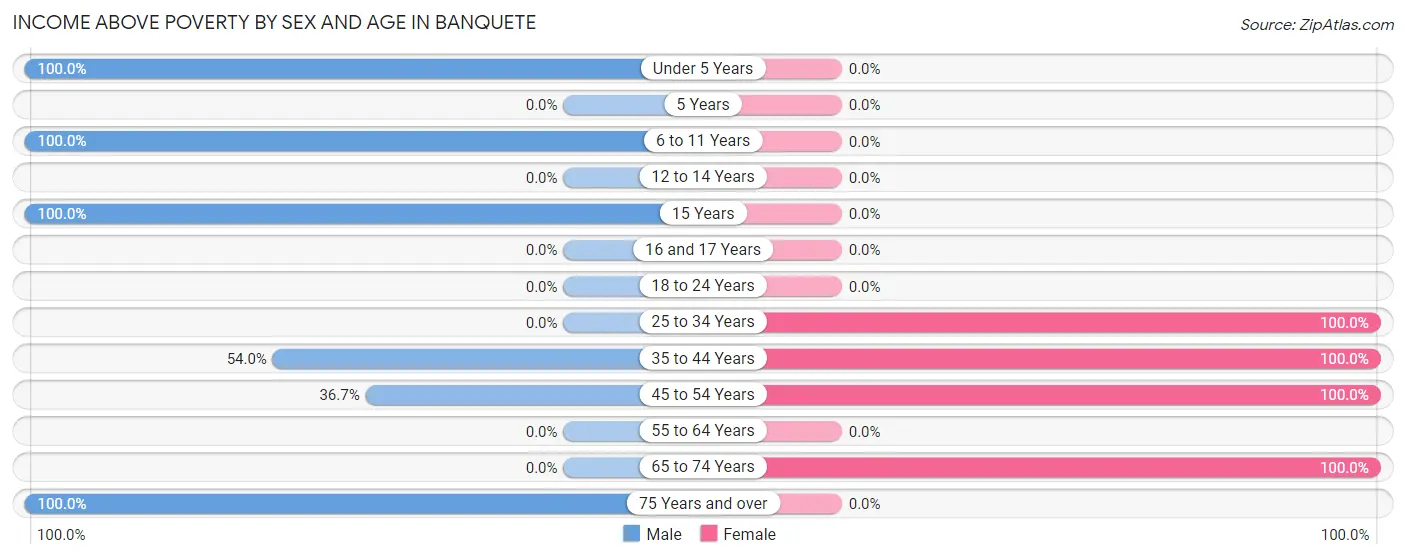
| Age Bracket | Male | Female |
| Under 5 Years | 33 (100.0%) | 0 (0.0%) |
| 5 Years | 0 (0.0%) | 0 (0.0%) |
| 6 to 11 Years | 12 (100.0%) | 0 (0.0%) |
| 12 to 14 Years | 0 (0.0%) | 0 (0.0%) |
| 15 Years | 22 (100.0%) | 0 (0.0%) |
| 16 and 17 Years | 0 (0.0%) | 0 (0.0%) |
| 18 to 24 Years | 0 (0.0%) | 0 (0.0%) |
| 25 to 34 Years | 0 (0.0%) | 20 (100.0%) |
| 35 to 44 Years | 41 (53.9%) | 11 (100.0%) |
| 45 to 54 Years | 36 (36.7%) | 27 (100.0%) |
| 55 to 64 Years | 0 (0.0%) | 0 (0.0%) |
| 65 to 74 Years | 0 (0.0%) | 25 (100.0%) |
| 75 Years and over | 34 (100.0%) | 0 (0.0%) |
| Total | 178 (59.5%) | 83 (53.2%) |
Income Below Poverty Among Married-Couple Families in Banquete
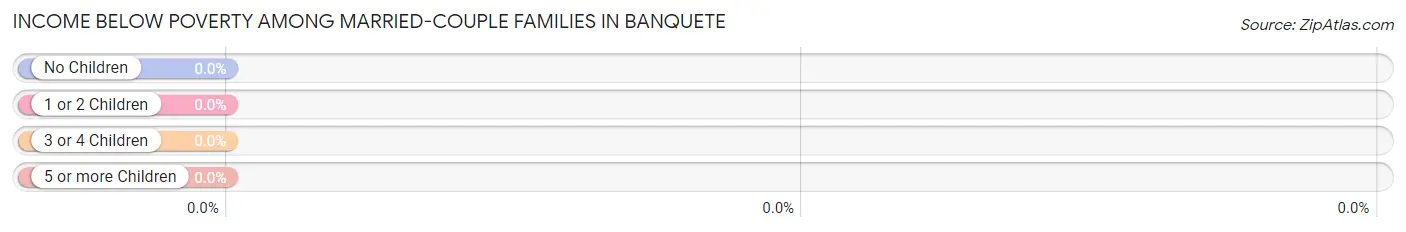
| Children | Above Poverty | Below Poverty |
| No Children | 25 (100.0%) | 0 (0.0%) |
| 1 or 2 Children | 21 (100.0%) | 0 (0.0%) |
| 3 or 4 Children | 20 (100.0%) | 0 (0.0%) |
| 5 or more Children | 0 (0.0%) | 0 (0.0%) |
| Total | 66 (100.0%) | 0 (0.0%) |
Income Below Poverty Among Single-Parent Households in Banquete
According to the poverty data in Banquete, 100.0% or 35 single-father households and 100.0% or 12 single-mother households are living below the poverty line. Among single-father households, those with 1 or 2 children have the highest poverty rate, with 35 households (100.0%) experiencing poverty. Likewise, among single-mother households, those with 1 or 2 children have the highest poverty rate, with 12 households (100.0%) falling below the poverty line.
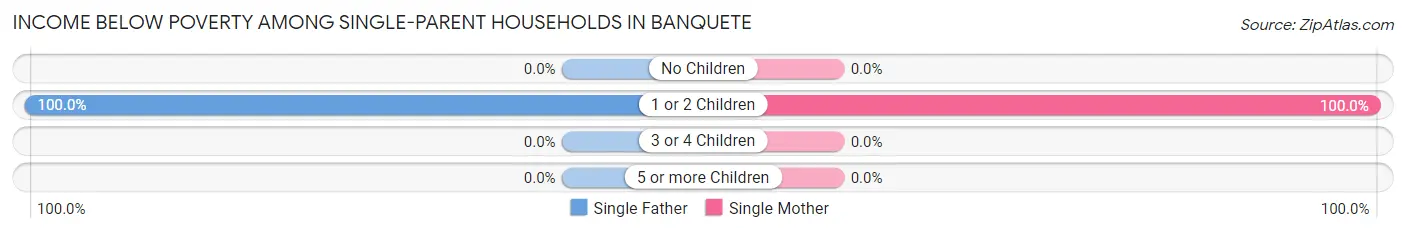
| Children | Single Father | Single Mother |
| No Children | 0 (0.0%) | 0 (0.0%) |
| 1 or 2 Children | 35 (100.0%) | 12 (100.0%) |
| 3 or 4 Children | 0 (0.0%) | 0 (0.0%) |
| 5 or more Children | 0 (0.0%) | 0 (0.0%) |
| Total | 35 (100.0%) | 12 (100.0%) |
Income Below Poverty Among Married-Couple vs Single-Parent Households in Banquete
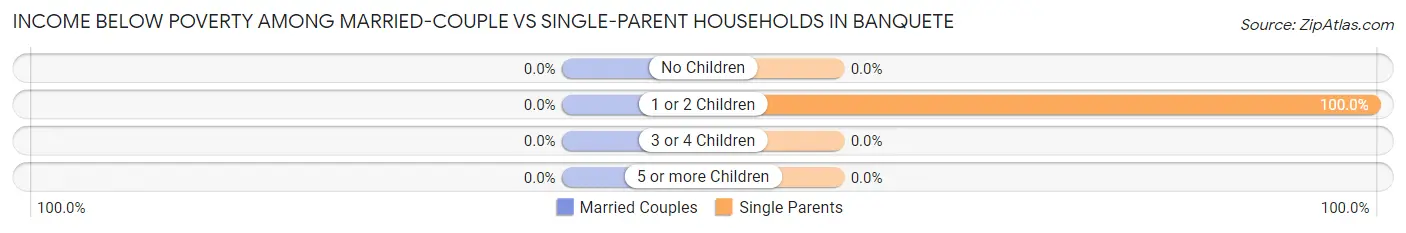
| Children | Married-Couple Families | Single-Parent Households |
| No Children | 0 (0.0%) | 0 (0.0%) |
| 1 or 2 Children | 0 (0.0%) | 47 (100.0%) |
| 3 or 4 Children | 0 (0.0%) | 0 (0.0%) |
| 5 or more Children | 0 (0.0%) | 0 (0.0%) |
| Total | 0 (0.0%) | 47 (100.0%) |
Race in Banquete
The most populous races in Banquete are Hispanic or Latino (430 | 94.5%), White / Caucasian (392 | 86.2%), and Two or more Races (63 | 13.9%).
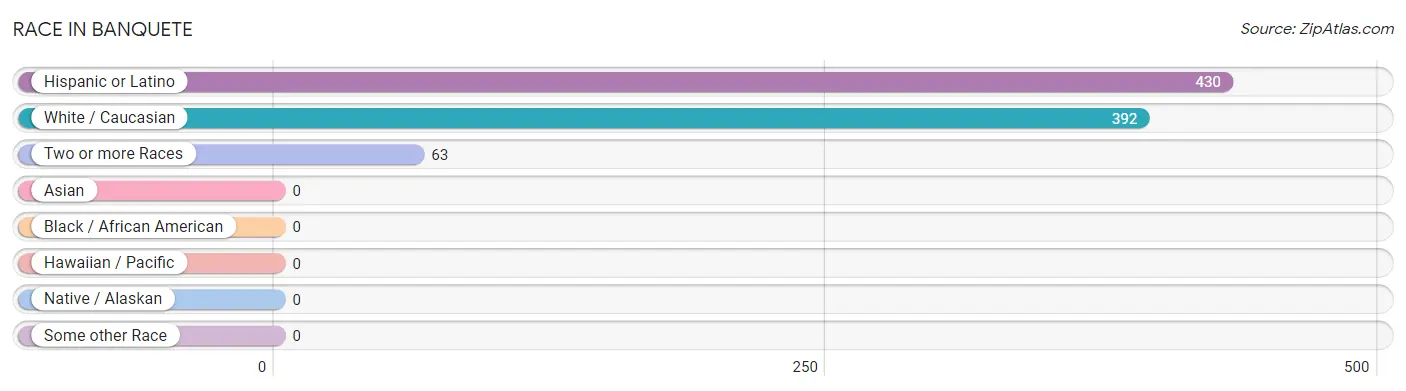
| Race | # Population | % Population |
| Asian | 0 | 0.0% |
| Black / African American | 0 | 0.0% |
| Hawaiian / Pacific | 0 | 0.0% |
| Hispanic or Latino | 430 | 94.5% |
| Native / Alaskan | 0 | 0.0% |
| White / Caucasian | 392 | 86.2% |
| Two or more Races | 63 | 13.9% |
| Some other Race | 0 | 0.0% |
| Total | 455 | 100.0% |
Ancestry in Banquete
The most populous ancestries reported in Banquete are Mexican (389 | 85.5%), Puerto Rican (41 | 9.0%), Norwegian (36 | 7.9%), German (25 | 5.5%), and Irish (25 | 5.5%), together accounting for 113.4% of all Banquete residents.
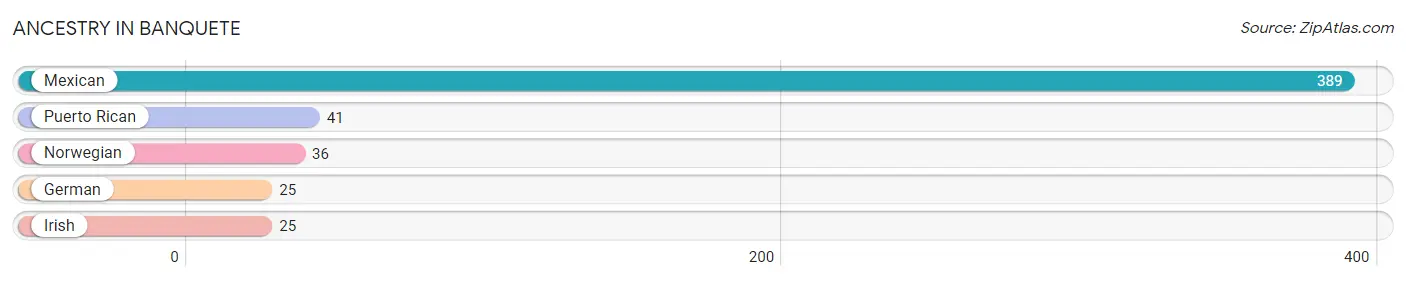
| Ancestry | # Population | % Population |
| German | 25 | 5.5% |
| Irish | 25 | 5.5% |
| Mexican | 389 | 85.5% |
| Norwegian | 36 | 7.9% |
| Puerto Rican | 41 | 9.0% | View All 5 Rows |
Immigrants in Banquete

| Immigration Origin | # Population | % Population | View All 0 Rows |
Sex and Age in Banquete
Sex and Age in Banquete
The most populous age groups in Banquete are 35 to 39 Years (76 | 25.4%) for men and 5 to 9 Years (31 | 19.9%) for women.
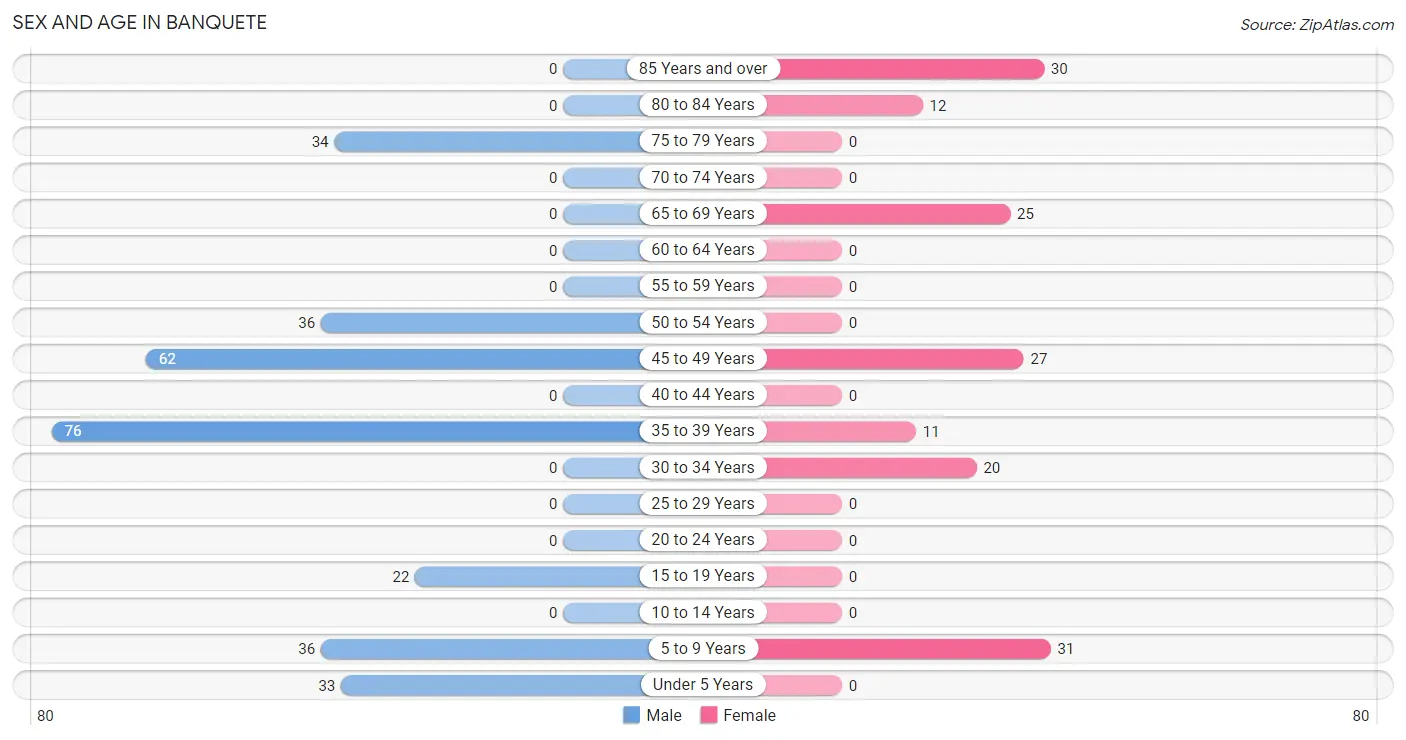
| Age Bracket | Male | Female |
| Under 5 Years | 33 (11.0%) | 0 (0.0%) |
| 5 to 9 Years | 36 (12.0%) | 31 (19.9%) |
| 10 to 14 Years | 0 (0.0%) | 0 (0.0%) |
| 15 to 19 Years | 22 (7.4%) | 0 (0.0%) |
| 20 to 24 Years | 0 (0.0%) | 0 (0.0%) |
| 25 to 29 Years | 0 (0.0%) | 0 (0.0%) |
| 30 to 34 Years | 0 (0.0%) | 20 (12.8%) |
| 35 to 39 Years | 76 (25.4%) | 11 (7.0%) |
| 40 to 44 Years | 0 (0.0%) | 0 (0.0%) |
| 45 to 49 Years | 62 (20.7%) | 27 (17.3%) |
| 50 to 54 Years | 36 (12.0%) | 0 (0.0%) |
| 55 to 59 Years | 0 (0.0%) | 0 (0.0%) |
| 60 to 64 Years | 0 (0.0%) | 0 (0.0%) |
| 65 to 69 Years | 0 (0.0%) | 25 (16.0%) |
| 70 to 74 Years | 0 (0.0%) | 0 (0.0%) |
| 75 to 79 Years | 34 (11.4%) | 0 (0.0%) |
| 80 to 84 Years | 0 (0.0%) | 12 (7.7%) |
| 85 Years and over | 0 (0.0%) | 30 (19.2%) |
| Total | 299 (100.0%) | 156 (100.0%) |
Families and Households in Banquete
Median Family Size in Banquete
The median family size in Banquete is 3.52 persons per family, with single female/mother families (12 | 10.6%) accounting for the largest median family size of 8.17 persons per family. On the other hand, single male/father families (35 | 31.0%) represent the smallest median family size with 1.89 persons per family.
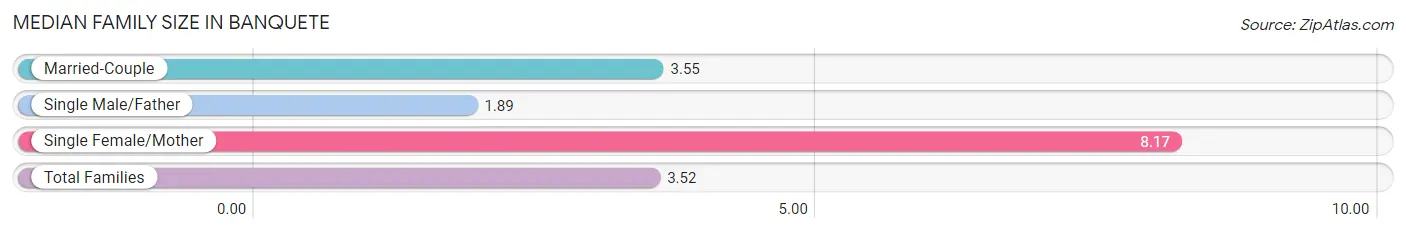
| Family Type | # Families | Family Size |
| Married-Couple | 66 (58.4%) | 3.55 |
| Single Male/Father | 35 (31.0%) | 1.89 |
| Single Female/Mother | 12 (10.6%) | 8.17 |
| Total Families | 113 (100.0%) | 3.52 |
Median Household Size in Banquete
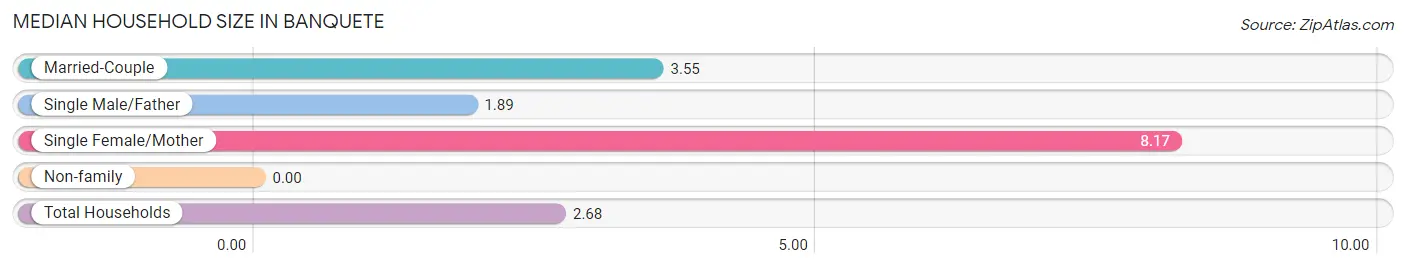
| Household Type | # Households | Household Size |
| Married-Couple | 66 (38.8%) | 3.55 |
| Single Male/Father | 35 (20.6%) | 1.89 |
| Single Female/Mother | 12 (7.1%) | 8.17 |
| Non-family | 57 (33.5%) | - |
| Total Households | 170 (100.0%) | 2.68 |
Household Size by Marriage Status in Banquete
Out of a total of 170 households in Banquete, 113 (66.5%) are family households, while 57 (33.5%) are nonfamily households. The most numerous type of family households are 3-person households, comprising 58, and the most common type of nonfamily households are 1-person households, comprising 57.
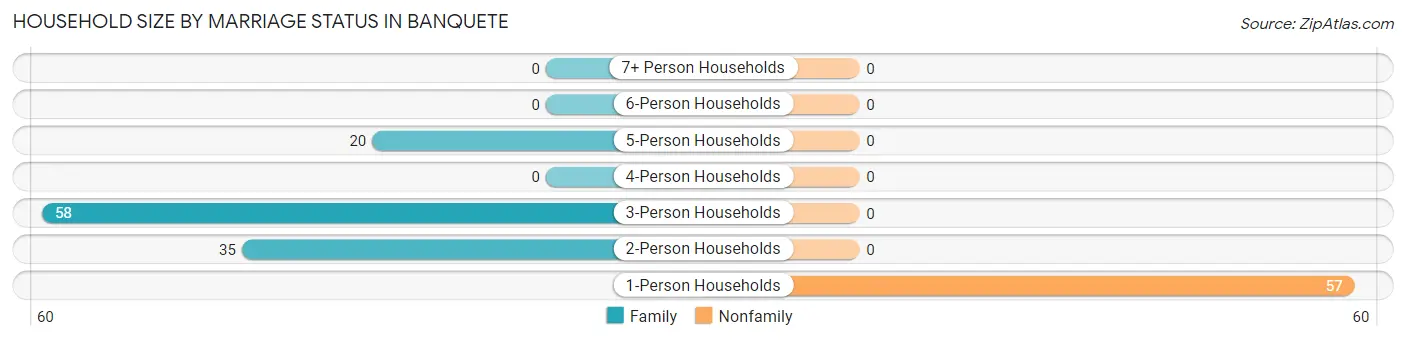
| Household Size | Family Households | Nonfamily Households |
| 1-Person Households | - | 57 (33.5%) |
| 2-Person Households | 35 (20.6%) | 0 (0.0%) |
| 3-Person Households | 58 (34.1%) | 0 (0.0%) |
| 4-Person Households | 0 (0.0%) | 0 (0.0%) |
| 5-Person Households | 20 (11.8%) | 0 (0.0%) |
| 6-Person Households | 0 (0.0%) | 0 (0.0%) |
| 7+ Person Households | 0 (0.0%) | 0 (0.0%) |
| Total | 113 (66.5%) | 57 (33.5%) |
Female Fertility in Banquete
Fertility by Age in Banquete
| Age Bracket | Women with Births | Births / 1,000 Women |
| 15 to 19 years | 0 (0.0%) | 0.0 |
| 20 to 34 years | 0 (0.0%) | 0.0 |
| 35 to 50 years | 0 (0.0%) | 0.0 |
| Total | 0 (0.0%) | 0.0 |
Fertility by Age by Marriage Status in Banquete
| Age Bracket | Married | Unmarried |
| 15 to 19 years | 0 (0.0%) | 0 (0.0%) |
| 20 to 34 years | 0 (0.0%) | 0 (0.0%) |
| 35 to 50 years | 0 (0.0%) | 0 (0.0%) |
| Total | 0 (0.0%) | 0 (0.0%) |
Fertility by Education in Banquete
| Educational Attainment | Women with Births | Births / 1,000 Women |
| Less than High School | 0 (0.0%) | 0.0 |
| High School Diploma | 0 (0.0%) | 0.0 |
| College or Associate's Degree | 0 (0.0%) | 0.0 |
| Bachelor's Degree | 0 (0.0%) | 0.0 |
| Graduate Degree | 0 (0.0%) | 0.0 |
| Total | 0 (0.0%) | 0.0 |
Fertility by Education by Marriage Status in Banquete
| Educational Attainment | Married | Unmarried |
| Less than High School | 0 (0.0%) | 0 (0.0%) |
| High School Diploma | 0 (0.0%) | 0 (0.0%) |
| College or Associate's Degree | 0 (0.0%) | 0 (0.0%) |
| Bachelor's Degree | 0 (0.0%) | 0 (0.0%) |
| Graduate Degree | 0 (0.0%) | 0 (0.0%) |
| Total | 0 (0.0%) | 0 (0.0%) |
Employment Characteristics in Banquete
Employment by Class of Employer in Banquete
Among the 173 employed individuals in Banquete, private company employees (82 | 47.4%), self-employed (not incorporated) (46 | 26.6%), and local government employees (25 | 14.4%) make up the most common classes of employment.
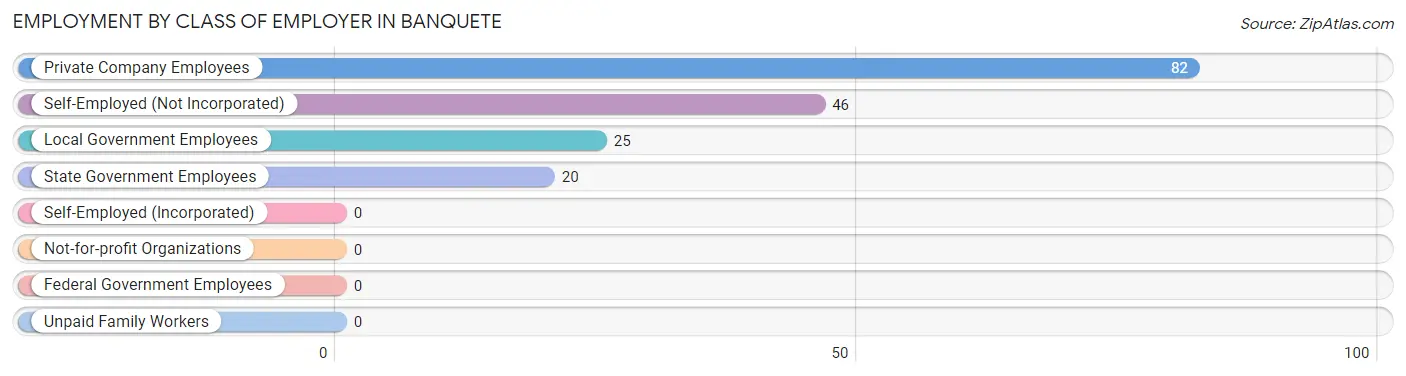
| Employer Class | # Employees | % Employees |
| Private Company Employees | 82 | 47.4% |
| Self-Employed (Incorporated) | 0 | 0.0% |
| Self-Employed (Not Incorporated) | 46 | 26.6% |
| Not-for-profit Organizations | 0 | 0.0% |
| Local Government Employees | 25 | 14.4% |
| State Government Employees | 20 | 11.6% |
| Federal Government Employees | 0 | 0.0% |
| Unpaid Family Workers | 0 | 0.0% |
| Total | 173 | 100.0% |
Employment Status by Age in Banquete
According to the labor force statistics for Banquete, out of the total population over 16 years of age (333), 62.8% or 209 individuals are in the labor force, with 17.2% or 36 of them unemployed. The age group with the highest labor force participation rate is 35 to 44 years, with 100.0% or 87 individuals in the labor force. Within the labor force, the 45 to 54 years age range has the highest percentage of unemployed individuals, with 57.1% or 36 of them being unemployed.
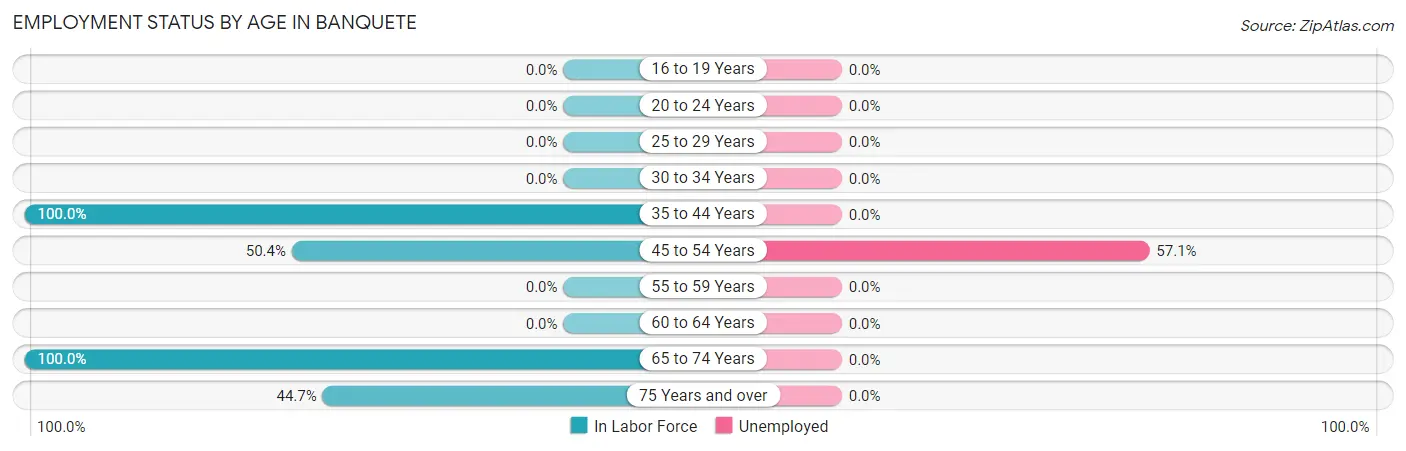
| Age Bracket | In Labor Force | Unemployed |
| 16 to 19 Years | 0 (0.0%) | 0 (0.0%) |
| 20 to 24 Years | 0 (0.0%) | 0 (0.0%) |
| 25 to 29 Years | 0 (0.0%) | 0 (0.0%) |
| 30 to 34 Years | 0 (0.0%) | 0 (0.0%) |
| 35 to 44 Years | 87 (100.0%) | 0 (0.0%) |
| 45 to 54 Years | 63 (50.4%) | 36 (57.1%) |
| 55 to 59 Years | 0 (0.0%) | 0 (0.0%) |
| 60 to 64 Years | 0 (0.0%) | 0 (0.0%) |
| 65 to 74 Years | 25 (100.0%) | 0 (0.0%) |
| 75 Years and over | 34 (44.7%) | 0 (0.0%) |
| Total | 209 (62.8%) | 36 (17.2%) |
Employment Status by Educational Attainment in Banquete
According to labor force statistics for Banquete, 64.7% of individuals (150) out of the total population between 25 and 64 years of age (232) are in the labor force, with 24.0% or 36 of them being unemployed. The group with the highest labor force participation rate are those with the educational attainment of college / associate degree, with 100.0% or 27 individuals in the labor force. Within the labor force, individuals with bachelor's degree or higher education have the highest percentage of unemployment, with 53.7% or 36 of them being unemployed.
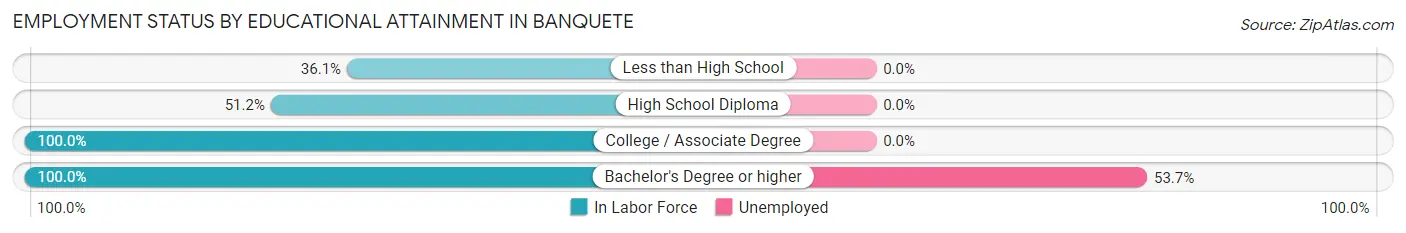
| Educational Attainment | In Labor Force | Unemployed |
| Less than High School | 35 (36.1%) | 0 (0.0%) |
| High School Diploma | 21 (51.2%) | 0 (0.0%) |
| College / Associate Degree | 27 (100.0%) | 0 (0.0%) |
| Bachelor's Degree or higher | 67 (100.0%) | 36 (53.7%) |
| Total | 150 (64.7%) | 56 (24.0%) |
Employment Occupations by Sex in Banquete
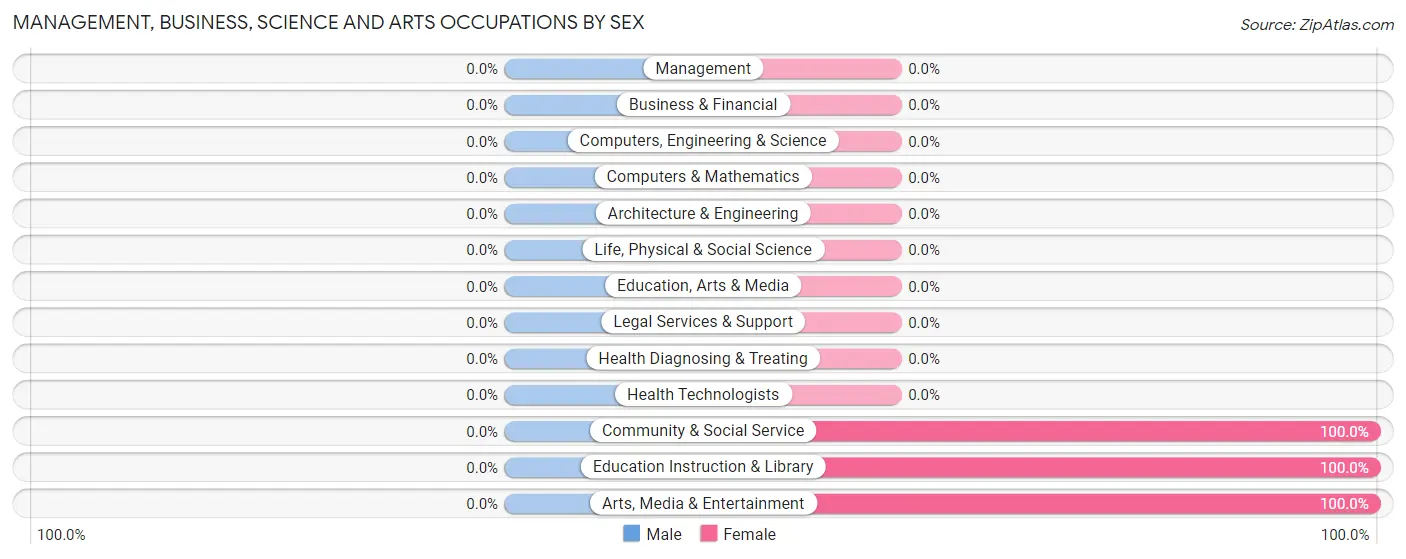
Management, Business, Science and Arts Occupations
The most common Management, Business, Science and Arts occupations in Banquete are Community & Social Service (36 | 20.8%), Education Instruction & Library (25 | 14.4%), and Arts, Media & Entertainment (11 | 6.4%).
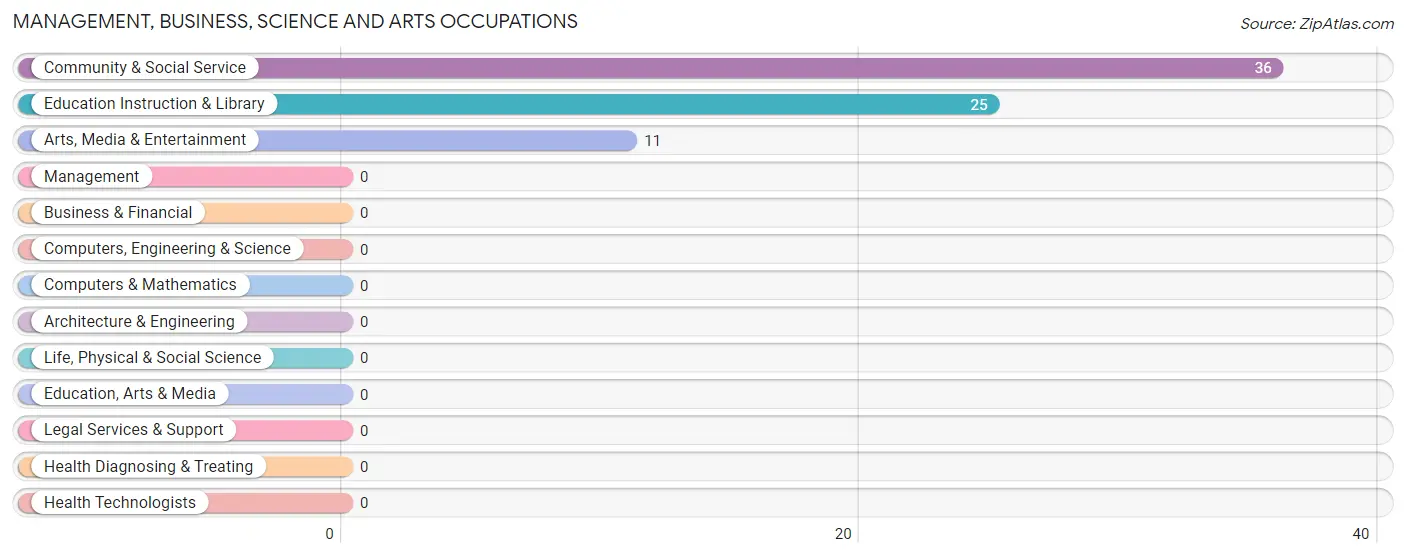
Management, Business, Science and Arts Occupations by Sex
| Occupation | Male | Female |
| Management | 0 (0.0%) | 0 (0.0%) |
| Business & Financial | 0 (0.0%) | 0 (0.0%) |
| Computers, Engineering & Science | 0 (0.0%) | 0 (0.0%) |
| Computers & Mathematics | 0 (0.0%) | 0 (0.0%) |
| Architecture & Engineering | 0 (0.0%) | 0 (0.0%) |
| Life, Physical & Social Science | 0 (0.0%) | 0 (0.0%) |
| Community & Social Service | 0 (0.0%) | 36 (100.0%) |
| Education, Arts & Media | 0 (0.0%) | 0 (0.0%) |
| Legal Services & Support | 0 (0.0%) | 0 (0.0%) |
| Education Instruction & Library | 0 (0.0%) | 25 (100.0%) |
| Arts, Media & Entertainment | 0 (0.0%) | 11 (100.0%) |
| Health Diagnosing & Treating | 0 (0.0%) | 0 (0.0%) |
| Health Technologists | 0 (0.0%) | 0 (0.0%) |
| Total (Category) | 0 (0.0%) | 36 (100.0%) |
| Total (Overall) | 110 (63.6%) | 63 (36.4%) |
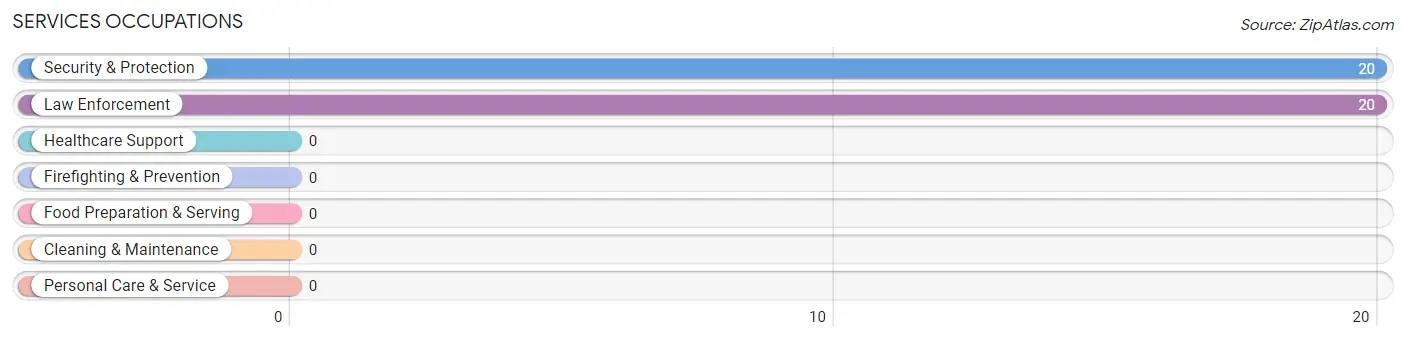
Services Occupations
The most common Services occupations in Banquete are Security & Protection (20 | 11.6%), and Law Enforcement (20 | 11.6%).
Services Occupations by Sex
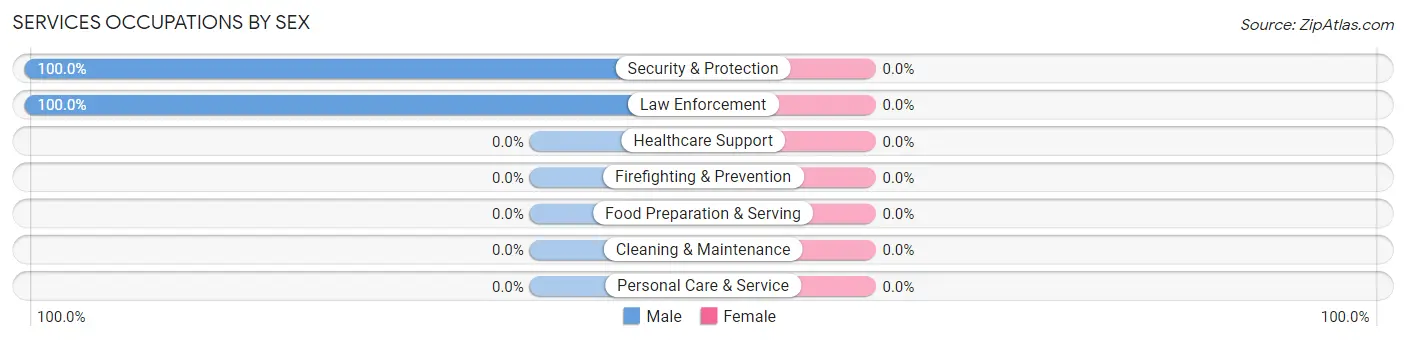
| Occupation | Male | Female |
| Healthcare Support | 0 (0.0%) | 0 (0.0%) |
| Security & Protection | 20 (100.0%) | 0 (0.0%) |
| Firefighting & Prevention | 0 (0.0%) | 0 (0.0%) |
| Law Enforcement | 20 (100.0%) | 0 (0.0%) |
| Food Preparation & Serving | 0 (0.0%) | 0 (0.0%) |
| Cleaning & Maintenance | 0 (0.0%) | 0 (0.0%) |
| Personal Care & Service | 0 (0.0%) | 0 (0.0%) |
| Total (Category) | 20 (100.0%) | 0 (0.0%) |
| Total (Overall) | 110 (63.6%) | 63 (36.4%) |
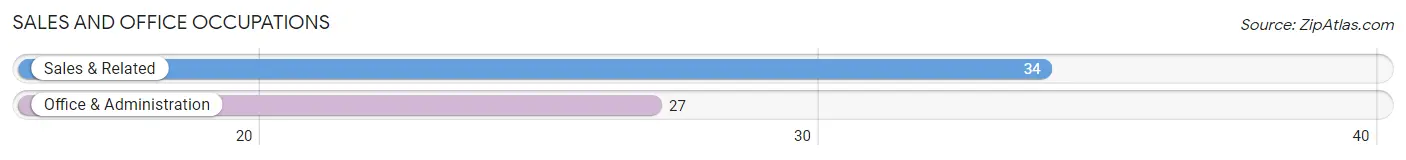
Sales and Office Occupations
The most common Sales and Office occupations in Banquete are Sales & Related (34 | 19.7%), and Office & Administration (27 | 15.6%).
Sales and Office Occupations by Sex
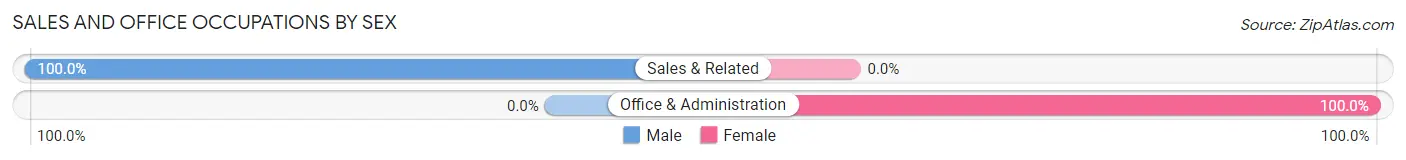
| Occupation | Male | Female |
| Sales & Related | 34 (100.0%) | 0 (0.0%) |
| Office & Administration | 0 (0.0%) | 27 (100.0%) |
| Total (Category) | 34 (55.7%) | 27 (44.3%) |
| Total (Overall) | 110 (63.6%) | 63 (36.4%) |
Natural Resources, Construction and Maintenance Occupations
The most common Natural Resources, Construction and Maintenance occupations in Banquete are , and Construction & Extraction (56 | 32.4%).
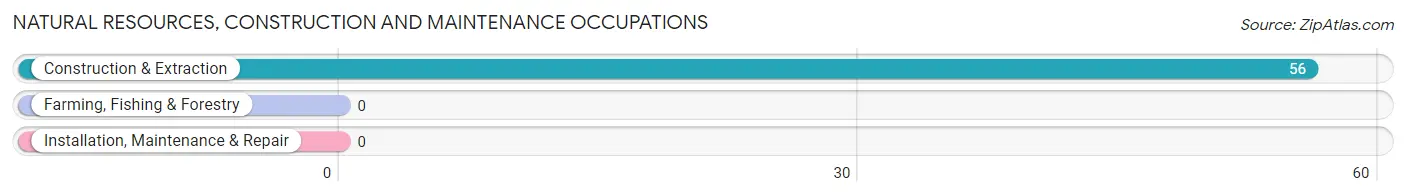
Natural Resources, Construction and Maintenance Occupations by Sex
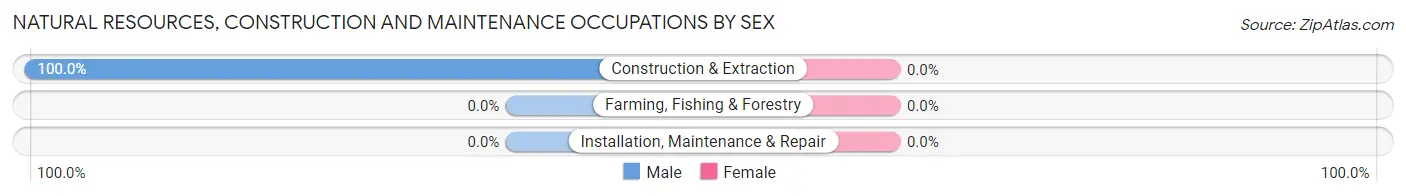
| Occupation | Male | Female |
| Farming, Fishing & Forestry | 0 (0.0%) | 0 (0.0%) |
| Construction & Extraction | 56 (100.0%) | 0 (0.0%) |
| Installation, Maintenance & Repair | 0 (0.0%) | 0 (0.0%) |
| Total (Category) | 56 (100.0%) | 0 (0.0%) |
| Total (Overall) | 110 (63.6%) | 63 (36.4%) |
Production, Transportation and Moving Occupations
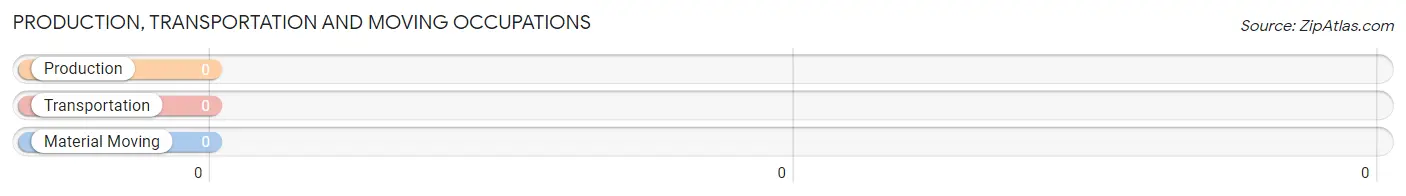
Production, Transportation and Moving Occupations by Sex
| Occupation | Male | Female |
| Production | 0 (0.0%) | 0 (0.0%) |
| Transportation | 0 (0.0%) | 0 (0.0%) |
| Material Moving | 0 (0.0%) | 0 (0.0%) |
| Total (Category) | 0 (0.0%) | 0 (0.0%) |
| Total (Overall) | 110 (63.6%) | 63 (36.4%) |
Employment Industries by Sex in Banquete
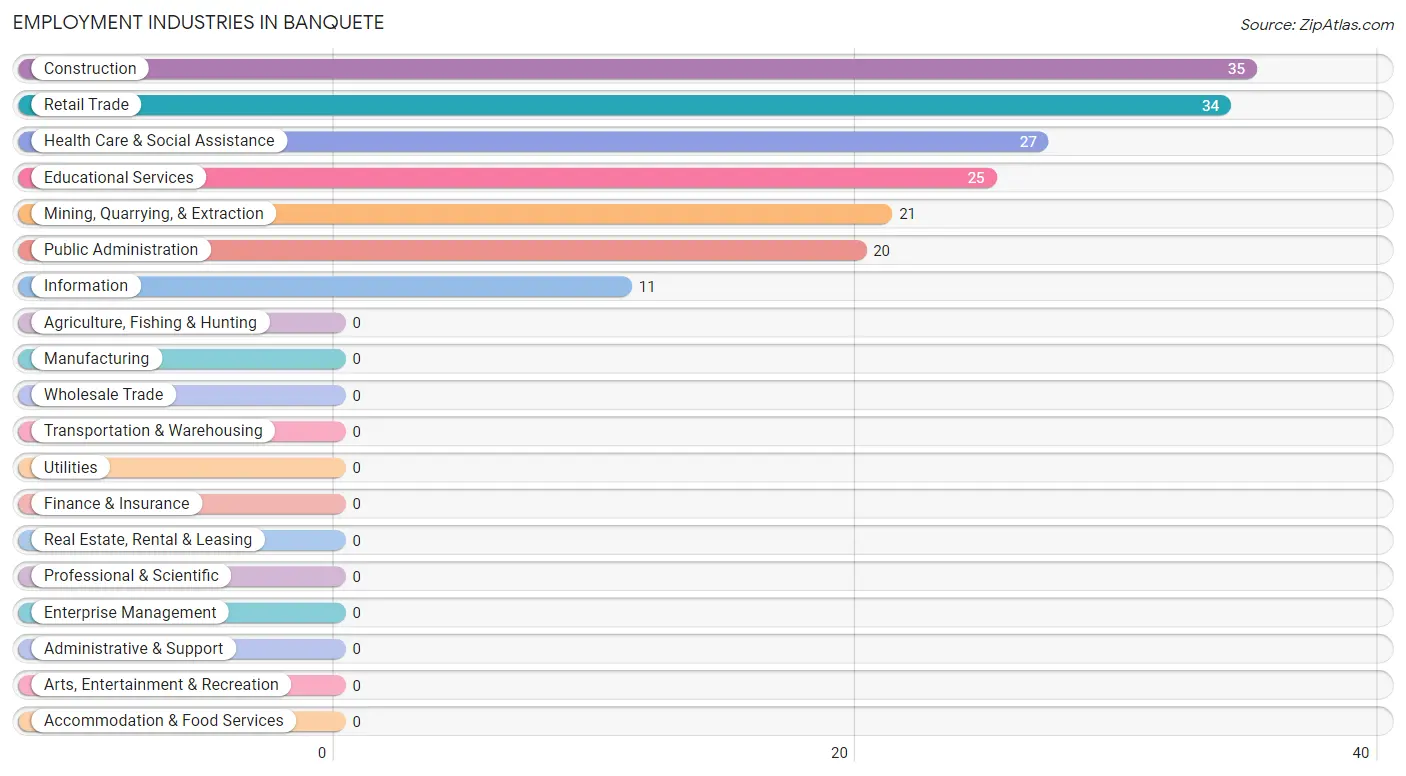
Employment Industries in Banquete
The major employment industries in Banquete include Construction (35 | 20.2%), Retail Trade (34 | 19.7%), Health Care & Social Assistance (27 | 15.6%), Educational Services (25 | 14.4%), and Mining, Quarrying, & Extraction (21 | 12.1%).
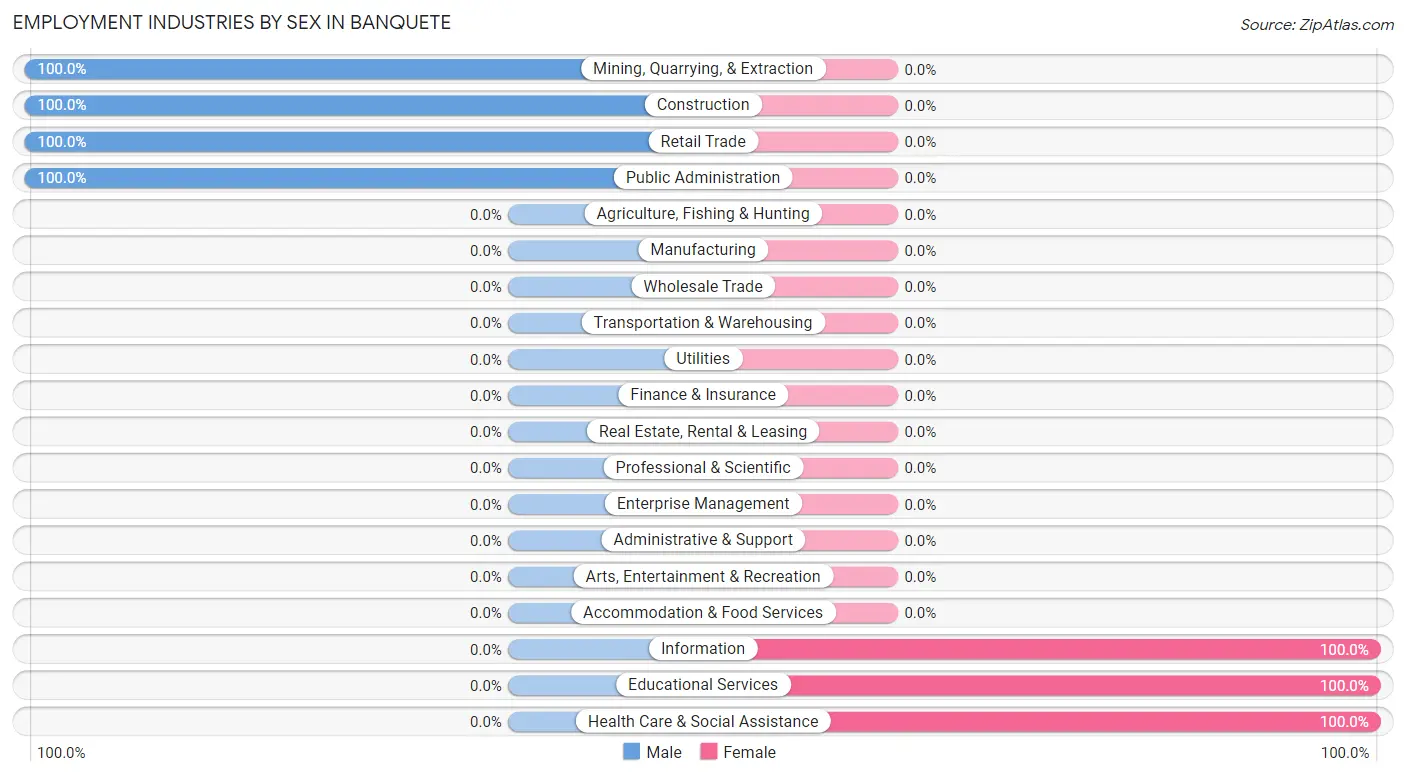
Employment Industries by Sex in Banquete
The Banquete industries that see more men than women are Mining, Quarrying, & Extraction (100.0%), Construction (100.0%), and Retail Trade (100.0%), whereas the industries that tend to have a higher number of women are Information (100.0%), Educational Services (100.0%), and Health Care & Social Assistance (100.0%).
| Industry | Male | Female |
| Agriculture, Fishing & Hunting | 0 (0.0%) | 0 (0.0%) |
| Mining, Quarrying, & Extraction | 21 (100.0%) | 0 (0.0%) |
| Construction | 35 (100.0%) | 0 (0.0%) |
| Manufacturing | 0 (0.0%) | 0 (0.0%) |
| Wholesale Trade | 0 (0.0%) | 0 (0.0%) |
| Retail Trade | 34 (100.0%) | 0 (0.0%) |
| Transportation & Warehousing | 0 (0.0%) | 0 (0.0%) |
| Utilities | 0 (0.0%) | 0 (0.0%) |
| Information | 0 (0.0%) | 11 (100.0%) |
| Finance & Insurance | 0 (0.0%) | 0 (0.0%) |
| Real Estate, Rental & Leasing | 0 (0.0%) | 0 (0.0%) |
| Professional & Scientific | 0 (0.0%) | 0 (0.0%) |
| Enterprise Management | 0 (0.0%) | 0 (0.0%) |
| Administrative & Support | 0 (0.0%) | 0 (0.0%) |
| Educational Services | 0 (0.0%) | 25 (100.0%) |
| Health Care & Social Assistance | 0 (0.0%) | 27 (100.0%) |
| Arts, Entertainment & Recreation | 0 (0.0%) | 0 (0.0%) |
| Accommodation & Food Services | 0 (0.0%) | 0 (0.0%) |
| Public Administration | 20 (100.0%) | 0 (0.0%) |
| Total | 110 (63.6%) | 63 (36.4%) |
Education in Banquete
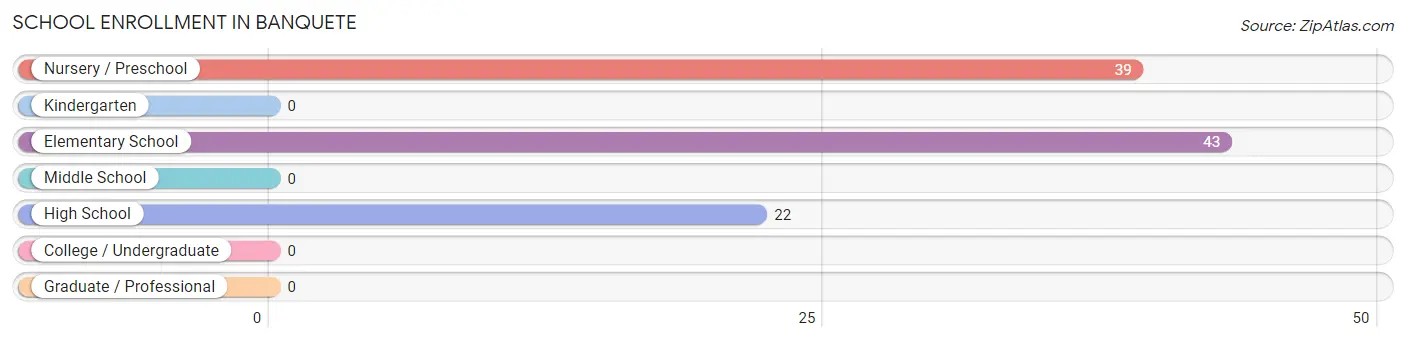
School Enrollment in Banquete
The most common levels of schooling among the 104 students in Banquete are elementary school (43 | 41.3%), nursery / preschool (39 | 37.5%), and high school (22 | 21.1%).
| School Level | # Students | % Students |
| Nursery / Preschool | 39 | 37.5% |
| Kindergarten | 0 | 0.0% |
| Elementary School | 43 | 41.3% |
| Middle School | 0 | 0.0% |
| High School | 22 | 21.1% |
| College / Undergraduate | 0 | 0.0% |
| Graduate / Professional | 0 | 0.0% |
| Total | 104 | 100.0% |
School Enrollment by Age by Funding Source in Banquete
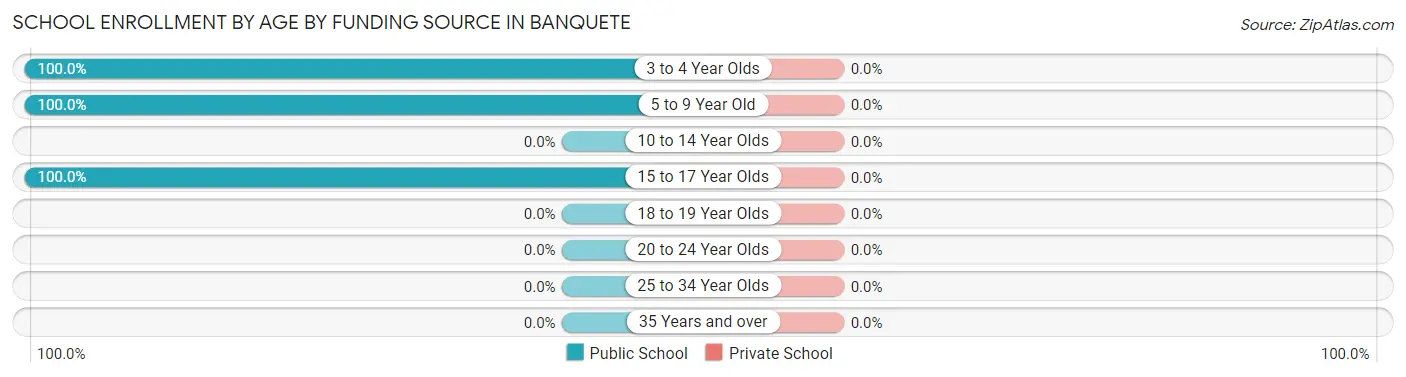
| Age Bracket | Public School | Private School |
| 3 to 4 Year Olds | 15 (100.0%) | 0 (0.0%) |
| 5 to 9 Year Old | 67 (100.0%) | 0 (0.0%) |
| 10 to 14 Year Olds | 0 (0.0%) | 0 (0.0%) |
| 15 to 17 Year Olds | 22 (100.0%) | 0 (0.0%) |
| 18 to 19 Year Olds | 0 (0.0%) | 0 (0.0%) |
| 20 to 24 Year Olds | 0 (0.0%) | 0 (0.0%) |
| 25 to 34 Year Olds | 0 (0.0%) | 0 (0.0%) |
| 35 Years and over | 0 (0.0%) | 0 (0.0%) |
| Total | 104 (100.0%) | 0 (0.0%) |
Educational Attainment by Field of Study in Banquete
Psychology (36 | 28.1%), literature & languages (36 | 28.1%), education (25 | 19.5%), arts & humanities (20 | 15.6%), and visual & performing arts (11 | 8.6%) are the most common fields of study among 128 individuals in Banquete who have obtained a bachelor's degree or higher.
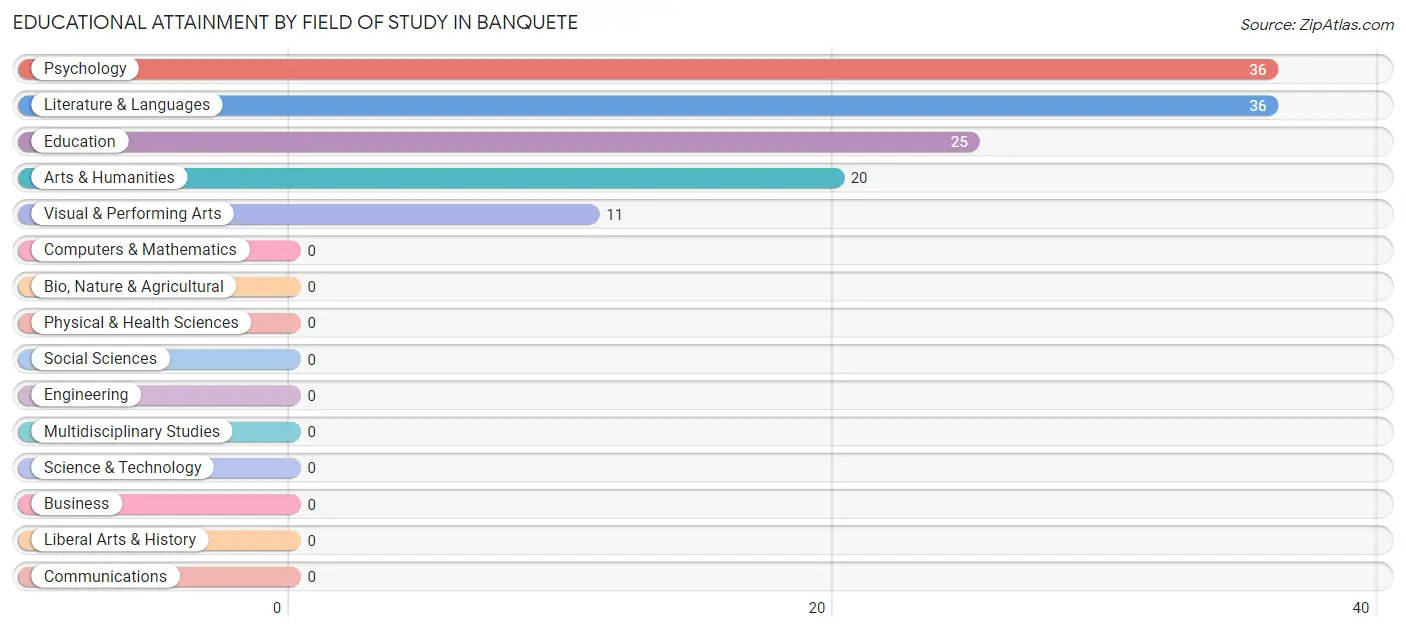
| Field of Study | # Graduates | % Graduates |
| Computers & Mathematics | 0 | 0.0% |
| Bio, Nature & Agricultural | 0 | 0.0% |
| Physical & Health Sciences | 0 | 0.0% |
| Psychology | 36 | 28.1% |
| Social Sciences | 0 | 0.0% |
| Engineering | 0 | 0.0% |
| Multidisciplinary Studies | 0 | 0.0% |
| Science & Technology | 0 | 0.0% |
| Business | 0 | 0.0% |
| Education | 25 | 19.5% |
| Literature & Languages | 36 | 28.1% |
| Liberal Arts & History | 0 | 0.0% |
| Visual & Performing Arts | 11 | 8.6% |
| Communications | 0 | 0.0% |
| Arts & Humanities | 20 | 15.6% |
| Total | 128 | 100.0% |
Transportation & Commute in Banquete
Vehicle Availability by Sex in Banquete
The most prevalent vehicle ownership categories in Banquete are males with 2 vehicles (69, accounting for 62.7%) and females with 2 vehicles (25, making up 109.5%).
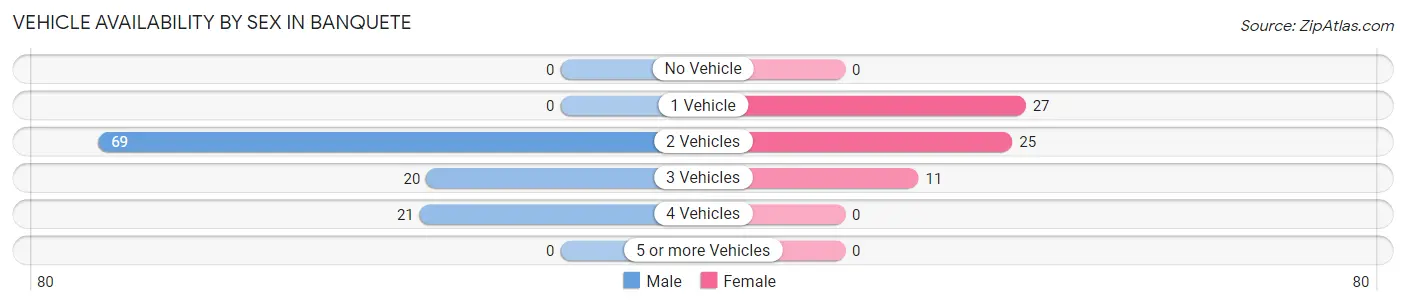
| Vehicles Available | Male | Female |
| No Vehicle | 0 (0.0%) | 0 (0.0%) |
| 1 Vehicle | 0 (0.0%) | 27 (42.9%) |
| 2 Vehicles | 69 (62.7%) | 25 (39.7%) |
| 3 Vehicles | 20 (18.2%) | 11 (17.5%) |
| 4 Vehicles | 21 (19.1%) | 0 (0.0%) |
| 5 or more Vehicles | 0 (0.0%) | 0 (0.0%) |
| Total | 110 (100.0%) | 63 (100.0%) |
Commute Time in Banquete
The most frequently occuring commute durations in Banquete are 20 to 24 minutes (61 commuters, 35.3%), less than 5 minutes (46 commuters, 26.6%), and 10 to 14 minutes (35 commuters, 20.2%).
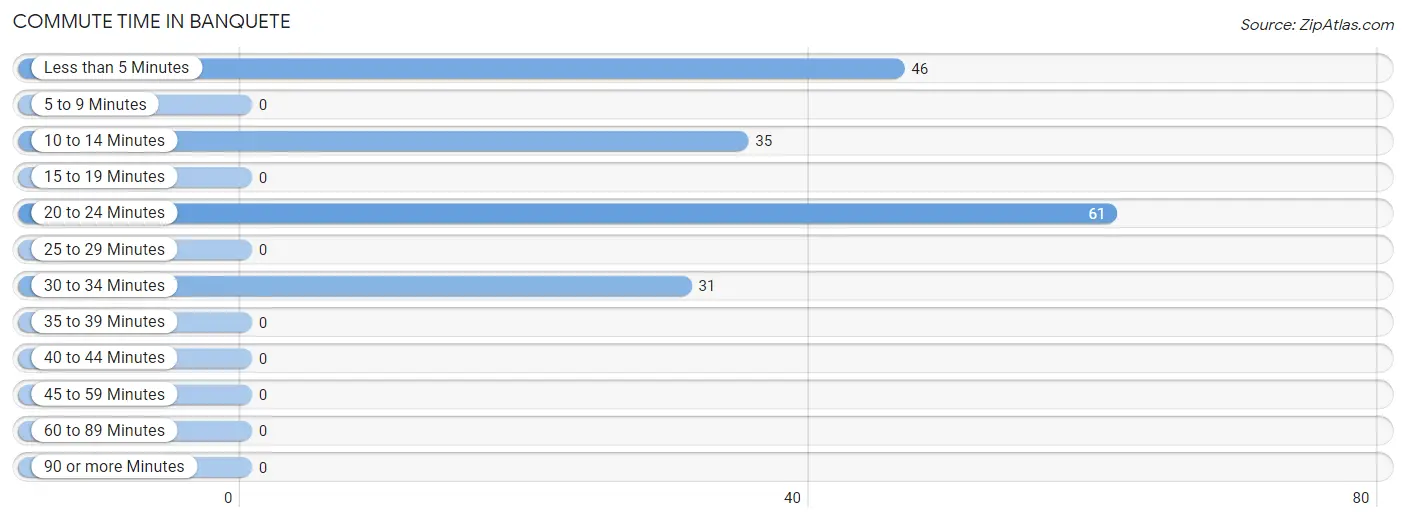
| Commute Time | # Commuters | % Commuters |
| Less than 5 Minutes | 46 | 26.6% |
| 5 to 9 Minutes | 0 | 0.0% |
| 10 to 14 Minutes | 35 | 20.2% |
| 15 to 19 Minutes | 0 | 0.0% |
| 20 to 24 Minutes | 61 | 35.3% |
| 25 to 29 Minutes | 0 | 0.0% |
| 30 to 34 Minutes | 31 | 17.9% |
| 35 to 39 Minutes | 0 | 0.0% |
| 40 to 44 Minutes | 0 | 0.0% |
| 45 to 59 Minutes | 0 | 0.0% |
| 60 to 89 Minutes | 0 | 0.0% |
| 90 or more Minutes | 0 | 0.0% |
Commute Time by Sex in Banquete
The most common commute times in Banquete are 10 to 14 minutes (35 commuters, 31.8%) for males and 20 to 24 minutes (27 commuters, 42.9%) for females.
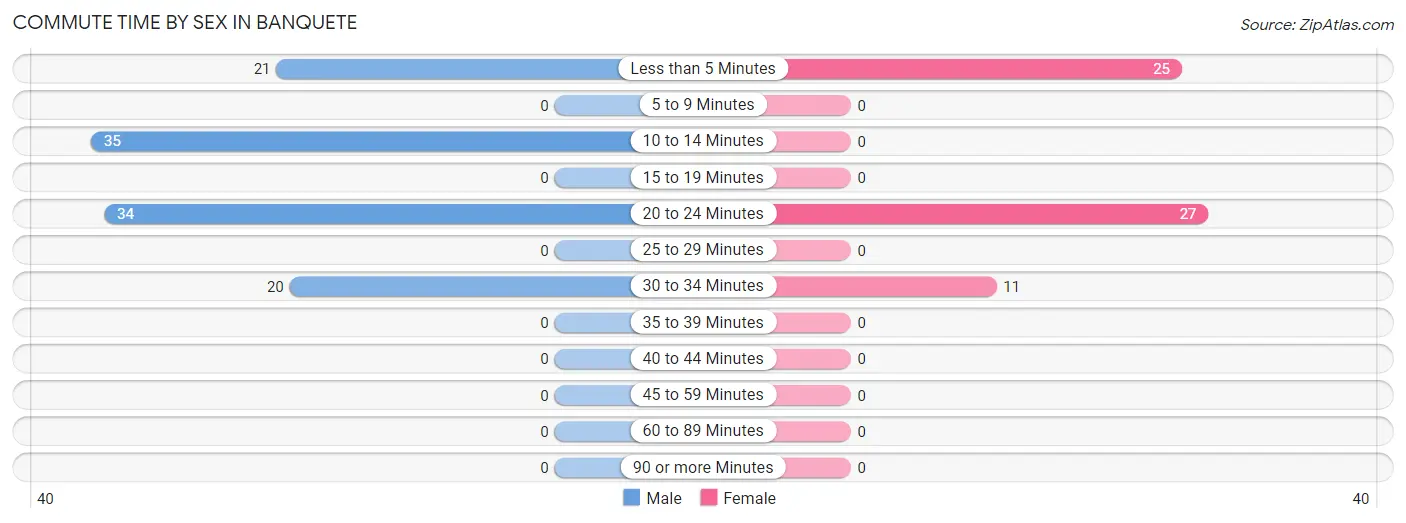
| Commute Time | Male | Female |
| Less than 5 Minutes | 21 (19.1%) | 25 (39.7%) |
| 5 to 9 Minutes | 0 (0.0%) | 0 (0.0%) |
| 10 to 14 Minutes | 35 (31.8%) | 0 (0.0%) |
| 15 to 19 Minutes | 0 (0.0%) | 0 (0.0%) |
| 20 to 24 Minutes | 34 (30.9%) | 27 (42.9%) |
| 25 to 29 Minutes | 0 (0.0%) | 0 (0.0%) |
| 30 to 34 Minutes | 20 (18.2%) | 11 (17.5%) |
| 35 to 39 Minutes | 0 (0.0%) | 0 (0.0%) |
| 40 to 44 Minutes | 0 (0.0%) | 0 (0.0%) |
| 45 to 59 Minutes | 0 (0.0%) | 0 (0.0%) |
| 60 to 89 Minutes | 0 (0.0%) | 0 (0.0%) |
| 90 or more Minutes | 0 (0.0%) | 0 (0.0%) |
Time of Departure to Work by Sex in Banquete
The most frequent times of departure to work in Banquete are 7:00 AM to 7:29 AM (55, 50.0%) for males and 7:00 AM to 7:29 AM (63, 100.0%) for females.
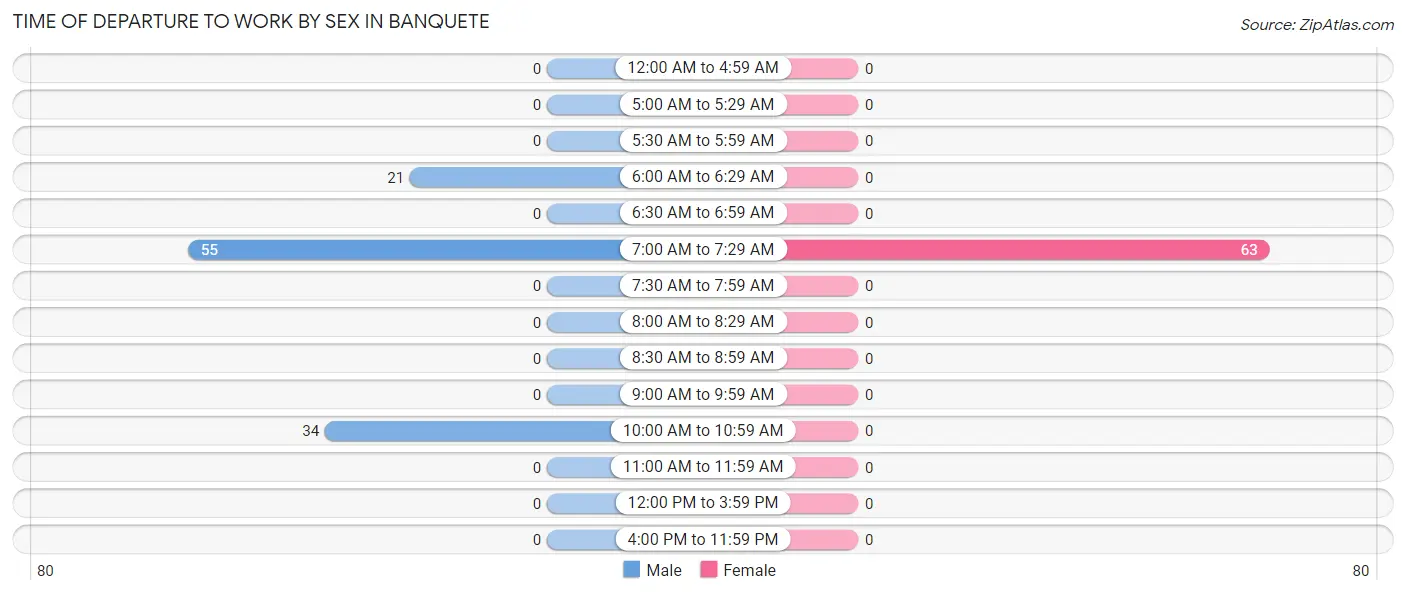
| Time of Departure | Male | Female |
| 12:00 AM to 4:59 AM | 0 (0.0%) | 0 (0.0%) |
| 5:00 AM to 5:29 AM | 0 (0.0%) | 0 (0.0%) |
| 5:30 AM to 5:59 AM | 0 (0.0%) | 0 (0.0%) |
| 6:00 AM to 6:29 AM | 21 (19.1%) | 0 (0.0%) |
| 6:30 AM to 6:59 AM | 0 (0.0%) | 0 (0.0%) |
| 7:00 AM to 7:29 AM | 55 (50.0%) | 63 (100.0%) |
| 7:30 AM to 7:59 AM | 0 (0.0%) | 0 (0.0%) |
| 8:00 AM to 8:29 AM | 0 (0.0%) | 0 (0.0%) |
| 8:30 AM to 8:59 AM | 0 (0.0%) | 0 (0.0%) |
| 9:00 AM to 9:59 AM | 0 (0.0%) | 0 (0.0%) |
| 10:00 AM to 10:59 AM | 34 (30.9%) | 0 (0.0%) |
| 11:00 AM to 11:59 AM | 0 (0.0%) | 0 (0.0%) |
| 12:00 PM to 3:59 PM | 0 (0.0%) | 0 (0.0%) |
| 4:00 PM to 11:59 PM | 0 (0.0%) | 0 (0.0%) |
| Total | 110 (100.0%) | 63 (100.0%) |
Housing Occupancy in Banquete
Occupancy by Ownership in Banquete
Of the total 170 dwellings in Banquete, owner-occupied units account for 170 (100.0%), while renter-occupied units make up 0 (0.0%).
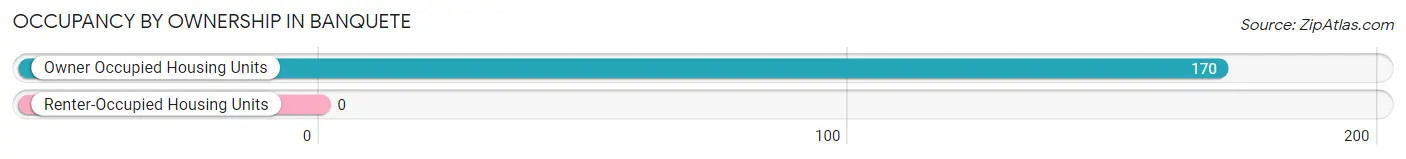
| Occupancy | # Housing Units | % Housing Units |
| Owner Occupied Housing Units | 170 | 100.0% |
| Renter-Occupied Housing Units | 0 | 0.0% |
| Total Occupied Housing Units | 170 | 100.0% |
Occupancy by Household Size in Banquete
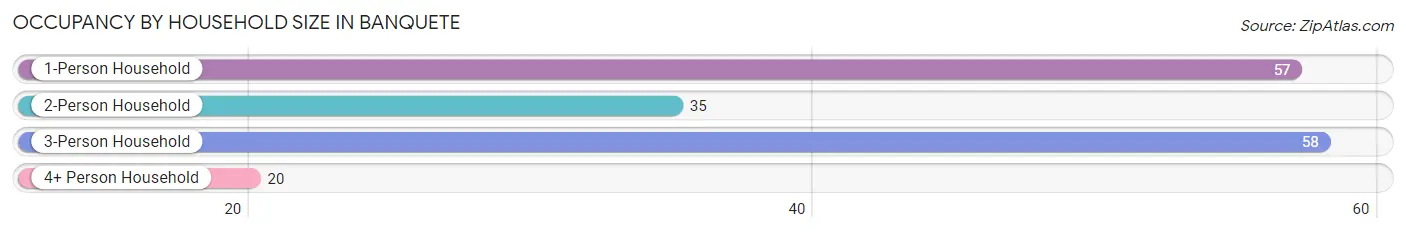
| Household Size | # Housing Units | % Housing Units |
| 1-Person Household | 57 | 33.5% |
| 2-Person Household | 35 | 20.6% |
| 3-Person Household | 58 | 34.1% |
| 4+ Person Household | 20 | 11.8% |
| Total Housing Units | 170 | 100.0% |
Occupancy by Ownership by Household Size in Banquete
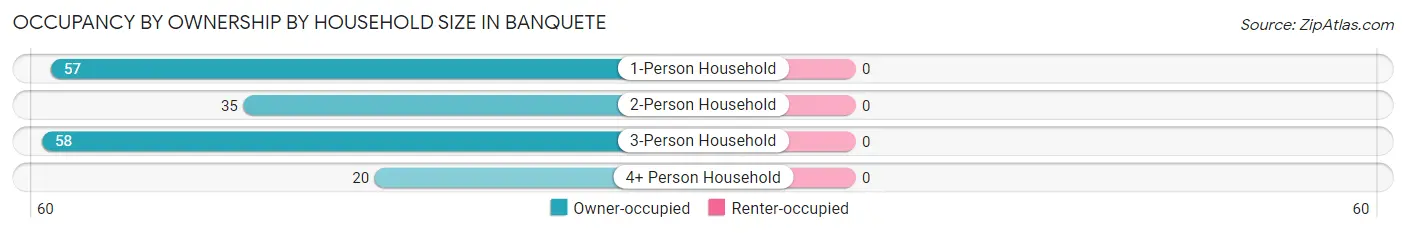
| Household Size | Owner-occupied | Renter-occupied |
| 1-Person Household | 57 (100.0%) | 0 (0.0%) |
| 2-Person Household | 35 (100.0%) | 0 (0.0%) |
| 3-Person Household | 58 (100.0%) | 0 (0.0%) |
| 4+ Person Household | 20 (100.0%) | 0 (0.0%) |
| Total Housing Units | 170 (100.0%) | 0 (0.0%) |
Occupancy by Educational Attainment in Banquete
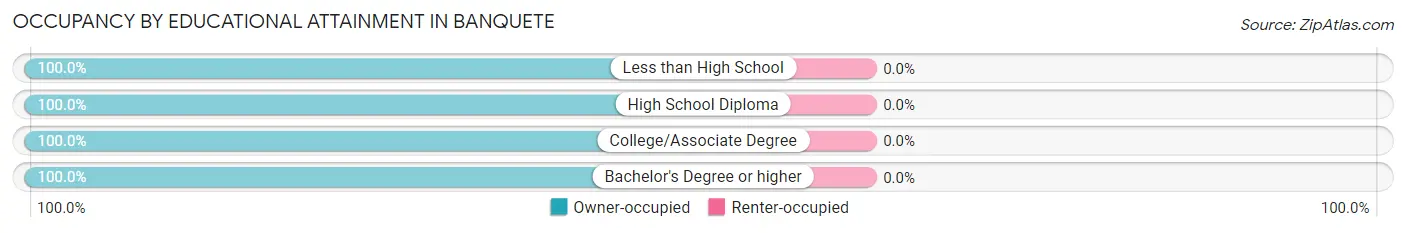
| Household Size | Owner-occupied | Renter-occupied |
| Less than High School | 77 (100.0%) | 0 (0.0%) |
| High School Diploma | 21 (100.0%) | 0 (0.0%) |
| College/Associate Degree | 27 (100.0%) | 0 (0.0%) |
| Bachelor's Degree or higher | 45 (100.0%) | 0 (0.0%) |
Occupancy by Age of Householder in Banquete
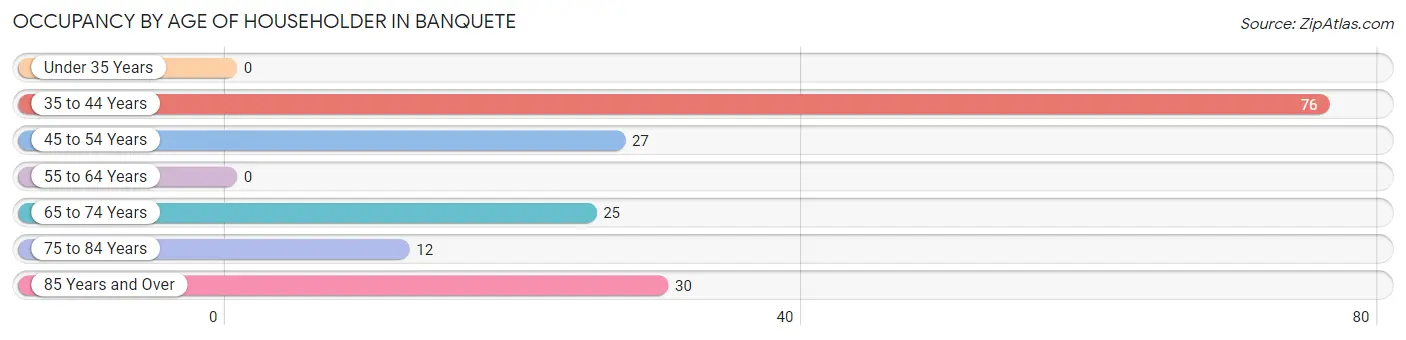
| Age Bracket | # Households | % Households |
| Under 35 Years | 0 | 0.0% |
| 35 to 44 Years | 76 | 44.7% |
| 45 to 54 Years | 27 | 15.9% |
| 55 to 64 Years | 0 | 0.0% |
| 65 to 74 Years | 25 | 14.7% |
| 75 to 84 Years | 12 | 7.1% |
| 85 Years and Over | 30 | 17.6% |
| Total | 170 | 100.0% |
Housing Finances in Banquete
Median Income by Occupancy in Banquete
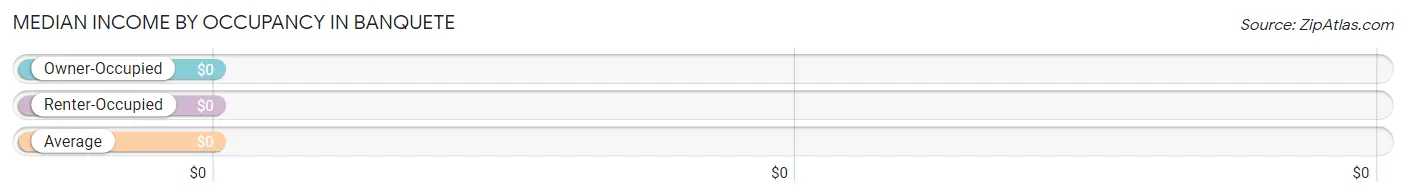
| Occupancy Type | # Households | Median Income |
| Owner-Occupied | 170 (100.0%) | $0 |
| Renter-Occupied | 0 (0.0%) | $0 |
| Average | 170 (100.0%) | $0 |
Occupancy by Householder Income Bracket in Banquete
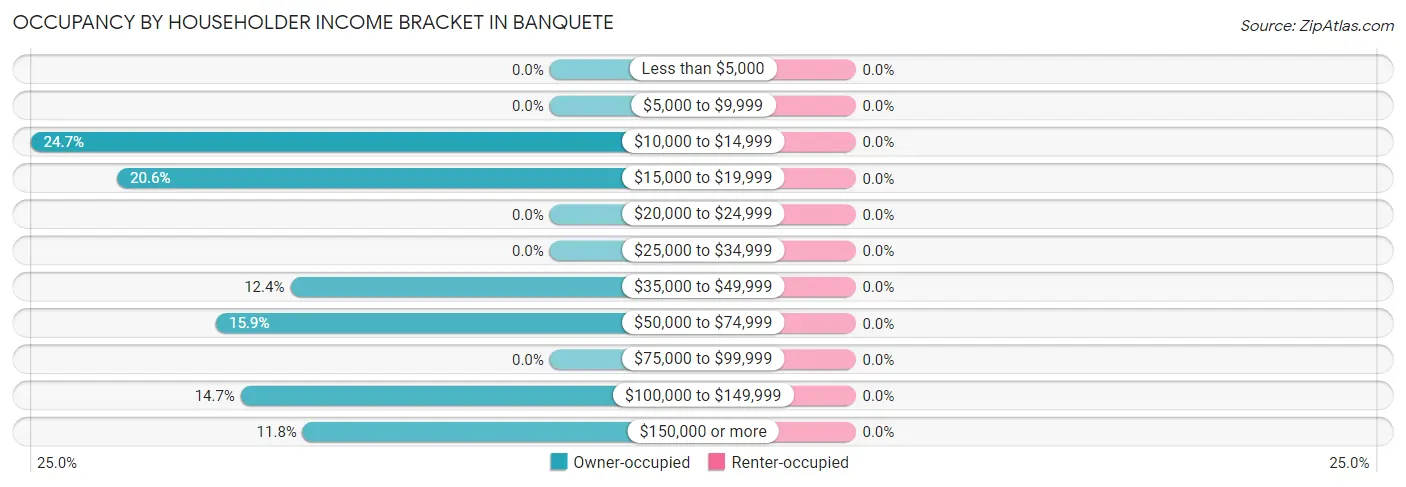
| Income Bracket | Owner-occupied | Renter-occupied |
| Less than $5,000 | 0 (0.0%) | 0 (0.0%) |
| $5,000 to $9,999 | 0 (0.0%) | 0 (0.0%) |
| $10,000 to $14,999 | 42 (24.7%) | 0 (0.0%) |
| $15,000 to $19,999 | 35 (20.6%) | 0 (0.0%) |
| $20,000 to $24,999 | 0 (0.0%) | 0 (0.0%) |
| $25,000 to $34,999 | 0 (0.0%) | 0 (0.0%) |
| $35,000 to $49,999 | 21 (12.3%) | 0 (0.0%) |
| $50,000 to $74,999 | 27 (15.9%) | 0 (0.0%) |
| $75,000 to $99,999 | 0 (0.0%) | 0 (0.0%) |
| $100,000 to $149,999 | 25 (14.7%) | 0 (0.0%) |
| $150,000 or more | 20 (11.8%) | 0 (0.0%) |
| Total | 170 (100.0%) | 0 (0.0%) |
Monthly Housing Cost Tiers in Banquete
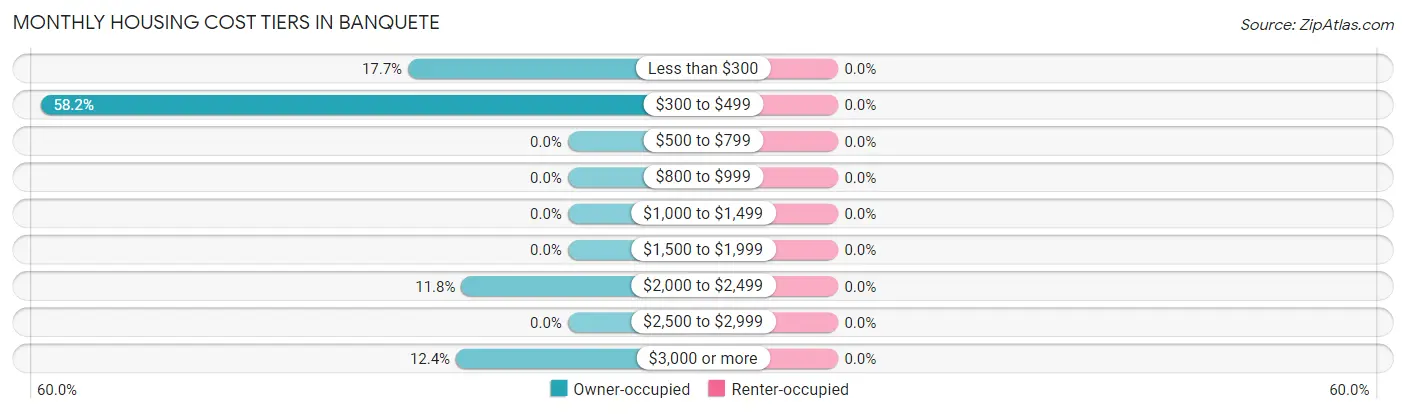
| Monthly Cost | Owner-occupied | Renter-occupied |
| Less than $300 | 30 (17.6%) | 0 (0.0%) |
| $300 to $499 | 99 (58.2%) | 0 (0.0%) |
| $500 to $799 | 0 (0.0%) | 0 (0.0%) |
| $800 to $999 | 0 (0.0%) | 0 (0.0%) |
| $1,000 to $1,499 | 0 (0.0%) | 0 (0.0%) |
| $1,500 to $1,999 | 0 (0.0%) | 0 (0.0%) |
| $2,000 to $2,499 | 20 (11.8%) | 0 (0.0%) |
| $2,500 to $2,999 | 0 (0.0%) | 0 (0.0%) |
| $3,000 or more | 21 (12.3%) | 0 (0.0%) |
| Total | 170 (100.0%) | 0 (0.0%) |
Physical Housing Characteristics in Banquete
Housing Structures in Banquete
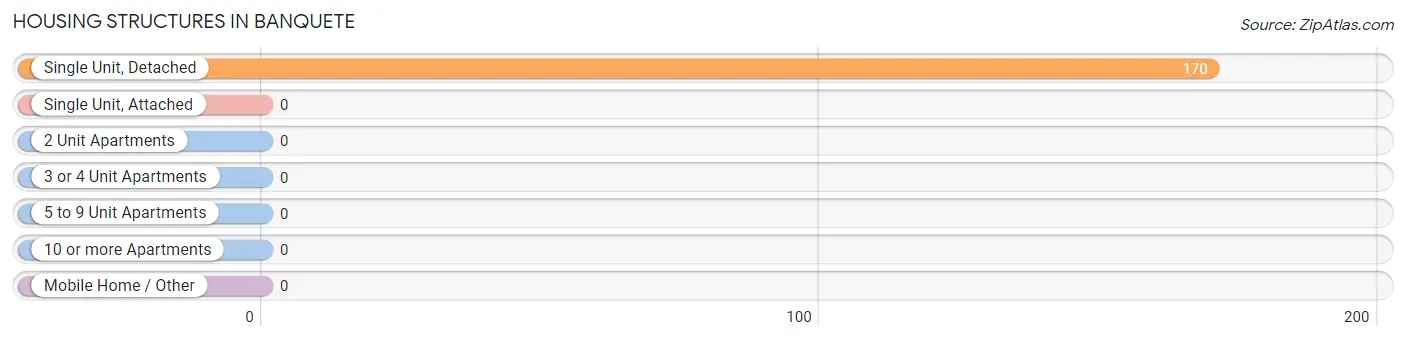
| Structure Type | # Housing Units | % Housing Units |
| Single Unit, Detached | 170 | 100.0% |
| Single Unit, Attached | 0 | 0.0% |
| 2 Unit Apartments | 0 | 0.0% |
| 3 or 4 Unit Apartments | 0 | 0.0% |
| 5 to 9 Unit Apartments | 0 | 0.0% |
| 10 or more Apartments | 0 | 0.0% |
| Mobile Home / Other | 0 | 0.0% |
| Total | 170 | 100.0% |
Housing Structures by Occupancy in Banquete
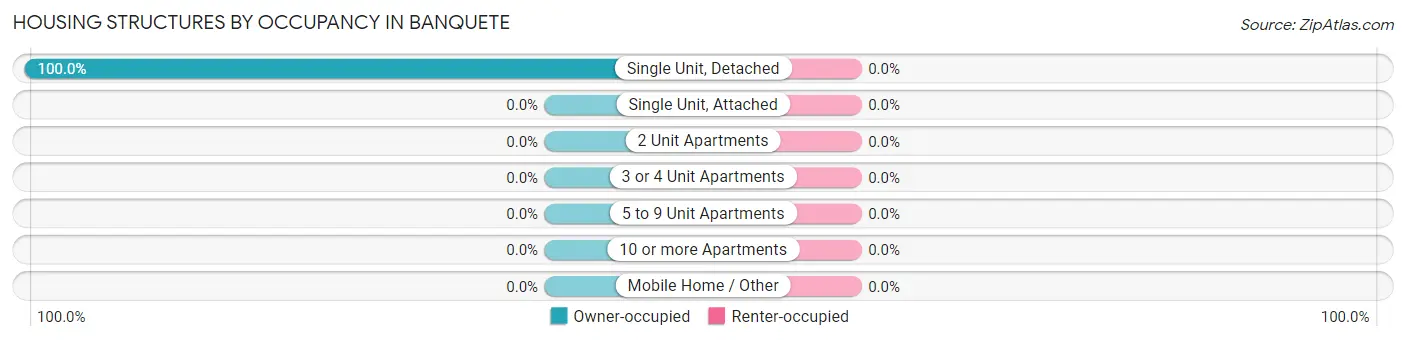
| Structure Type | Owner-occupied | Renter-occupied |
| Single Unit, Detached | 170 (100.0%) | 0 (0.0%) |
| Single Unit, Attached | 0 (0.0%) | 0 (0.0%) |
| 2 Unit Apartments | 0 (0.0%) | 0 (0.0%) |
| 3 or 4 Unit Apartments | 0 (0.0%) | 0 (0.0%) |
| 5 to 9 Unit Apartments | 0 (0.0%) | 0 (0.0%) |
| 10 or more Apartments | 0 (0.0%) | 0 (0.0%) |
| Mobile Home / Other | 0 (0.0%) | 0 (0.0%) |
| Total | 170 (100.0%) | 0 (0.0%) |
Housing Structures by Number of Rooms in Banquete
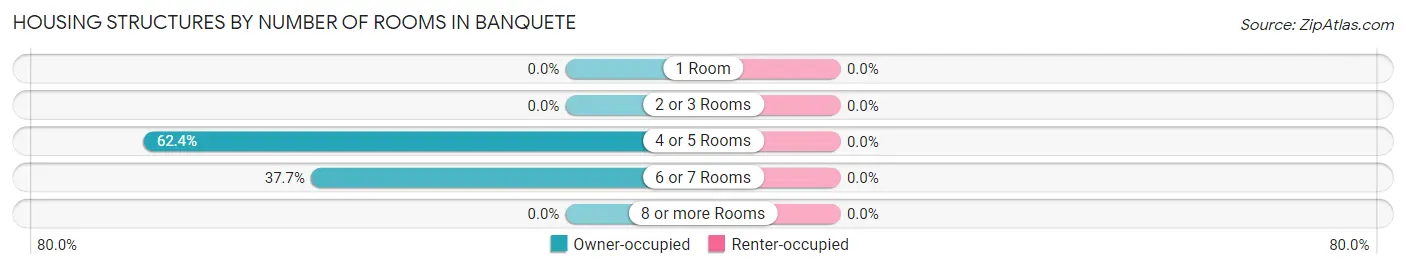
| Number of Rooms | Owner-occupied | Renter-occupied |
| 1 Room | 0 (0.0%) | 0 (0.0%) |
| 2 or 3 Rooms | 0 (0.0%) | 0 (0.0%) |
| 4 or 5 Rooms | 106 (62.4%) | 0 (0.0%) |
| 6 or 7 Rooms | 64 (37.7%) | 0 (0.0%) |
| 8 or more Rooms | 0 (0.0%) | 0 (0.0%) |
| Total | 170 (100.0%) | 0 (0.0%) |
Housing Structure by Heating Type in Banquete
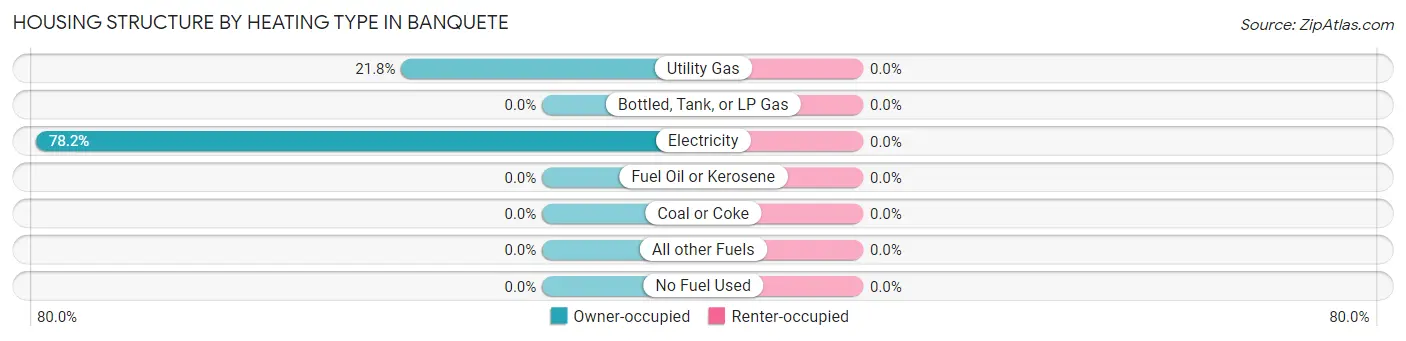
| Heating Type | Owner-occupied | Renter-occupied |
| Utility Gas | 37 (21.8%) | 0 (0.0%) |
| Bottled, Tank, or LP Gas | 0 (0.0%) | 0 (0.0%) |
| Electricity | 133 (78.2%) | 0 (0.0%) |
| Fuel Oil or Kerosene | 0 (0.0%) | 0 (0.0%) |
| Coal or Coke | 0 (0.0%) | 0 (0.0%) |
| All other Fuels | 0 (0.0%) | 0 (0.0%) |
| No Fuel Used | 0 (0.0%) | 0 (0.0%) |
| Total | 170 (100.0%) | 0 (0.0%) |
Household Vehicle Usage in Banquete
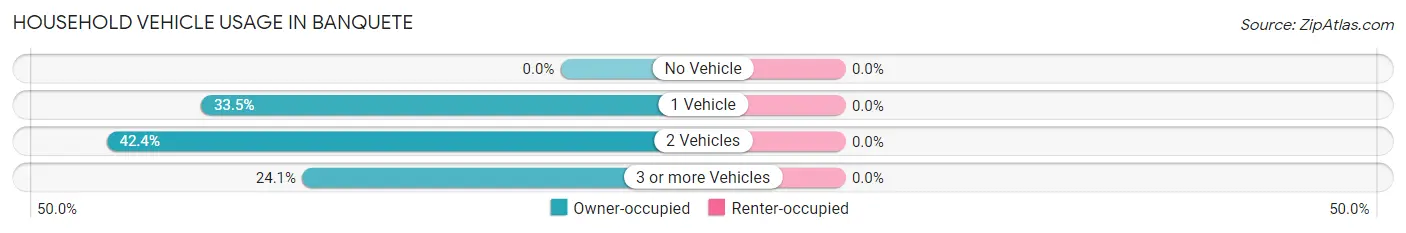
| Vehicles per Household | Owner-occupied | Renter-occupied |
| No Vehicle | 0 (0.0%) | 0 (0.0%) |
| 1 Vehicle | 57 (33.5%) | 0 (0.0%) |
| 2 Vehicles | 72 (42.3%) | 0 (0.0%) |
| 3 or more Vehicles | 41 (24.1%) | 0 (0.0%) |
| Total | 170 (100.0%) | 0 (0.0%) |
Real Estate & Mortgages in Banquete
Real Estate and Mortgage Overview in Banquete
| Characteristic | Without Mortgage | With Mortgage |
| Housing Units | 129 | 41 |
| Median Property Value | $69,400 | $0 |
| Median Household Income | - | - |
| Monthly Housing Costs | $363 | $21 |
| Real Estate Taxes | - | - |
Property Value by Mortgage Status in Banquete
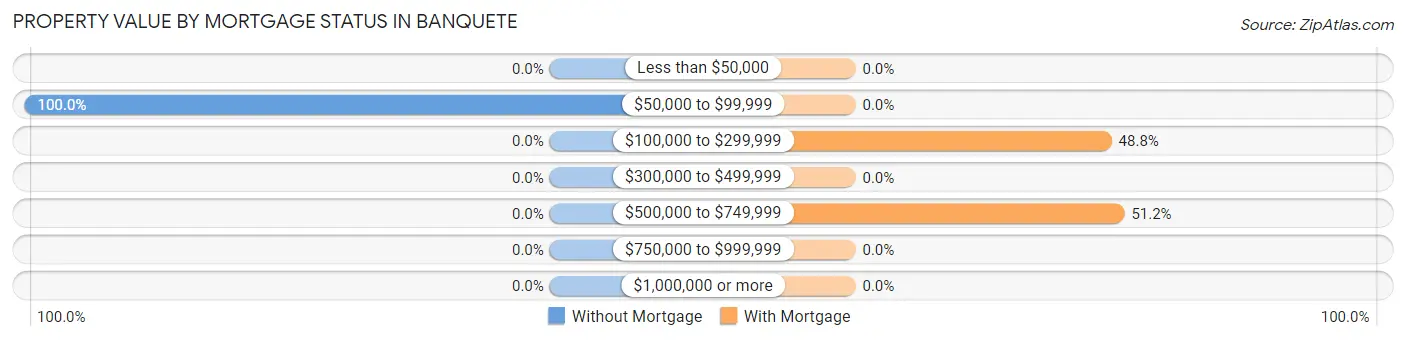
| Property Value | Without Mortgage | With Mortgage |
| Less than $50,000 | 0 (0.0%) | 0 (0.0%) |
| $50,000 to $99,999 | 129 (100.0%) | 0 (0.0%) |
| $100,000 to $299,999 | 0 (0.0%) | 20 (48.8%) |
| $300,000 to $499,999 | 0 (0.0%) | 0 (0.0%) |
| $500,000 to $749,999 | 0 (0.0%) | 21 (51.2%) |
| $750,000 to $999,999 | 0 (0.0%) | 0 (0.0%) |
| $1,000,000 or more | 0 (0.0%) | 0 (0.0%) |
| Total | 129 (100.0%) | 41 (100.0%) |
Household Income by Mortgage Status in Banquete
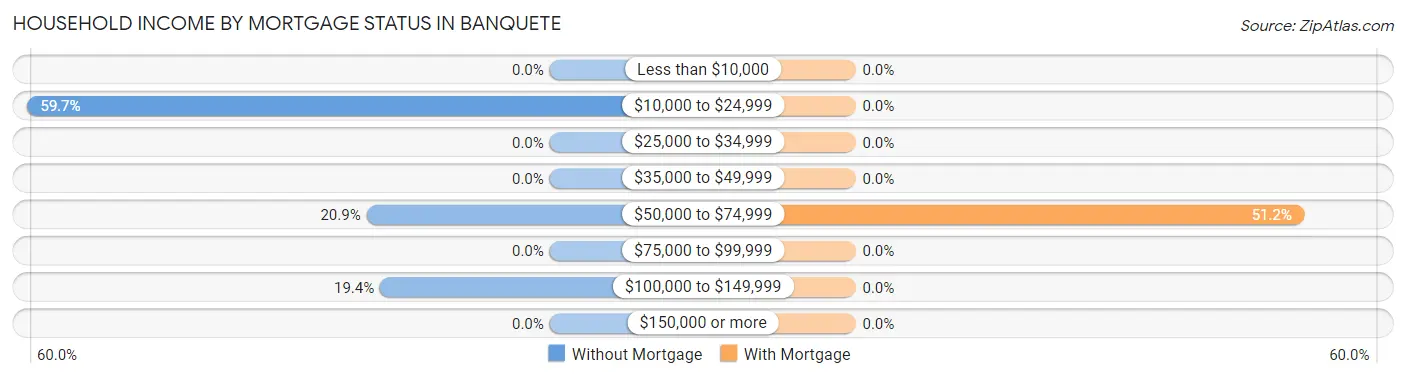
| Household Income | Without Mortgage | With Mortgage |
| Less than $10,000 | 0 (0.0%) | 0 (0.0%) |
| $10,000 to $24,999 | 77 (59.7%) | 0 (0.0%) |
| $25,000 to $34,999 | 0 (0.0%) | 0 (0.0%) |
| $35,000 to $49,999 | 0 (0.0%) | 0 (0.0%) |
| $50,000 to $74,999 | 27 (20.9%) | 21 (51.2%) |
| $75,000 to $99,999 | 0 (0.0%) | 0 (0.0%) |
| $100,000 to $149,999 | 25 (19.4%) | 0 (0.0%) |
| $150,000 or more | 0 (0.0%) | 0 (0.0%) |
| Total | 129 (100.0%) | 41 (100.0%) |
Property Value to Household Income Ratio in Banquete
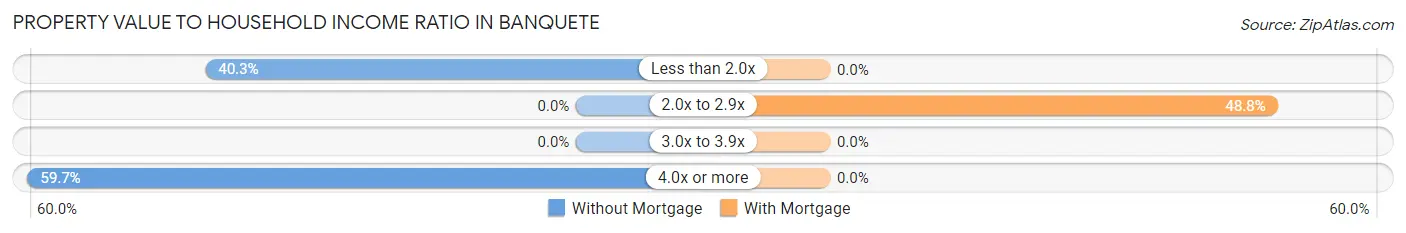
| Value-to-Income Ratio | Without Mortgage | With Mortgage |
| Less than 2.0x | 52 (40.3%) | 0 (0.0%) |
| 2.0x to 2.9x | 0 (0.0%) | 20 (48.8%) |
| 3.0x to 3.9x | 0 (0.0%) | 0 (0.0%) |
| 4.0x or more | 77 (59.7%) | 0 (0.0%) |
| Total | 129 (100.0%) | 41 (100.0%) |
Real Estate Taxes by Mortgage Status in Banquete
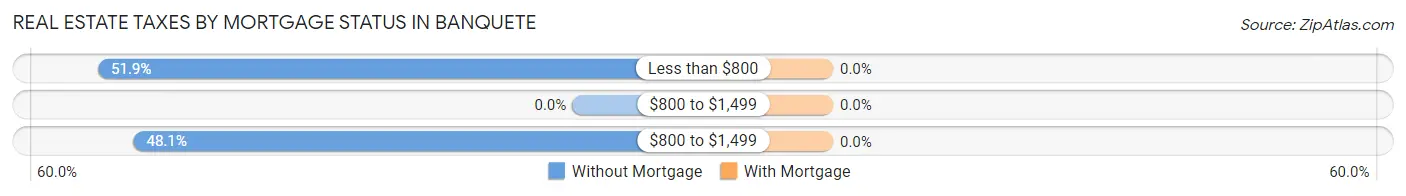
| Property Taxes | Without Mortgage | With Mortgage |
| Less than $800 | 67 (51.9%) | 0 (0.0%) |
| $800 to $1,499 | 0 (0.0%) | 0 (0.0%) |
| $800 to $1,499 | 62 (48.1%) | 0 (0.0%) |
| Total | 129 (100.0%) | 41 (100.0%) |
Health & Disability in Banquete
Health Insurance Coverage by Age in Banquete
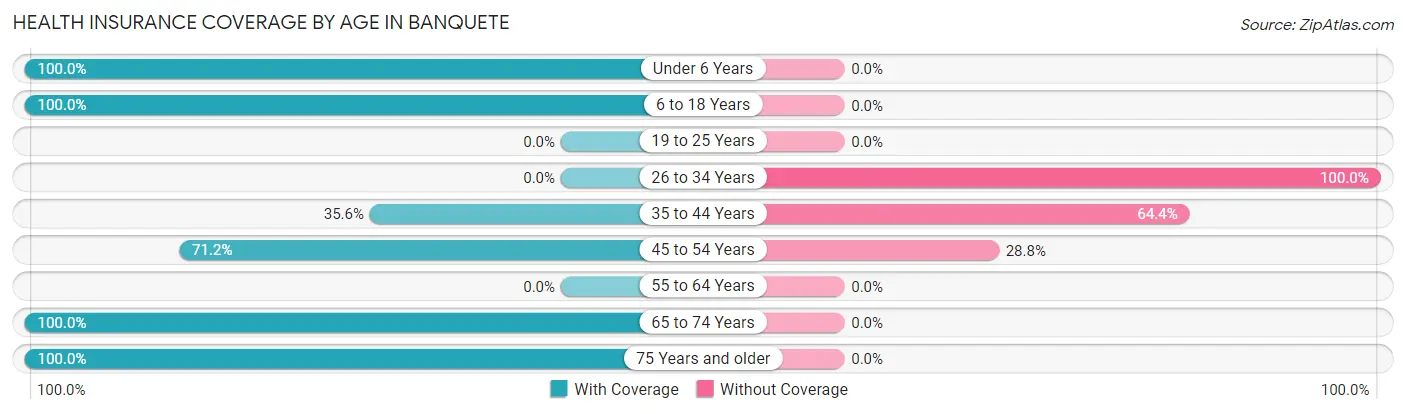
| Age Bracket | With Coverage | Without Coverage |
| Under 6 Years | 57 (100.0%) | 0 (0.0%) |
| 6 to 18 Years | 65 (100.0%) | 0 (0.0%) |
| 19 to 25 Years | 0 (0.0%) | 0 (0.0%) |
| 26 to 34 Years | 0 (0.0%) | 20 (100.0%) |
| 35 to 44 Years | 31 (35.6%) | 56 (64.4%) |
| 45 to 54 Years | 89 (71.2%) | 36 (28.8%) |
| 55 to 64 Years | 0 (0.0%) | 0 (0.0%) |
| 65 to 74 Years | 25 (100.0%) | 0 (0.0%) |
| 75 Years and older | 76 (100.0%) | 0 (0.0%) |
| Total | 343 (75.4%) | 112 (24.6%) |
Health Insurance Coverage by Citizenship Status in Banquete
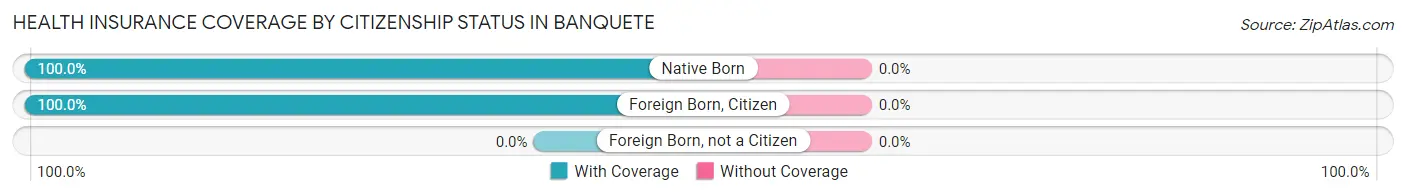
| Citizenship Status | With Coverage | Without Coverage |
| Native Born | 57 (100.0%) | 0 (0.0%) |
| Foreign Born, Citizen | 65 (100.0%) | 0 (0.0%) |
| Foreign Born, not a Citizen | 0 (0.0%) | 0 (0.0%) |
Health Insurance Coverage by Household Income in Banquete
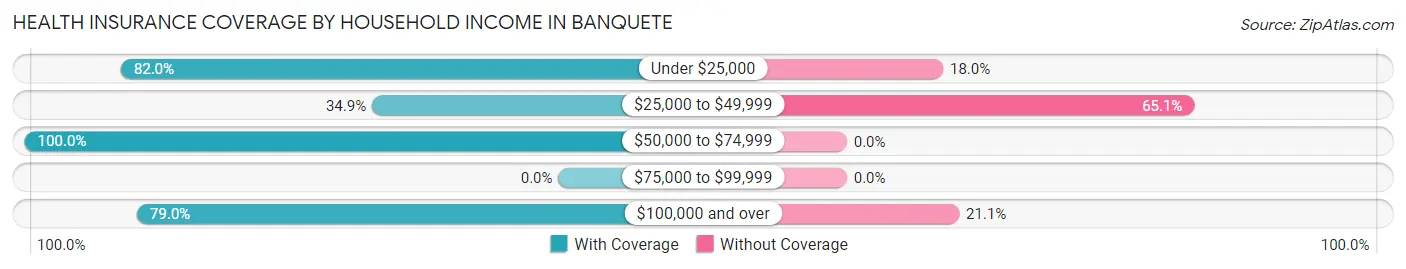
| Household Income | With Coverage | Without Coverage |
| Under $25,000 | 159 (82.0%) | 35 (18.0%) |
| $25,000 to $49,999 | 22 (34.9%) | 41 (65.1%) |
| $50,000 to $74,999 | 27 (100.0%) | 0 (0.0%) |
| $75,000 to $99,999 | 0 (0.0%) | 0 (0.0%) |
| $100,000 and over | 135 (78.9%) | 36 (21.0%) |
Public vs Private Health Insurance Coverage by Age in Banquete
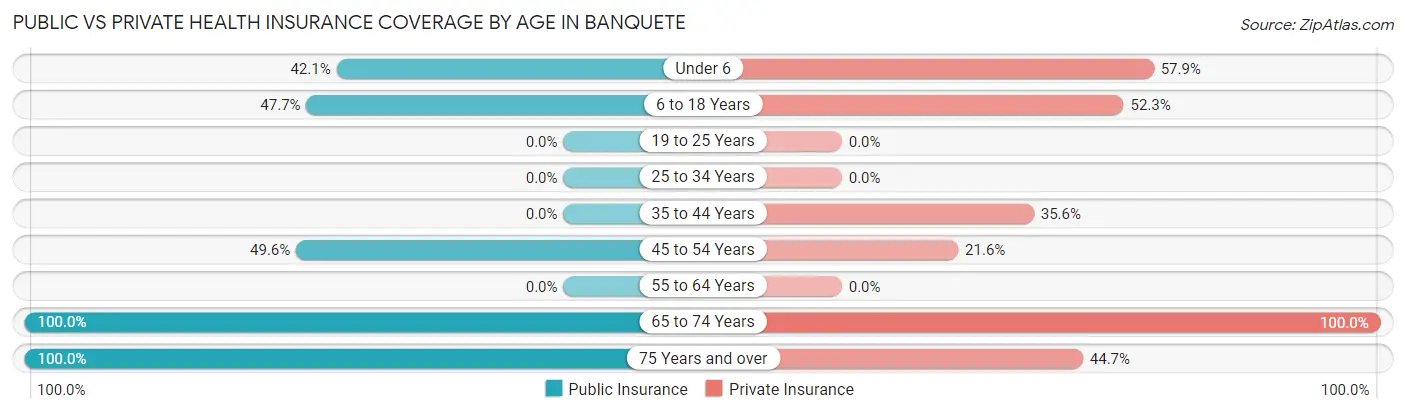
| Age Bracket | Public Insurance | Private Insurance |
| Under 6 | 24 (42.1%) | 33 (57.9%) |
| 6 to 18 Years | 31 (47.7%) | 34 (52.3%) |
| 19 to 25 Years | 0 (0.0%) | 0 (0.0%) |
| 25 to 34 Years | 0 (0.0%) | 0 (0.0%) |
| 35 to 44 Years | 0 (0.0%) | 31 (35.6%) |
| 45 to 54 Years | 62 (49.6%) | 27 (21.6%) |
| 55 to 64 Years | 0 (0.0%) | 0 (0.0%) |
| 65 to 74 Years | 25 (100.0%) | 25 (100.0%) |
| 75 Years and over | 76 (100.0%) | 34 (44.7%) |
| Total | 218 (47.9%) | 184 (40.4%) |
Disability Status by Sex by Age in Banquete
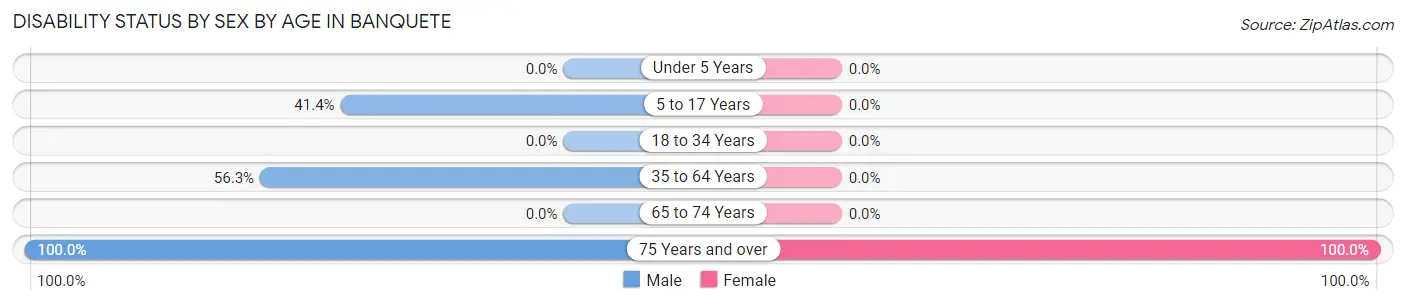
| Age Bracket | Male | Female |
| Under 5 Years | 0 (0.0%) | 0 (0.0%) |
| 5 to 17 Years | 24 (41.4%) | 0 (0.0%) |
| 18 to 34 Years | 0 (0.0%) | 0 (0.0%) |
| 35 to 64 Years | 98 (56.3%) | 0 (0.0%) |
| 65 to 74 Years | 0 (0.0%) | 0 (0.0%) |
| 75 Years and over | 34 (100.0%) | 42 (100.0%) |
Disability Class by Sex by Age in Banquete
Disability Class: Hearing Difficulty
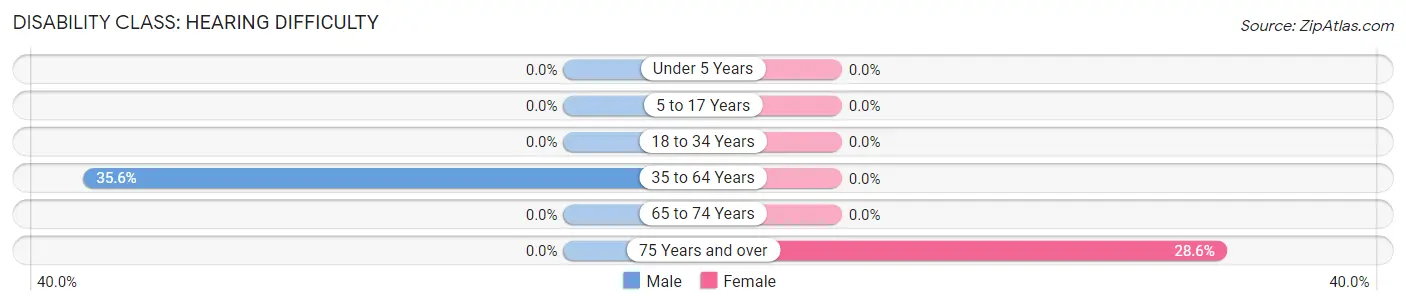
| Age Bracket | Male | Female |
| Under 5 Years | 0 (0.0%) | 0 (0.0%) |
| 5 to 17 Years | 0 (0.0%) | 0 (0.0%) |
| 18 to 34 Years | 0 (0.0%) | 0 (0.0%) |
| 35 to 64 Years | 62 (35.6%) | 0 (0.0%) |
| 65 to 74 Years | 0 (0.0%) | 0 (0.0%) |
| 75 Years and over | 0 (0.0%) | 12 (28.6%) |
Disability Class: Vision Difficulty
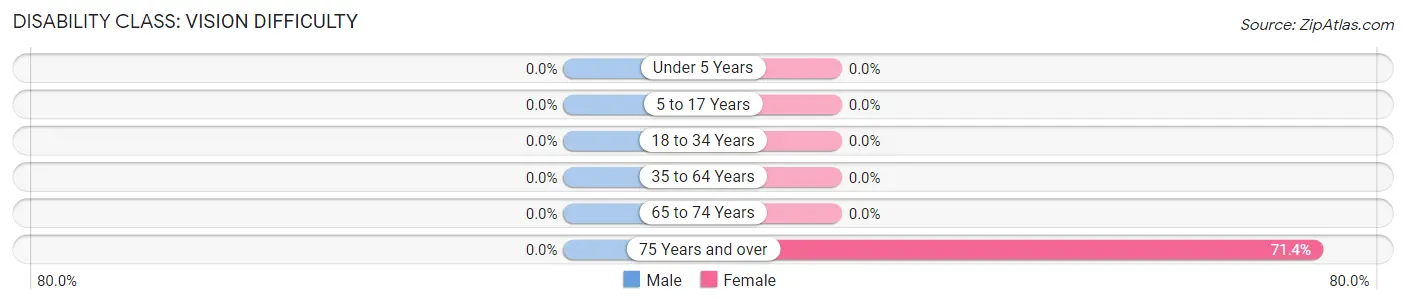
| Age Bracket | Male | Female |
| Under 5 Years | 0 (0.0%) | 0 (0.0%) |
| 5 to 17 Years | 0 (0.0%) | 0 (0.0%) |
| 18 to 34 Years | 0 (0.0%) | 0 (0.0%) |
| 35 to 64 Years | 0 (0.0%) | 0 (0.0%) |
| 65 to 74 Years | 0 (0.0%) | 0 (0.0%) |
| 75 Years and over | 0 (0.0%) | 30 (71.4%) |
Disability Class: Cognitive Difficulty
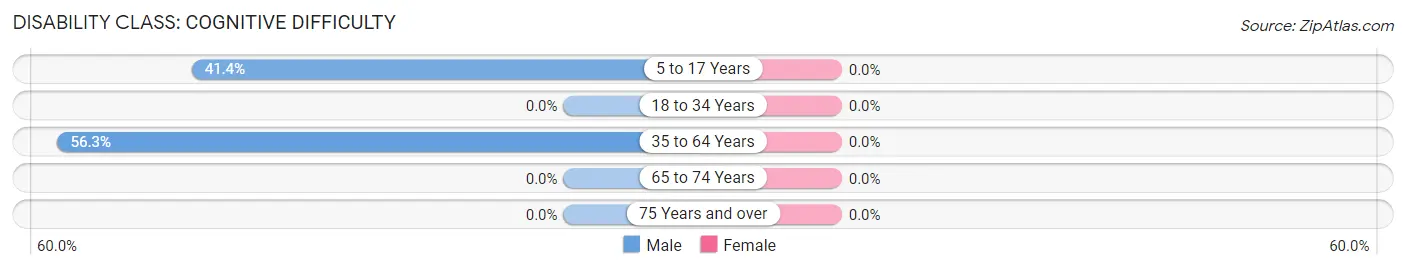
| Age Bracket | Male | Female |
| 5 to 17 Years | 24 (41.4%) | 0 (0.0%) |
| 18 to 34 Years | 0 (0.0%) | 0 (0.0%) |
| 35 to 64 Years | 98 (56.3%) | 0 (0.0%) |
| 65 to 74 Years | 0 (0.0%) | 0 (0.0%) |
| 75 Years and over | 0 (0.0%) | 0 (0.0%) |
Disability Class: Ambulatory Difficulty
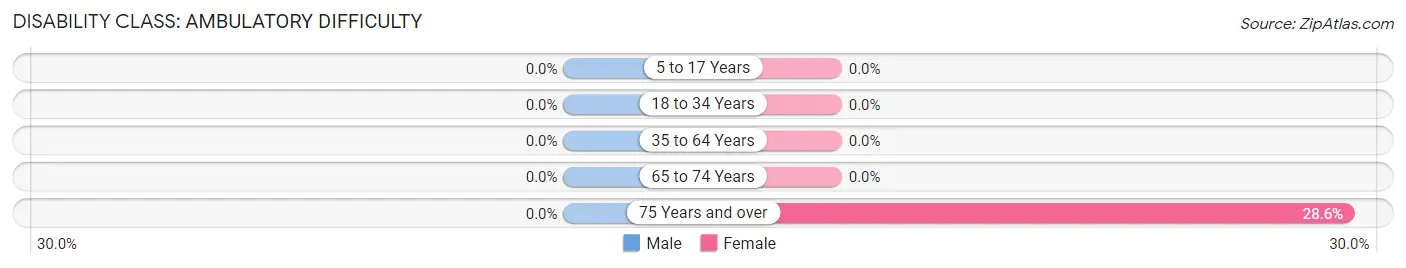
| Age Bracket | Male | Female |
| 5 to 17 Years | 0 (0.0%) | 0 (0.0%) |
| 18 to 34 Years | 0 (0.0%) | 0 (0.0%) |
| 35 to 64 Years | 0 (0.0%) | 0 (0.0%) |
| 65 to 74 Years | 0 (0.0%) | 0 (0.0%) |
| 75 Years and over | 0 (0.0%) | 12 (28.6%) |
Disability Class: Self-Care Difficulty
| Age Bracket | Male | Female |
| 5 to 17 Years | 0 (0.0%) | 0 (0.0%) |
| 18 to 34 Years | 0 (0.0%) | 0 (0.0%) |
| 35 to 64 Years | 0 (0.0%) | 0 (0.0%) |
| 65 to 74 Years | 0 (0.0%) | 0 (0.0%) |
| 75 Years and over | 0 (0.0%) | 0 (0.0%) |
Technology Access in Banquete
Computing Device Access in Banquete
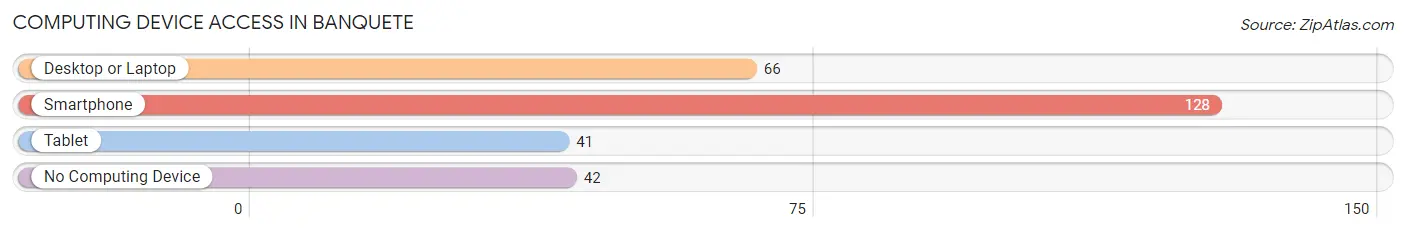
| Device Type | # Households | % Households |
| Desktop or Laptop | 66 | 38.8% |
| Smartphone | 128 | 75.3% |
| Tablet | 41 | 24.1% |
| No Computing Device | 42 | 24.7% |
| Total | 170 | 100.0% |
Internet Access in Banquete
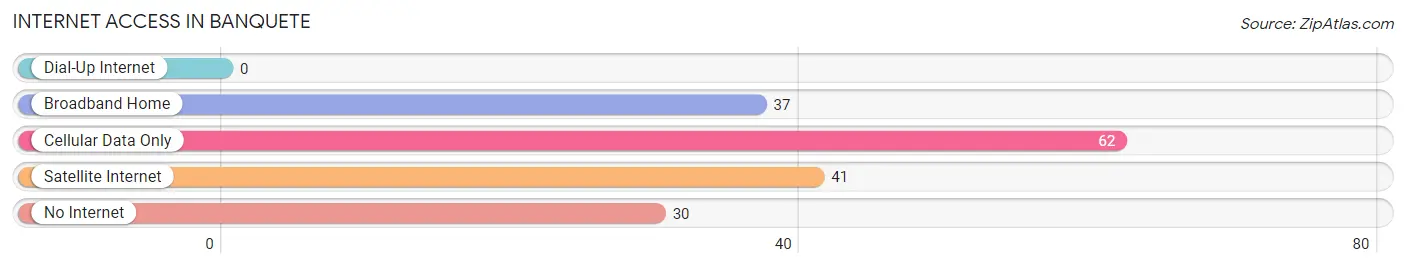
| Internet Type | # Households | % Households |
| Dial-Up Internet | 0 | 0.0% |
| Broadband Home | 37 | 21.8% |
| Cellular Data Only | 62 | 36.5% |
| Satellite Internet | 41 | 24.1% |
| No Internet | 30 | 17.6% |
| Total | 170 | 100.0% |
Banquete Summary
Banquete is a small unincorporated community located in Nueces County, Texas, United States. It is situated along the banks of the Nueces River, approximately 20 miles northwest of Corpus Christi. The population of Banquete was estimated to be around 1,000 in 2020.
History
Banquete was first settled in the late 1800s by a group of Mexican immigrants who were looking for a place to settle and start a new life. The town was originally called “El Banquete”, which translates to “the banquet” in English. The name was chosen to reflect the festive atmosphere of the town, which was known for its lively fiestas and celebrations.
In the early 1900s, Banquete began to grow and develop as a small agricultural community. The town was home to several small farms and ranches, as well as a few stores and businesses. The town also had a post office, which opened in 1906.
In the 1920s, Banquete began to experience a period of growth and prosperity. The town was home to several businesses, including a cotton gin, a general store, a blacksmith shop, and a hotel. The town also had a school, which was established in 1923.
In the 1940s, Banquete experienced a period of decline as many of its residents moved away in search of better opportunities. The town’s population decreased from around 500 in 1940 to just over 200 in 1950.
In the 1950s, Banquete began to experience a period of revitalization. The town was home to several new businesses, including a grocery store, a gas station, and a restaurant. The town also had a new school, which opened in 1954.
In the 1960s, Banquete experienced a period of growth and development. The town was home to several new businesses, including a hardware store, a pharmacy, and a bank. The town also had a new post office, which opened in 1965.
In the 1970s, Banquete experienced a period of decline as many of its residents moved away in search of better opportunities. The town’s population decreased from around 500 in 1970 to just over 200 in 1980.
In the 1980s, Banquete began to experience a period of revitalization. The town was home to several new businesses, including a grocery store, a gas station, and a restaurant. The town also had a new school, which opened in 1984.
In the 1990s, Banquete experienced a period of growth and development. The town was home to several new businesses, including a hardware store, a pharmacy, and a bank. The town also had a new post office, which opened in 1995.
Geography
Banquete is located in Nueces County, Texas, approximately 20 miles northwest of Corpus Christi. The town is situated along the banks of the Nueces River. The terrain of the area is mostly flat, with some rolling hills. The climate is generally warm and humid, with temperatures ranging from the mid-60s in the winter to the mid-90s in the summer.
Economy
The economy of Banquete is largely based on agriculture. The town is home to several small farms and ranches, as well as a few stores and businesses. The town also has a post office, which opened in 1906.
Demographics
As of 2020, the population of Banquete was estimated to be around 1,000. The town is predominantly Hispanic, with around 95% of the population identifying as such. The median household income in Banquete is around $30,000, and the median home value is around $90,000.
Common Questions
What is Per Capita Income in Banquete?
Per Capita income in Banquete is $22,636.
What is Inequality or Gini Index in Banquete?
Inequality or Gini Index in Banquete is 0.46.
What is the Total Population of Banquete?
Total Population of Banquete is 455.
What is the Total Male Population of Banquete?
Total Male Population of Banquete is 299.
What is the Total Female Population of Banquete?
Total Female Population of Banquete is 156.
What is the Ratio of Males per 100 Females in Banquete?
There are 191.67 Males per 100 Females in Banquete.
What is the Ratio of Females per 100 Males in Banquete?
There are 52.17 Females per 100 Males in Banquete.
What is the Median Population Age in Banquete?
Median Population Age in Banquete is 39.0 Years.
What is the Average Family Size in Banquete
Average Family Size in Banquete is 3.5 People.
What is the Average Household Size in Banquete
Average Household Size in Banquete is 2.7 People.
How Large is the Labor Force in Banquete?
There are 209 People in the Labor Forcein in Banquete.
What is the Percentage of People in the Labor Force in Banquete?
62.8% of People are in the Labor Force in Banquete.
What is the Unemployment Rate in Banquete?
Unemployment Rate in Banquete is 17.2%.