Las Lomas, TX Map & Demographics
Las Lomas Map
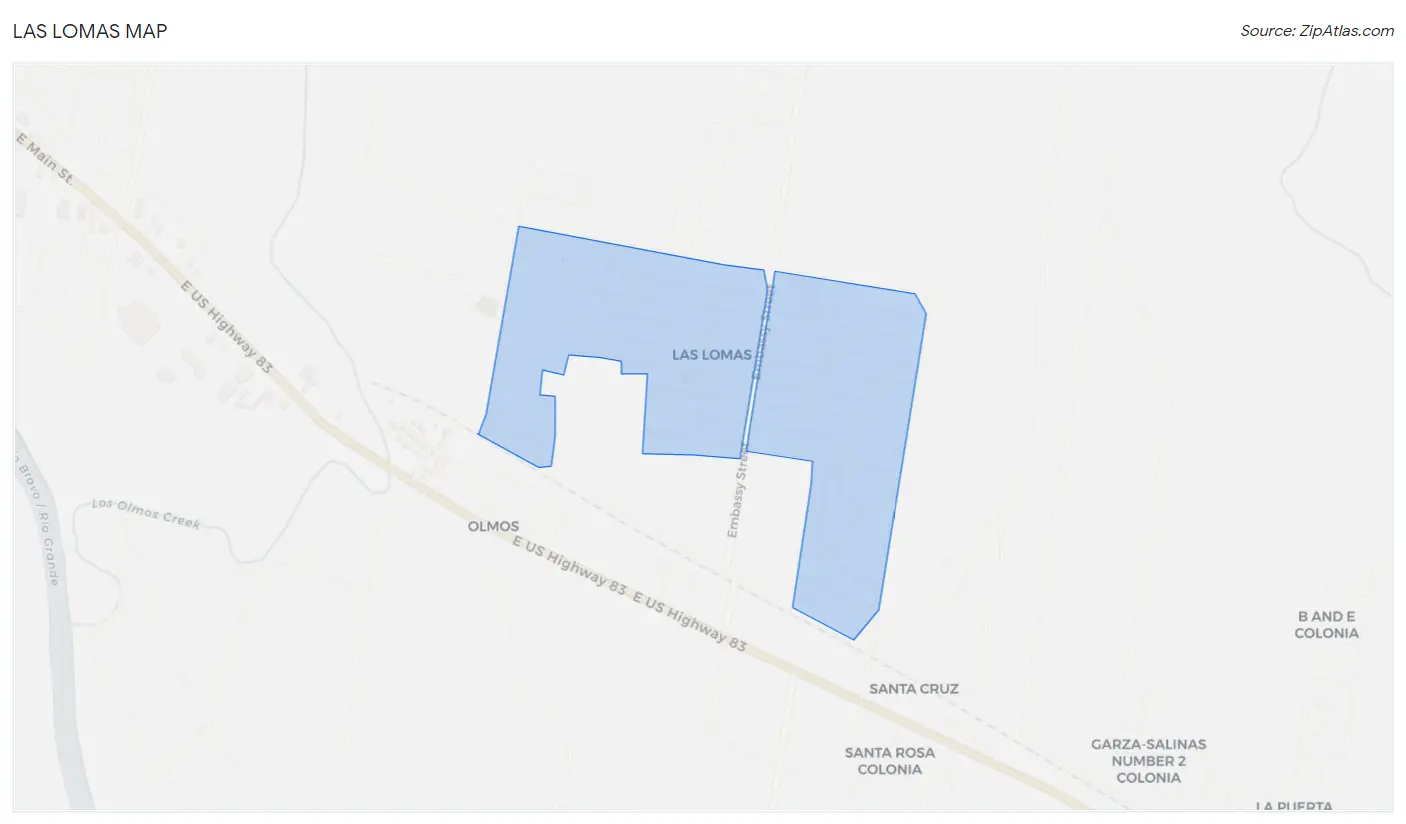
Las Lomas Overview
$14,912
PER CAPITA INCOME
$32,150
AVG FAMILY INCOME
$26,964
AVG HOUSEHOLD INCOME
0.49
INEQUALITY / GINI INDEX
2,164
TOTAL POPULATION
944
MALE POPULATION
1,220
FEMALE POPULATION
77.38
MALES / 100 FEMALES
129.24
FEMALES / 100 MALES
28.8
MEDIAN AGE
3.9
AVG FAMILY SIZE
3.2
AVG HOUSEHOLD SIZE
1,019
LABOR FORCE [ PEOPLE ]
61.2%
PERCENT IN LABOR FORCE
20.0%
UNEMPLOYMENT RATE
Income in Las Lomas
Income Overview in Las Lomas
Per Capita Income in Las Lomas is $14,912, while median incomes of families and households are $32,150 and $26,964 respectively.
| Characteristic | Number | Measure |
| Per Capita Income | 2,164 | $14,912 |
| Median Family Income | 502 | $32,150 |
| Mean Family Income | 502 | $49,767 |
| Median Household Income | 667 | $26,964 |
| Mean Household Income | 667 | $44,150 |
| Income Deficit | 502 | $0 |
| Wage / Income Gap (%) | 2,164 | 0.00% |
| Wage / Income Gap ($) | 2,164 | 100.00¢ per $1 |
| Gini / Inequality Index | 2,164 | 0.49 |
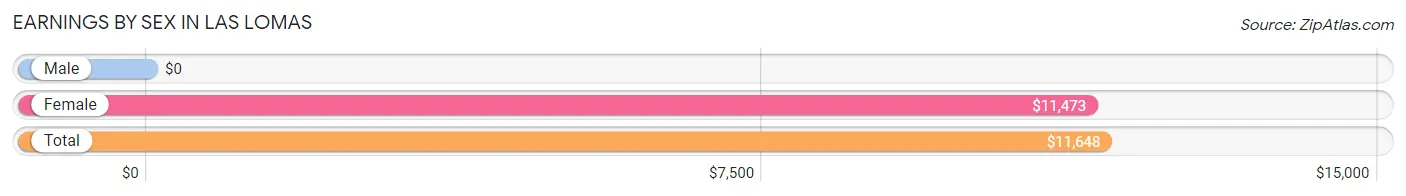
Earnings by Sex in Las Lomas
| Sex | Number | Average Earnings |
| Male | 486 (48.4%) | $0 |
| Female | 517 (51.5%) | $11,473 |
| Total | 1,003 (100.0%) | $11,648 |
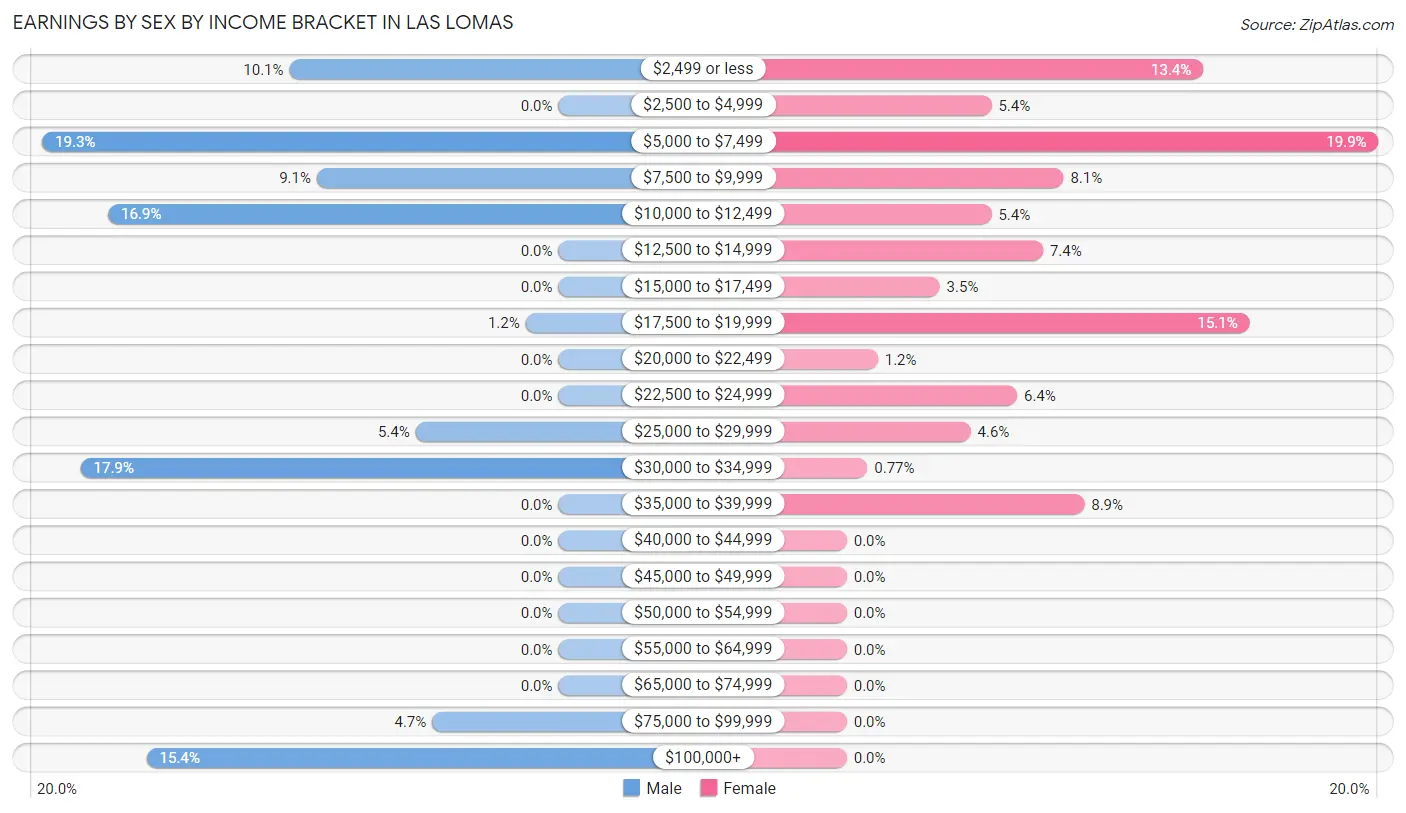
Earnings by Sex by Income Bracket in Las Lomas
The most common earnings brackets in Las Lomas are $5,000 to $7,499 for men (94 | 19.3%) and $5,000 to $7,499 for women (103 | 19.9%).
| Income | Male | Female |
| $2,499 or less | 49 (10.1%) | 69 (13.4%) |
| $2,500 to $4,999 | 0 (0.0%) | 28 (5.4%) |
| $5,000 to $7,499 | 94 (19.3%) | 103 (19.9%) |
| $7,500 to $9,999 | 44 (9.0%) | 42 (8.1%) |
| $10,000 to $12,499 | 82 (16.9%) | 28 (5.4%) |
| $12,500 to $14,999 | 0 (0.0%) | 38 (7.3%) |
| $15,000 to $17,499 | 0 (0.0%) | 18 (3.5%) |
| $17,500 to $19,999 | 6 (1.2%) | 78 (15.1%) |
| $20,000 to $22,499 | 0 (0.0%) | 6 (1.2%) |
| $22,500 to $24,999 | 0 (0.0%) | 33 (6.4%) |
| $25,000 to $29,999 | 26 (5.3%) | 24 (4.6%) |
| $30,000 to $34,999 | 87 (17.9%) | 4 (0.8%) |
| $35,000 to $39,999 | 0 (0.0%) | 46 (8.9%) |
| $40,000 to $44,999 | 0 (0.0%) | 0 (0.0%) |
| $45,000 to $49,999 | 0 (0.0%) | 0 (0.0%) |
| $50,000 to $54,999 | 0 (0.0%) | 0 (0.0%) |
| $55,000 to $64,999 | 0 (0.0%) | 0 (0.0%) |
| $65,000 to $74,999 | 0 (0.0%) | 0 (0.0%) |
| $75,000 to $99,999 | 23 (4.7%) | 0 (0.0%) |
| $100,000+ | 75 (15.4%) | 0 (0.0%) |
| Total | 486 (100.0%) | 517 (100.0%) |
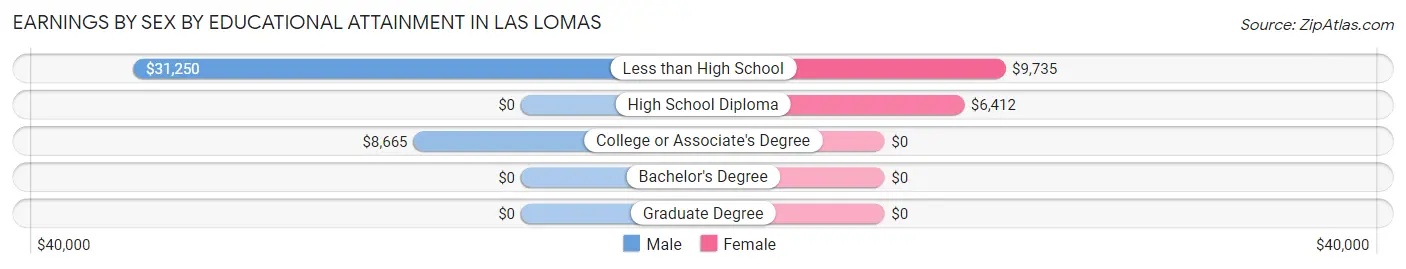
Earnings by Sex by Educational Attainment in Las Lomas
| Educational Attainment | Male Income | Female Income |
| Less than High School | $31,250 | $9,735 |
| High School Diploma | - | - |
| College or Associate's Degree | $8,665 | $0 |
| Bachelor's Degree | - | - |
| Graduate Degree | - | - |
| Total | - | - |
Family Income in Las Lomas
Family Income Brackets in Las Lomas
According to the Las Lomas family income data, there are 109 families falling into the $35,000 to $49,999 income range, which is the most common income bracket and makes up 21.7% of all families.
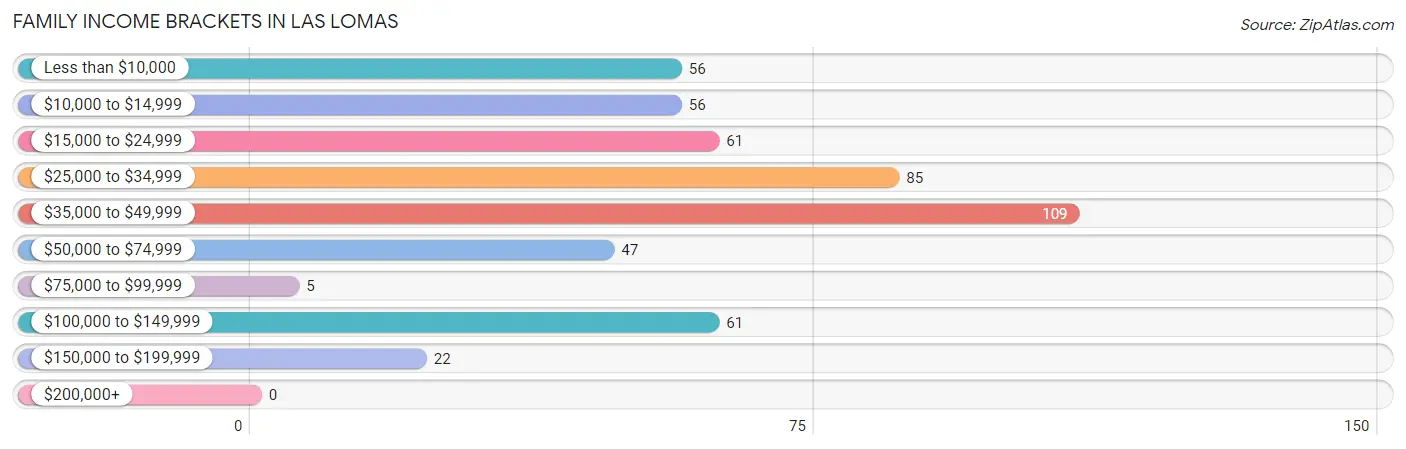
| Income Bracket | # Families | % Families |
| Less than $10,000 | 56 | 11.2% |
| $10,000 to $14,999 | 56 | 11.2% |
| $15,000 to $24,999 | 61 | 12.2% |
| $25,000 to $34,999 | 85 | 16.9% |
| $35,000 to $49,999 | 109 | 21.7% |
| $50,000 to $74,999 | 47 | 9.4% |
| $75,000 to $99,999 | 5 | 1.0% |
| $100,000 to $149,999 | 61 | 12.2% |
| $150,000 to $199,999 | 22 | 4.4% |
| $200,000+ | 0 | 0.0% |
Family Income by Famaliy Size in Las Lomas
5-person families (80 | 15.9%) account for the highest median family income in Las Lomas with $58,646 per family, while 5-person families (80 | 15.9%) have the highest median income of $11,729 per family member.
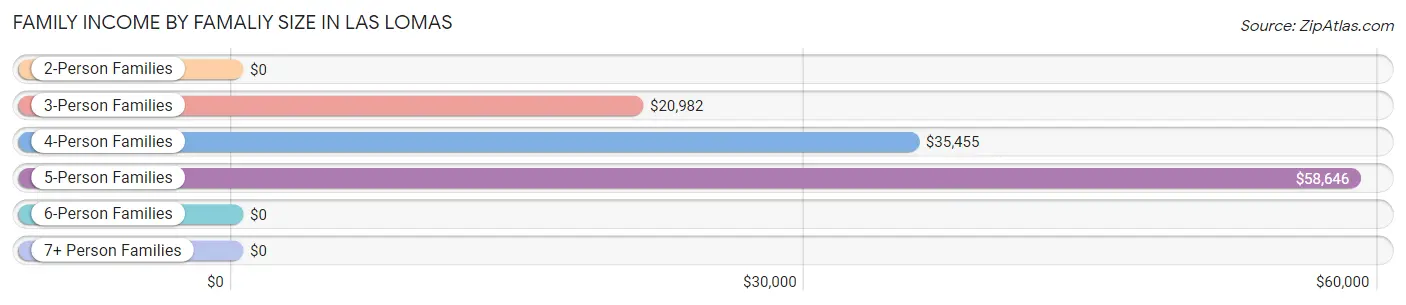
| Income Bracket | # Families | Median Income |
| 2-Person Families | 227 (45.2%) | $0 |
| 3-Person Families | 120 (23.9%) | $20,982 |
| 4-Person Families | 70 (13.9%) | $35,455 |
| 5-Person Families | 80 (15.9%) | $58,646 |
| 6-Person Families | 5 (1.0%) | $0 |
| 7+ Person Families | 0 (0.0%) | $0 |
| Total | 502 (100.0%) | $32,150 |
Family Income by Number of Earners in Las Lomas
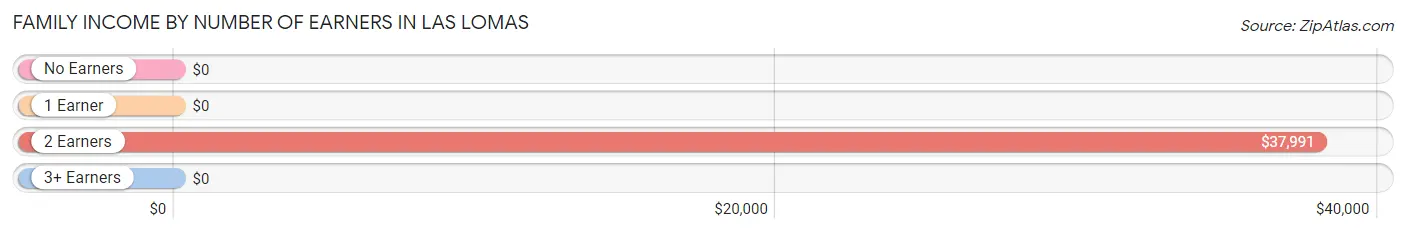
| Number of Earners | # Families | Median Income |
| No Earners | 39 (7.8%) | $0 |
| 1 Earner | 235 (46.8%) | $0 |
| 2 Earners | 191 (38.1%) | $37,991 |
| 3+ Earners | 37 (7.4%) | $0 |
| Total | 502 (100.0%) | $32,150 |
Household Income in Las Lomas
Household Income Brackets in Las Lomas
With 140 households falling in the category, the $10,000 to $14,999 income range is the most frequent in Las Lomas, accounting for 21.0% of all households.
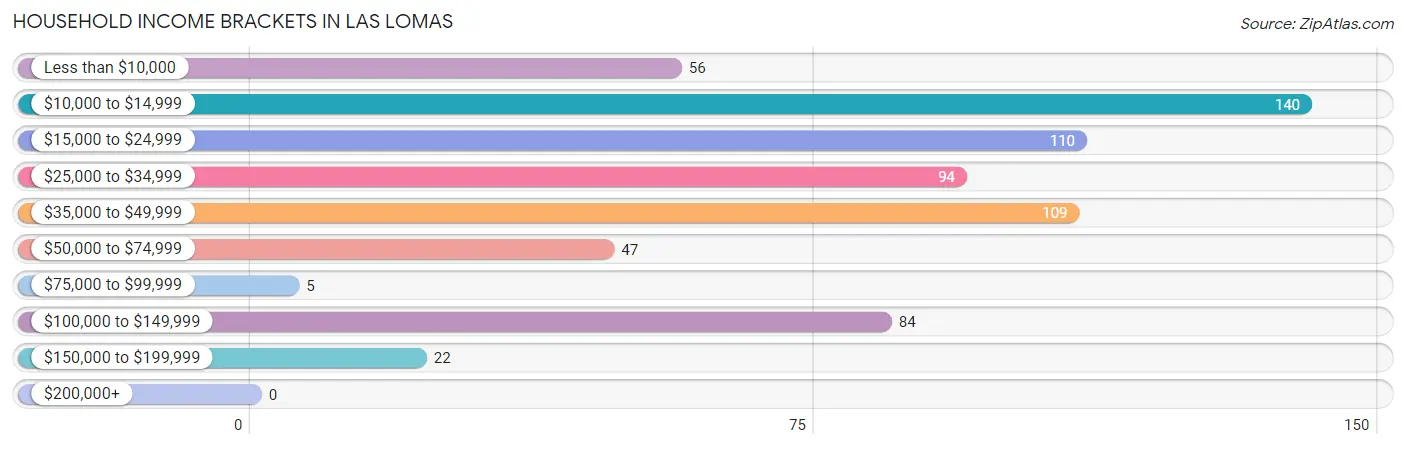
| Income Bracket | # Households | % Households |
| Less than $10,000 | 56 | 8.4% |
| $10,000 to $14,999 | 140 | 21.0% |
| $15,000 to $24,999 | 110 | 16.5% |
| $25,000 to $34,999 | 94 | 14.1% |
| $35,000 to $49,999 | 109 | 16.3% |
| $50,000 to $74,999 | 47 | 7.0% |
| $75,000 to $99,999 | 5 | 0.7% |
| $100,000 to $149,999 | 84 | 12.6% |
| $150,000 to $199,999 | 22 | 3.3% |
| $200,000+ | 0 | 0.0% |
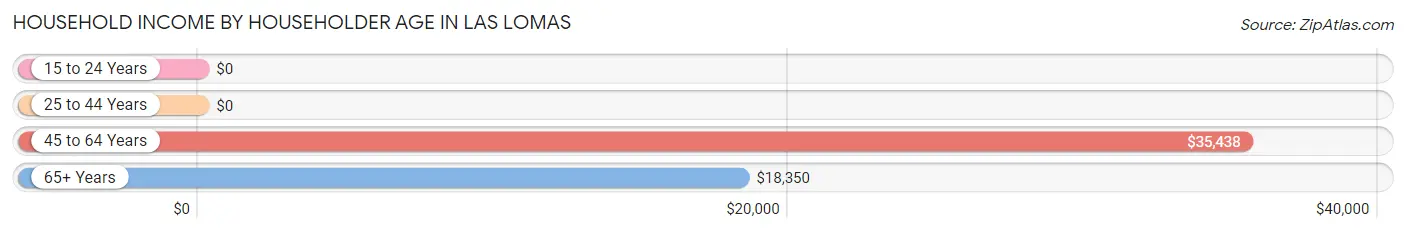
Household Income by Householder Age in Las Lomas
The median household income in Las Lomas is $26,964, with the highest median household income of $35,438 found in the 45 to 64 years age bracket for the primary householder. A total of 400 households (60.0%) fall into this category. Meanwhile, the 15 to 24 years age bracket for the primary householder has the lowest median household income of $0, with 35 households (5.2%) in this group.
| Income Bracket | # Households | Median Income |
| 15 to 24 Years | 35 (5.2%) | $0 |
| 25 to 44 Years | 125 (18.7%) | $0 |
| 45 to 64 Years | 400 (60.0%) | $35,438 |
| 65+ Years | 107 (16.0%) | $18,350 |
| Total | 667 (100.0%) | $26,964 |
Poverty in Las Lomas
Income Below Poverty by Sex and Age in Las Lomas
With 35.1% poverty level for males and 30.5% for females among the residents of Las Lomas, 75 year old and over males and 6 to 11 year old females are the most vulnerable to poverty, with 11 males (100.0%) and 39 females (100.0%) in their respective age groups living below the poverty level.

| Age Bracket | Male | Female |
| Under 5 Years | 0 (0.0%) | 0 (0.0%) |
| 5 Years | 0 (0.0%) | 0 (0.0%) |
| 6 to 11 Years | 43 (51.8%) | 39 (100.0%) |
| 12 to 14 Years | 25 (36.2%) | 40 (50.6%) |
| 15 Years | 0 (0.0%) | 30 (50.8%) |
| 16 and 17 Years | 27 (51.9%) | 0 (0.0%) |
| 18 to 24 Years | 103 (63.6%) | 47 (26.7%) |
| 25 to 34 Years | 93 (56.4%) | 0 (0.0%) |
| 35 to 44 Years | 0 (0.0%) | 53 (37.9%) |
| 45 to 54 Years | 29 (34.1%) | 92 (40.4%) |
| 55 to 64 Years | 0 (0.0%) | 26 (15.1%) |
| 65 to 74 Years | 0 (0.0%) | 10 (17.2%) |
| 75 Years and over | 11 (100.0%) | 35 (58.3%) |
| Total | 331 (35.1%) | 372 (30.5%) |
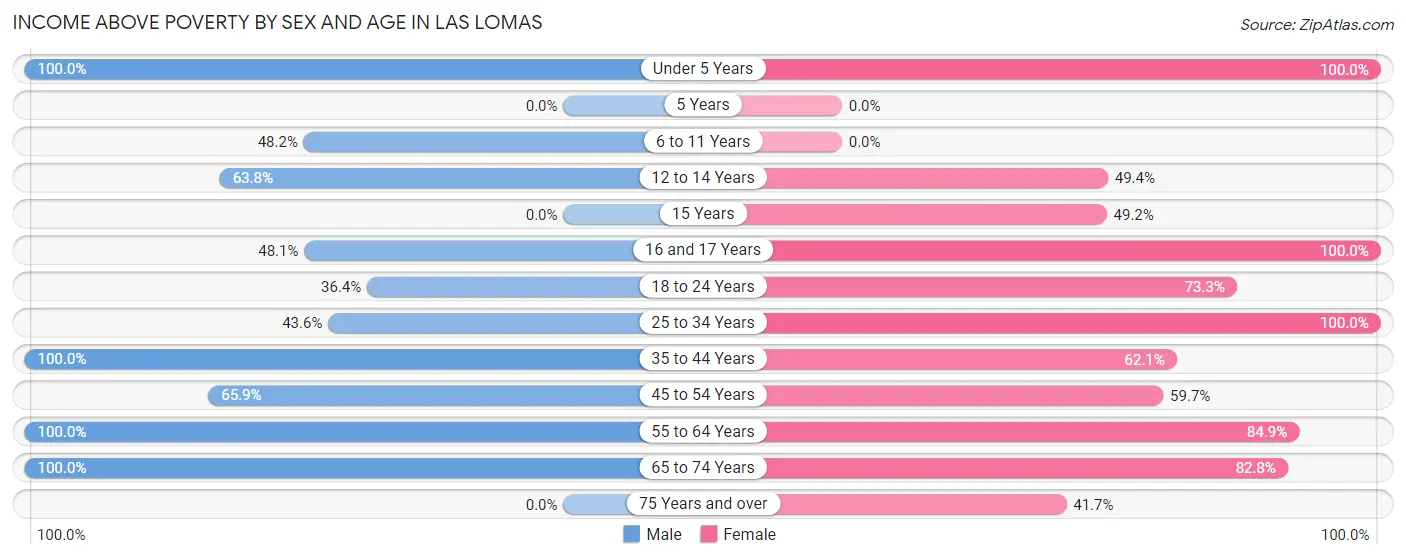
Income Above Poverty by Sex and Age in Las Lomas
According to the poverty statistics in Las Lomas, males aged under 5 years and females aged under 5 years are the age groups that are most secure financially, with 100.0% of males and 100.0% of females in these age groups living above the poverty line.
| Age Bracket | Male | Female |
| Under 5 Years | 71 (100.0%) | 99 (100.0%) |
| 5 Years | 0 (0.0%) | 0 (0.0%) |
| 6 to 11 Years | 40 (48.2%) | 0 (0.0%) |
| 12 to 14 Years | 44 (63.8%) | 39 (49.4%) |
| 15 Years | 0 (0.0%) | 29 (49.1%) |
| 16 and 17 Years | 25 (48.1%) | 28 (100.0%) |
| 18 to 24 Years | 59 (36.4%) | 129 (73.3%) |
| 25 to 34 Years | 72 (43.6%) | 82 (100.0%) |
| 35 to 44 Years | 87 (100.0%) | 87 (62.1%) |
| 45 to 54 Years | 56 (65.9%) | 136 (59.7%) |
| 55 to 64 Years | 131 (100.0%) | 146 (84.9%) |
| 65 to 74 Years | 28 (100.0%) | 48 (82.8%) |
| 75 Years and over | 0 (0.0%) | 25 (41.7%) |
| Total | 613 (64.9%) | 848 (69.5%) |
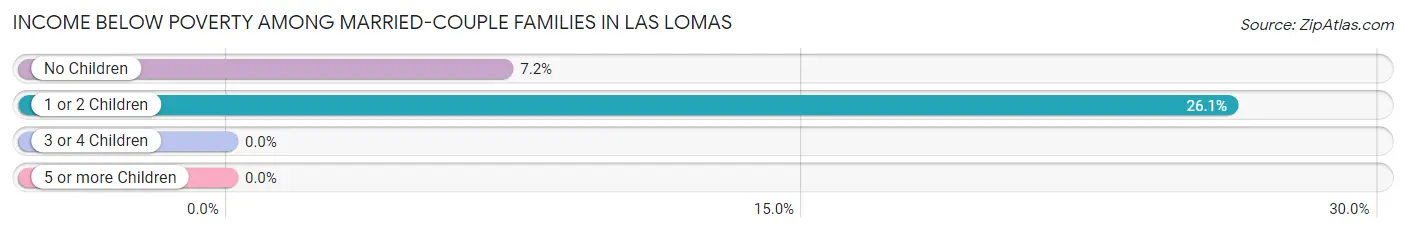
Income Below Poverty Among Married-Couple Families in Las Lomas
The poverty statistics for married-couple families in Las Lomas show that 15.6% or 39 of the total 250 families live below the poverty line. Families with 1 or 2 children have the highest poverty rate of 26.1%, comprising of 29 families. On the other hand, families with no children have the lowest poverty rate of 7.2%, which includes 10 families.
| Children | Above Poverty | Below Poverty |
| No Children | 129 (92.8%) | 10 (7.2%) |
| 1 or 2 Children | 82 (73.9%) | 29 (26.1%) |
| 3 or 4 Children | 0 (0.0%) | 0 (0.0%) |
| 5 or more Children | 0 (0.0%) | 0 (0.0%) |
| Total | 211 (84.4%) | 39 (15.6%) |
Income Below Poverty Among Single-Parent Households in Las Lomas
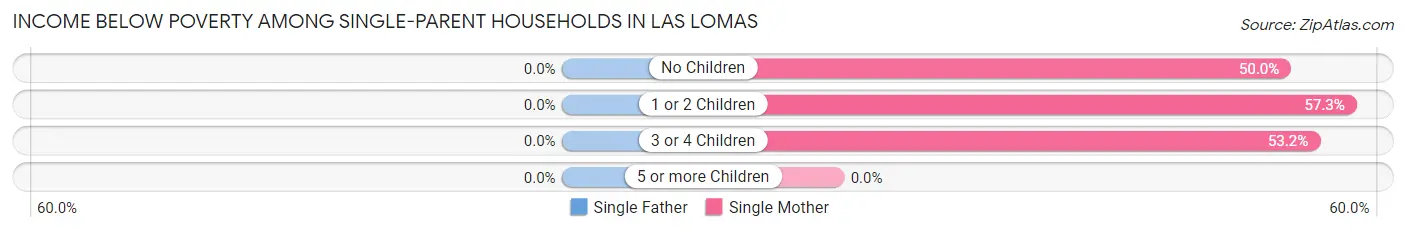
| Children | Single Father | Single Mother |
| No Children | 0 (0.0%) | 54 (50.0%) |
| 1 or 2 Children | 0 (0.0%) | 47 (57.3%) |
| 3 or 4 Children | 0 (0.0%) | 33 (53.2%) |
| 5 or more Children | 0 (0.0%) | 0 (0.0%) |
| Total | 0 (0.0%) | 134 (53.2%) |
Income Below Poverty Among Married-Couple vs Single-Parent Households in Las Lomas
The poverty data for Las Lomas shows that 39 of the married-couple family households (15.6%) and 134 of the single-parent households (53.2%) are living below the poverty level. Within the married-couple family households, those with 1 or 2 children have the highest poverty rate, with 29 households (26.1%) falling below the poverty line. Among the single-parent households, those with 1 or 2 children have the highest poverty rate, with 47 household (57.3%) living below poverty.
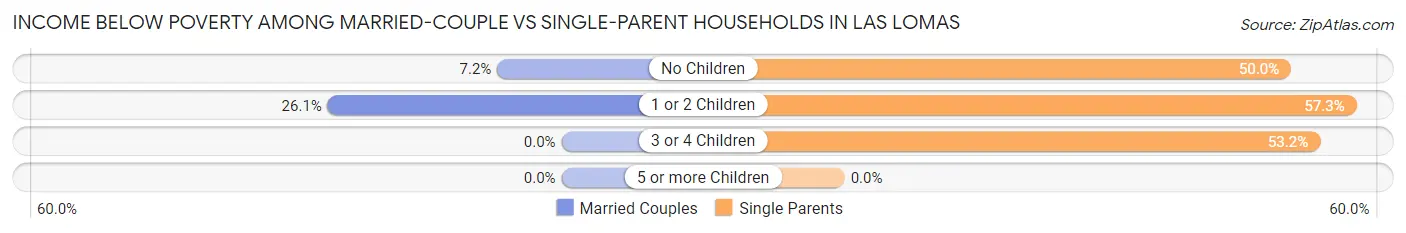
| Children | Married-Couple Families | Single-Parent Households |
| No Children | 10 (7.2%) | 54 (50.0%) |
| 1 or 2 Children | 29 (26.1%) | 47 (57.3%) |
| 3 or 4 Children | 0 (0.0%) | 33 (53.2%) |
| 5 or more Children | 0 (0.0%) | 0 (0.0%) |
| Total | 39 (15.6%) | 134 (53.2%) |
Race in Las Lomas
The most populous races in Las Lomas are Hispanic or Latino (2,164 | 100.0%), White / Caucasian (1,482 | 68.5%), and Two or more Races (557 | 25.7%).
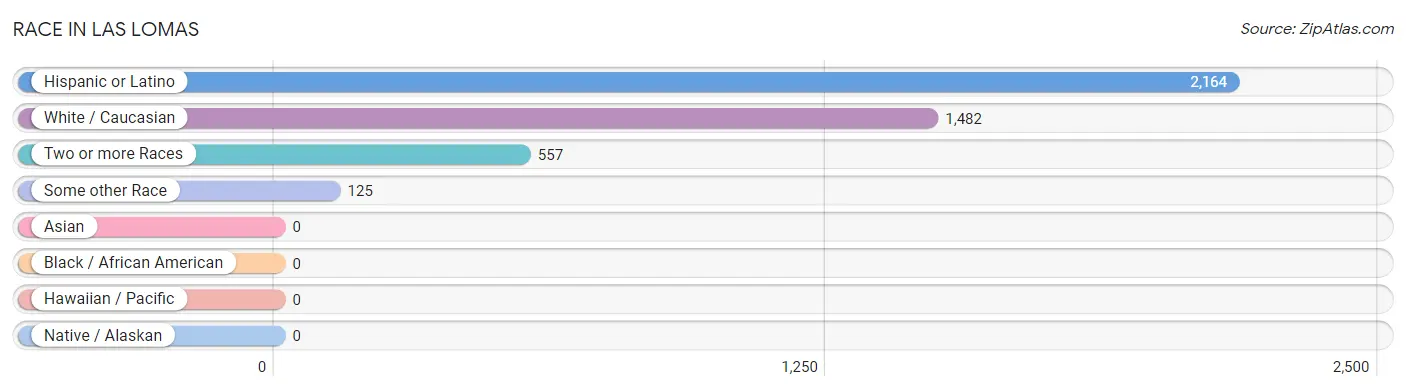
| Race | # Population | % Population |
| Asian | 0 | 0.0% |
| Black / African American | 0 | 0.0% |
| Hawaiian / Pacific | 0 | 0.0% |
| Hispanic or Latino | 2,164 | 100.0% |
| Native / Alaskan | 0 | 0.0% |
| White / Caucasian | 1,482 | 68.5% |
| Two or more Races | 557 | 25.7% |
| Some other Race | 125 | 5.8% |
| Total | 2,164 | 100.0% |
Ancestry in Las Lomas
The most populous ancestries reported in Las Lomas are , and Mexican (2,117 | 97.8%), together accounting for 97.8% of all Las Lomas residents.

| Ancestry | # Population | % Population |
| Mexican | 2,117 | 97.8% | View All 1 Rows |
Immigrants in Las Lomas
The most numerous immigrant groups reported in Las Lomas came from Central America (1,013 | 46.8%), Latin America (1,013 | 46.8%), and Mexico (1,013 | 46.8%), together accounting for 140.4% of all Las Lomas residents.
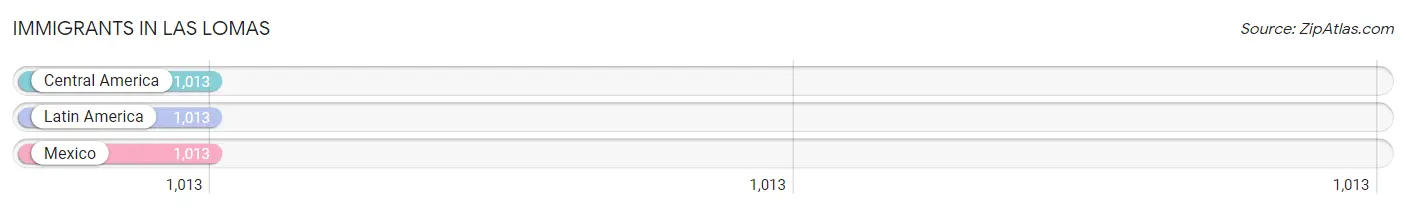
| Immigration Origin | # Population | % Population |
| Central America | 1,013 | 46.8% |
| Latin America | 1,013 | 46.8% |
| Mexico | 1,013 | 46.8% | View All 3 Rows |
Sex and Age in Las Lomas
Sex and Age in Las Lomas
The most populous age groups in Las Lomas are 20 to 24 Years (150 | 15.9%) for men and 45 to 49 Years (142 | 11.6%) for women.
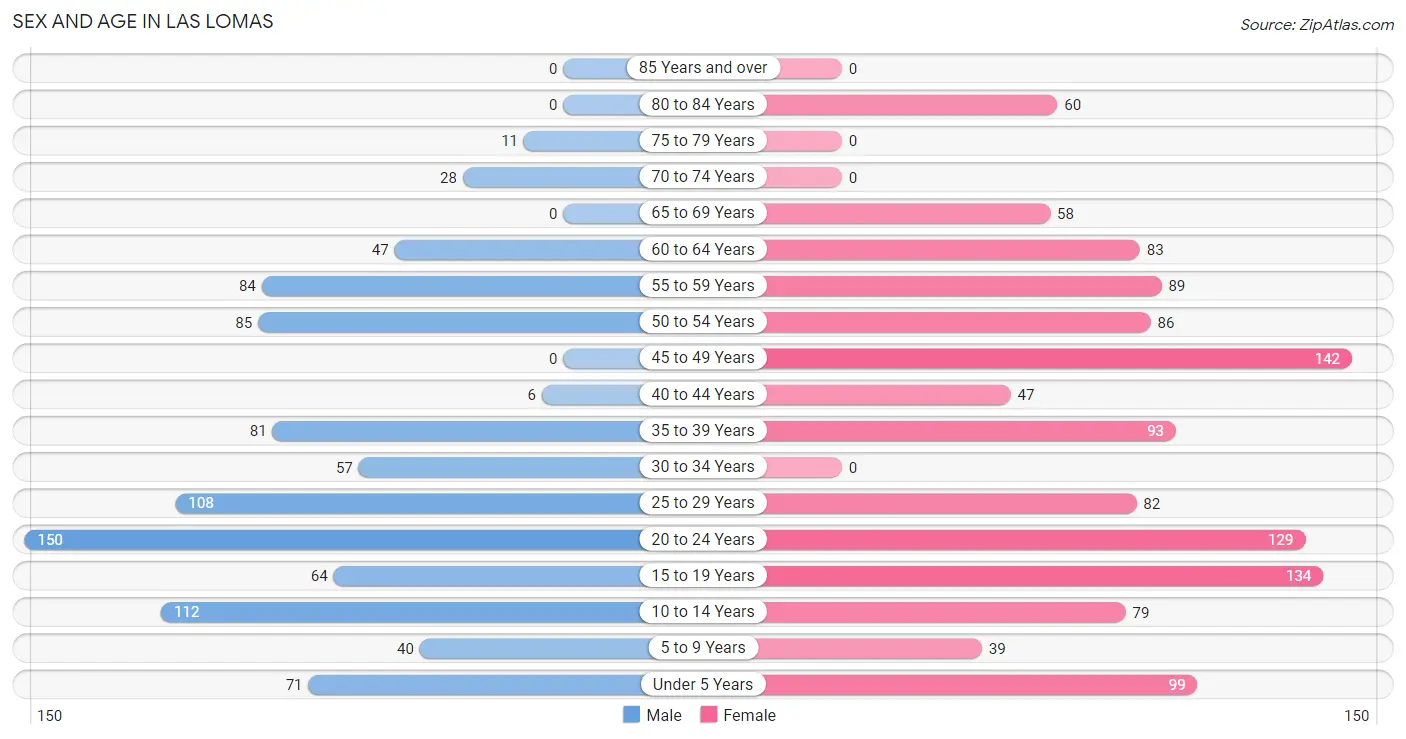
| Age Bracket | Male | Female |
| Under 5 Years | 71 (7.5%) | 99 (8.1%) |
| 5 to 9 Years | 40 (4.2%) | 39 (3.2%) |
| 10 to 14 Years | 112 (11.9%) | 79 (6.5%) |
| 15 to 19 Years | 64 (6.8%) | 134 (11.0%) |
| 20 to 24 Years | 150 (15.9%) | 129 (10.6%) |
| 25 to 29 Years | 108 (11.4%) | 82 (6.7%) |
| 30 to 34 Years | 57 (6.0%) | 0 (0.0%) |
| 35 to 39 Years | 81 (8.6%) | 93 (7.6%) |
| 40 to 44 Years | 6 (0.6%) | 47 (3.8%) |
| 45 to 49 Years | 0 (0.0%) | 142 (11.6%) |
| 50 to 54 Years | 85 (9.0%) | 86 (7.0%) |
| 55 to 59 Years | 84 (8.9%) | 89 (7.3%) |
| 60 to 64 Years | 47 (5.0%) | 83 (6.8%) |
| 65 to 69 Years | 0 (0.0%) | 58 (4.8%) |
| 70 to 74 Years | 28 (3.0%) | 0 (0.0%) |
| 75 to 79 Years | 11 (1.2%) | 0 (0.0%) |
| 80 to 84 Years | 0 (0.0%) | 60 (4.9%) |
| 85 Years and over | 0 (0.0%) | 0 (0.0%) |
| Total | 944 (100.0%) | 1,220 (100.0%) |
Families and Households in Las Lomas
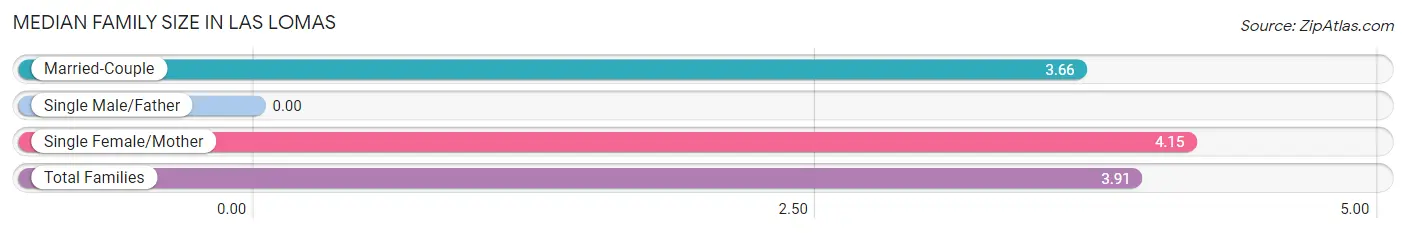
Median Family Size in Las Lomas
| Family Type | # Families | Family Size |
| Married-Couple | 250 (49.8%) | 3.66 |
| Single Male/Father | 0 (0.0%) | - |
| Single Female/Mother | 252 (50.2%) | 4.15 |
| Total Families | 502 (100.0%) | 3.91 |
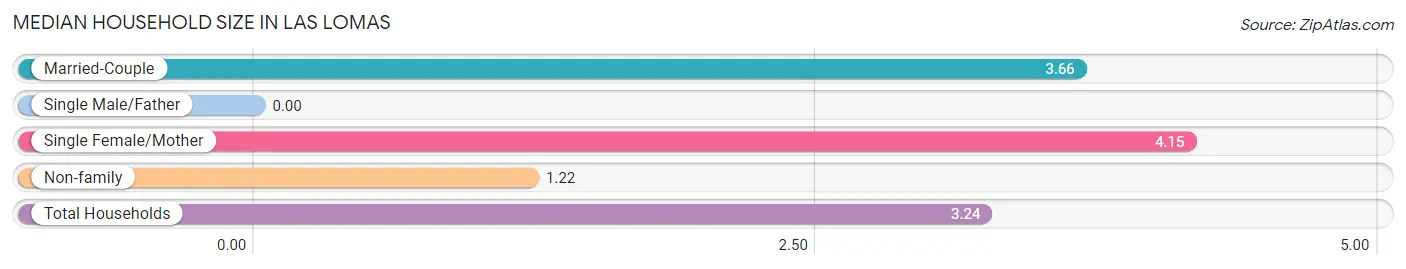
Median Household Size in Las Lomas
| Household Type | # Households | Household Size |
| Married-Couple | 250 (37.5%) | 3.66 |
| Single Male/Father | 0 (0.0%) | - |
| Single Female/Mother | 252 (37.8%) | 4.15 |
| Non-family | 165 (24.7%) | 1.22 |
| Total Households | 667 (100.0%) | 3.24 |
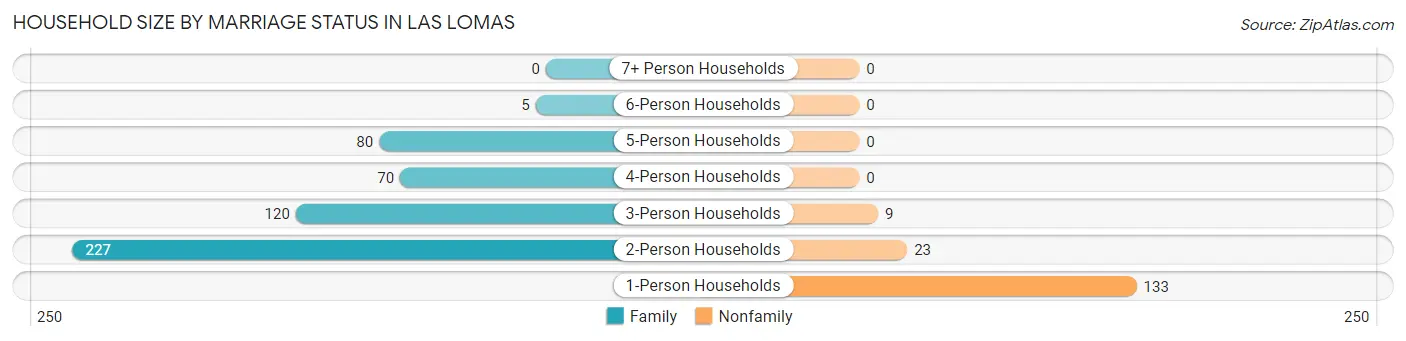
Household Size by Marriage Status in Las Lomas
Out of a total of 667 households in Las Lomas, 502 (75.3%) are family households, while 165 (24.7%) are nonfamily households. The most numerous type of family households are 2-person households, comprising 227, and the most common type of nonfamily households are 1-person households, comprising 133.
| Household Size | Family Households | Nonfamily Households |
| 1-Person Households | - | 133 (19.9%) |
| 2-Person Households | 227 (34.0%) | 23 (3.5%) |
| 3-Person Households | 120 (18.0%) | 9 (1.3%) |
| 4-Person Households | 70 (10.5%) | 0 (0.0%) |
| 5-Person Households | 80 (12.0%) | 0 (0.0%) |
| 6-Person Households | 5 (0.7%) | 0 (0.0%) |
| 7+ Person Households | 0 (0.0%) | 0 (0.0%) |
| Total | 502 (75.3%) | 165 (24.7%) |
Female Fertility in Las Lomas
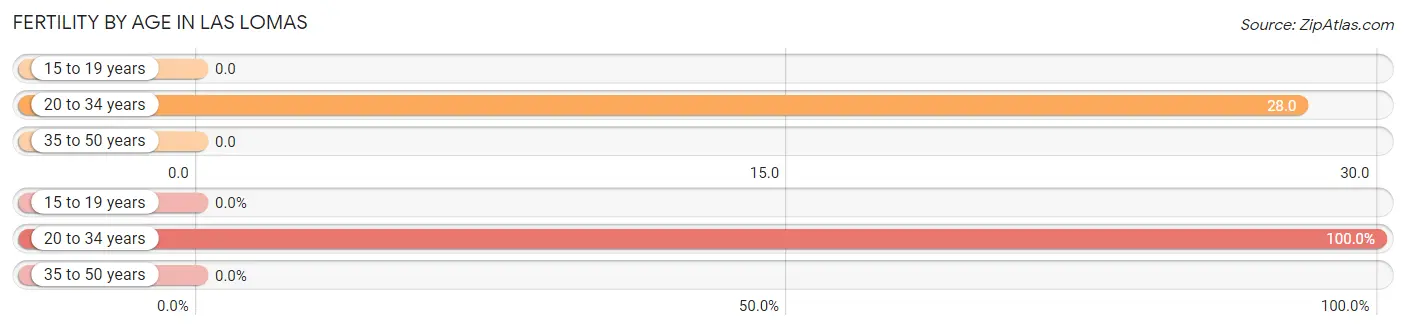
Fertility by Age in Las Lomas
Average fertility rate in Las Lomas is 10.0 births per 1,000 women. Women in the age bracket of 20 to 34 years have the highest fertility rate with 28.0 births per 1,000 women. Women in the age bracket of 20 to 34 years acount for 100.0% of all women with births.
| Age Bracket | Women with Births | Births / 1,000 Women |
| 15 to 19 years | 0 (0.0%) | 0.0 |
| 20 to 34 years | 6 (100.0%) | 28.0 |
| 35 to 50 years | 0 (0.0%) | 0.0 |
| Total | 6 (100.0%) | 10.0 |
Fertility by Age by Marriage Status in Las Lomas
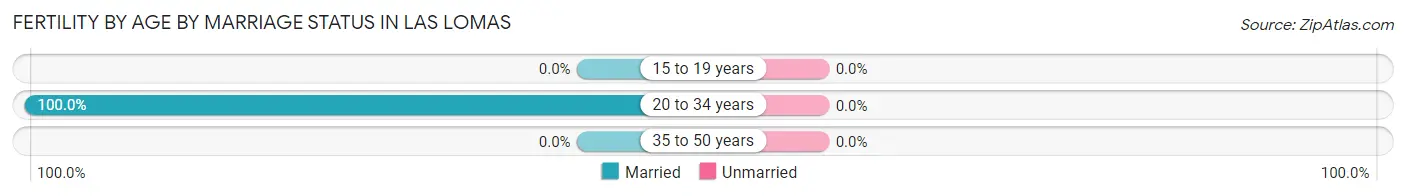
| Age Bracket | Married | Unmarried |
| 15 to 19 years | 0 (0.0%) | 0 (0.0%) |
| 20 to 34 years | 6 (100.0%) | 0 (0.0%) |
| 35 to 50 years | 0 (0.0%) | 0 (0.0%) |
| Total | 6 (100.0%) | 0 (0.0%) |
Fertility by Education in Las Lomas
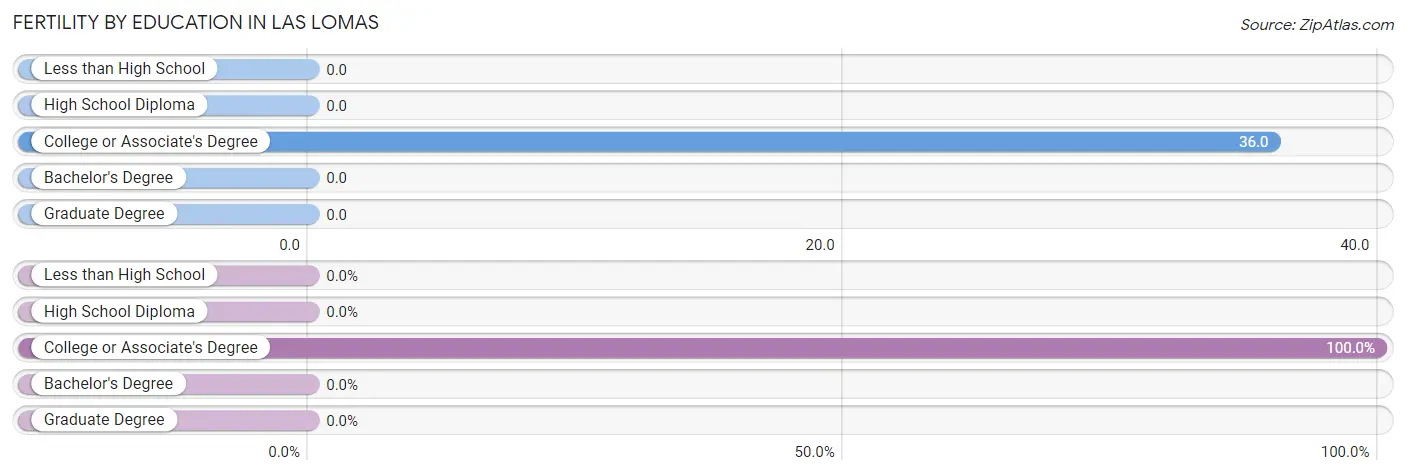
| Educational Attainment | Women with Births | Births / 1,000 Women |
| Less than High School | 0 (0.0%) | 0.0 |
| High School Diploma | 0 (0.0%) | 0.0 |
| College or Associate's Degree | 6 (100.0%) | 36.0 |
| Bachelor's Degree | 0 (0.0%) | 0.0 |
| Graduate Degree | 0 (0.0%) | 0.0 |
| Total | 6 (100.0%) | 10.0 |
Fertility by Education by Marriage Status in Las Lomas
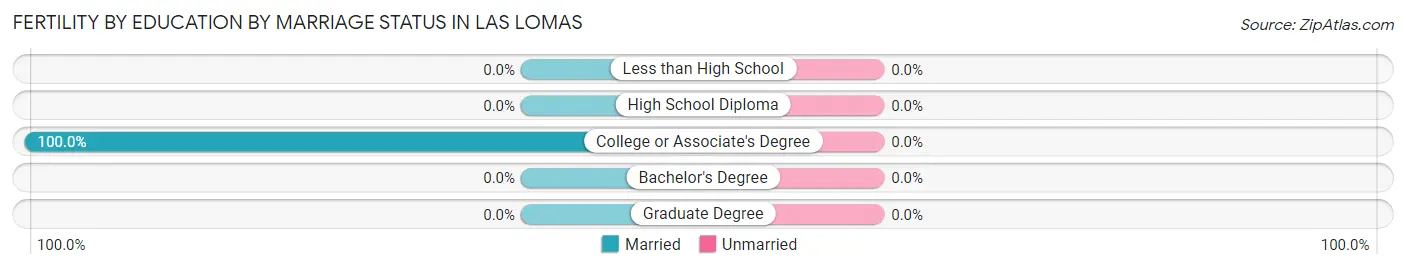
| Educational Attainment | Married | Unmarried |
| Less than High School | 0 (0.0%) | 0 (0.0%) |
| High School Diploma | 0 (0.0%) | 0 (0.0%) |
| College or Associate's Degree | 6 (100.0%) | 0 (0.0%) |
| Bachelor's Degree | 0 (0.0%) | 0 (0.0%) |
| Graduate Degree | 0 (0.0%) | 0 (0.0%) |
| Total | 6 (100.0%) | 0 (0.0%) |
Employment Characteristics in Las Lomas
Employment by Class of Employer in Las Lomas
Among the 782 employed individuals in Las Lomas, private company employees (629 | 80.4%), self-employed (not incorporated) (83 | 10.6%), and state government employees (70 | 8.9%) make up the most common classes of employment.
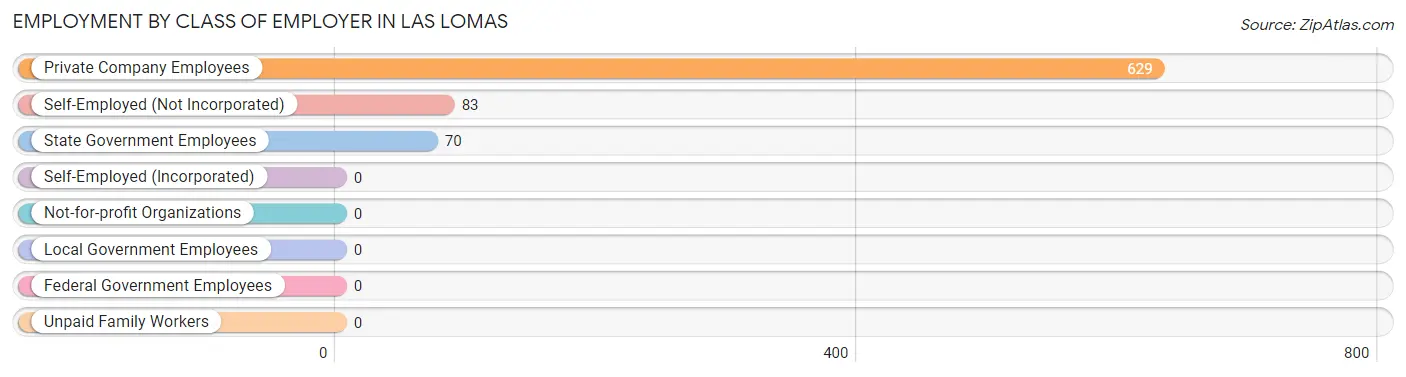
| Employer Class | # Employees | % Employees |
| Private Company Employees | 629 | 80.4% |
| Self-Employed (Incorporated) | 0 | 0.0% |
| Self-Employed (Not Incorporated) | 83 | 10.6% |
| Not-for-profit Organizations | 0 | 0.0% |
| Local Government Employees | 0 | 0.0% |
| State Government Employees | 70 | 8.9% |
| Federal Government Employees | 0 | 0.0% |
| Unpaid Family Workers | 0 | 0.0% |
| Total | 782 | 100.0% |
Employment Status by Age in Las Lomas
According to the labor force statistics for Las Lomas, out of the total population over 16 years of age (1,665), 61.2% or 1,019 individuals are in the labor force, with 20.0% or 204 of them unemployed. The age group with the highest labor force participation rate is 35 to 44 years, with 100.0% or 227 individuals in the labor force. Within the labor force, the 25 to 29 years age range has the highest percentage of unemployed individuals, with 64.6% or 93 of them being unemployed.
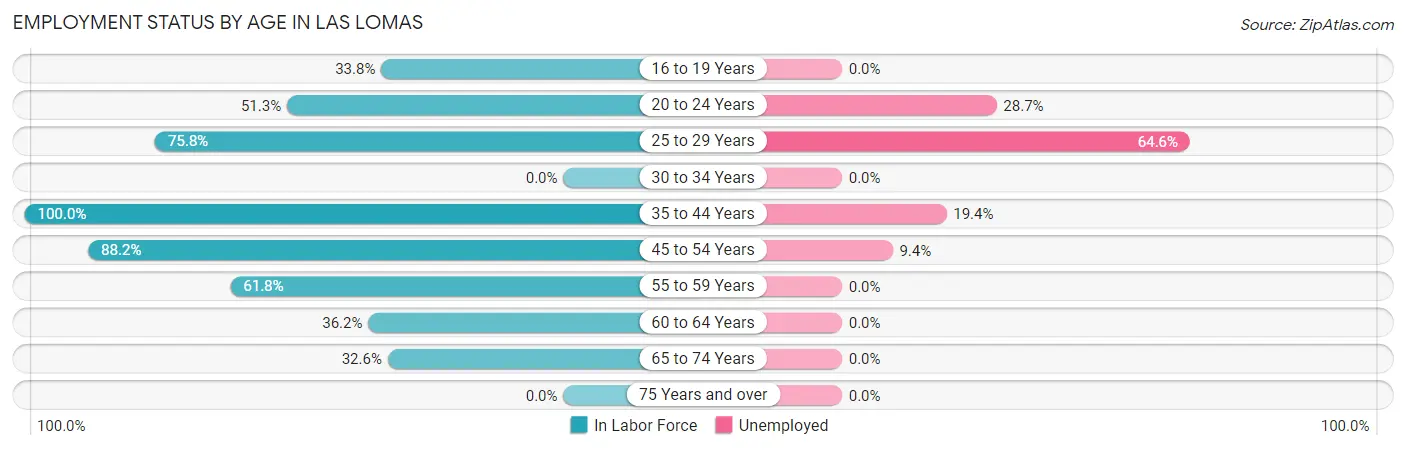
| Age Bracket | In Labor Force | Unemployed |
| 16 to 19 Years | 47 (33.8%) | 0 (0.0%) |
| 20 to 24 Years | 143 (51.3%) | 41 (28.7%) |
| 25 to 29 Years | 144 (75.8%) | 93 (64.6%) |
| 30 to 34 Years | 0 (0.0%) | 0 (0.0%) |
| 35 to 44 Years | 227 (100.0%) | 44 (19.4%) |
| 45 to 54 Years | 276 (88.2%) | 26 (9.4%) |
| 55 to 59 Years | 107 (61.8%) | 0 (0.0%) |
| 60 to 64 Years | 47 (36.2%) | 0 (0.0%) |
| 65 to 74 Years | 28 (32.6%) | 0 (0.0%) |
| 75 Years and over | 0 (0.0%) | 0 (0.0%) |
| Total | 1,019 (61.2%) | 204 (20.0%) |
Employment Status by Educational Attainment in Las Lomas
According to labor force statistics for Las Lomas, 73.5% of individuals (801) out of the total population between 25 and 64 years of age (1,090) are in the labor force, with 20.3% or 163 of them being unemployed. The group with the highest labor force participation rate are those with the educational attainment of bachelor's degree or higher, with 100.0% or 38 individuals in the labor force. Within the labor force, individuals with college / associate degree education have the highest percentage of unemployment, with 67.7% or 88 of them being unemployed.
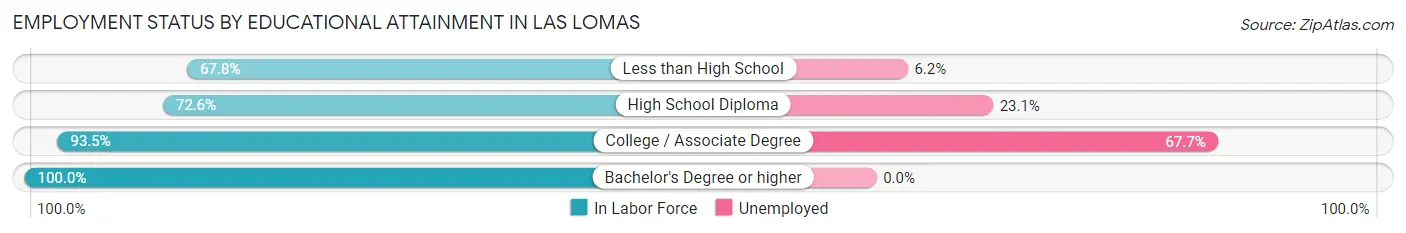
| Educational Attainment | In Labor Force | Unemployed |
| Less than High School | 421 (67.8%) | 39 (6.2%) |
| High School Diploma | 212 (72.6%) | 67 (23.1%) |
| College / Associate Degree | 130 (93.5%) | 94 (67.7%) |
| Bachelor's Degree or higher | 38 (100.0%) | 0 (0.0%) |
| Total | 801 (73.5%) | 221 (20.3%) |
Employment Occupations by Sex in Las Lomas
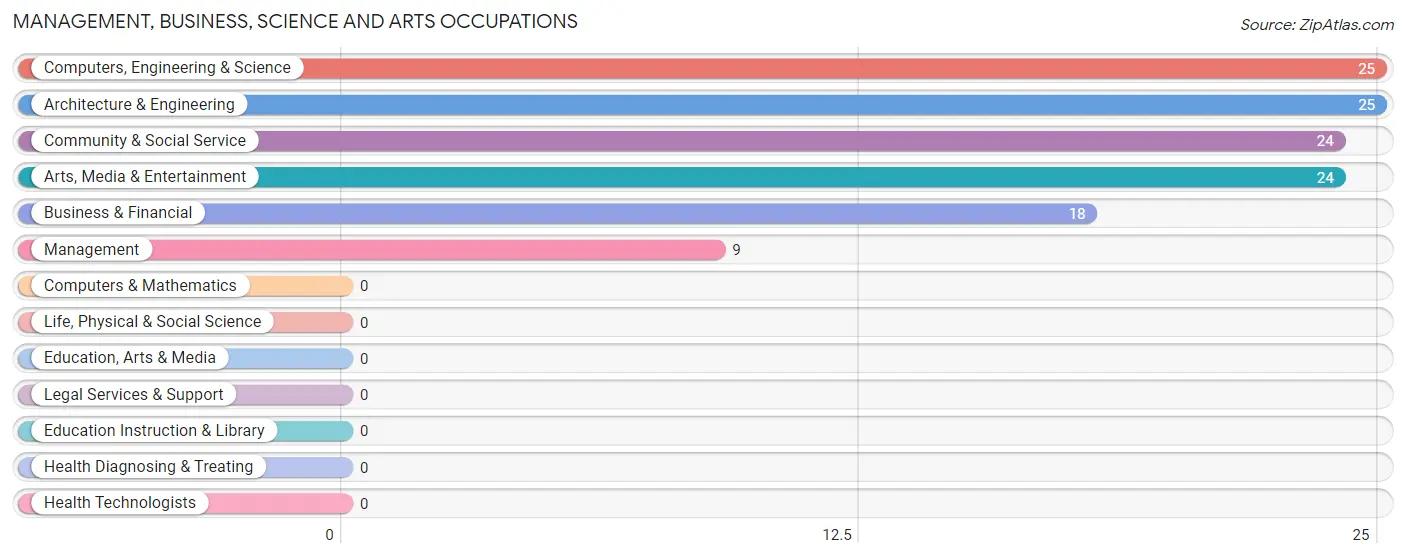
Management, Business, Science and Arts Occupations
The most common Management, Business, Science and Arts occupations in Las Lomas are Computers, Engineering & Science (25 | 3.1%), Architecture & Engineering (25 | 3.1%), Community & Social Service (24 | 2.9%), Arts, Media & Entertainment (24 | 2.9%), and Business & Financial (18 | 2.2%).
Management, Business, Science and Arts Occupations by Sex
Within the Management, Business, Science and Arts occupations in Las Lomas, the most male-oriented occupations are Management (100.0%), Computers, Engineering & Science (100.0%), and Architecture & Engineering (100.0%), while the most female-oriented occupations are Business & Financial (100.0%), Community & Social Service (100.0%), and Arts, Media & Entertainment (100.0%).
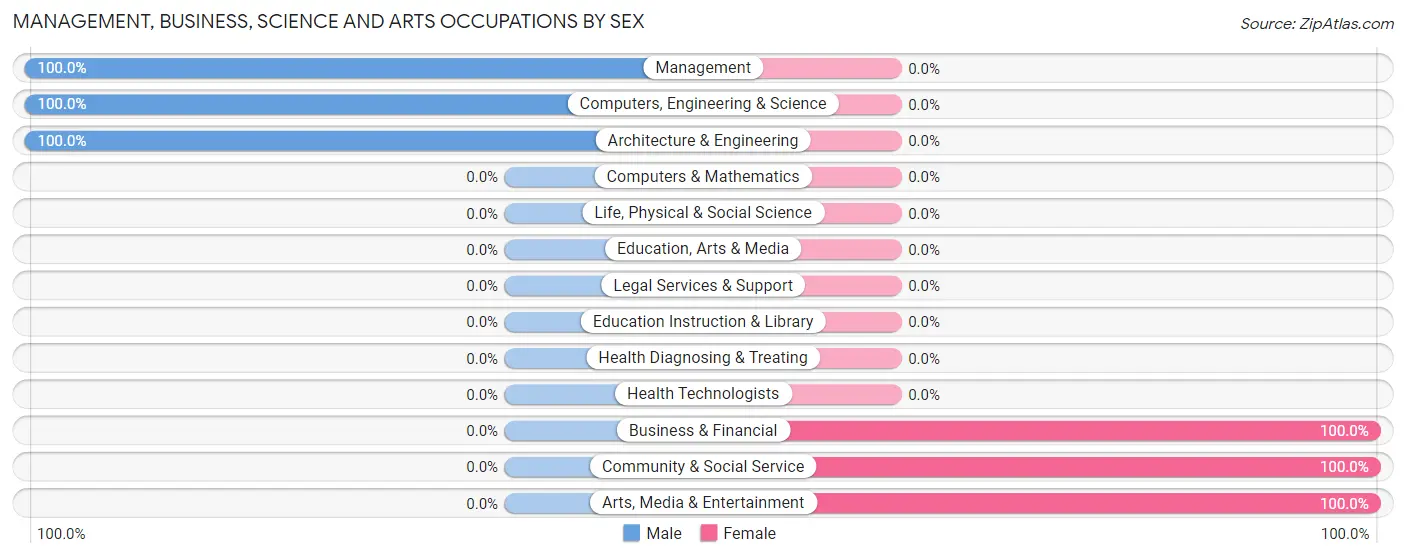
| Occupation | Male | Female |
| Management | 9 (100.0%) | 0 (0.0%) |
| Business & Financial | 0 (0.0%) | 18 (100.0%) |
| Computers, Engineering & Science | 25 (100.0%) | 0 (0.0%) |
| Computers & Mathematics | 0 (0.0%) | 0 (0.0%) |
| Architecture & Engineering | 25 (100.0%) | 0 (0.0%) |
| Life, Physical & Social Science | 0 (0.0%) | 0 (0.0%) |
| Community & Social Service | 0 (0.0%) | 24 (100.0%) |
| Education, Arts & Media | 0 (0.0%) | 0 (0.0%) |
| Legal Services & Support | 0 (0.0%) | 0 (0.0%) |
| Education Instruction & Library | 0 (0.0%) | 0 (0.0%) |
| Arts, Media & Entertainment | 0 (0.0%) | 24 (100.0%) |
| Health Diagnosing & Treating | 0 (0.0%) | 0 (0.0%) |
| Health Technologists | 0 (0.0%) | 0 (0.0%) |
| Total (Category) | 34 (44.7%) | 42 (55.3%) |
| Total (Overall) | 367 (45.0%) | 448 (55.0%) |
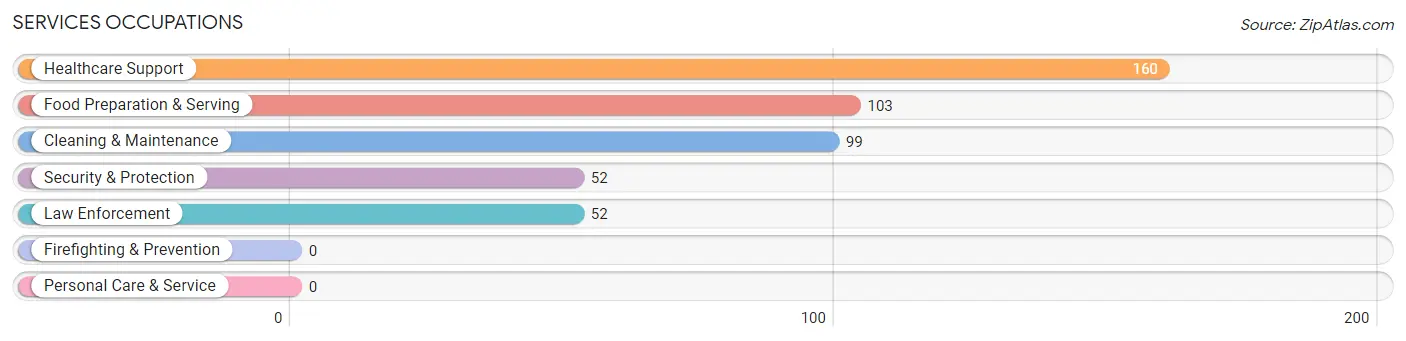
Services Occupations
The most common Services occupations in Las Lomas are Healthcare Support (160 | 19.6%), Food Preparation & Serving (103 | 12.6%), Cleaning & Maintenance (99 | 12.1%), Security & Protection (52 | 6.4%), and Law Enforcement (52 | 6.4%).
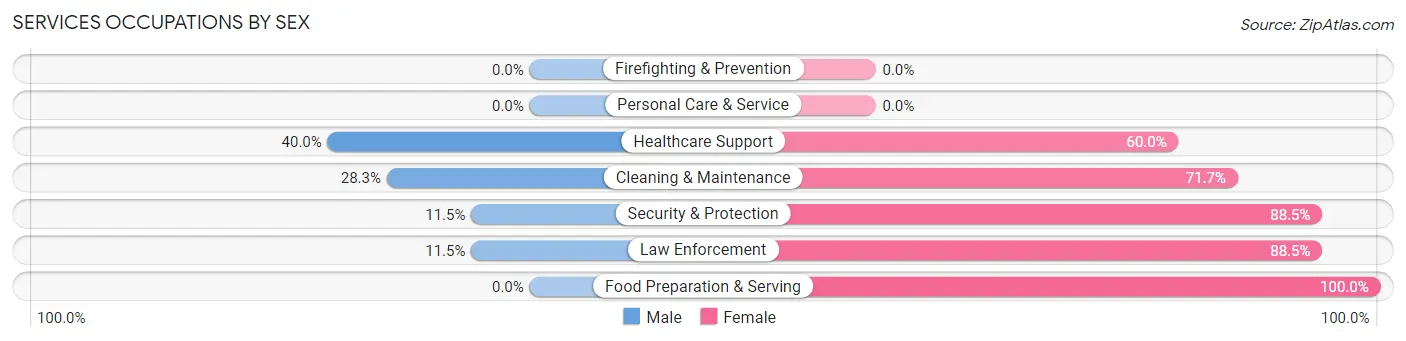
Services Occupations by Sex
Within the Services occupations in Las Lomas, the most male-oriented occupations are Healthcare Support (40.0%), Cleaning & Maintenance (28.3%), and Security & Protection (11.5%), while the most female-oriented occupations are Food Preparation & Serving (100.0%), Security & Protection (88.5%), and Law Enforcement (88.5%).
| Occupation | Male | Female |
| Healthcare Support | 64 (40.0%) | 96 (60.0%) |
| Security & Protection | 6 (11.5%) | 46 (88.5%) |
| Firefighting & Prevention | 0 (0.0%) | 0 (0.0%) |
| Law Enforcement | 6 (11.5%) | 46 (88.5%) |
| Food Preparation & Serving | 0 (0.0%) | 103 (100.0%) |
| Cleaning & Maintenance | 28 (28.3%) | 71 (71.7%) |
| Personal Care & Service | 0 (0.0%) | 0 (0.0%) |
| Total (Category) | 98 (23.7%) | 316 (76.3%) |
| Total (Overall) | 367 (45.0%) | 448 (55.0%) |
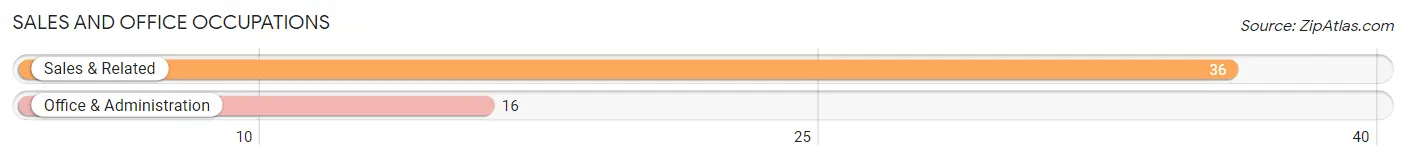
Sales and Office Occupations
The most common Sales and Office occupations in Las Lomas are Sales & Related (36 | 4.4%), and Office & Administration (16 | 2.0%).
Sales and Office Occupations by Sex
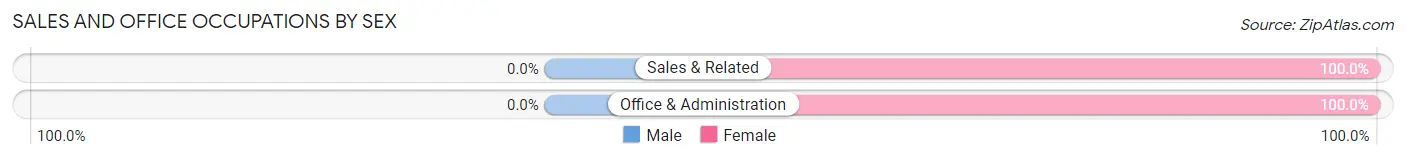
| Occupation | Male | Female |
| Sales & Related | 0 (0.0%) | 36 (100.0%) |
| Office & Administration | 0 (0.0%) | 16 (100.0%) |
| Total (Category) | 0 (0.0%) | 52 (100.0%) |
| Total (Overall) | 367 (45.0%) | 448 (55.0%) |
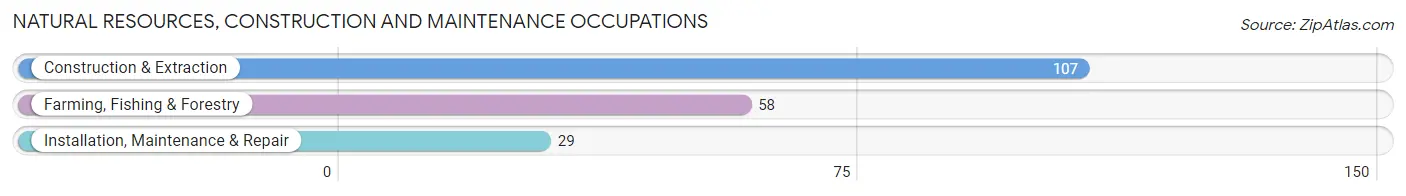
Natural Resources, Construction and Maintenance Occupations
The most common Natural Resources, Construction and Maintenance occupations in Las Lomas are Construction & Extraction (107 | 13.1%), Farming, Fishing & Forestry (58 | 7.1%), and Installation, Maintenance & Repair (29 | 3.6%).
Natural Resources, Construction and Maintenance Occupations by Sex
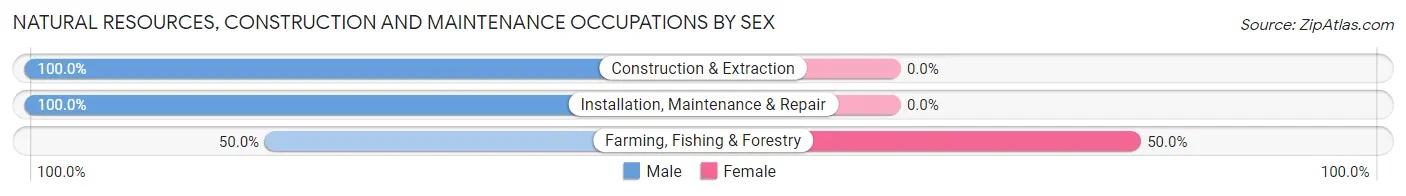
| Occupation | Male | Female |
| Farming, Fishing & Forestry | 29 (50.0%) | 29 (50.0%) |
| Construction & Extraction | 107 (100.0%) | 0 (0.0%) |
| Installation, Maintenance & Repair | 29 (100.0%) | 0 (0.0%) |
| Total (Category) | 165 (85.1%) | 29 (14.9%) |
| Total (Overall) | 367 (45.0%) | 448 (55.0%) |
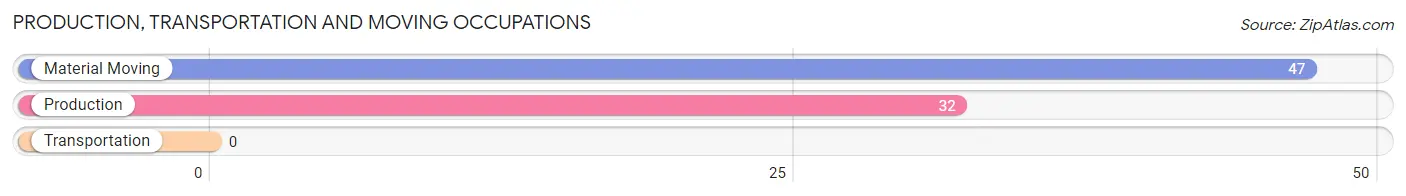
Production, Transportation and Moving Occupations
The most common Production, Transportation and Moving occupations in Las Lomas are Material Moving (47 | 5.8%), and Production (32 | 3.9%).
Production, Transportation and Moving Occupations by Sex
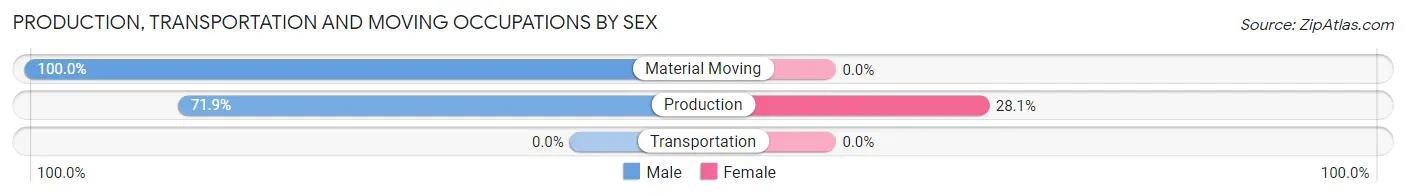
| Occupation | Male | Female |
| Production | 23 (71.9%) | 9 (28.1%) |
| Transportation | 0 (0.0%) | 0 (0.0%) |
| Material Moving | 47 (100.0%) | 0 (0.0%) |
| Total (Category) | 70 (88.6%) | 9 (11.4%) |
| Total (Overall) | 367 (45.0%) | 448 (55.0%) |
Employment Industries by Sex in Las Lomas
Employment Industries in Las Lomas
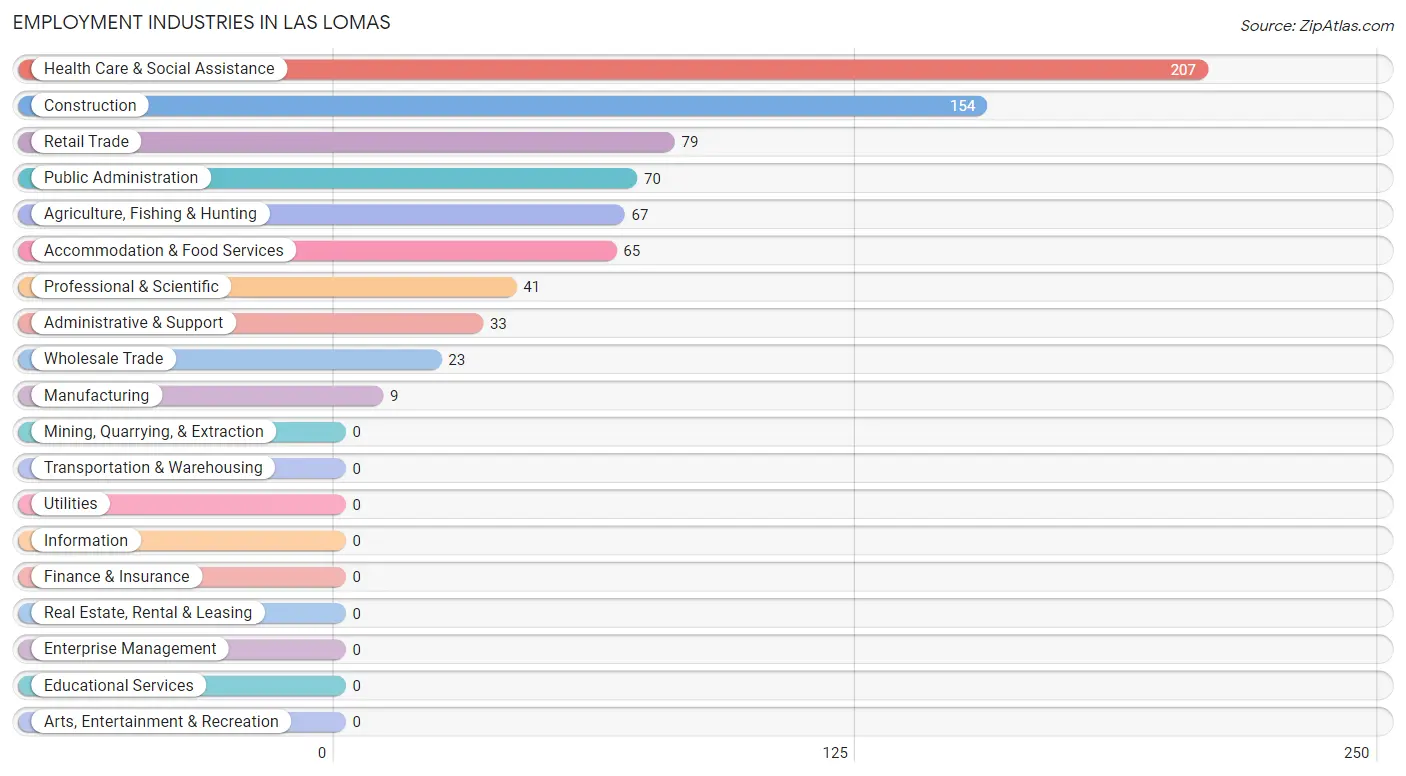
The major employment industries in Las Lomas include Health Care & Social Assistance (207 | 25.4%), Construction (154 | 18.9%), Retail Trade (79 | 9.7%), Public Administration (70 | 8.6%), and Agriculture, Fishing & Hunting (67 | 8.2%).
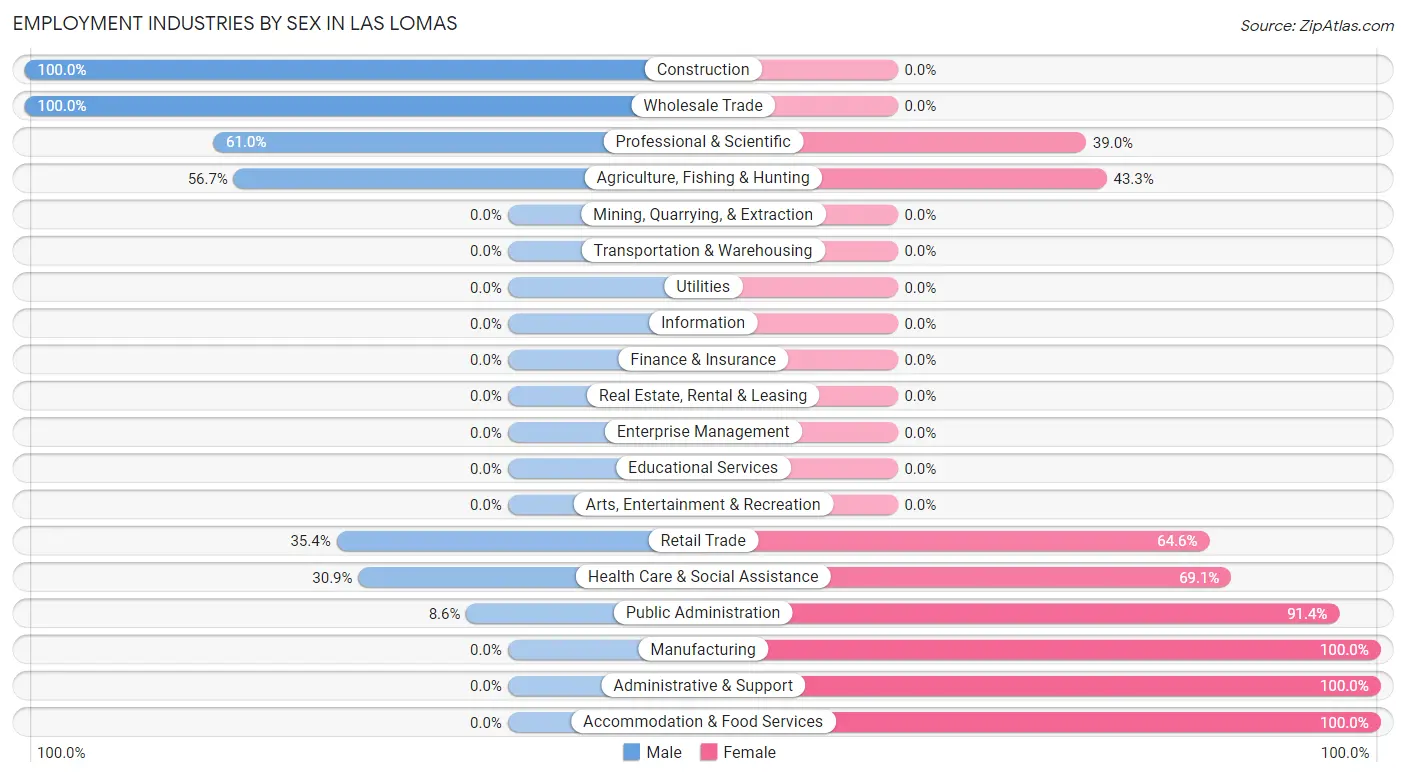
Employment Industries by Sex in Las Lomas
The Las Lomas industries that see more men than women are Construction (100.0%), Wholesale Trade (100.0%), and Professional & Scientific (61.0%), whereas the industries that tend to have a higher number of women are Manufacturing (100.0%), Administrative & Support (100.0%), and Accommodation & Food Services (100.0%).
| Industry | Male | Female |
| Agriculture, Fishing & Hunting | 38 (56.7%) | 29 (43.3%) |
| Mining, Quarrying, & Extraction | 0 (0.0%) | 0 (0.0%) |
| Construction | 154 (100.0%) | 0 (0.0%) |
| Manufacturing | 0 (0.0%) | 9 (100.0%) |
| Wholesale Trade | 23 (100.0%) | 0 (0.0%) |
| Retail Trade | 28 (35.4%) | 51 (64.6%) |
| Transportation & Warehousing | 0 (0.0%) | 0 (0.0%) |
| Utilities | 0 (0.0%) | 0 (0.0%) |
| Information | 0 (0.0%) | 0 (0.0%) |
| Finance & Insurance | 0 (0.0%) | 0 (0.0%) |
| Real Estate, Rental & Leasing | 0 (0.0%) | 0 (0.0%) |
| Professional & Scientific | 25 (61.0%) | 16 (39.0%) |
| Enterprise Management | 0 (0.0%) | 0 (0.0%) |
| Administrative & Support | 0 (0.0%) | 33 (100.0%) |
| Educational Services | 0 (0.0%) | 0 (0.0%) |
| Health Care & Social Assistance | 64 (30.9%) | 143 (69.1%) |
| Arts, Entertainment & Recreation | 0 (0.0%) | 0 (0.0%) |
| Accommodation & Food Services | 0 (0.0%) | 65 (100.0%) |
| Public Administration | 6 (8.6%) | 64 (91.4%) |
| Total | 367 (45.0%) | 448 (55.0%) |
Education in Las Lomas
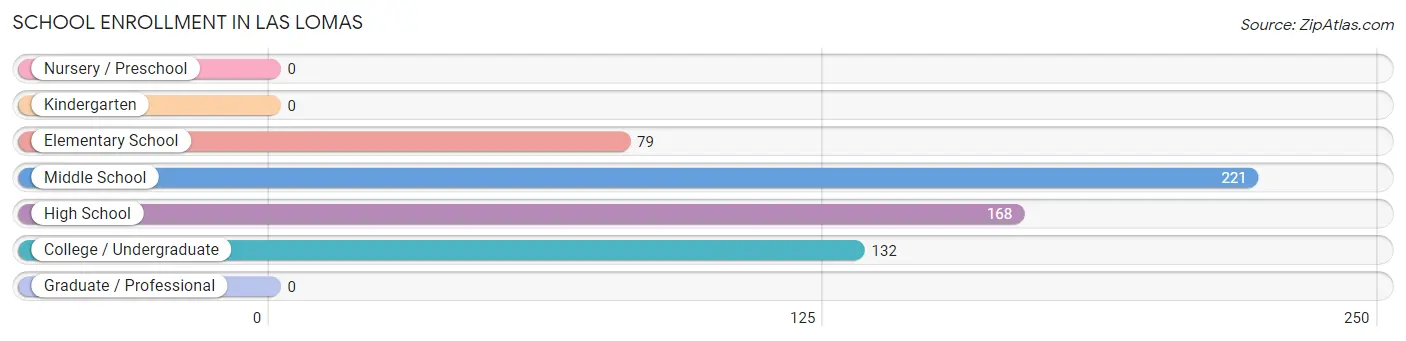
School Enrollment in Las Lomas
The most common levels of schooling among the 600 students in Las Lomas are middle school (221 | 36.8%), high school (168 | 28.0%), and college / undergraduate (132 | 22.0%).
| School Level | # Students | % Students |
| Nursery / Preschool | 0 | 0.0% |
| Kindergarten | 0 | 0.0% |
| Elementary School | 79 | 13.2% |
| Middle School | 221 | 36.8% |
| High School | 168 | 28.0% |
| College / Undergraduate | 132 | 22.0% |
| Graduate / Professional | 0 | 0.0% |
| Total | 600 | 100.0% |
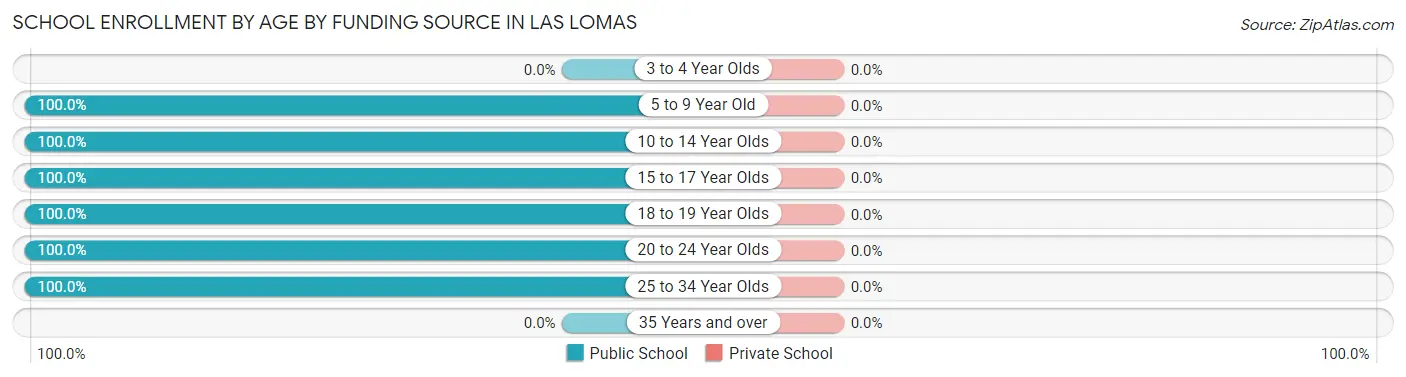
School Enrollment by Age by Funding Source in Las Lomas
| Age Bracket | Public School | Private School |
| 3 to 4 Year Olds | 0 (0.0%) | 0 (0.0%) |
| 5 to 9 Year Old | 79 (100.0%) | 0 (0.0%) |
| 10 to 14 Year Olds | 191 (100.0%) | 0 (0.0%) |
| 15 to 17 Year Olds | 139 (100.0%) | 0 (0.0%) |
| 18 to 19 Year Olds | 59 (100.0%) | 0 (0.0%) |
| 20 to 24 Year Olds | 114 (100.0%) | 0 (0.0%) |
| 25 to 34 Year Olds | 18 (100.0%) | 0 (0.0%) |
| 35 Years and over | 0 (0.0%) | 0 (0.0%) |
| Total | 600 (100.0%) | 0 (0.0%) |
Educational Attainment by Field of Study in Las Lomas
Education (27 | 71.1%), and psychology (11 | 28.9%) are the most common fields of study among 38 individuals in Las Lomas who have obtained a bachelor's degree or higher.
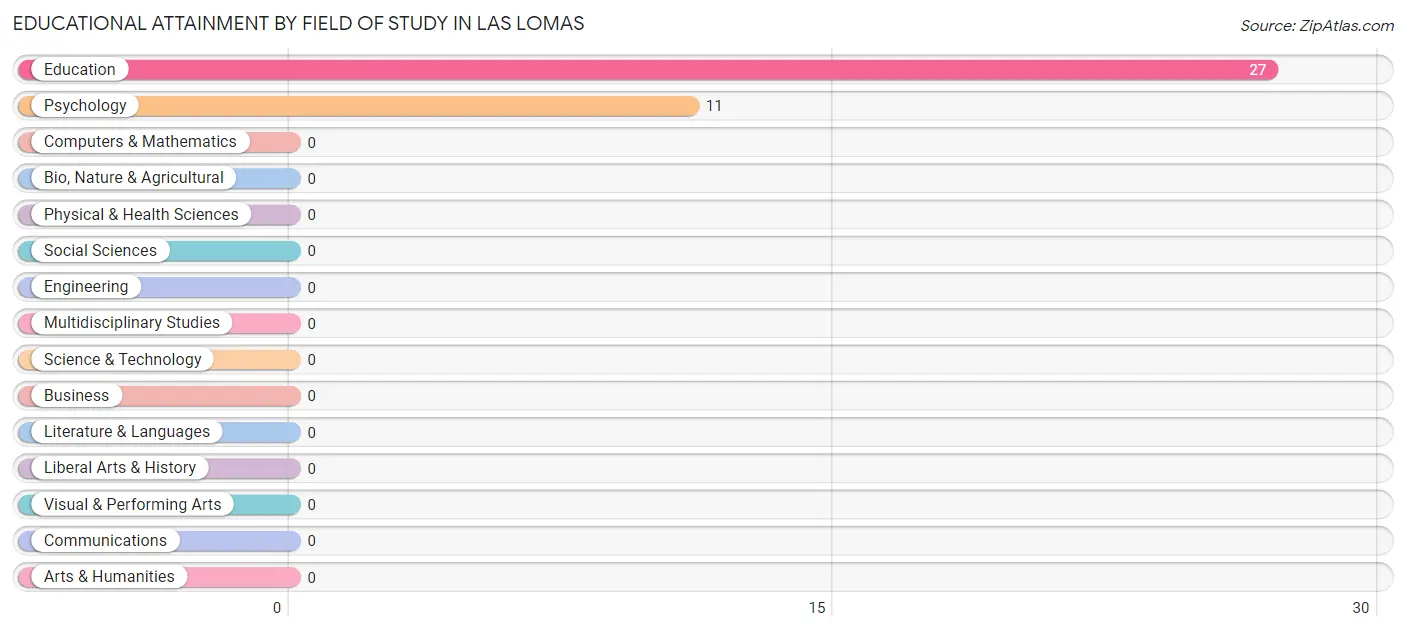
| Field of Study | # Graduates | % Graduates |
| Computers & Mathematics | 0 | 0.0% |
| Bio, Nature & Agricultural | 0 | 0.0% |
| Physical & Health Sciences | 0 | 0.0% |
| Psychology | 11 | 28.9% |
| Social Sciences | 0 | 0.0% |
| Engineering | 0 | 0.0% |
| Multidisciplinary Studies | 0 | 0.0% |
| Science & Technology | 0 | 0.0% |
| Business | 0 | 0.0% |
| Education | 27 | 71.1% |
| Literature & Languages | 0 | 0.0% |
| Liberal Arts & History | 0 | 0.0% |
| Visual & Performing Arts | 0 | 0.0% |
| Communications | 0 | 0.0% |
| Arts & Humanities | 0 | 0.0% |
| Total | 38 | 100.0% |
Transportation & Commute in Las Lomas
Vehicle Availability by Sex in Las Lomas
The most prevalent vehicle ownership categories in Las Lomas are males with 2 vehicles (273, accounting for 74.4%) and females with 2 vehicles (211, making up 65.8%).
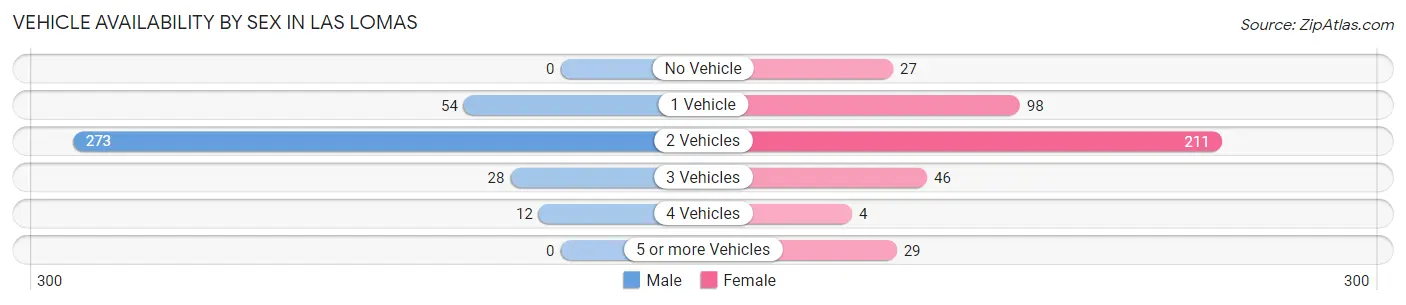
| Vehicles Available | Male | Female |
| No Vehicle | 0 (0.0%) | 27 (6.5%) |
| 1 Vehicle | 54 (14.7%) | 98 (23.6%) |
| 2 Vehicles | 273 (74.4%) | 211 (50.8%) |
| 3 Vehicles | 28 (7.6%) | 46 (11.1%) |
| 4 Vehicles | 12 (3.3%) | 4 (1.0%) |
| 5 or more Vehicles | 0 (0.0%) | 29 (7.0%) |
| Total | 367 (100.0%) | 415 (100.0%) |
Commute Time in Las Lomas
The most frequently occuring commute durations in Las Lomas are 15 to 19 minutes (173 commuters, 25.1%), 10 to 14 minutes (156 commuters, 22.6%), and 30 to 34 minutes (114 commuters, 16.5%).
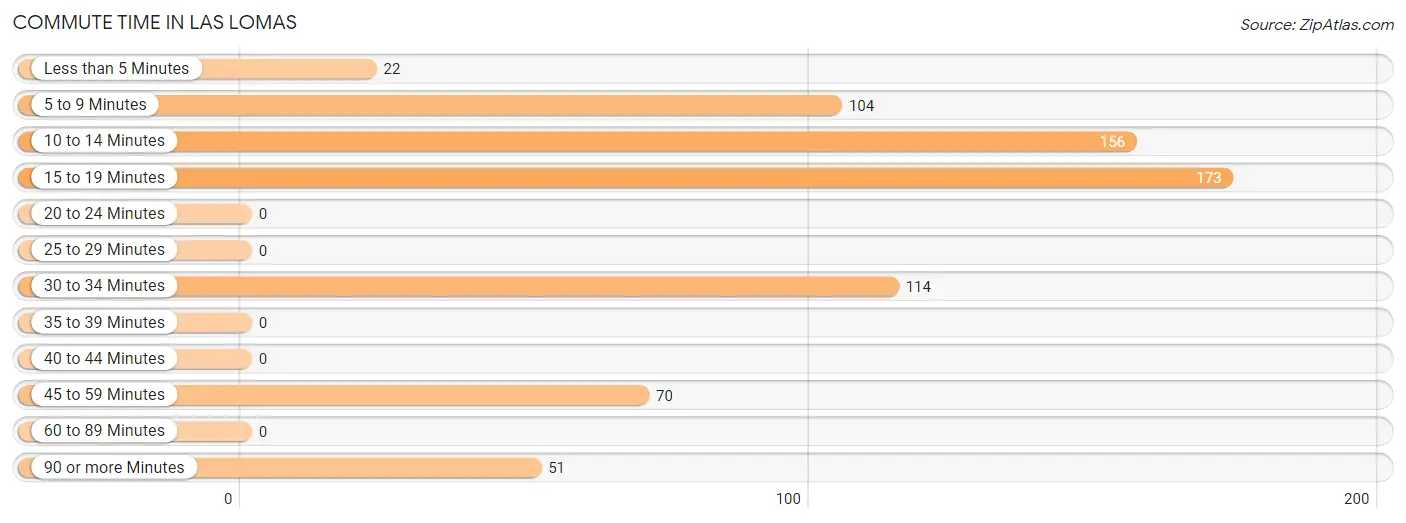
| Commute Time | # Commuters | % Commuters |
| Less than 5 Minutes | 22 | 3.2% |
| 5 to 9 Minutes | 104 | 15.1% |
| 10 to 14 Minutes | 156 | 22.6% |
| 15 to 19 Minutes | 173 | 25.1% |
| 20 to 24 Minutes | 0 | 0.0% |
| 25 to 29 Minutes | 0 | 0.0% |
| 30 to 34 Minutes | 114 | 16.5% |
| 35 to 39 Minutes | 0 | 0.0% |
| 40 to 44 Minutes | 0 | 0.0% |
| 45 to 59 Minutes | 70 | 10.1% |
| 60 to 89 Minutes | 0 | 0.0% |
| 90 or more Minutes | 51 | 7.4% |
Commute Time by Sex in Las Lomas
The most common commute times in Las Lomas are 10 to 14 minutes (106 commuters, 28.9%) for males and 15 to 19 minutes (142 commuters, 44.0%) for females.
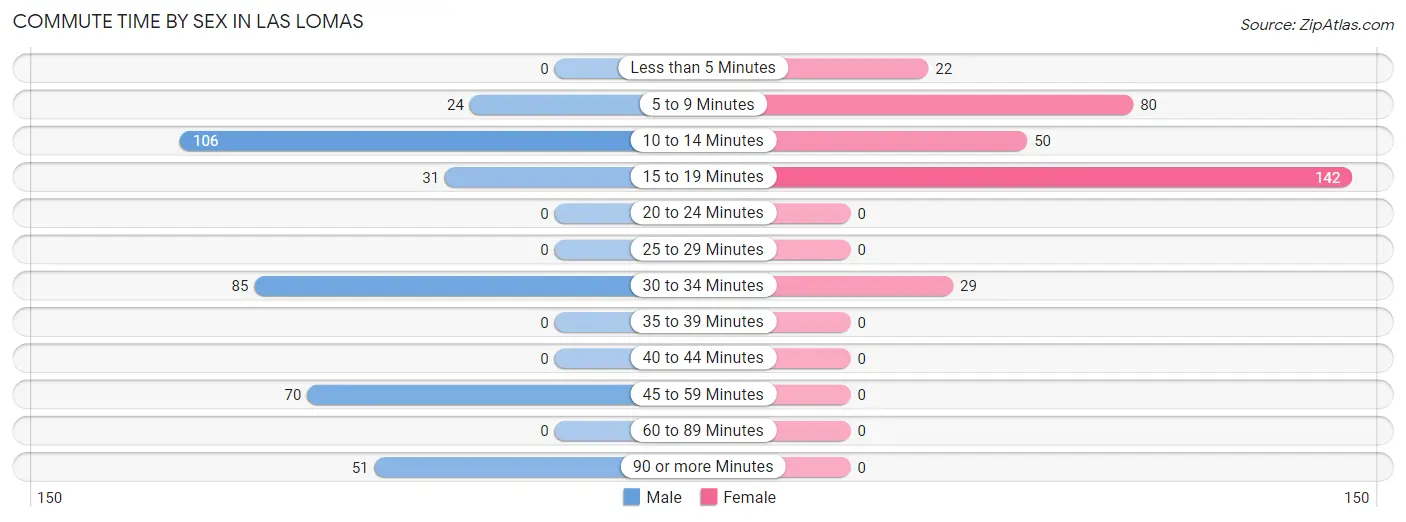
| Commute Time | Male | Female |
| Less than 5 Minutes | 0 (0.0%) | 22 (6.8%) |
| 5 to 9 Minutes | 24 (6.5%) | 80 (24.8%) |
| 10 to 14 Minutes | 106 (28.9%) | 50 (15.5%) |
| 15 to 19 Minutes | 31 (8.5%) | 142 (44.0%) |
| 20 to 24 Minutes | 0 (0.0%) | 0 (0.0%) |
| 25 to 29 Minutes | 0 (0.0%) | 0 (0.0%) |
| 30 to 34 Minutes | 85 (23.2%) | 29 (9.0%) |
| 35 to 39 Minutes | 0 (0.0%) | 0 (0.0%) |
| 40 to 44 Minutes | 0 (0.0%) | 0 (0.0%) |
| 45 to 59 Minutes | 70 (19.1%) | 0 (0.0%) |
| 60 to 89 Minutes | 0 (0.0%) | 0 (0.0%) |
| 90 or more Minutes | 51 (13.9%) | 0 (0.0%) |
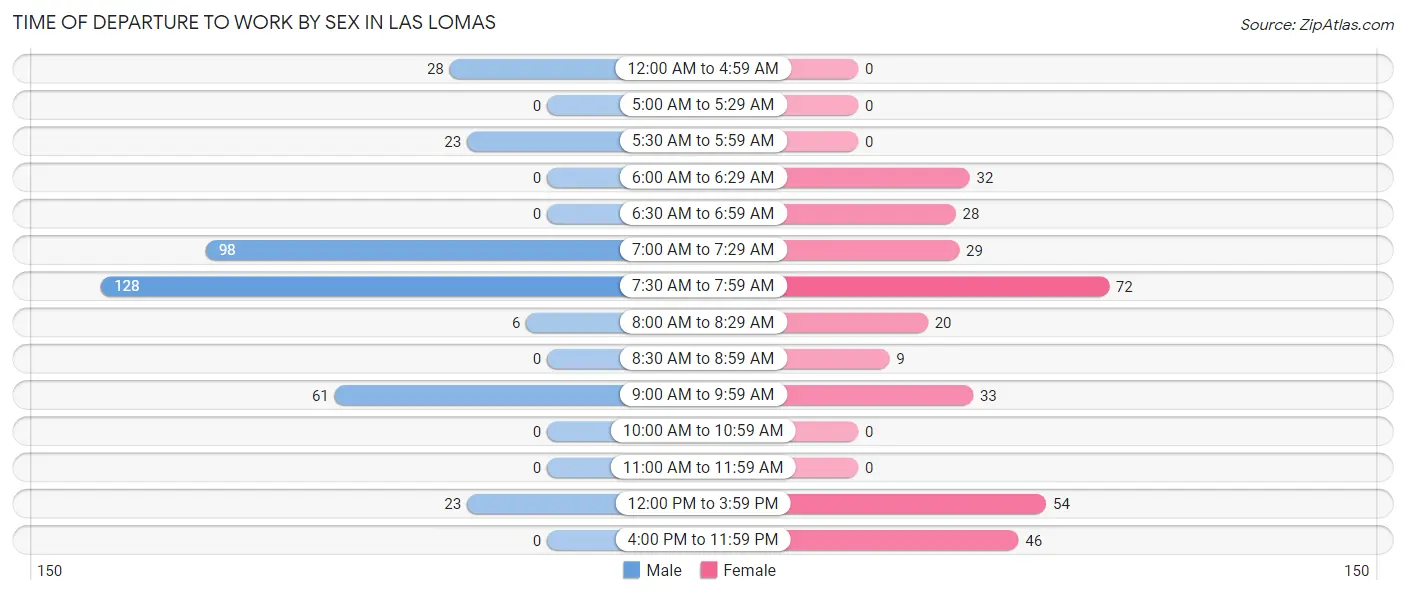
Time of Departure to Work by Sex in Las Lomas
The most frequent times of departure to work in Las Lomas are 7:30 AM to 7:59 AM (128, 34.9%) for males and 7:30 AM to 7:59 AM (72, 22.3%) for females.
| Time of Departure | Male | Female |
| 12:00 AM to 4:59 AM | 28 (7.6%) | 0 (0.0%) |
| 5:00 AM to 5:29 AM | 0 (0.0%) | 0 (0.0%) |
| 5:30 AM to 5:59 AM | 23 (6.3%) | 0 (0.0%) |
| 6:00 AM to 6:29 AM | 0 (0.0%) | 32 (9.9%) |
| 6:30 AM to 6:59 AM | 0 (0.0%) | 28 (8.7%) |
| 7:00 AM to 7:29 AM | 98 (26.7%) | 29 (9.0%) |
| 7:30 AM to 7:59 AM | 128 (34.9%) | 72 (22.3%) |
| 8:00 AM to 8:29 AM | 6 (1.6%) | 20 (6.2%) |
| 8:30 AM to 8:59 AM | 0 (0.0%) | 9 (2.8%) |
| 9:00 AM to 9:59 AM | 61 (16.6%) | 33 (10.2%) |
| 10:00 AM to 10:59 AM | 0 (0.0%) | 0 (0.0%) |
| 11:00 AM to 11:59 AM | 0 (0.0%) | 0 (0.0%) |
| 12:00 PM to 3:59 PM | 23 (6.3%) | 54 (16.7%) |
| 4:00 PM to 11:59 PM | 0 (0.0%) | 46 (14.2%) |
| Total | 367 (100.0%) | 323 (100.0%) |
Housing Occupancy in Las Lomas
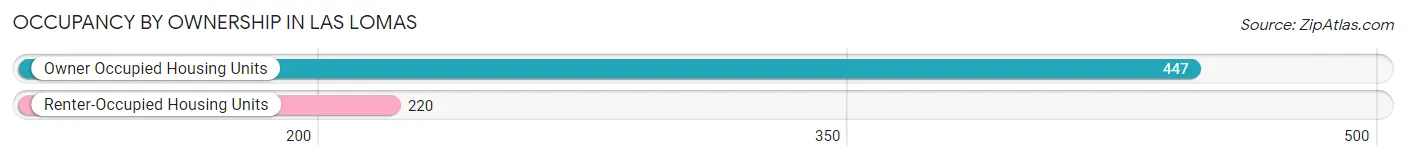
Occupancy by Ownership in Las Lomas
Of the total 667 dwellings in Las Lomas, owner-occupied units account for 447 (67.0%), while renter-occupied units make up 220 (33.0%).
| Occupancy | # Housing Units | % Housing Units |
| Owner Occupied Housing Units | 447 | 67.0% |
| Renter-Occupied Housing Units | 220 | 33.0% |
| Total Occupied Housing Units | 667 | 100.0% |
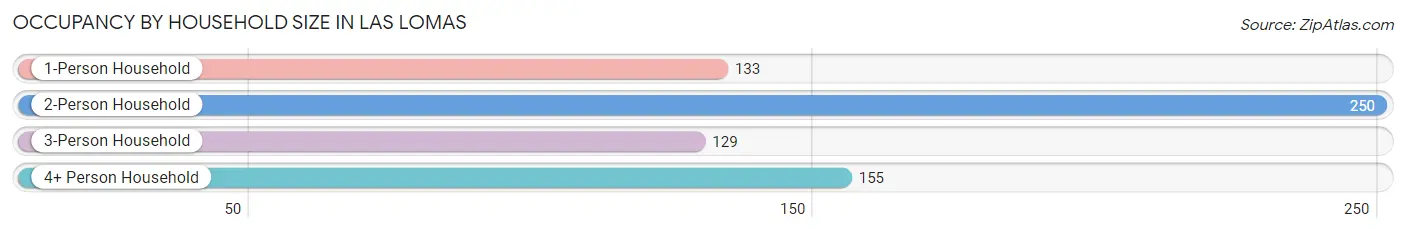
Occupancy by Household Size in Las Lomas
| Household Size | # Housing Units | % Housing Units |
| 1-Person Household | 133 | 19.9% |
| 2-Person Household | 250 | 37.5% |
| 3-Person Household | 129 | 19.3% |
| 4+ Person Household | 155 | 23.2% |
| Total Housing Units | 667 | 100.0% |
Occupancy by Ownership by Household Size in Las Lomas
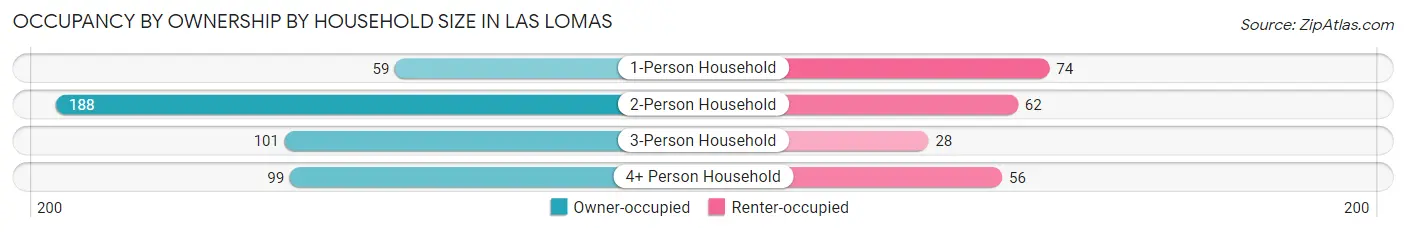
| Household Size | Owner-occupied | Renter-occupied |
| 1-Person Household | 59 (44.4%) | 74 (55.6%) |
| 2-Person Household | 188 (75.2%) | 62 (24.8%) |
| 3-Person Household | 101 (78.3%) | 28 (21.7%) |
| 4+ Person Household | 99 (63.9%) | 56 (36.1%) |
| Total Housing Units | 447 (67.0%) | 220 (33.0%) |
Occupancy by Educational Attainment in Las Lomas
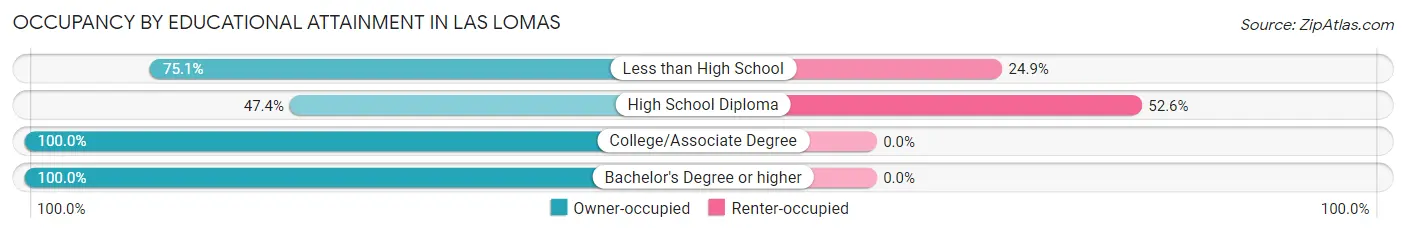
| Household Size | Owner-occupied | Renter-occupied |
| Less than High School | 326 (75.1%) | 108 (24.9%) |
| High School Diploma | 101 (47.4%) | 112 (52.6%) |
| College/Associate Degree | 9 (100.0%) | 0 (0.0%) |
| Bachelor's Degree or higher | 11 (100.0%) | 0 (0.0%) |
Occupancy by Age of Householder in Las Lomas
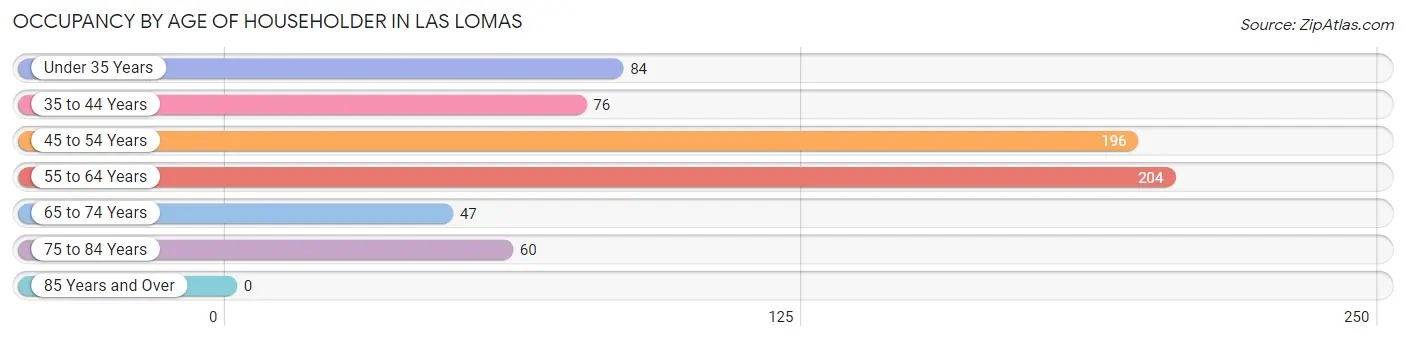
| Age Bracket | # Households | % Households |
| Under 35 Years | 84 | 12.6% |
| 35 to 44 Years | 76 | 11.4% |
| 45 to 54 Years | 196 | 29.4% |
| 55 to 64 Years | 204 | 30.6% |
| 65 to 74 Years | 47 | 7.0% |
| 75 to 84 Years | 60 | 9.0% |
| 85 Years and Over | 0 | 0.0% |
| Total | 667 | 100.0% |
Housing Finances in Las Lomas
Median Income by Occupancy in Las Lomas
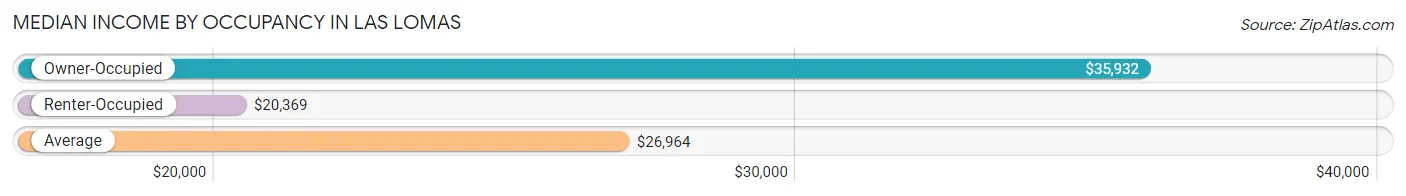
| Occupancy Type | # Households | Median Income |
| Owner-Occupied | 447 (67.0%) | $35,932 |
| Renter-Occupied | 220 (33.0%) | $20,369 |
| Average | 667 (100.0%) | $26,964 |
Occupancy by Householder Income Bracket in Las Lomas
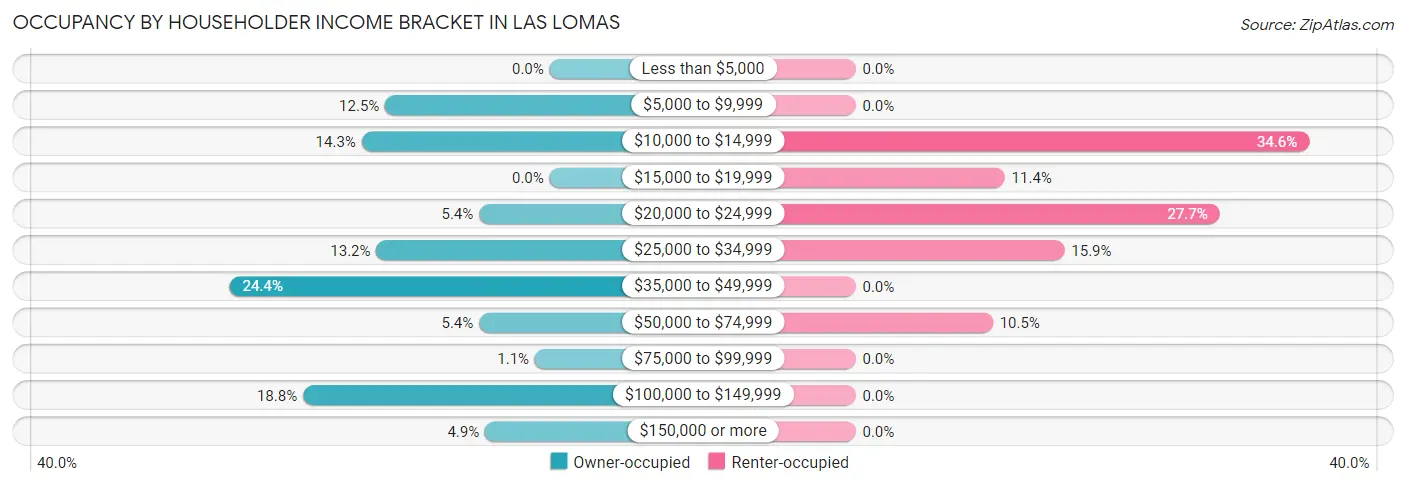
| Income Bracket | Owner-occupied | Renter-occupied |
| Less than $5,000 | 0 (0.0%) | 0 (0.0%) |
| $5,000 to $9,999 | 56 (12.5%) | 0 (0.0%) |
| $10,000 to $14,999 | 64 (14.3%) | 76 (34.5%) |
| $15,000 to $19,999 | 0 (0.0%) | 25 (11.4%) |
| $20,000 to $24,999 | 24 (5.4%) | 61 (27.7%) |
| $25,000 to $34,999 | 59 (13.2%) | 35 (15.9%) |
| $35,000 to $49,999 | 109 (24.4%) | 0 (0.0%) |
| $50,000 to $74,999 | 24 (5.4%) | 23 (10.4%) |
| $75,000 to $99,999 | 5 (1.1%) | 0 (0.0%) |
| $100,000 to $149,999 | 84 (18.8%) | 0 (0.0%) |
| $150,000 or more | 22 (4.9%) | 0 (0.0%) |
| Total | 447 (100.0%) | 220 (100.0%) |
Monthly Housing Cost Tiers in Las Lomas
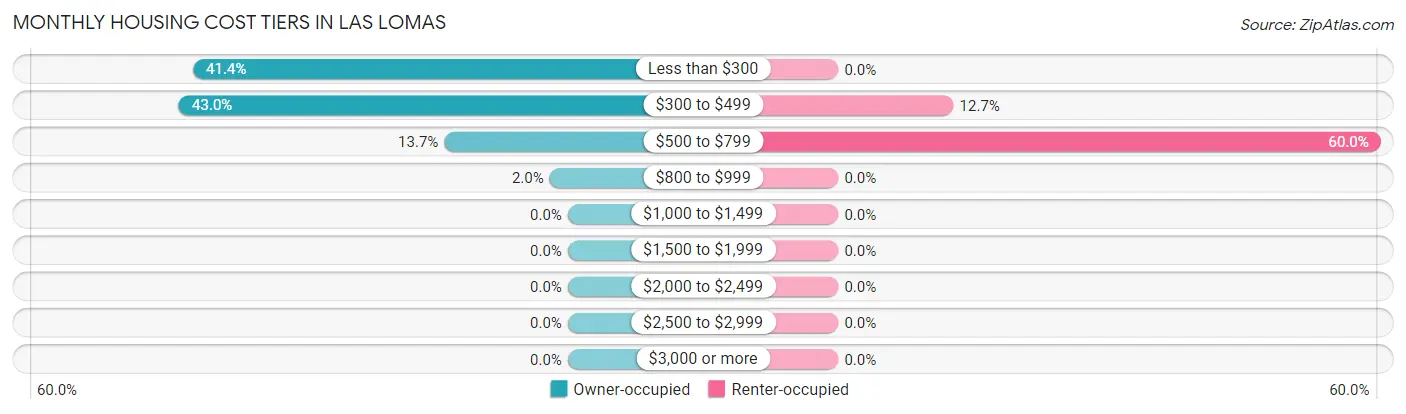
| Monthly Cost | Owner-occupied | Renter-occupied |
| Less than $300 | 185 (41.4%) | 0 (0.0%) |
| $300 to $499 | 192 (42.9%) | 28 (12.7%) |
| $500 to $799 | 61 (13.7%) | 132 (60.0%) |
| $800 to $999 | 9 (2.0%) | 0 (0.0%) |
| $1,000 to $1,499 | 0 (0.0%) | 0 (0.0%) |
| $1,500 to $1,999 | 0 (0.0%) | 0 (0.0%) |
| $2,000 to $2,499 | 0 (0.0%) | 0 (0.0%) |
| $2,500 to $2,999 | 0 (0.0%) | 0 (0.0%) |
| $3,000 or more | 0 (0.0%) | 0 (0.0%) |
| Total | 447 (100.0%) | 220 (100.0%) |
Physical Housing Characteristics in Las Lomas
Housing Structures in Las Lomas
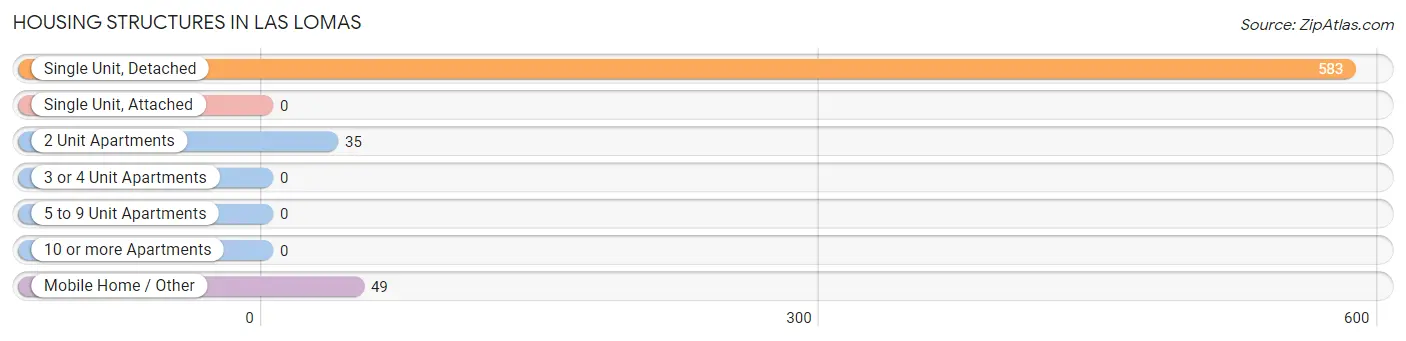
| Structure Type | # Housing Units | % Housing Units |
| Single Unit, Detached | 583 | 87.4% |
| Single Unit, Attached | 0 | 0.0% |
| 2 Unit Apartments | 35 | 5.2% |
| 3 or 4 Unit Apartments | 0 | 0.0% |
| 5 to 9 Unit Apartments | 0 | 0.0% |
| 10 or more Apartments | 0 | 0.0% |
| Mobile Home / Other | 49 | 7.3% |
| Total | 667 | 100.0% |
Housing Structures by Occupancy in Las Lomas
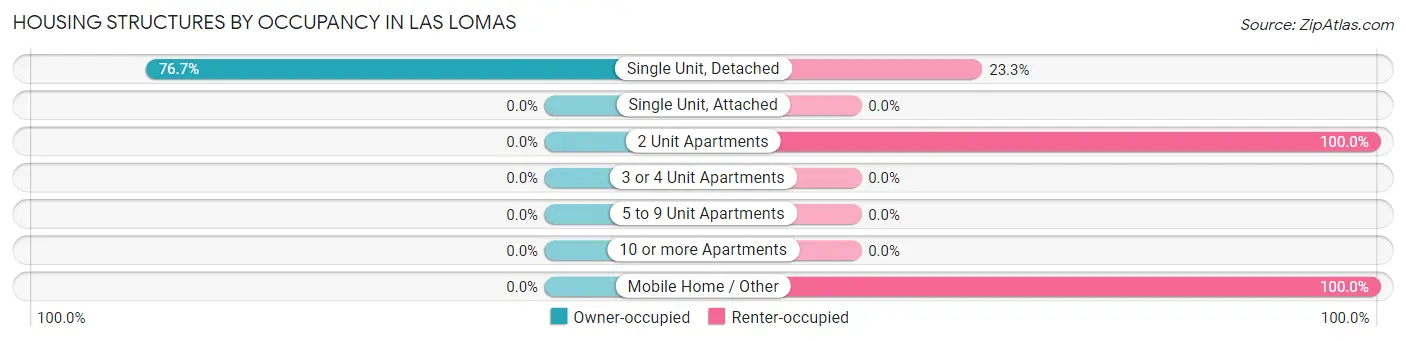
| Structure Type | Owner-occupied | Renter-occupied |
| Single Unit, Detached | 447 (76.7%) | 136 (23.3%) |
| Single Unit, Attached | 0 (0.0%) | 0 (0.0%) |
| 2 Unit Apartments | 0 (0.0%) | 35 (100.0%) |
| 3 or 4 Unit Apartments | 0 (0.0%) | 0 (0.0%) |
| 5 to 9 Unit Apartments | 0 (0.0%) | 0 (0.0%) |
| 10 or more Apartments | 0 (0.0%) | 0 (0.0%) |
| Mobile Home / Other | 0 (0.0%) | 49 (100.0%) |
| Total | 447 (67.0%) | 220 (33.0%) |
Housing Structures by Number of Rooms in Las Lomas
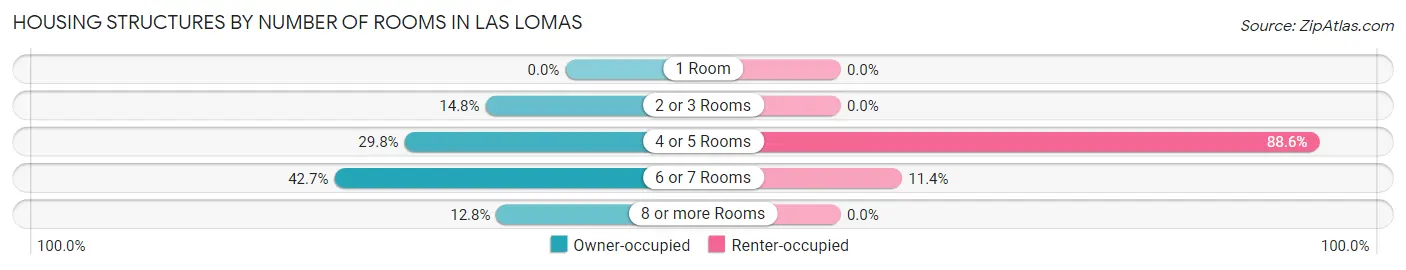
| Number of Rooms | Owner-occupied | Renter-occupied |
| 1 Room | 0 (0.0%) | 0 (0.0%) |
| 2 or 3 Rooms | 66 (14.8%) | 0 (0.0%) |
| 4 or 5 Rooms | 133 (29.7%) | 195 (88.6%) |
| 6 or 7 Rooms | 191 (42.7%) | 25 (11.4%) |
| 8 or more Rooms | 57 (12.8%) | 0 (0.0%) |
| Total | 447 (100.0%) | 220 (100.0%) |
Housing Structure by Heating Type in Las Lomas
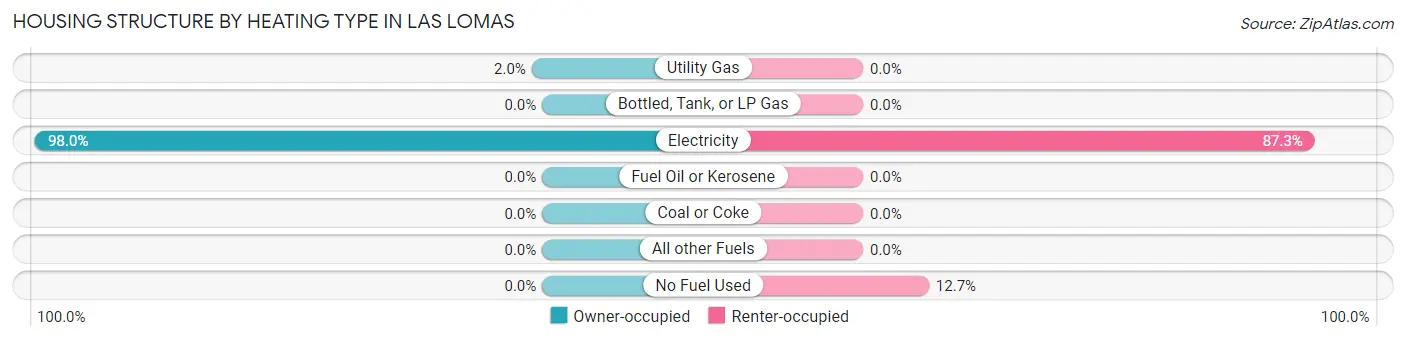
| Heating Type | Owner-occupied | Renter-occupied |
| Utility Gas | 9 (2.0%) | 0 (0.0%) |
| Bottled, Tank, or LP Gas | 0 (0.0%) | 0 (0.0%) |
| Electricity | 438 (98.0%) | 192 (87.3%) |
| Fuel Oil or Kerosene | 0 (0.0%) | 0 (0.0%) |
| Coal or Coke | 0 (0.0%) | 0 (0.0%) |
| All other Fuels | 0 (0.0%) | 0 (0.0%) |
| No Fuel Used | 0 (0.0%) | 28 (12.7%) |
| Total | 447 (100.0%) | 220 (100.0%) |
Household Vehicle Usage in Las Lomas
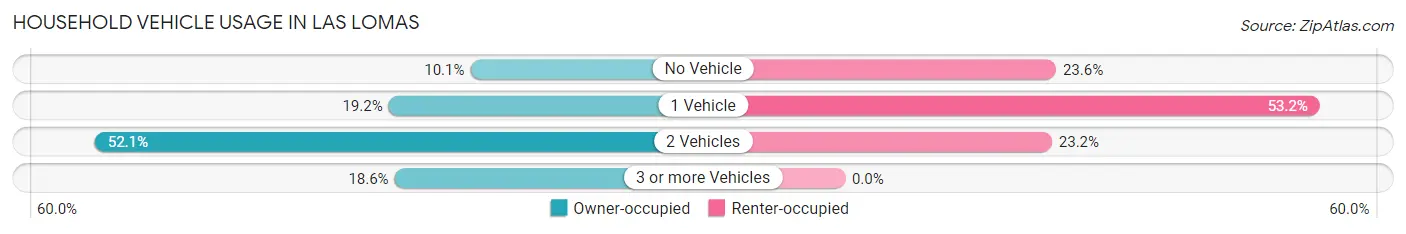
| Vehicles per Household | Owner-occupied | Renter-occupied |
| No Vehicle | 45 (10.1%) | 52 (23.6%) |
| 1 Vehicle | 86 (19.2%) | 117 (53.2%) |
| 2 Vehicles | 233 (52.1%) | 51 (23.2%) |
| 3 or more Vehicles | 83 (18.6%) | 0 (0.0%) |
| Total | 447 (100.0%) | 220 (100.0%) |
Real Estate & Mortgages in Las Lomas
Real Estate and Mortgage Overview in Las Lomas
| Characteristic | Without Mortgage | With Mortgage |
| Housing Units | 434 | 13 |
| Median Property Value | $82,200 | $0 |
| Median Household Income | $36,045 | $0 |
| Monthly Housing Costs | $321 | $0 |
| Real Estate Taxes | $620 | $0 |
Property Value by Mortgage Status in Las Lomas
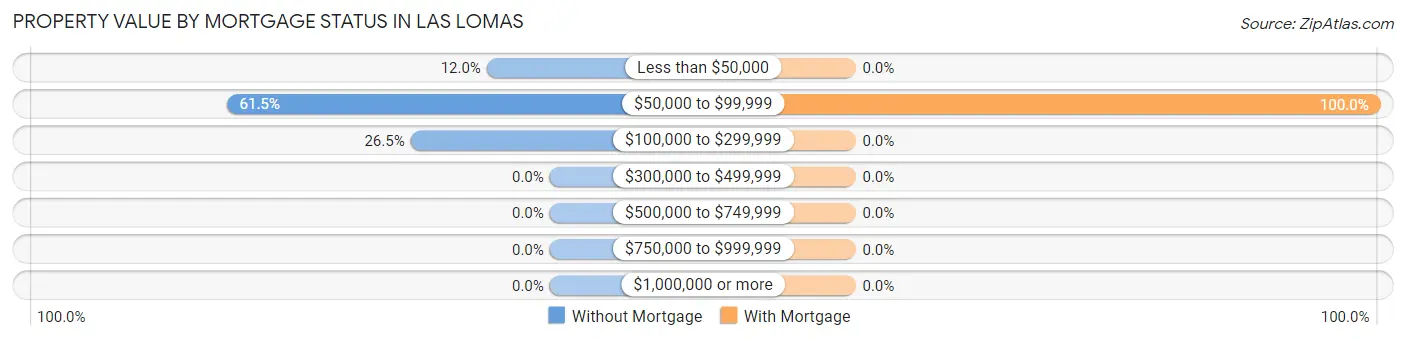
| Property Value | Without Mortgage | With Mortgage |
| Less than $50,000 | 52 (12.0%) | 0 (0.0%) |
| $50,000 to $99,999 | 267 (61.5%) | 13 (100.0%) |
| $100,000 to $299,999 | 115 (26.5%) | 0 (0.0%) |
| $300,000 to $499,999 | 0 (0.0%) | 0 (0.0%) |
| $500,000 to $749,999 | 0 (0.0%) | 0 (0.0%) |
| $750,000 to $999,999 | 0 (0.0%) | 0 (0.0%) |
| $1,000,000 or more | 0 (0.0%) | 0 (0.0%) |
| Total | 434 (100.0%) | 13 (100.0%) |
Household Income by Mortgage Status in Las Lomas
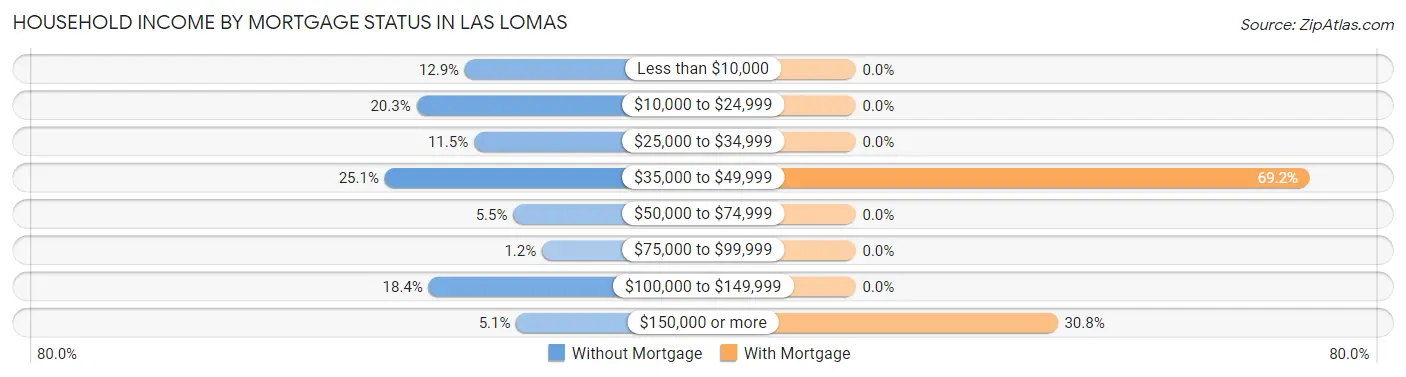
| Household Income | Without Mortgage | With Mortgage |
| Less than $10,000 | 56 (12.9%) | 0 (0.0%) |
| $10,000 to $24,999 | 88 (20.3%) | 0 (0.0%) |
| $25,000 to $34,999 | 50 (11.5%) | 0 (0.0%) |
| $35,000 to $49,999 | 109 (25.1%) | 9 (69.2%) |
| $50,000 to $74,999 | 24 (5.5%) | 0 (0.0%) |
| $75,000 to $99,999 | 5 (1.1%) | 0 (0.0%) |
| $100,000 to $149,999 | 80 (18.4%) | 0 (0.0%) |
| $150,000 or more | 22 (5.1%) | 4 (30.8%) |
| Total | 434 (100.0%) | 13 (100.0%) |
Property Value to Household Income Ratio in Las Lomas
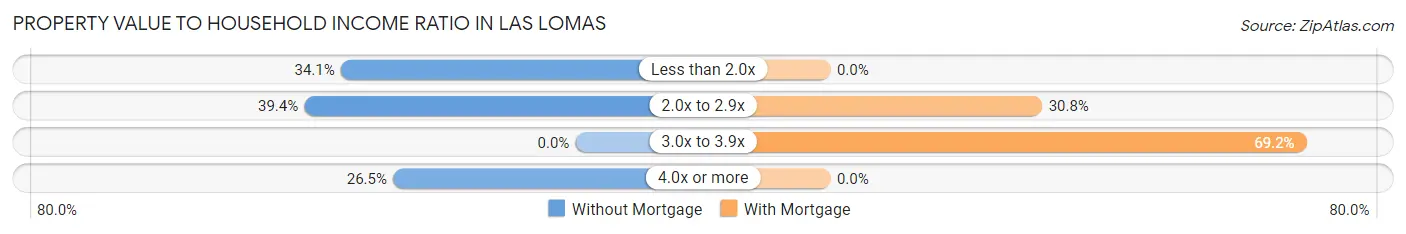
| Value-to-Income Ratio | Without Mortgage | With Mortgage |
| Less than 2.0x | 148 (34.1%) | 0 (0.0%) |
| 2.0x to 2.9x | 171 (39.4%) | 4 (30.8%) |
| 3.0x to 3.9x | 0 (0.0%) | 9 (69.2%) |
| 4.0x or more | 115 (26.5%) | 0 (0.0%) |
| Total | 434 (100.0%) | 13 (100.0%) |
Real Estate Taxes by Mortgage Status in Las Lomas
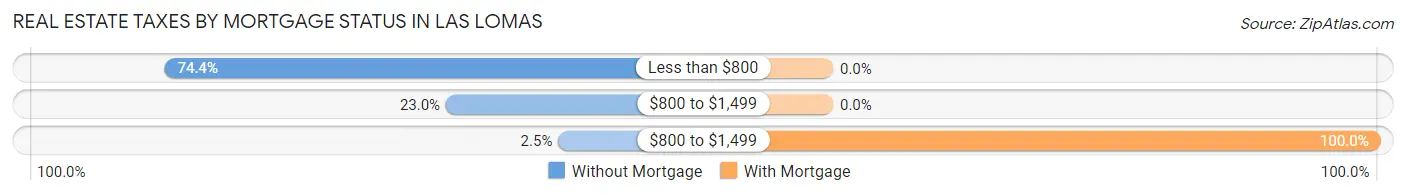
| Property Taxes | Without Mortgage | With Mortgage |
| Less than $800 | 323 (74.4%) | 0 (0.0%) |
| $800 to $1,499 | 100 (23.0%) | 0 (0.0%) |
| $800 to $1,499 | 11 (2.5%) | 13 (100.0%) |
| Total | 434 (100.0%) | 13 (100.0%) |
Health & Disability in Las Lomas
Health Insurance Coverage by Age in Las Lomas
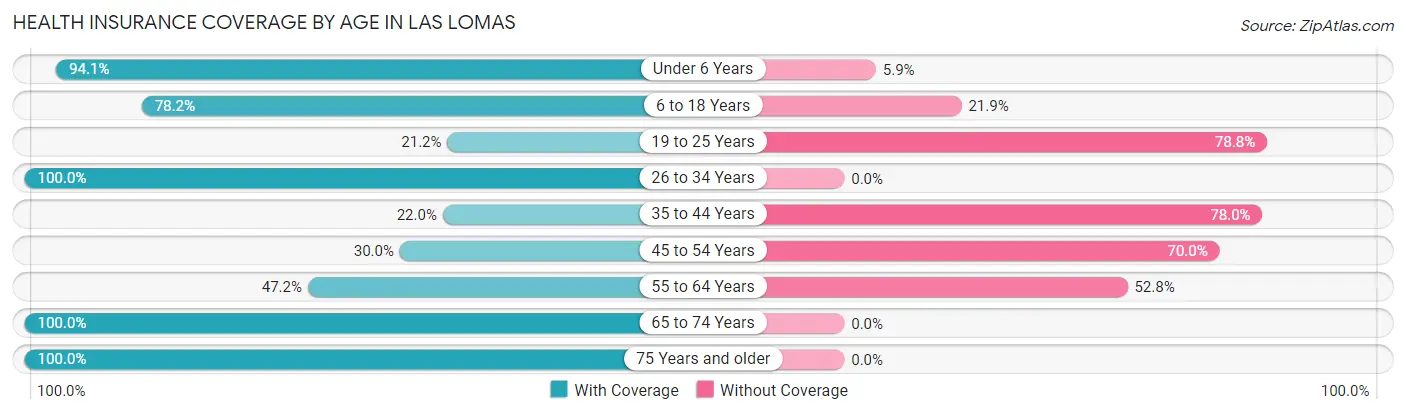
| Age Bracket | With Coverage | Without Coverage |
| Under 6 Years | 160 (94.1%) | 10 (5.9%) |
| 6 to 18 Years | 329 (78.1%) | 92 (21.8%) |
| 19 to 25 Years | 84 (21.2%) | 313 (78.8%) |
| 26 to 34 Years | 176 (100.0%) | 0 (0.0%) |
| 35 to 44 Years | 50 (22.0%) | 177 (78.0%) |
| 45 to 54 Years | 94 (30.0%) | 219 (70.0%) |
| 55 to 64 Years | 143 (47.2%) | 160 (52.8%) |
| 65 to 74 Years | 86 (100.0%) | 0 (0.0%) |
| 75 Years and older | 71 (100.0%) | 0 (0.0%) |
| Total | 1,193 (55.1%) | 971 (44.9%) |
Health Insurance Coverage by Citizenship Status in Las Lomas
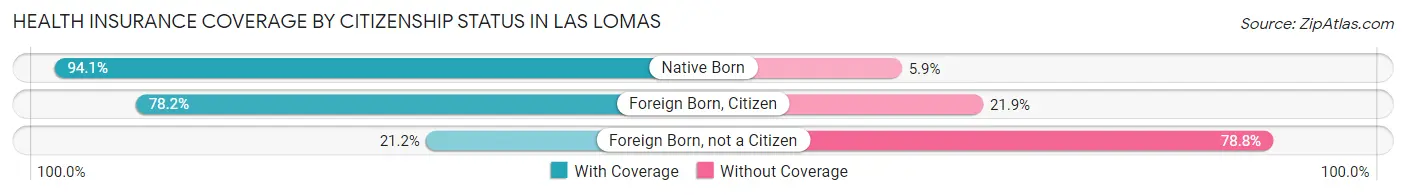
| Citizenship Status | With Coverage | Without Coverage |
| Native Born | 160 (94.1%) | 10 (5.9%) |
| Foreign Born, Citizen | 329 (78.1%) | 92 (21.8%) |
| Foreign Born, not a Citizen | 84 (21.2%) | 313 (78.8%) |
Health Insurance Coverage by Household Income in Las Lomas
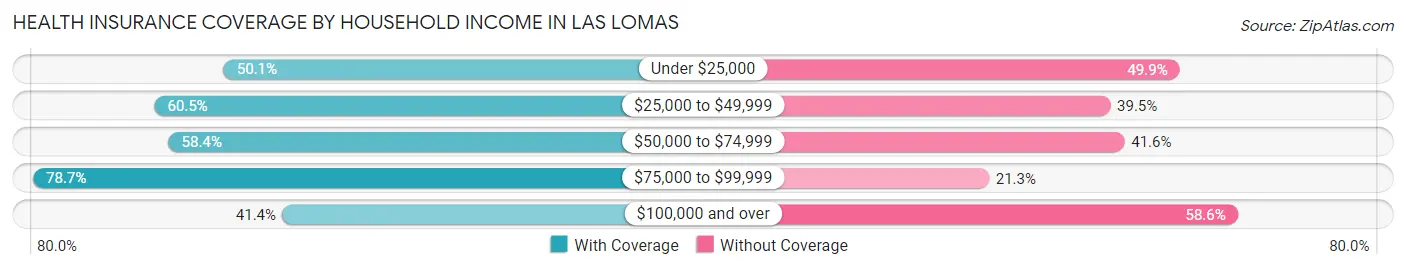
| Household Income | With Coverage | Without Coverage |
| Under $25,000 | 367 (50.1%) | 365 (49.9%) |
| $25,000 to $49,999 | 506 (60.5%) | 330 (39.5%) |
| $50,000 to $74,999 | 191 (58.4%) | 136 (41.6%) |
| $75,000 to $99,999 | 37 (78.7%) | 10 (21.3%) |
| $100,000 and over | 92 (41.4%) | 130 (58.6%) |
Public vs Private Health Insurance Coverage by Age in Las Lomas
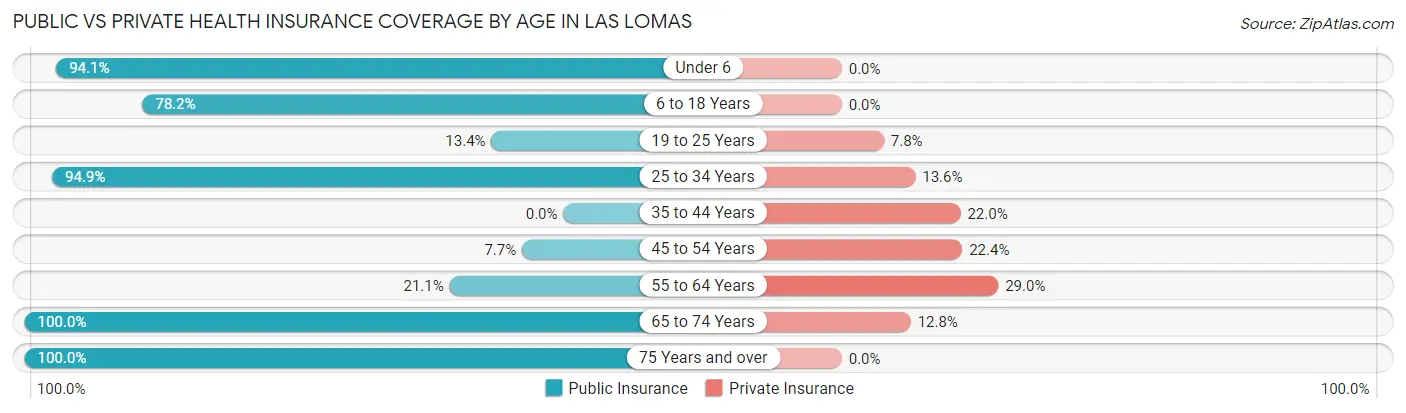
| Age Bracket | Public Insurance | Private Insurance |
| Under 6 | 160 (94.1%) | 0 (0.0%) |
| 6 to 18 Years | 329 (78.1%) | 0 (0.0%) |
| 19 to 25 Years | 53 (13.4%) | 31 (7.8%) |
| 25 to 34 Years | 167 (94.9%) | 24 (13.6%) |
| 35 to 44 Years | 0 (0.0%) | 50 (22.0%) |
| 45 to 54 Years | 24 (7.7%) | 70 (22.4%) |
| 55 to 64 Years | 64 (21.1%) | 88 (29.0%) |
| 65 to 74 Years | 86 (100.0%) | 11 (12.8%) |
| 75 Years and over | 71 (100.0%) | 0 (0.0%) |
| Total | 954 (44.1%) | 274 (12.7%) |
Disability Status by Sex by Age in Las Lomas
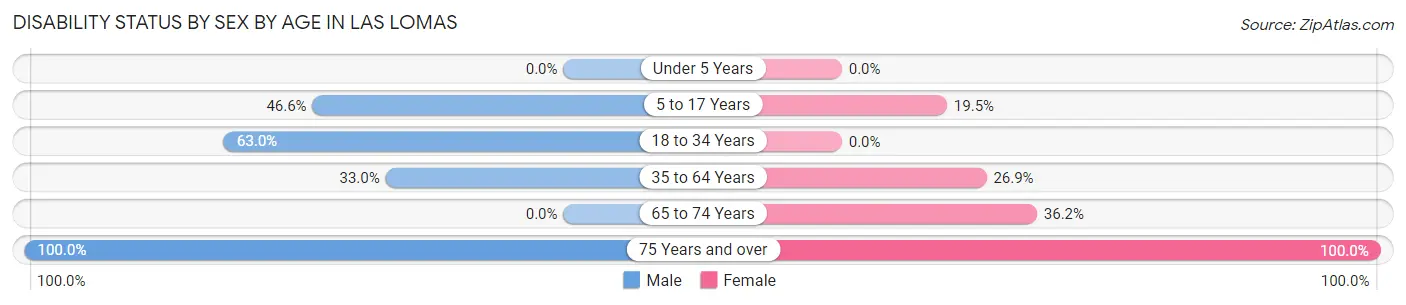
| Age Bracket | Male | Female |
| Under 5 Years | 0 (0.0%) | 0 (0.0%) |
| 5 to 17 Years | 95 (46.6%) | 40 (19.5%) |
| 18 to 34 Years | 206 (63.0%) | 0 (0.0%) |
| 35 to 64 Years | 100 (33.0%) | 145 (26.9%) |
| 65 to 74 Years | 0 (0.0%) | 21 (36.2%) |
| 75 Years and over | 11 (100.0%) | 60 (100.0%) |
Disability Class by Sex by Age in Las Lomas
Disability Class: Hearing Difficulty
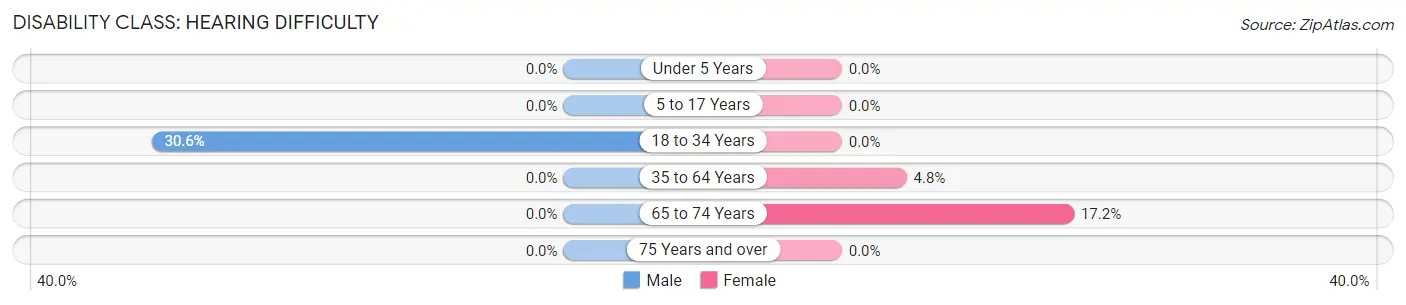
| Age Bracket | Male | Female |
| Under 5 Years | 0 (0.0%) | 0 (0.0%) |
| 5 to 17 Years | 0 (0.0%) | 0 (0.0%) |
| 18 to 34 Years | 100 (30.6%) | 0 (0.0%) |
| 35 to 64 Years | 0 (0.0%) | 26 (4.8%) |
| 65 to 74 Years | 0 (0.0%) | 10 (17.2%) |
| 75 Years and over | 0 (0.0%) | 0 (0.0%) |
Disability Class: Vision Difficulty
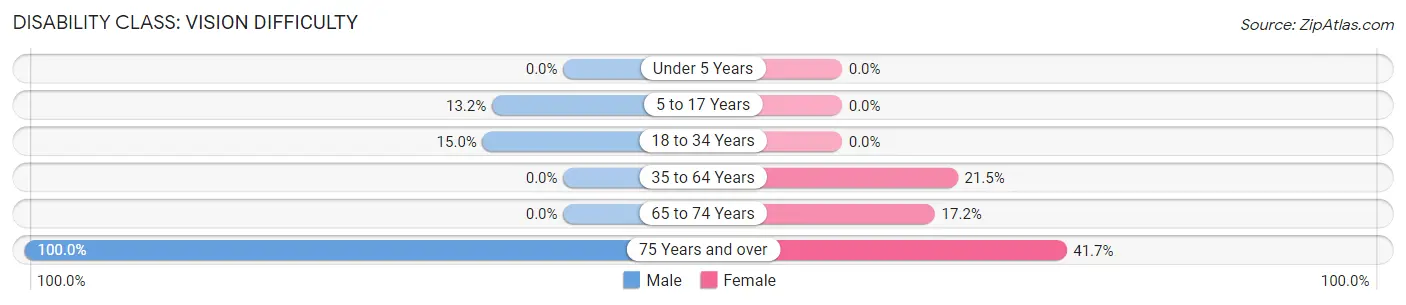
| Age Bracket | Male | Female |
| Under 5 Years | 0 (0.0%) | 0 (0.0%) |
| 5 to 17 Years | 27 (13.2%) | 0 (0.0%) |
| 18 to 34 Years | 49 (15.0%) | 0 (0.0%) |
| 35 to 64 Years | 0 (0.0%) | 116 (21.5%) |
| 65 to 74 Years | 0 (0.0%) | 10 (17.2%) |
| 75 Years and over | 11 (100.0%) | 25 (41.7%) |
Disability Class: Cognitive Difficulty
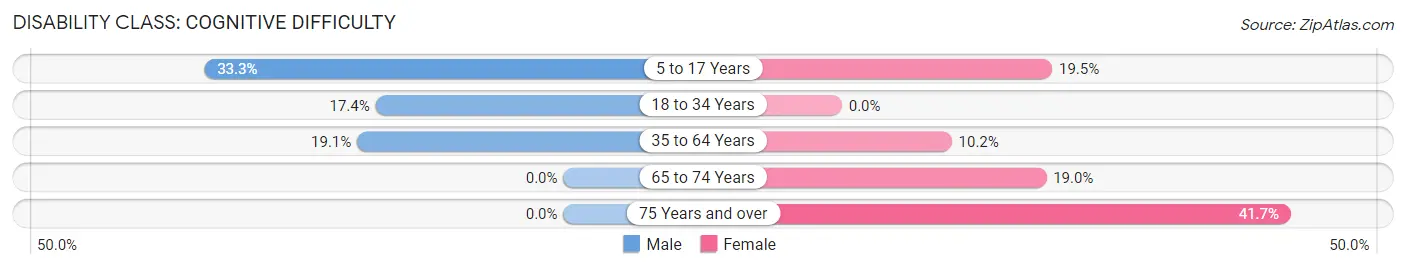
| Age Bracket | Male | Female |
| 5 to 17 Years | 68 (33.3%) | 40 (19.5%) |
| 18 to 34 Years | 57 (17.4%) | 0 (0.0%) |
| 35 to 64 Years | 58 (19.1%) | 55 (10.2%) |
| 65 to 74 Years | 0 (0.0%) | 11 (19.0%) |
| 75 Years and over | 0 (0.0%) | 25 (41.7%) |
Disability Class: Ambulatory Difficulty
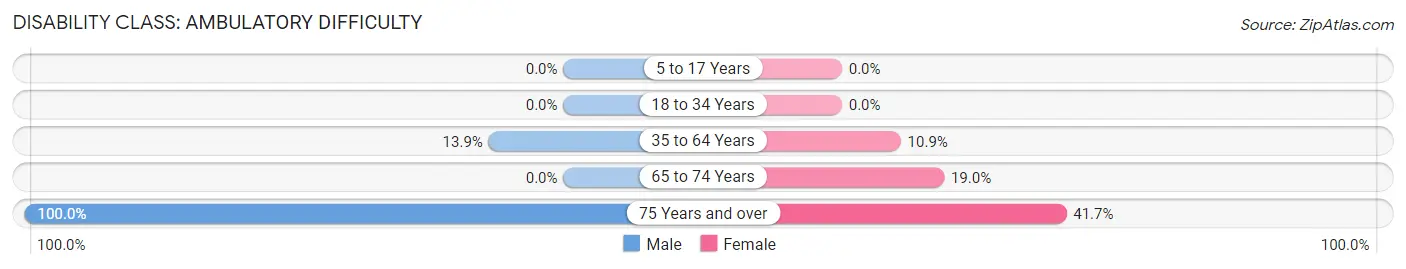
| Age Bracket | Male | Female |
| 5 to 17 Years | 0 (0.0%) | 0 (0.0%) |
| 18 to 34 Years | 0 (0.0%) | 0 (0.0%) |
| 35 to 64 Years | 42 (13.9%) | 59 (10.9%) |
| 65 to 74 Years | 0 (0.0%) | 11 (19.0%) |
| 75 Years and over | 11 (100.0%) | 25 (41.7%) |
Disability Class: Self-Care Difficulty
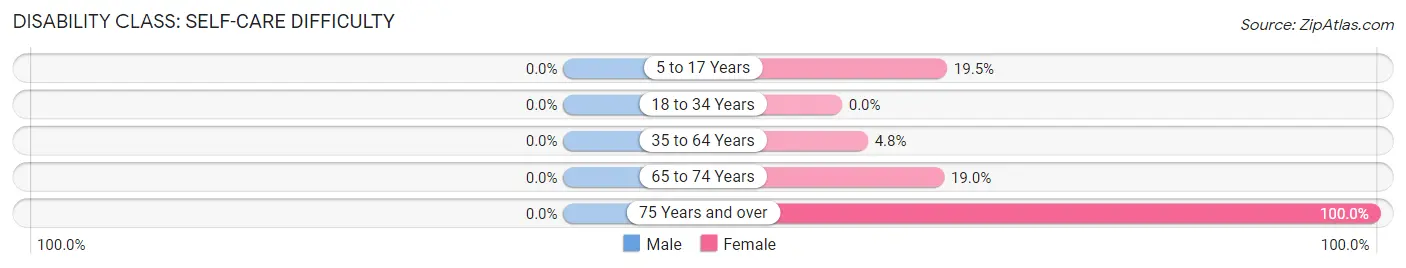
| Age Bracket | Male | Female |
| 5 to 17 Years | 0 (0.0%) | 40 (19.5%) |
| 18 to 34 Years | 0 (0.0%) | 0 (0.0%) |
| 35 to 64 Years | 0 (0.0%) | 26 (4.8%) |
| 65 to 74 Years | 0 (0.0%) | 11 (19.0%) |
| 75 Years and over | 0 (0.0%) | 60 (100.0%) |
Technology Access in Las Lomas
Computing Device Access in Las Lomas
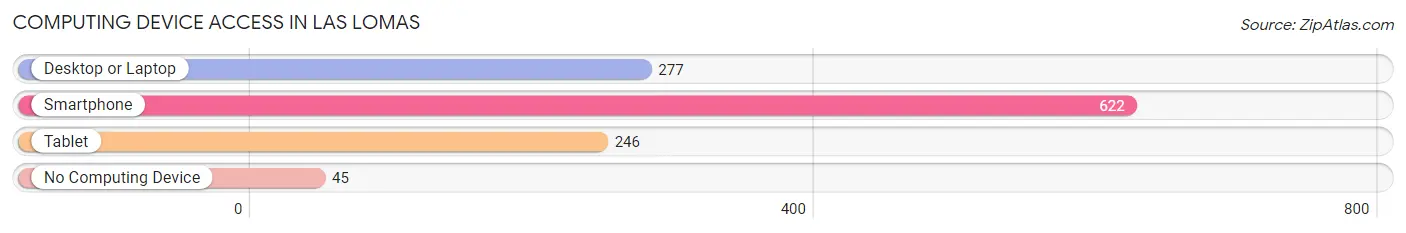
| Device Type | # Households | % Households |
| Desktop or Laptop | 277 | 41.5% |
| Smartphone | 622 | 93.2% |
| Tablet | 246 | 36.9% |
| No Computing Device | 45 | 6.8% |
| Total | 667 | 100.0% |
Internet Access in Las Lomas
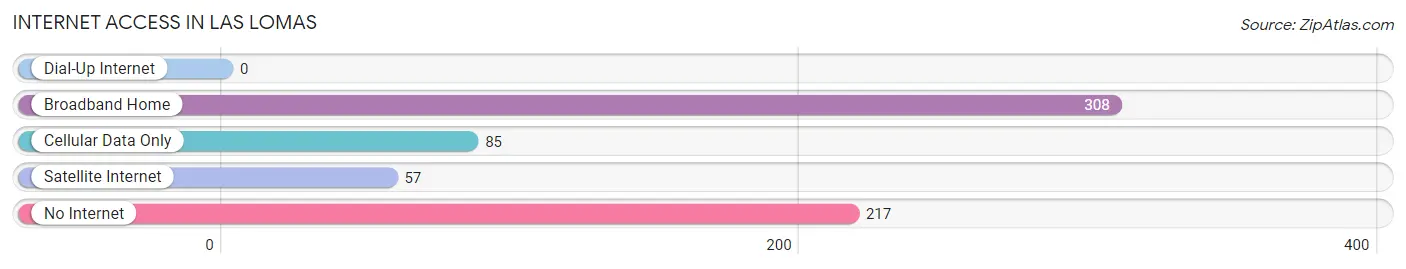
| Internet Type | # Households | % Households |
| Dial-Up Internet | 0 | 0.0% |
| Broadband Home | 308 | 46.2% |
| Cellular Data Only | 85 | 12.7% |
| Satellite Internet | 57 | 8.6% |
| No Internet | 217 | 32.5% |
| Total | 667 | 100.0% |
Las Lomas Summary
Las Lomas, Texas is a small town located in Hidalgo County, Texas. It is situated on the Rio Grande River, just south of the city of McAllen. The population of Las Lomas was 1,845 in the 2010 census.
Geography
Las Lomas is located in the Rio Grande Valley of South Texas. It is situated on the Rio Grande River, just south of the city of McAllen. The town is surrounded by agricultural fields and is located in a semi-arid climate. The average temperature in Las Lomas is around 80 degrees Fahrenheit in the summer and around 60 degrees Fahrenheit in the winter. The average annual rainfall is around 20 inches.
History
Las Lomas was founded in the late 1800s by a group of Mexican settlers. The town was originally called “Las Lomas de la Frontera”, which translates to “The Hills of the Border”. The town was established as a farming community and was known for its production of cotton, corn, and other crops.
In the early 1900s, the town began to grow and develop. The first school was built in 1910 and the first post office was established in 1911. The town was incorporated in 1915 and the first mayor was elected in 1916.
In the 1920s, the town began to experience a population boom due to the influx of Mexican immigrants. The population of Las Lomas grew to over 1,000 by the 1930s.
Economy
The economy of Las Lomas is largely based on agriculture. The town is known for its production of cotton, corn, and other crops. The town also has a number of small businesses, including restaurants, grocery stores, and other retail establishments.
The town is also home to a number of manufacturing companies, including a furniture factory and a plastics factory. The town is also home to a number of service-based businesses, such as auto repair shops and beauty salons.
Demographics
As of the 2010 census, the population of Las Lomas was 1,845. The racial makeup of the town was 94.3% Hispanic, 4.2% White, 0.3% African American, 0.2% Native American, and 0.9% from other races.
The median household income in Las Lomas was $25,938 in 2010. The per capita income was $11,845. The town has a poverty rate of 33.3%.
Conclusion
Las Lomas, Texas is a small town located in Hidalgo County, Texas. It is situated on the Rio Grande River, just south of the city of McAllen. The town was founded in the late 1800s by a group of Mexican settlers and has since grown to a population of 1,845. The economy of Las Lomas is largely based on agriculture and the town is also home to a number of small businesses and manufacturing companies. The racial makeup of the town is 94.3% Hispanic, 4.2% White, 0.3% African American, 0.2% Native American, and 0.9% from other races. The median household income in Las Lomas was $25,938 in 2010 and the per capita income was $11,845. The town has a poverty rate of 33.3%.
Common Questions
What is Per Capita Income in Las Lomas?
Per Capita income in Las Lomas is $14,912.
What is the Median Family Income in Las Lomas?
Median Family Income in Las Lomas is $32,150.
What is the Median Household income in Las Lomas?
Median Household Income in Las Lomas is $26,964.
What is Inequality or Gini Index in Las Lomas?
Inequality or Gini Index in Las Lomas is 0.49.
What is the Total Population of Las Lomas?
Total Population of Las Lomas is 2,164.
What is the Total Male Population of Las Lomas?
Total Male Population of Las Lomas is 944.
What is the Total Female Population of Las Lomas?
Total Female Population of Las Lomas is 1,220.
What is the Ratio of Males per 100 Females in Las Lomas?
There are 77.38 Males per 100 Females in Las Lomas.
What is the Ratio of Females per 100 Males in Las Lomas?
There are 129.24 Females per 100 Males in Las Lomas.
What is the Median Population Age in Las Lomas?
Median Population Age in Las Lomas is 28.8 Years.
What is the Average Family Size in Las Lomas
Average Family Size in Las Lomas is 3.9 People.
What is the Average Household Size in Las Lomas
Average Household Size in Las Lomas is 3.2 People.
How Large is the Labor Force in Las Lomas?
There are 1,019 People in the Labor Forcein in Las Lomas.
What is the Percentage of People in the Labor Force in Las Lomas?
61.2% of People are in the Labor Force in Las Lomas.
What is the Unemployment Rate in Las Lomas?
Unemployment Rate in Las Lomas is 20.0%.