Savoy, TX Map & Demographics
Savoy Map
Savoy Overview
$25,867
PER CAPITA INCOME
$72,222
AVG FAMILY INCOME
$54,833
AVG HOUSEHOLD INCOME
1.4%
WAGE / INCOME GAP [ % ]
98.6¢/ $1
WAGE / INCOME GAP [ $ ]
0.37
INEQUALITY / GINI INDEX
961
TOTAL POPULATION
335
MALE POPULATION
626
FEMALE POPULATION
53.51
MALES / 100 FEMALES
186.87
FEMALES / 100 MALES
41.1
MEDIAN AGE
3.5
AVG FAMILY SIZE
2.9
AVG HOUSEHOLD SIZE
470
LABOR FORCE [ PEOPLE ]
59.5%
PERCENT IN LABOR FORCE
1.3%
UNEMPLOYMENT RATE
Savoy Zip Codes
Savoy Area Codes
Income in Savoy
Income Overview in Savoy
Per Capita Income in Savoy is $25,867, while median incomes of families and households are $72,222 and $54,833 respectively.
| Characteristic | Number | Measure |
| Per Capita Income | 961 | $25,867 |
| Median Family Income | 228 | $72,222 |
| Mean Family Income | 228 | $75,140 |
| Median Household Income | 304 | $54,833 |
| Mean Household Income | 304 | $65,349 |
| Income Deficit | 228 | $0 |
| Wage / Income Gap (%) | 961 | 1.38% |
| Wage / Income Gap ($) | 961 | 98.62¢ per $1 |
| Gini / Inequality Index | 961 | 0.37 |
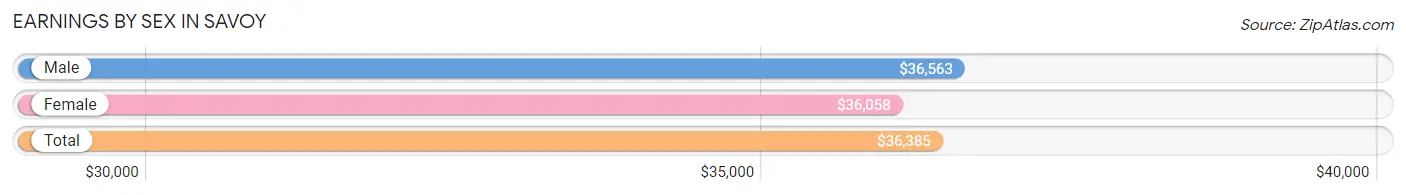
Earnings by Sex in Savoy
Average Earnings in Savoy are $36,385, $36,563 for men and $36,058 for women, a difference of 1.4%.
| Sex | Number | Average Earnings |
| Male | 164 (34.4%) | $36,563 |
| Female | 313 (65.6%) | $36,058 |
| Total | 477 (100.0%) | $36,385 |
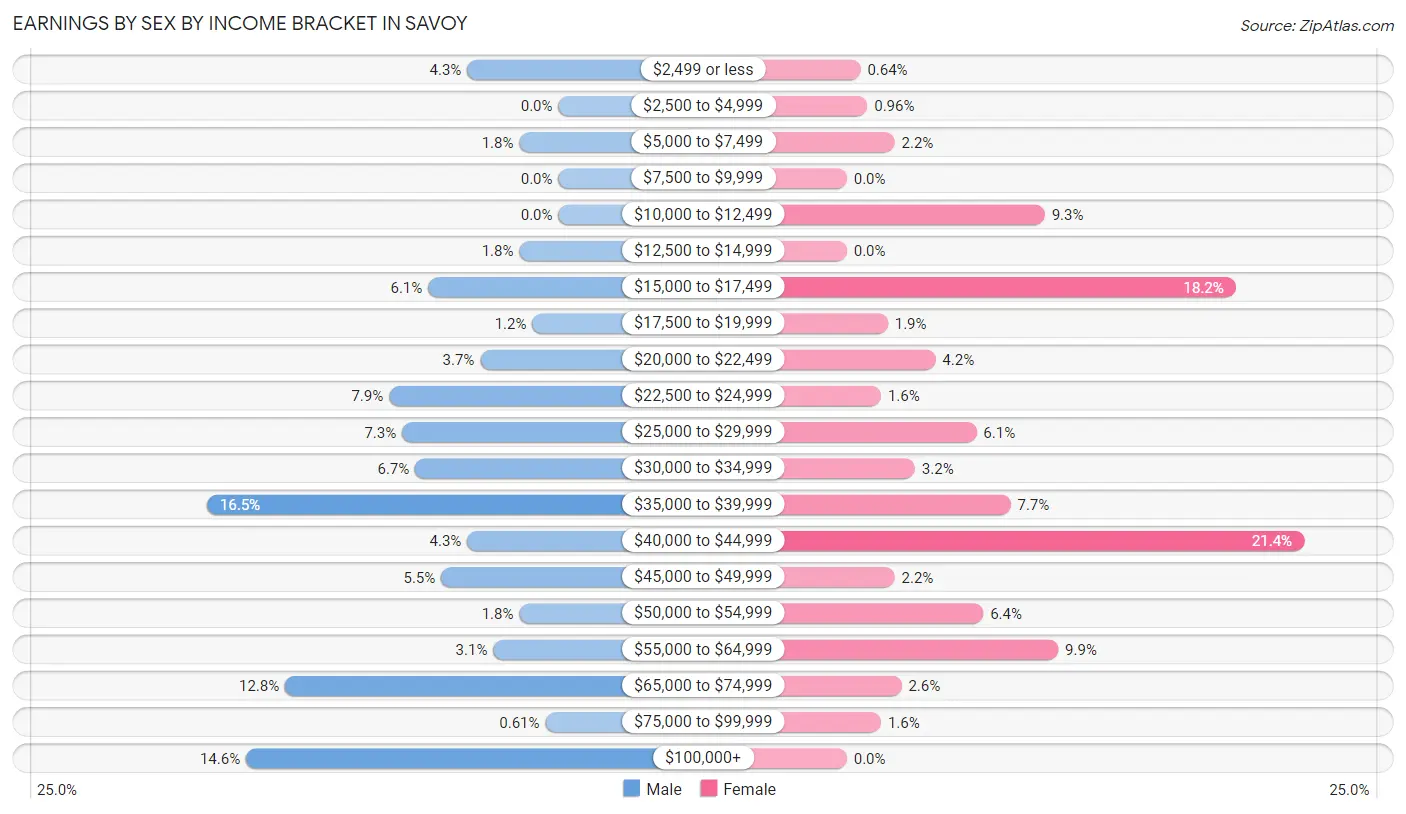
Earnings by Sex by Income Bracket in Savoy
The most common earnings brackets in Savoy are $35,000 to $39,999 for men (27 | 16.5%) and $40,000 to $44,999 for women (67 | 21.4%).
| Income | Male | Female |
| $2,499 or less | 7 (4.3%) | 2 (0.6%) |
| $2,500 to $4,999 | 0 (0.0%) | 3 (1.0%) |
| $5,000 to $7,499 | 3 (1.8%) | 7 (2.2%) |
| $7,500 to $9,999 | 0 (0.0%) | 0 (0.0%) |
| $10,000 to $12,499 | 0 (0.0%) | 29 (9.3%) |
| $12,500 to $14,999 | 3 (1.8%) | 0 (0.0%) |
| $15,000 to $17,499 | 10 (6.1%) | 57 (18.2%) |
| $17,500 to $19,999 | 2 (1.2%) | 6 (1.9%) |
| $20,000 to $22,499 | 6 (3.7%) | 13 (4.2%) |
| $22,500 to $24,999 | 13 (7.9%) | 5 (1.6%) |
| $25,000 to $29,999 | 12 (7.3%) | 19 (6.1%) |
| $30,000 to $34,999 | 11 (6.7%) | 10 (3.2%) |
| $35,000 to $39,999 | 27 (16.5%) | 24 (7.7%) |
| $40,000 to $44,999 | 7 (4.3%) | 67 (21.4%) |
| $45,000 to $49,999 | 9 (5.5%) | 7 (2.2%) |
| $50,000 to $54,999 | 3 (1.8%) | 20 (6.4%) |
| $55,000 to $64,999 | 5 (3.0%) | 31 (9.9%) |
| $65,000 to $74,999 | 21 (12.8%) | 8 (2.6%) |
| $75,000 to $99,999 | 1 (0.6%) | 5 (1.6%) |
| $100,000+ | 24 (14.6%) | 0 (0.0%) |
| Total | 164 (100.0%) | 313 (100.0%) |
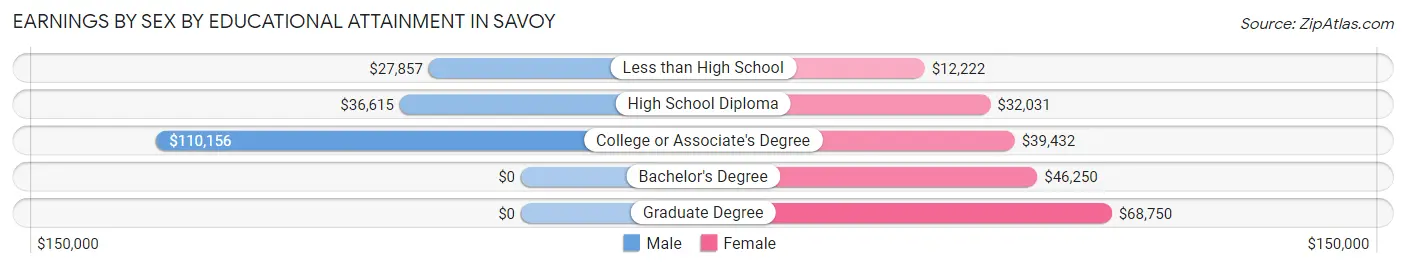
Earnings by Sex by Educational Attainment in Savoy
Average earnings in Savoy are $37,240 for men and $37,727 for women, a difference of 1.3%. Men with an educational attainment of college or associate's degree enjoy the highest average annual earnings of $110,156, while those with less than high school education earn the least with $27,857. Women with an educational attainment of graduate degree earn the most with the average annual earnings of $68,750, while those with less than high school education have the smallest earnings of $12,222.
| Educational Attainment | Male Income | Female Income |
| Less than High School | $27,857 | $12,222 |
| High School Diploma | $36,615 | $32,031 |
| College or Associate's Degree | $110,156 | $39,432 |
| Bachelor's Degree | - | - |
| Graduate Degree | - | - |
| Total | $37,240 | $37,727 |
Family Income in Savoy
Family Income Brackets in Savoy
According to the Savoy family income data, there are 62 families falling into the $50,000 to $74,999 income range, which is the most common income bracket and makes up 27.2% of all families.
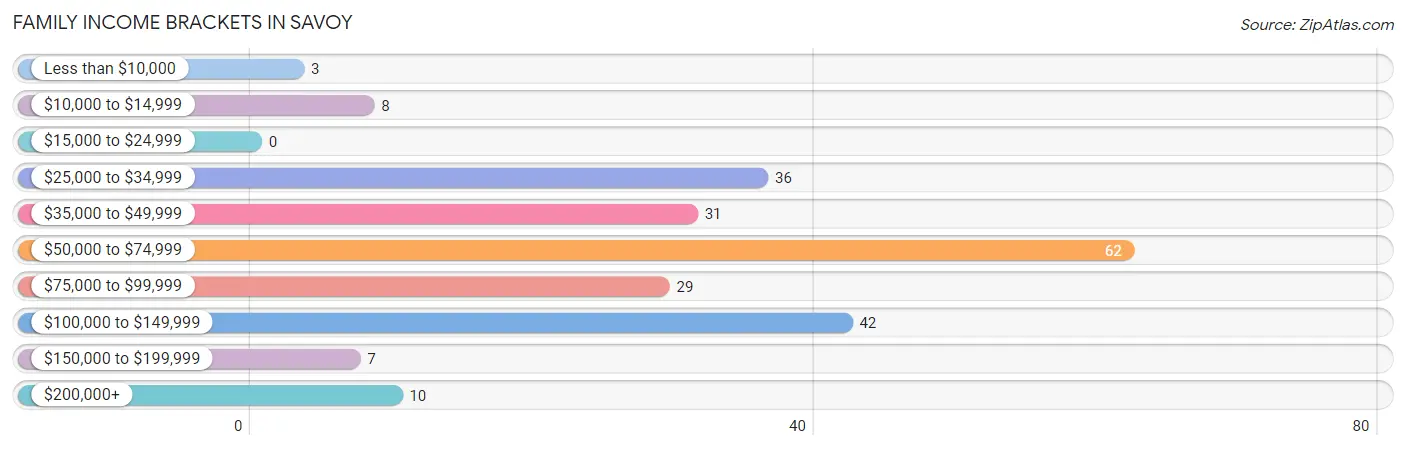
| Income Bracket | # Families | % Families |
| Less than $10,000 | 3 | 1.3% |
| $10,000 to $14,999 | 8 | 3.5% |
| $15,000 to $24,999 | 0 | 0.0% |
| $25,000 to $34,999 | 36 | 15.8% |
| $35,000 to $49,999 | 31 | 13.6% |
| $50,000 to $74,999 | 62 | 27.2% |
| $75,000 to $99,999 | 29 | 12.7% |
| $100,000 to $149,999 | 42 | 18.4% |
| $150,000 to $199,999 | 7 | 3.1% |
| $200,000+ | 10 | 4.4% |
Family Income by Famaliy Size in Savoy
5-person families (26 | 11.4%) account for the highest median family income in Savoy with $81,111 per family, while 2-person families (100 | 43.9%) have the highest median income of $31,042 per family member.
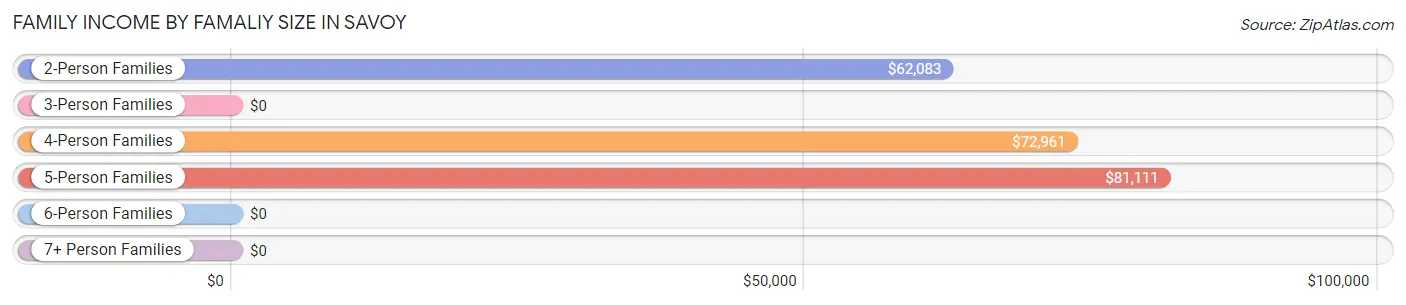
| Income Bracket | # Families | Median Income |
| 2-Person Families | 100 (43.9%) | $62,083 |
| 3-Person Families | 37 (16.2%) | $0 |
| 4-Person Families | 63 (27.6%) | $72,961 |
| 5-Person Families | 26 (11.4%) | $81,111 |
| 6-Person Families | 0 (0.0%) | $0 |
| 7+ Person Families | 2 (0.9%) | $0 |
| Total | 228 (100.0%) | $72,222 |
Family Income by Number of Earners in Savoy
The median family income in Savoy is $72,222, with families comprising 3+ earners (23) having the highest median family income of $109,375, while families with no earners (13) have the lowest median family income of $13,594, accounting for 10.1% and 5.7% of families, respectively.
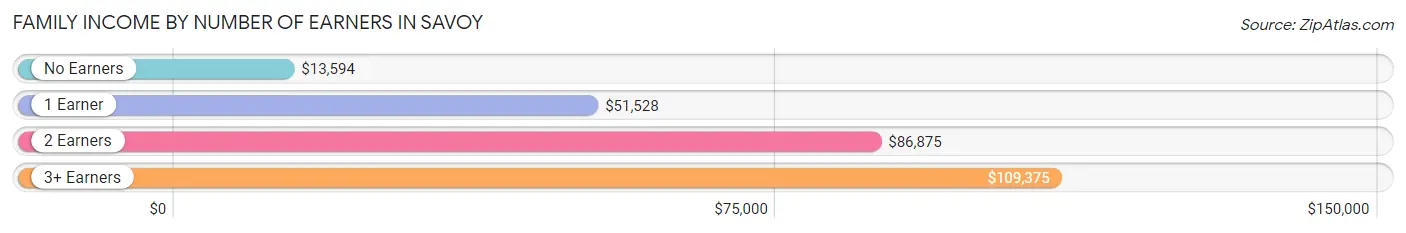
| Number of Earners | # Families | Median Income |
| No Earners | 13 (5.7%) | $13,594 |
| 1 Earner | 121 (53.1%) | $51,528 |
| 2 Earners | 71 (31.1%) | $86,875 |
| 3+ Earners | 23 (10.1%) | $109,375 |
| Total | 228 (100.0%) | $72,222 |
Household Income in Savoy
Household Income Brackets in Savoy
With 85 households falling in the category, the $50,000 to $74,999 income range is the most frequent in Savoy, accounting for 28.0% of all households. In contrast, only 6 households (2.0%) fall into the $15,000 to $24,999 income bracket, making it the least populous group.
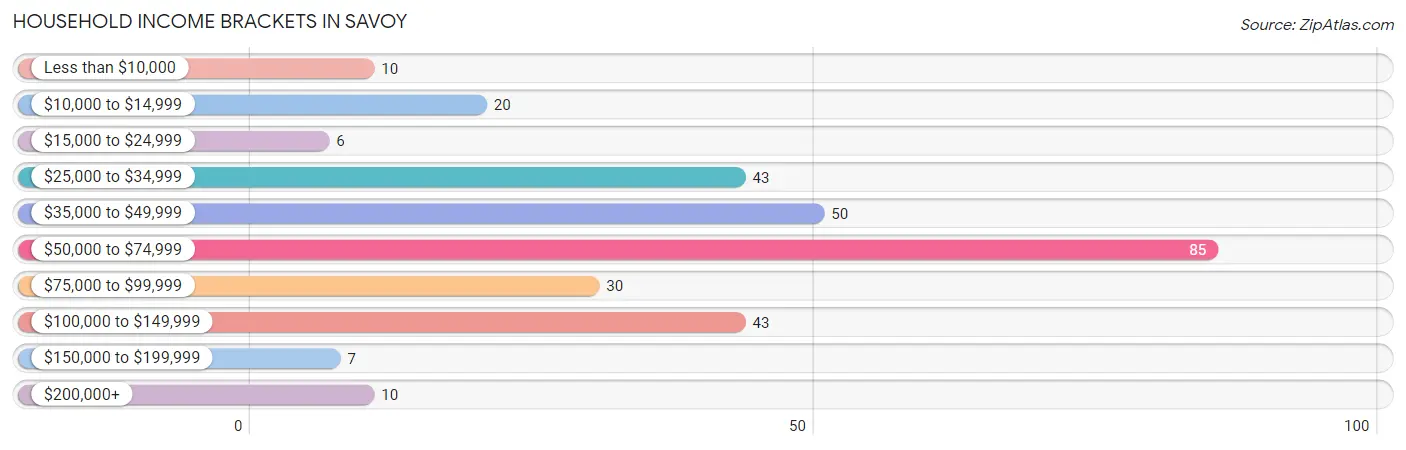
| Income Bracket | # Households | % Households |
| Less than $10,000 | 10 | 3.3% |
| $10,000 to $14,999 | 20 | 6.6% |
| $15,000 to $24,999 | 6 | 2.0% |
| $25,000 to $34,999 | 43 | 14.1% |
| $35,000 to $49,999 | 50 | 16.4% |
| $50,000 to $74,999 | 85 | 28.0% |
| $75,000 to $99,999 | 30 | 9.9% |
| $100,000 to $149,999 | 43 | 14.1% |
| $150,000 to $199,999 | 7 | 2.3% |
| $200,000+ | 10 | 3.3% |
Household Income by Householder Age in Savoy
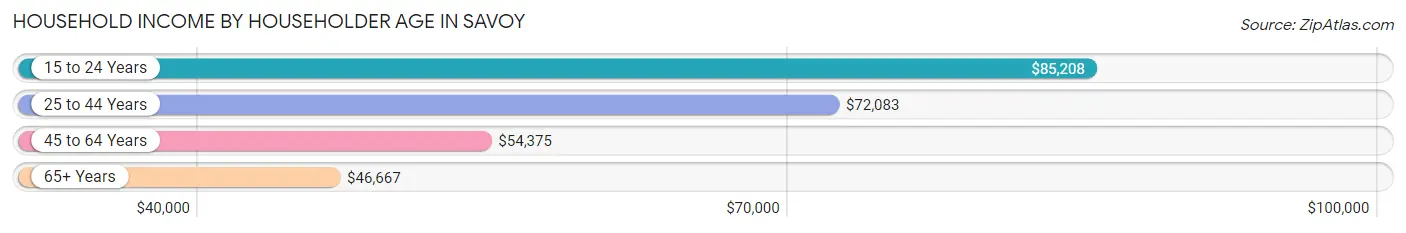
The median household income in Savoy is $54,833, with the highest median household income of $85,208 found in the 15 to 24 years age bracket for the primary householder. A total of 11 households (3.6%) fall into this category. Meanwhile, the 65+ years age bracket for the primary householder has the lowest median household income of $46,667, with 88 households (28.9%) in this group.
| Income Bracket | # Households | Median Income |
| 15 to 24 Years | 11 (3.6%) | $85,208 |
| 25 to 44 Years | 70 (23.0%) | $72,083 |
| 45 to 64 Years | 135 (44.4%) | $54,375 |
| 65+ Years | 88 (28.9%) | $46,667 |
| Total | 304 (100.0%) | $54,833 |
Poverty in Savoy
Income Below Poverty by Sex and Age in Savoy
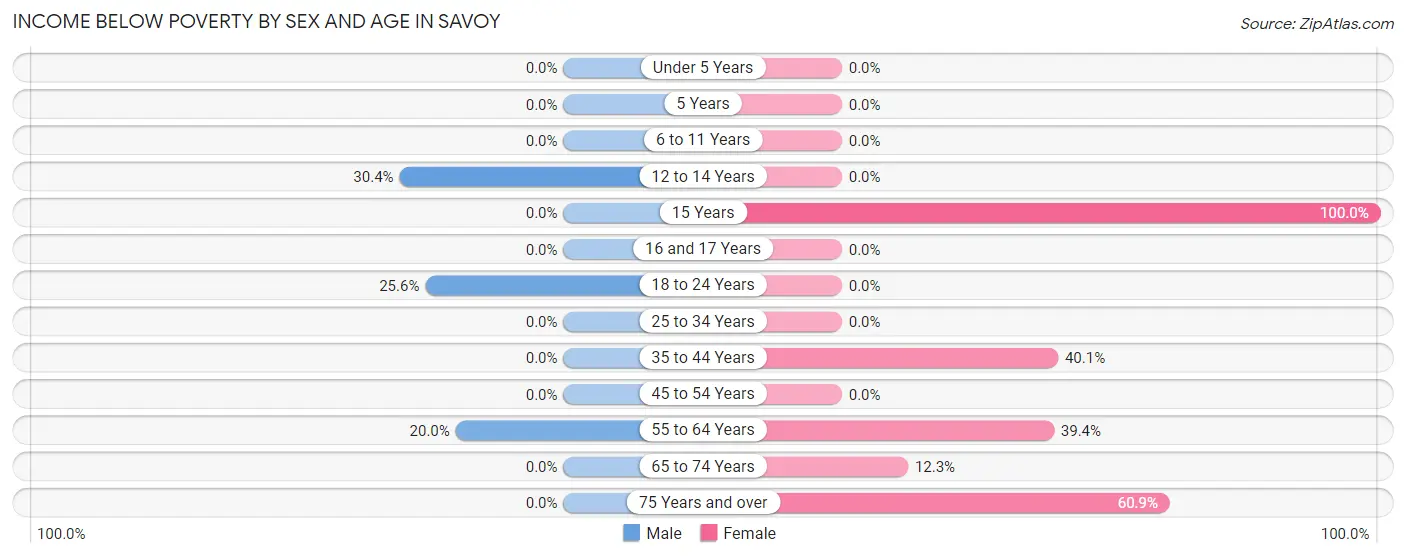
With 10.1% poverty level for males and 25.4% for females among the residents of Savoy, 12 to 14 year old males and 15 year old females are the most vulnerable to poverty, with 14 males (30.4%) and 23 females (100.0%) in their respective age groups living below the poverty level.
| Age Bracket | Male | Female |
| Under 5 Years | 0 (0.0%) | 0 (0.0%) |
| 5 Years | 0 (0.0%) | 0 (0.0%) |
| 6 to 11 Years | 0 (0.0%) | 0 (0.0%) |
| 12 to 14 Years | 14 (30.4%) | 0 (0.0%) |
| 15 Years | 0 (0.0%) | 23 (100.0%) |
| 16 and 17 Years | 0 (0.0%) | 0 (0.0%) |
| 18 to 24 Years | 10 (25.6%) | 0 (0.0%) |
| 25 to 34 Years | 0 (0.0%) | 0 (0.0%) |
| 35 to 44 Years | 0 (0.0%) | 63 (40.1%) |
| 45 to 54 Years | 0 (0.0%) | 0 (0.0%) |
| 55 to 64 Years | 9 (20.0%) | 37 (39.4%) |
| 65 to 74 Years | 0 (0.0%) | 7 (12.3%) |
| 75 Years and over | 0 (0.0%) | 14 (60.9%) |
| Total | 33 (10.1%) | 144 (25.4%) |
Income Above Poverty by Sex and Age in Savoy
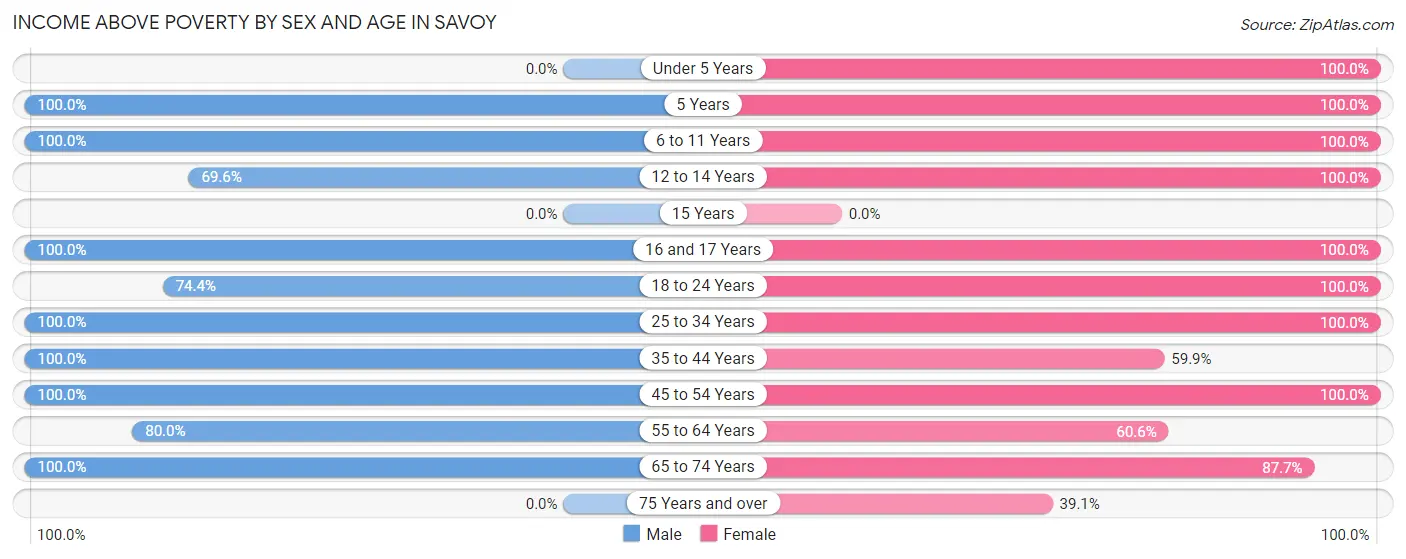
According to the poverty statistics in Savoy, males aged 5 years and females aged under 5 years are the age groups that are most secure financially, with 100.0% of males and 100.0% of females in these age groups living above the poverty line.
| Age Bracket | Male | Female |
| Under 5 Years | 0 (0.0%) | 29 (100.0%) |
| 5 Years | 3 (100.0%) | 2 (100.0%) |
| 6 to 11 Years | 32 (100.0%) | 25 (100.0%) |
| 12 to 14 Years | 32 (69.6%) | 11 (100.0%) |
| 15 Years | 0 (0.0%) | 0 (0.0%) |
| 16 and 17 Years | 7 (100.0%) | 23 (100.0%) |
| 18 to 24 Years | 29 (74.4%) | 17 (100.0%) |
| 25 to 34 Years | 16 (100.0%) | 44 (100.0%) |
| 35 to 44 Years | 54 (100.0%) | 94 (59.9%) |
| 45 to 54 Years | 40 (100.0%) | 62 (100.0%) |
| 55 to 64 Years | 36 (80.0%) | 57 (60.6%) |
| 65 to 74 Years | 44 (100.0%) | 50 (87.7%) |
| 75 Years and over | 0 (0.0%) | 9 (39.1%) |
| Total | 293 (89.9%) | 423 (74.6%) |
Income Below Poverty Among Married-Couple Families in Savoy
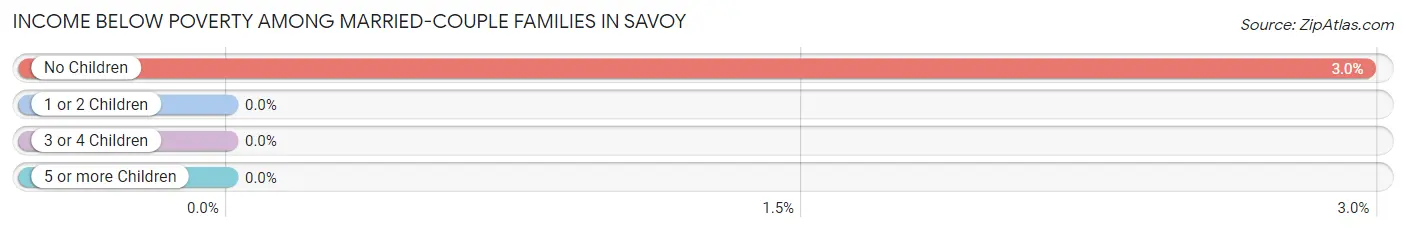
The poverty statistics for married-couple families in Savoy show that 2.3% or 3 of the total 132 families live below the poverty line. Families with no children have the highest poverty rate of 3.0%, comprising of 3 families. On the other hand, families with 1 or 2 children have the lowest poverty rate of 0.0%, which includes 0 families.
| Children | Above Poverty | Below Poverty |
| No Children | 98 (97.0%) | 3 (3.0%) |
| 1 or 2 Children | 29 (100.0%) | 0 (0.0%) |
| 3 or 4 Children | 2 (100.0%) | 0 (0.0%) |
| 5 or more Children | 0 (0.0%) | 0 (0.0%) |
| Total | 129 (97.7%) | 3 (2.3%) |
Income Below Poverty Among Single-Parent Households in Savoy
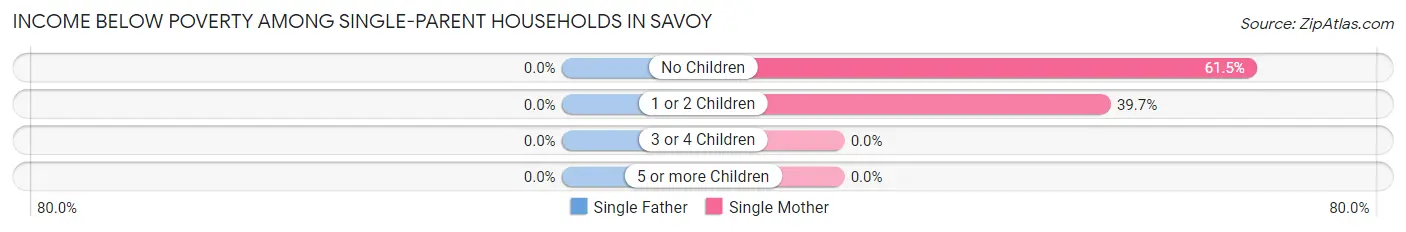
| Children | Single Father | Single Mother |
| No Children | 0 (0.0%) | 8 (61.5%) |
| 1 or 2 Children | 0 (0.0%) | 25 (39.7%) |
| 3 or 4 Children | 0 (0.0%) | 0 (0.0%) |
| 5 or more Children | 0 (0.0%) | 0 (0.0%) |
| Total | 0 (0.0%) | 33 (34.4%) |
Income Below Poverty Among Married-Couple vs Single-Parent Households in Savoy
The poverty data for Savoy shows that 3 of the married-couple family households (2.3%) and 33 of the single-parent households (34.4%) are living below the poverty level. Within the married-couple family households, those with no children have the highest poverty rate, with 3 households (3.0%) falling below the poverty line. Among the single-parent households, those with no children have the highest poverty rate, with 8 household (61.5%) living below poverty.
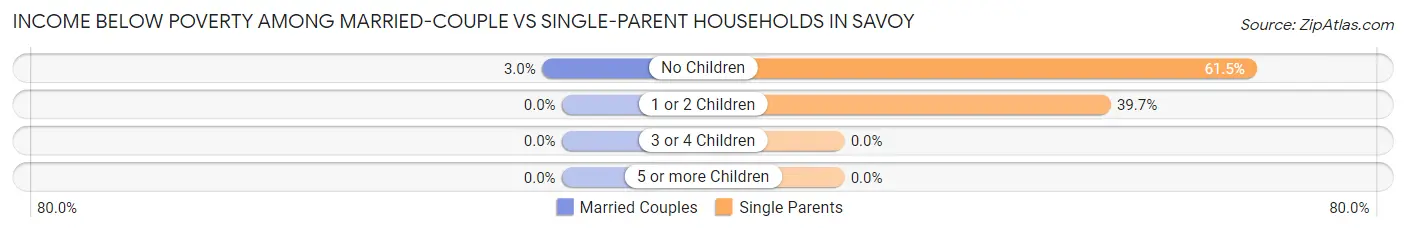
| Children | Married-Couple Families | Single-Parent Households |
| No Children | 3 (3.0%) | 8 (61.5%) |
| 1 or 2 Children | 0 (0.0%) | 25 (39.7%) |
| 3 or 4 Children | 0 (0.0%) | 0 (0.0%) |
| 5 or more Children | 0 (0.0%) | 0 (0.0%) |
| Total | 3 (2.3%) | 33 (34.4%) |
Race in Savoy
The most populous races in Savoy are White / Caucasian (867 | 90.2%), Hispanic or Latino (146 | 15.2%), and Two or more Races (65 | 6.8%).
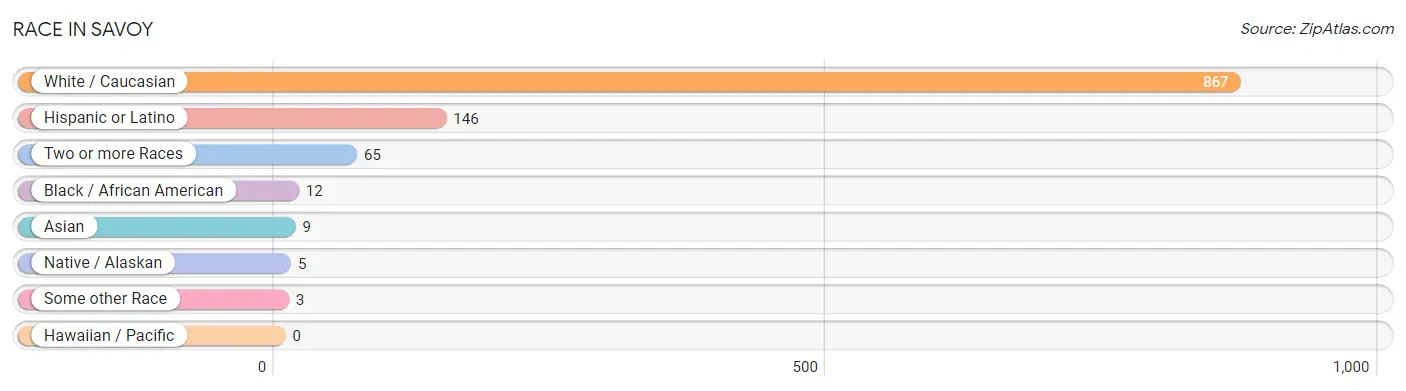
| Race | # Population | % Population |
| Asian | 9 | 0.9% |
| Black / African American | 12 | 1.3% |
| Hawaiian / Pacific | 0 | 0.0% |
| Hispanic or Latino | 146 | 15.2% |
| Native / Alaskan | 5 | 0.5% |
| White / Caucasian | 867 | 90.2% |
| Two or more Races | 65 | 6.8% |
| Some other Race | 3 | 0.3% |
| Total | 961 | 100.0% |
Ancestry in Savoy
The most populous ancestries reported in Savoy are Irish (152 | 15.8%), German (115 | 12.0%), English (60 | 6.2%), Dutch (37 | 3.8%), and Mexican (32 | 3.3%), together accounting for 41.2% of all Savoy residents.
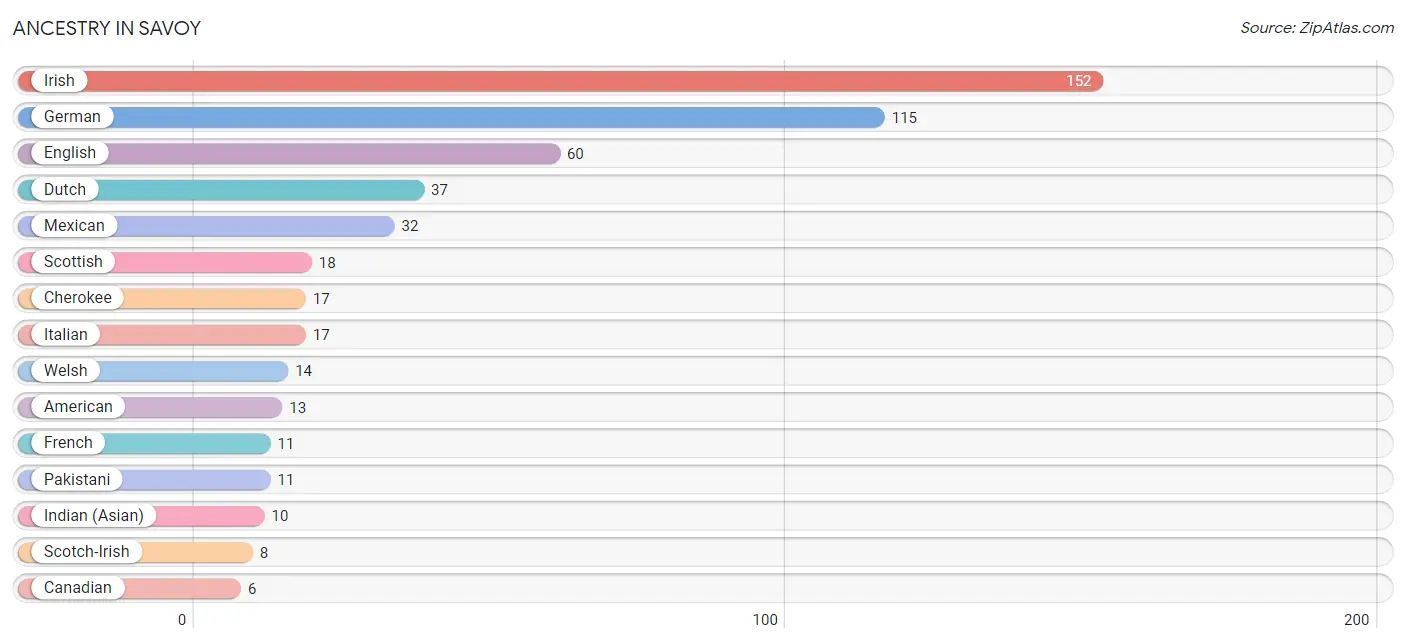
| Ancestry | # Population | % Population |
| American | 13 | 1.3% |
| Blackfeet | 3 | 0.3% |
| Canadian | 6 | 0.6% |
| Cherokee | 17 | 1.8% |
| Chickasaw | 1 | 0.1% |
| Choctaw | 3 | 0.3% |
| Delaware | 1 | 0.1% |
| Dutch | 37 | 3.8% |
| English | 60 | 6.2% |
| European | 6 | 0.6% |
| French | 11 | 1.1% |
| German | 115 | 12.0% |
| Indian (Asian) | 10 | 1.0% |
| Irish | 152 | 15.8% |
| Italian | 17 | 1.8% |
| Mexican | 32 | 3.3% |
| Pakistani | 11 | 1.1% |
| Scotch-Irish | 8 | 0.8% |
| Scottish | 18 | 1.9% |
| Welsh | 14 | 1.5% | View All 20 Rows |
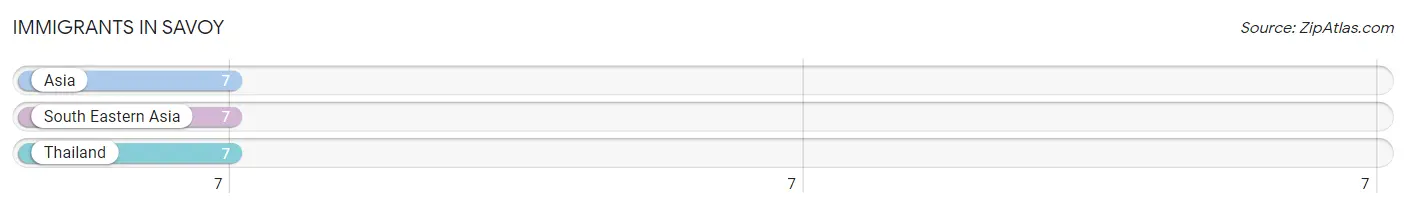
Immigrants in Savoy
The most numerous immigrant groups reported in Savoy came from Asia (7 | 0.7%), South Eastern Asia (7 | 0.7%), and Thailand (7 | 0.7%), together accounting for 2.2% of all Savoy residents.
| Immigration Origin | # Population | % Population |
| Asia | 7 | 0.7% |
| South Eastern Asia | 7 | 0.7% |
| Thailand | 7 | 0.7% | View All 3 Rows |
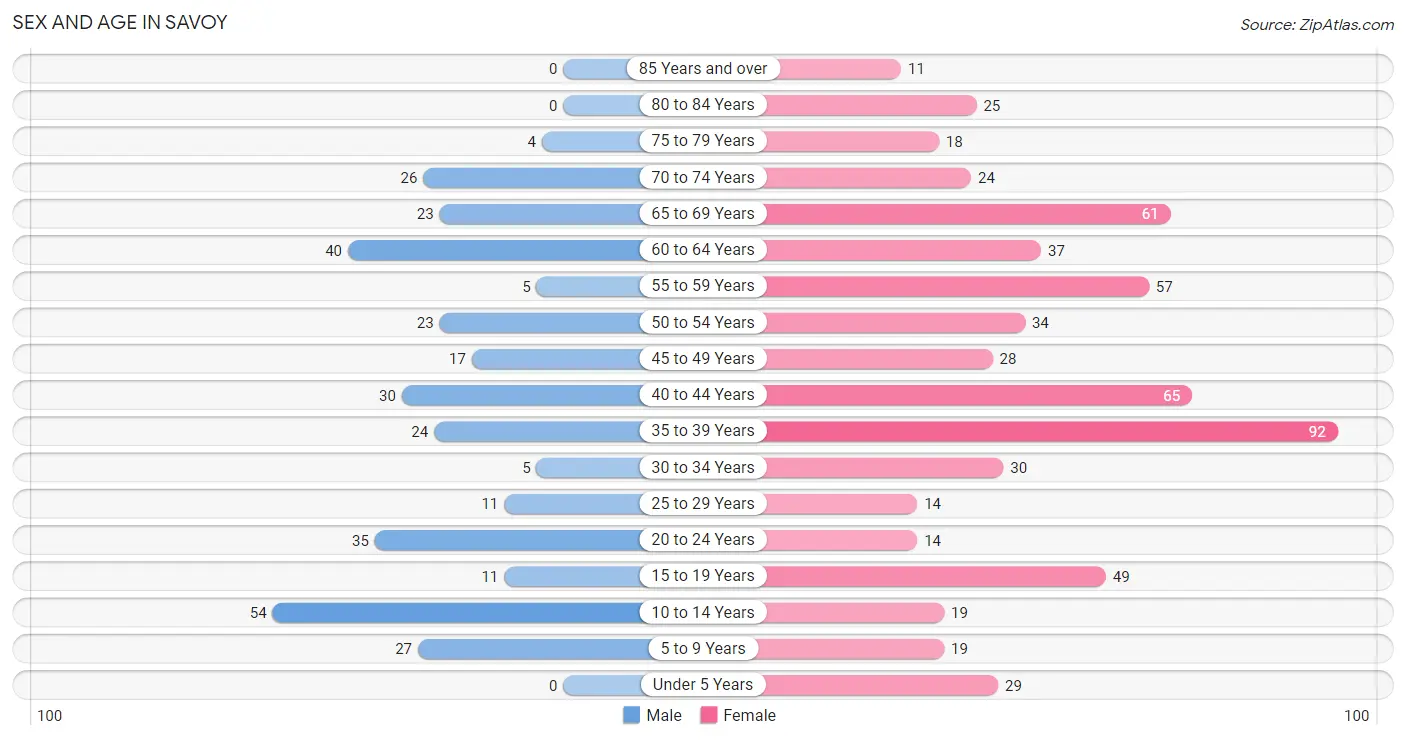
Sex and Age in Savoy
Sex and Age in Savoy
The most populous age groups in Savoy are 10 to 14 Years (54 | 16.1%) for men and 35 to 39 Years (92 | 14.7%) for women.
| Age Bracket | Male | Female |
| Under 5 Years | 0 (0.0%) | 29 (4.6%) |
| 5 to 9 Years | 27 (8.1%) | 19 (3.0%) |
| 10 to 14 Years | 54 (16.1%) | 19 (3.0%) |
| 15 to 19 Years | 11 (3.3%) | 49 (7.8%) |
| 20 to 24 Years | 35 (10.4%) | 14 (2.2%) |
| 25 to 29 Years | 11 (3.3%) | 14 (2.2%) |
| 30 to 34 Years | 5 (1.5%) | 30 (4.8%) |
| 35 to 39 Years | 24 (7.2%) | 92 (14.7%) |
| 40 to 44 Years | 30 (9.0%) | 65 (10.4%) |
| 45 to 49 Years | 17 (5.1%) | 28 (4.5%) |
| 50 to 54 Years | 23 (6.9%) | 34 (5.4%) |
| 55 to 59 Years | 5 (1.5%) | 57 (9.1%) |
| 60 to 64 Years | 40 (11.9%) | 37 (5.9%) |
| 65 to 69 Years | 23 (6.9%) | 61 (9.7%) |
| 70 to 74 Years | 26 (7.8%) | 24 (3.8%) |
| 75 to 79 Years | 4 (1.2%) | 18 (2.9%) |
| 80 to 84 Years | 0 (0.0%) | 25 (4.0%) |
| 85 Years and over | 0 (0.0%) | 11 (1.8%) |
| Total | 335 (100.0%) | 626 (100.0%) |
Families and Households in Savoy
Median Family Size in Savoy
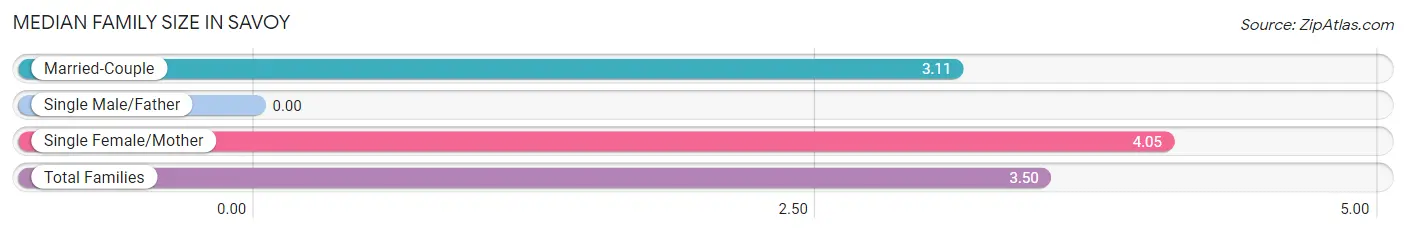
| Family Type | # Families | Family Size |
| Married-Couple | 132 (57.9%) | 3.11 |
| Single Male/Father | 0 (0.0%) | - |
| Single Female/Mother | 96 (42.1%) | 4.05 |
| Total Families | 228 (100.0%) | 3.50 |
Median Household Size in Savoy
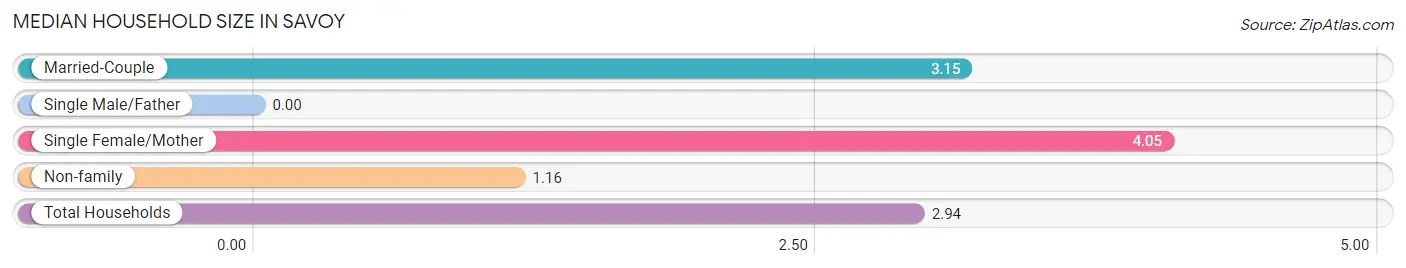
| Household Type | # Households | Household Size |
| Married-Couple | 132 (43.4%) | 3.15 |
| Single Male/Father | 0 (0.0%) | - |
| Single Female/Mother | 96 (31.6%) | 4.05 |
| Non-family | 76 (25.0%) | 1.16 |
| Total Households | 304 (100.0%) | 2.94 |
Household Size by Marriage Status in Savoy
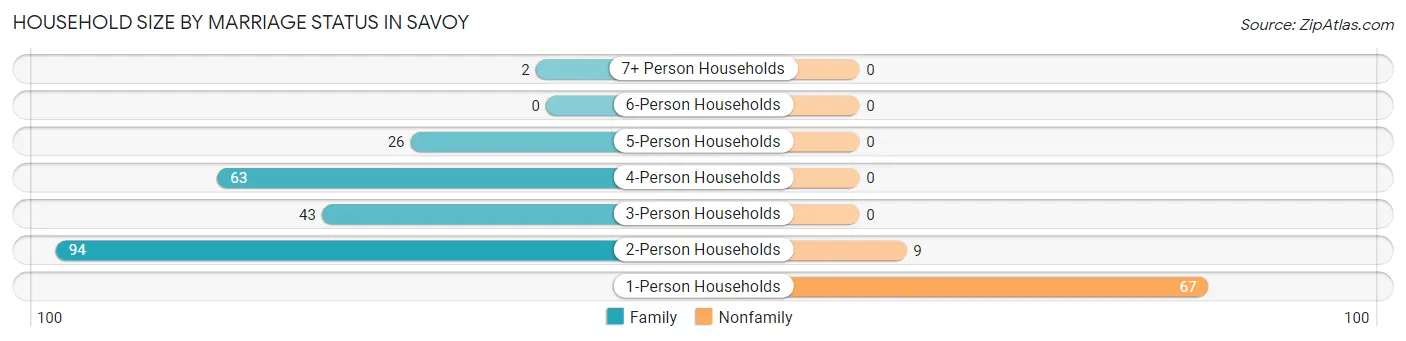
Out of a total of 304 households in Savoy, 228 (75.0%) are family households, while 76 (25.0%) are nonfamily households. The most numerous type of family households are 2-person households, comprising 94, and the most common type of nonfamily households are 1-person households, comprising 67.
| Household Size | Family Households | Nonfamily Households |
| 1-Person Households | - | 67 (22.0%) |
| 2-Person Households | 94 (30.9%) | 9 (3.0%) |
| 3-Person Households | 43 (14.1%) | 0 (0.0%) |
| 4-Person Households | 63 (20.7%) | 0 (0.0%) |
| 5-Person Households | 26 (8.6%) | 0 (0.0%) |
| 6-Person Households | 0 (0.0%) | 0 (0.0%) |
| 7+ Person Households | 2 (0.7%) | 0 (0.0%) |
| Total | 228 (75.0%) | 76 (25.0%) |
Female Fertility in Savoy
Fertility by Age in Savoy
| Age Bracket | Women with Births | Births / 1,000 Women |
| 15 to 19 years | 0 (0.0%) | 0.0 |
| 20 to 34 years | 0 (0.0%) | 0.0 |
| 35 to 50 years | 0 (0.0%) | 0.0 |
| Total | 0 (0.0%) | 0.0 |
Fertility by Age by Marriage Status in Savoy
| Age Bracket | Married | Unmarried |
| 15 to 19 years | 0 (0.0%) | 0 (0.0%) |
| 20 to 34 years | 0 (0.0%) | 0 (0.0%) |
| 35 to 50 years | 0 (0.0%) | 0 (0.0%) |
| Total | 0 (0.0%) | 0 (0.0%) |
Fertility by Education in Savoy
| Educational Attainment | Women with Births | Births / 1,000 Women |
| Less than High School | 0 (0.0%) | 0.0 |
| High School Diploma | 0 (0.0%) | 0.0 |
| College or Associate's Degree | 0 (0.0%) | 0.0 |
| Bachelor's Degree | 0 (0.0%) | 0.0 |
| Graduate Degree | 0 (0.0%) | 0.0 |
| Total | 0 (0.0%) | 0.0 |
Fertility by Education by Marriage Status in Savoy
| Educational Attainment | Married | Unmarried |
| Less than High School | 0 (0.0%) | 0 (0.0%) |
| High School Diploma | 0 (0.0%) | 0 (0.0%) |
| College or Associate's Degree | 0 (0.0%) | 0 (0.0%) |
| Bachelor's Degree | 0 (0.0%) | 0 (0.0%) |
| Graduate Degree | 0 (0.0%) | 0 (0.0%) |
| Total | 0 (0.0%) | 0 (0.0%) |
Employment Characteristics in Savoy
Employment by Class of Employer in Savoy
Among the 464 employed individuals in Savoy, private company employees (241 | 51.9%), self-employed (not incorporated) (87 | 18.8%), and local government employees (53 | 11.4%) make up the most common classes of employment.
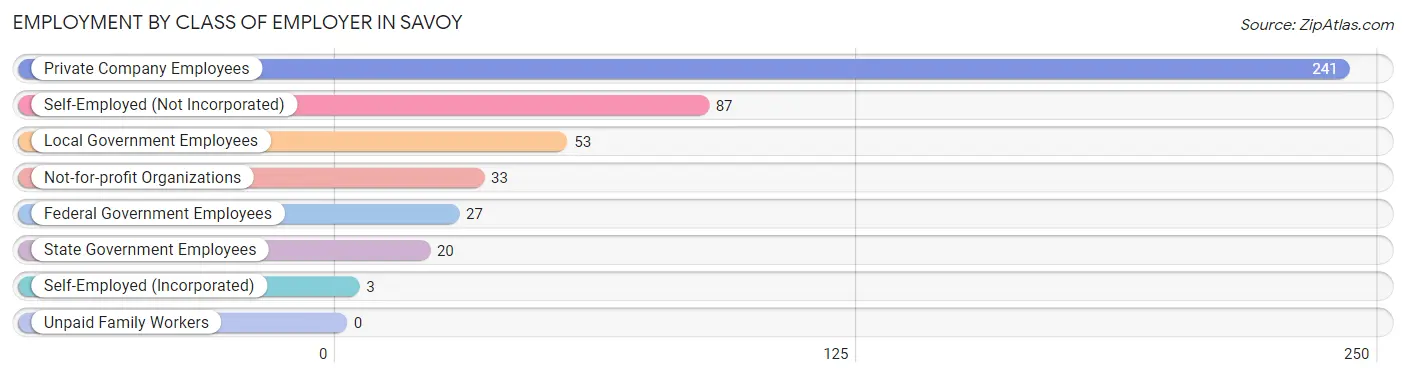
| Employer Class | # Employees | % Employees |
| Private Company Employees | 241 | 51.9% |
| Self-Employed (Incorporated) | 3 | 0.6% |
| Self-Employed (Not Incorporated) | 87 | 18.8% |
| Not-for-profit Organizations | 33 | 7.1% |
| Local Government Employees | 53 | 11.4% |
| State Government Employees | 20 | 4.3% |
| Federal Government Employees | 27 | 5.8% |
| Unpaid Family Workers | 0 | 0.0% |
| Total | 464 | 100.0% |
Employment Status by Age in Savoy
According to the labor force statistics for Savoy, out of the total population over 16 years of age (790), 59.5% or 470 individuals are in the labor force, with 1.3% or 6 of them unemployed. The age group with the highest labor force participation rate is 45 to 54 years, with 98.0% or 100 individuals in the labor force. Within the labor force, the 25 to 29 years age range has the highest percentage of unemployed individuals, with 26.1% or 6 of them being unemployed.
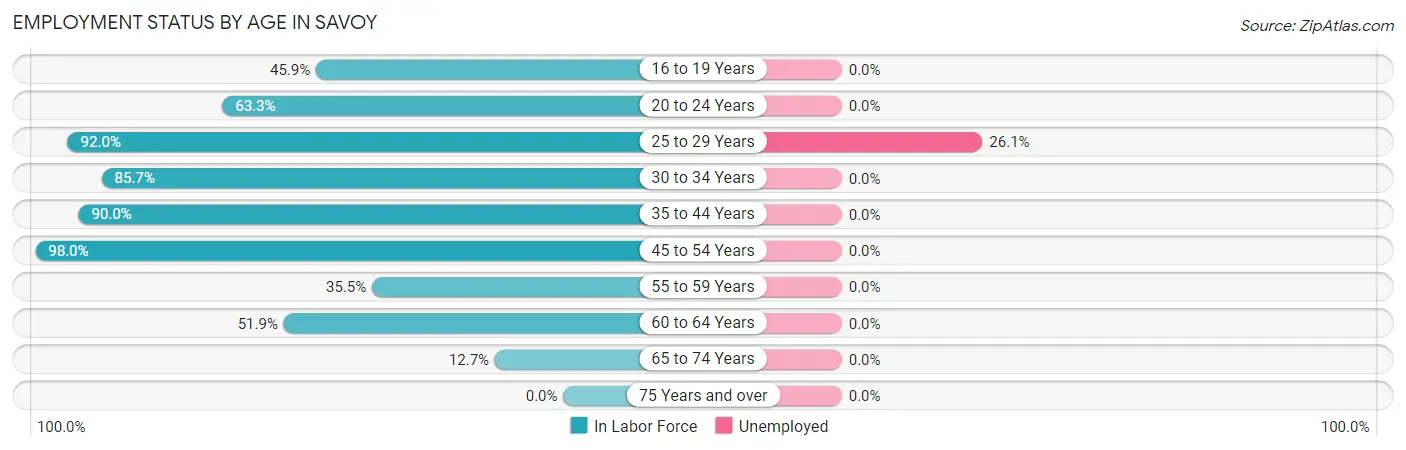
| Age Bracket | In Labor Force | Unemployed |
| 16 to 19 Years | 17 (45.9%) | 0 (0.0%) |
| 20 to 24 Years | 31 (63.3%) | 0 (0.0%) |
| 25 to 29 Years | 23 (92.0%) | 6 (26.1%) |
| 30 to 34 Years | 30 (85.7%) | 0 (0.0%) |
| 35 to 44 Years | 190 (90.0%) | 0 (0.0%) |
| 45 to 54 Years | 100 (98.0%) | 0 (0.0%) |
| 55 to 59 Years | 22 (35.5%) | 0 (0.0%) |
| 60 to 64 Years | 40 (51.9%) | 0 (0.0%) |
| 65 to 74 Years | 17 (12.7%) | 0 (0.0%) |
| 75 Years and over | 0 (0.0%) | 0 (0.0%) |
| Total | 470 (59.5%) | 6 (1.3%) |
Employment Status by Educational Attainment in Savoy
According to labor force statistics for Savoy, 79.1% of individuals (405) out of the total population between 25 and 64 years of age (512) are in the labor force, with 1.5% or 6 of them being unemployed. The group with the highest labor force participation rate are those with the educational attainment of college / associate degree, with 88.4% or 198 individuals in the labor force. Within the labor force, individuals with college / associate degree education have the highest percentage of unemployment, with 3.0% or 6 of them being unemployed.
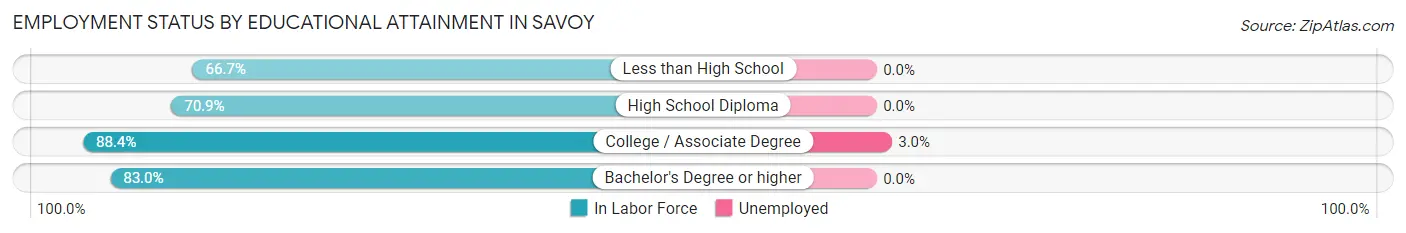
| Educational Attainment | In Labor Force | Unemployed |
| Less than High School | 44 (66.7%) | 0 (0.0%) |
| High School Diploma | 124 (70.9%) | 0 (0.0%) |
| College / Associate Degree | 198 (88.4%) | 7 (3.0%) |
| Bachelor's Degree or higher | 39 (83.0%) | 0 (0.0%) |
| Total | 405 (79.1%) | 8 (1.5%) |
Employment Occupations by Sex in Savoy
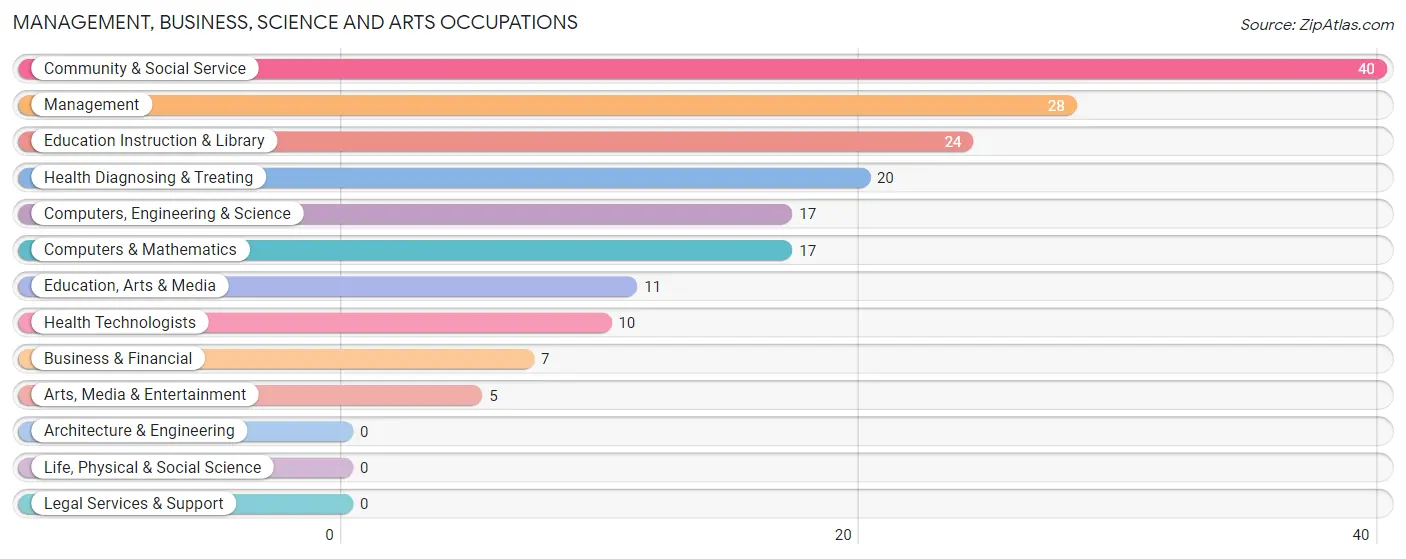
Management, Business, Science and Arts Occupations
The most common Management, Business, Science and Arts occupations in Savoy are Community & Social Service (40 | 8.6%), Management (28 | 6.0%), Education Instruction & Library (24 | 5.2%), Health Diagnosing & Treating (20 | 4.3%), and Computers, Engineering & Science (17 | 3.7%).
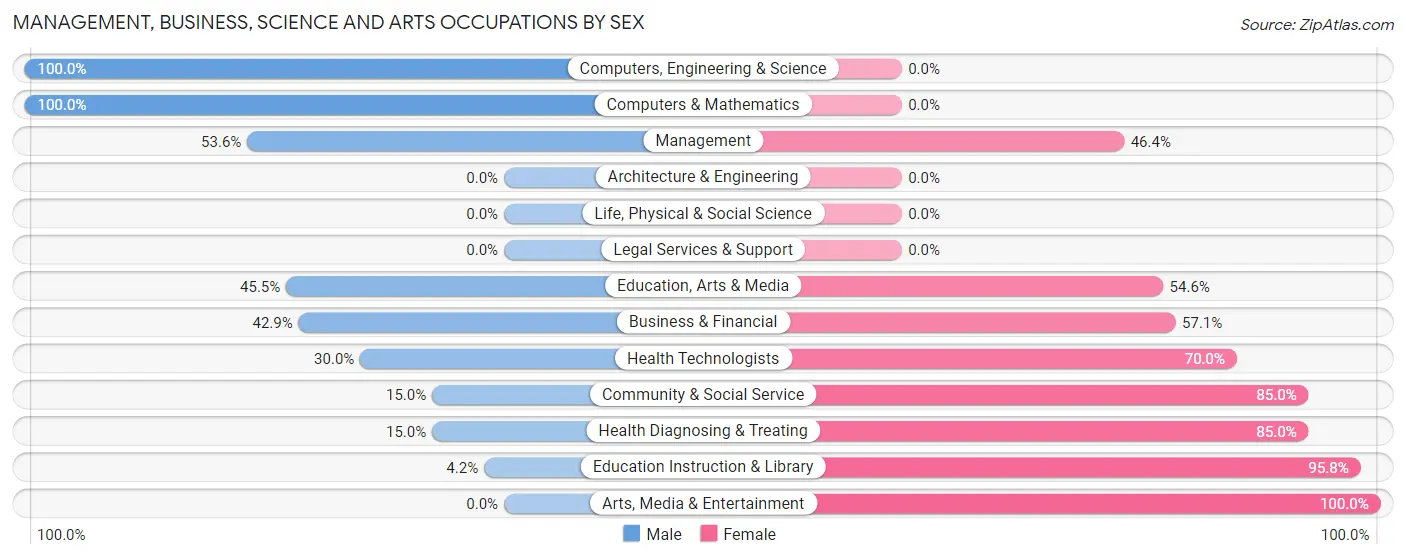
Management, Business, Science and Arts Occupations by Sex
Within the Management, Business, Science and Arts occupations in Savoy, the most male-oriented occupations are Computers, Engineering & Science (100.0%), Computers & Mathematics (100.0%), and Management (53.6%), while the most female-oriented occupations are Arts, Media & Entertainment (100.0%), Education Instruction & Library (95.8%), and Community & Social Service (85.0%).
| Occupation | Male | Female |
| Management | 15 (53.6%) | 13 (46.4%) |
| Business & Financial | 3 (42.9%) | 4 (57.1%) |
| Computers, Engineering & Science | 17 (100.0%) | 0 (0.0%) |
| Computers & Mathematics | 17 (100.0%) | 0 (0.0%) |
| Architecture & Engineering | 0 (0.0%) | 0 (0.0%) |
| Life, Physical & Social Science | 0 (0.0%) | 0 (0.0%) |
| Community & Social Service | 6 (15.0%) | 34 (85.0%) |
| Education, Arts & Media | 5 (45.5%) | 6 (54.5%) |
| Legal Services & Support | 0 (0.0%) | 0 (0.0%) |
| Education Instruction & Library | 1 (4.2%) | 23 (95.8%) |
| Arts, Media & Entertainment | 0 (0.0%) | 5 (100.0%) |
| Health Diagnosing & Treating | 3 (15.0%) | 17 (85.0%) |
| Health Technologists | 3 (30.0%) | 7 (70.0%) |
| Total (Category) | 44 (39.3%) | 68 (60.7%) |
| Total (Overall) | 162 (34.9%) | 302 (65.1%) |
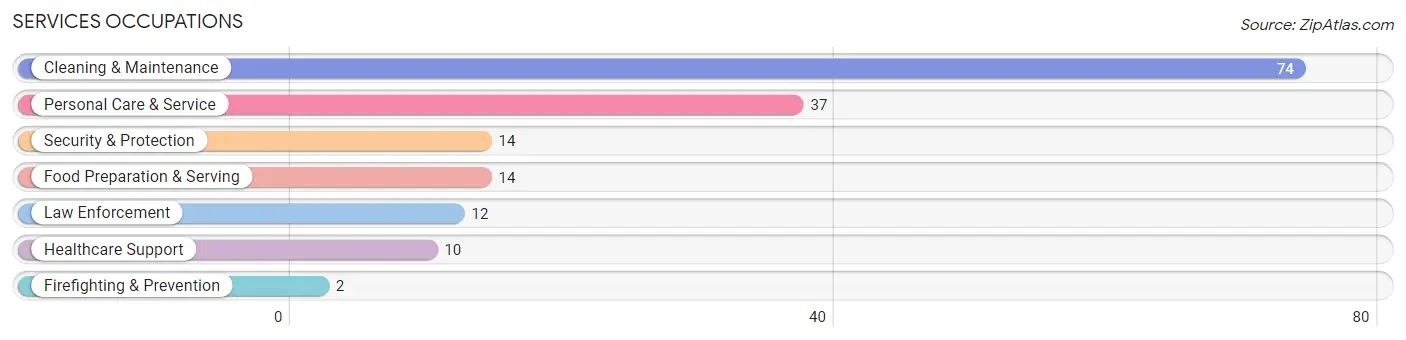
Services Occupations
The most common Services occupations in Savoy are Cleaning & Maintenance (74 | 16.0%), Personal Care & Service (37 | 8.0%), Security & Protection (14 | 3.0%), Food Preparation & Serving (14 | 3.0%), and Law Enforcement (12 | 2.6%).
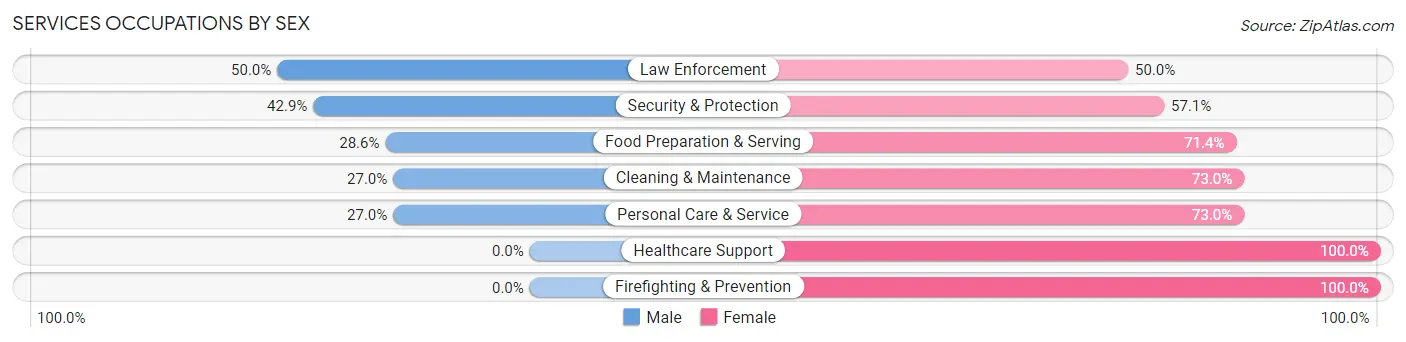
Services Occupations by Sex
Within the Services occupations in Savoy, the most male-oriented occupations are Law Enforcement (50.0%), Security & Protection (42.9%), and Food Preparation & Serving (28.6%), while the most female-oriented occupations are Healthcare Support (100.0%), Firefighting & Prevention (100.0%), and Cleaning & Maintenance (73.0%).
| Occupation | Male | Female |
| Healthcare Support | 0 (0.0%) | 10 (100.0%) |
| Security & Protection | 6 (42.9%) | 8 (57.1%) |
| Firefighting & Prevention | 0 (0.0%) | 2 (100.0%) |
| Law Enforcement | 6 (50.0%) | 6 (50.0%) |
| Food Preparation & Serving | 4 (28.6%) | 10 (71.4%) |
| Cleaning & Maintenance | 20 (27.0%) | 54 (73.0%) |
| Personal Care & Service | 10 (27.0%) | 27 (73.0%) |
| Total (Category) | 40 (26.9%) | 109 (73.2%) |
| Total (Overall) | 162 (34.9%) | 302 (65.1%) |
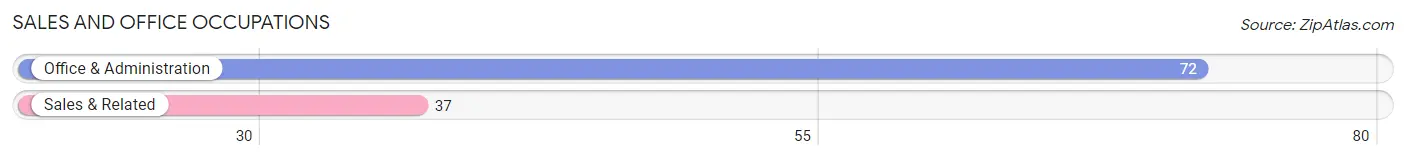
Sales and Office Occupations
The most common Sales and Office occupations in Savoy are Office & Administration (72 | 15.5%), and Sales & Related (37 | 8.0%).
Sales and Office Occupations by Sex
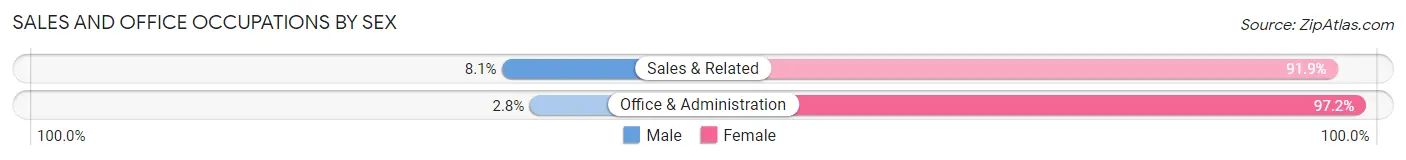
| Occupation | Male | Female |
| Sales & Related | 3 (8.1%) | 34 (91.9%) |
| Office & Administration | 2 (2.8%) | 70 (97.2%) |
| Total (Category) | 5 (4.6%) | 104 (95.4%) |
| Total (Overall) | 162 (34.9%) | 302 (65.1%) |
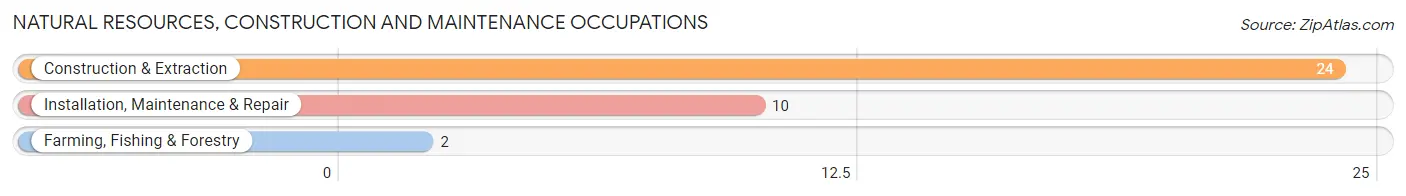
Natural Resources, Construction and Maintenance Occupations
The most common Natural Resources, Construction and Maintenance occupations in Savoy are Construction & Extraction (24 | 5.2%), Installation, Maintenance & Repair (10 | 2.2%), and Farming, Fishing & Forestry (2 | 0.4%).
Natural Resources, Construction and Maintenance Occupations by Sex
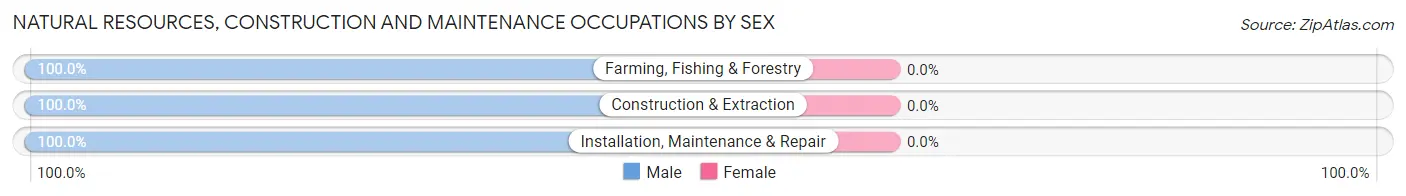
| Occupation | Male | Female |
| Farming, Fishing & Forestry | 2 (100.0%) | 0 (0.0%) |
| Construction & Extraction | 24 (100.0%) | 0 (0.0%) |
| Installation, Maintenance & Repair | 10 (100.0%) | 0 (0.0%) |
| Total (Category) | 36 (100.0%) | 0 (0.0%) |
| Total (Overall) | 162 (34.9%) | 302 (65.1%) |
Production, Transportation and Moving Occupations
The most common Production, Transportation and Moving occupations in Savoy are Transportation (27 | 5.8%), Production (22 | 4.7%), and Material Moving (9 | 1.9%).
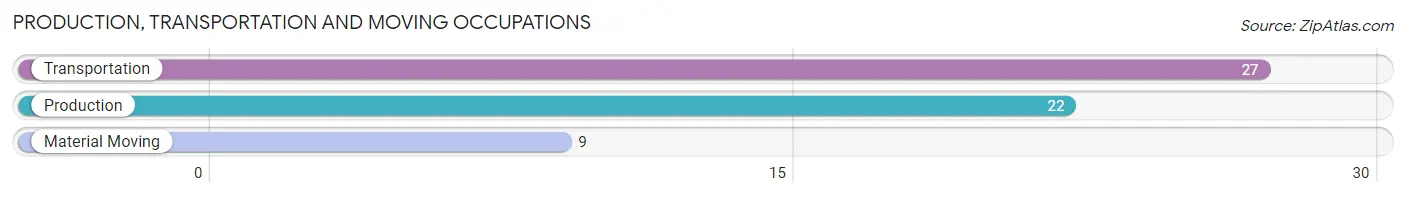
Production, Transportation and Moving Occupations by Sex
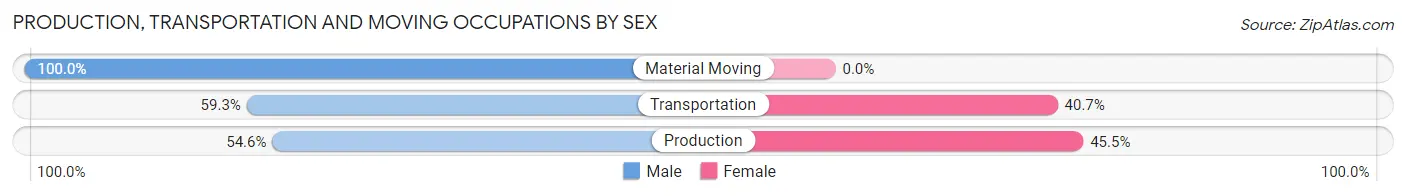
| Occupation | Male | Female |
| Production | 12 (54.5%) | 10 (45.5%) |
| Transportation | 16 (59.3%) | 11 (40.7%) |
| Material Moving | 9 (100.0%) | 0 (0.0%) |
| Total (Category) | 37 (63.8%) | 21 (36.2%) |
| Total (Overall) | 162 (34.9%) | 302 (65.1%) |
Employment Industries by Sex in Savoy
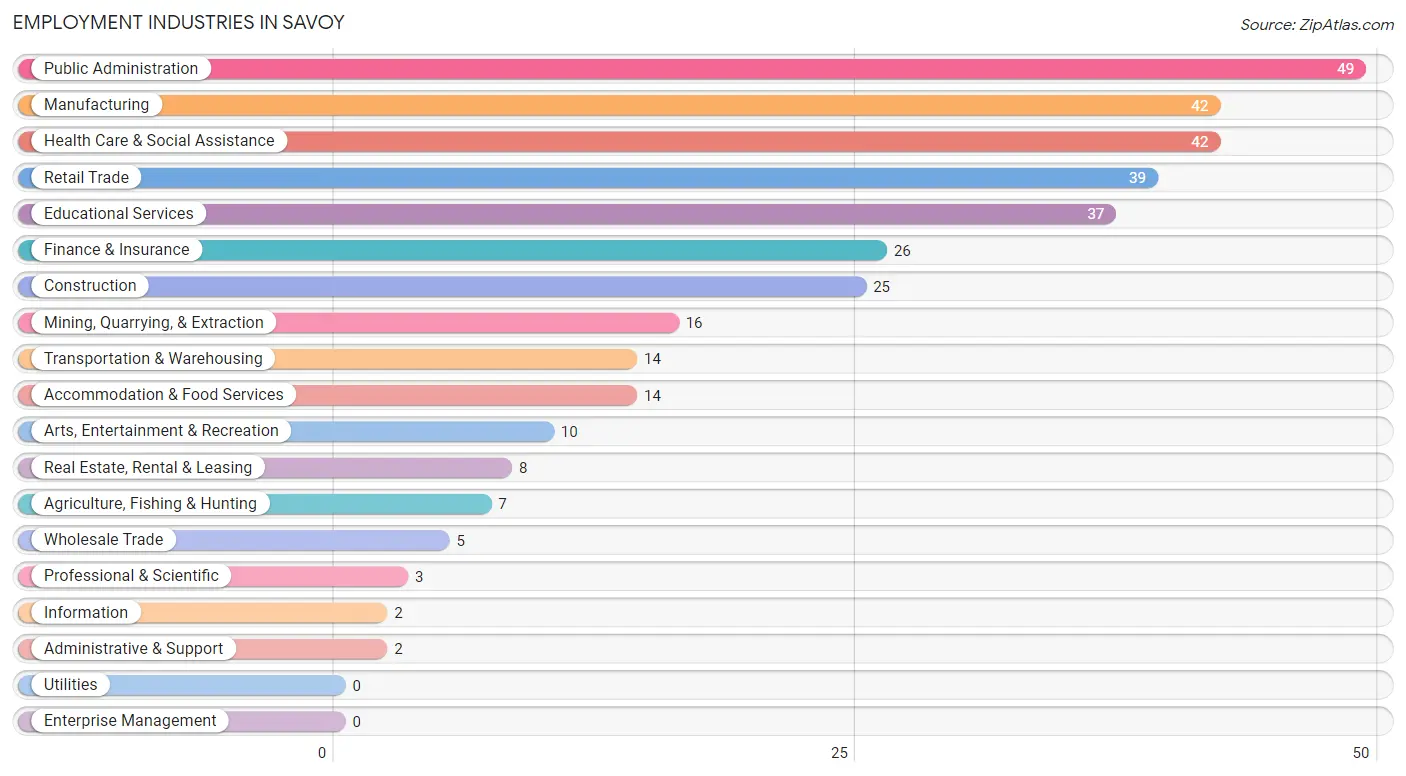
Employment Industries in Savoy
The major employment industries in Savoy include Public Administration (49 | 10.6%), Manufacturing (42 | 9.0%), Health Care & Social Assistance (42 | 9.0%), Retail Trade (39 | 8.4%), and Educational Services (37 | 8.0%).
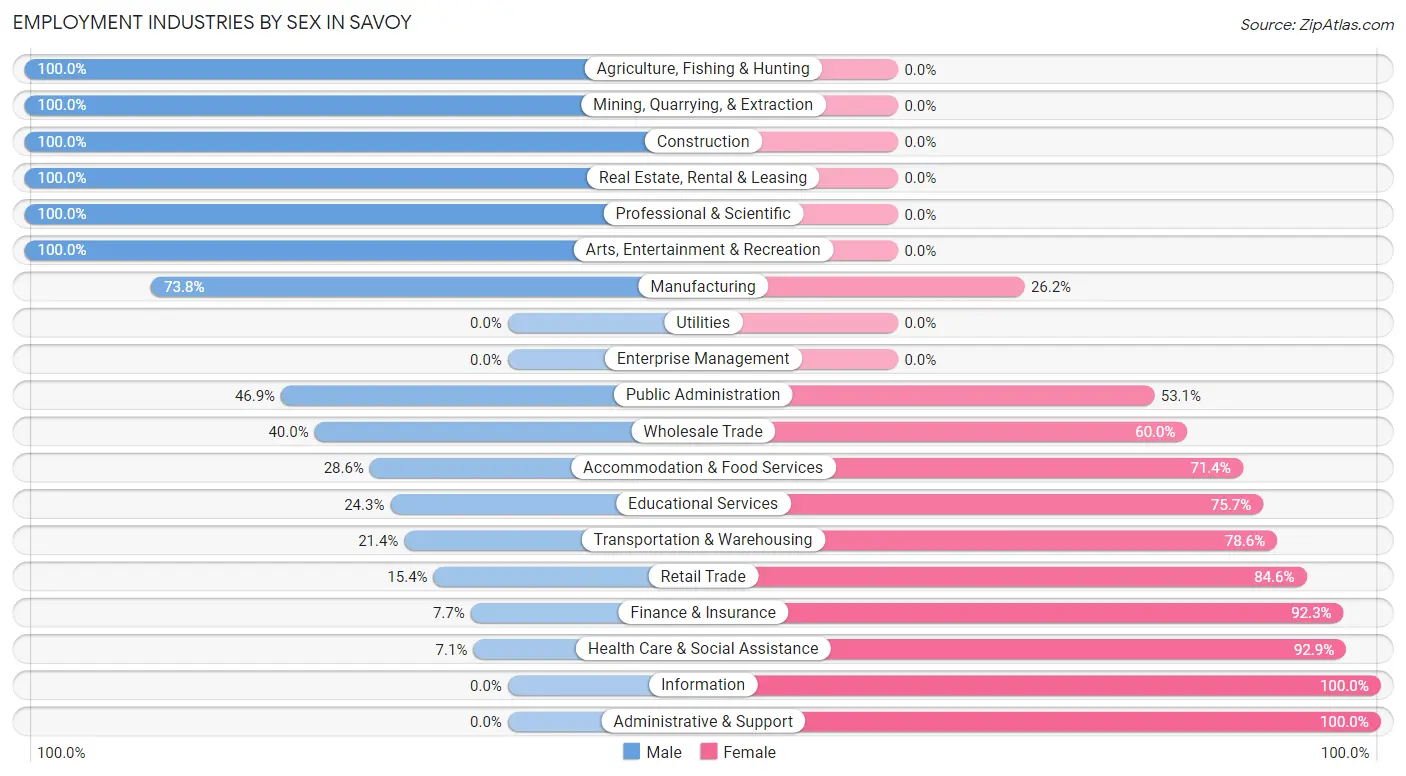
Employment Industries by Sex in Savoy
The Savoy industries that see more men than women are Agriculture, Fishing & Hunting (100.0%), Mining, Quarrying, & Extraction (100.0%), and Construction (100.0%), whereas the industries that tend to have a higher number of women are Information (100.0%), Administrative & Support (100.0%), and Health Care & Social Assistance (92.9%).
| Industry | Male | Female |
| Agriculture, Fishing & Hunting | 7 (100.0%) | 0 (0.0%) |
| Mining, Quarrying, & Extraction | 16 (100.0%) | 0 (0.0%) |
| Construction | 25 (100.0%) | 0 (0.0%) |
| Manufacturing | 31 (73.8%) | 11 (26.2%) |
| Wholesale Trade | 2 (40.0%) | 3 (60.0%) |
| Retail Trade | 6 (15.4%) | 33 (84.6%) |
| Transportation & Warehousing | 3 (21.4%) | 11 (78.6%) |
| Utilities | 0 (0.0%) | 0 (0.0%) |
| Information | 0 (0.0%) | 2 (100.0%) |
| Finance & Insurance | 2 (7.7%) | 24 (92.3%) |
| Real Estate, Rental & Leasing | 8 (100.0%) | 0 (0.0%) |
| Professional & Scientific | 3 (100.0%) | 0 (0.0%) |
| Enterprise Management | 0 (0.0%) | 0 (0.0%) |
| Administrative & Support | 0 (0.0%) | 2 (100.0%) |
| Educational Services | 9 (24.3%) | 28 (75.7%) |
| Health Care & Social Assistance | 3 (7.1%) | 39 (92.9%) |
| Arts, Entertainment & Recreation | 10 (100.0%) | 0 (0.0%) |
| Accommodation & Food Services | 4 (28.6%) | 10 (71.4%) |
| Public Administration | 23 (46.9%) | 26 (53.1%) |
| Total | 162 (34.9%) | 302 (65.1%) |
Education in Savoy
School Enrollment in Savoy
The most common levels of schooling among the 225 students in Savoy are high school (71 | 31.6%), middle school (55 | 24.4%), and elementary school (38 | 16.9%).
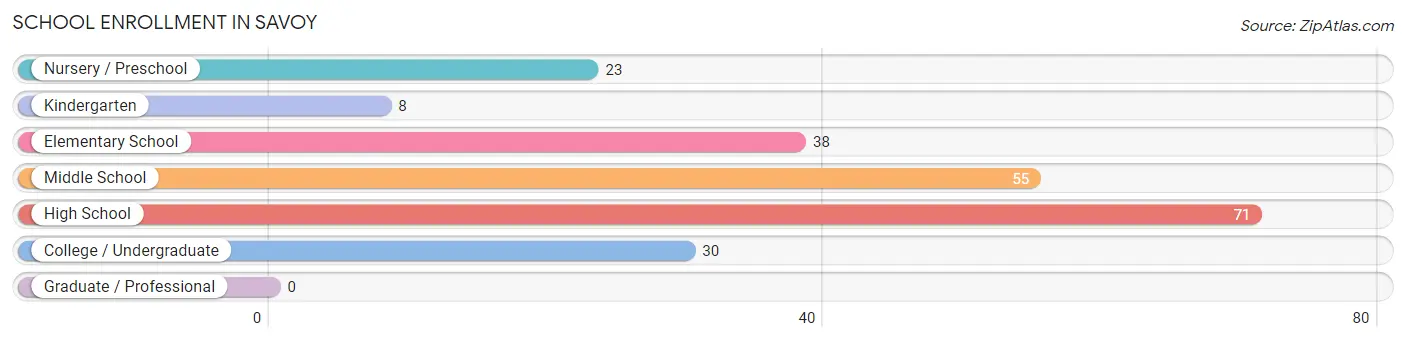
| School Level | # Students | % Students |
| Nursery / Preschool | 23 | 10.2% |
| Kindergarten | 8 | 3.6% |
| Elementary School | 38 | 16.9% |
| Middle School | 55 | 24.4% |
| High School | 71 | 31.6% |
| College / Undergraduate | 30 | 13.3% |
| Graduate / Professional | 0 | 0.0% |
| Total | 225 | 100.0% |
School Enrollment by Age by Funding Source in Savoy
Out of a total of 225 students who are enrolled in schools in Savoy, 74 (32.9%) attend a private institution, while the remaining 151 (67.1%) are enrolled in public schools. The age group of 3 to 4 year olds has the highest likelihood of being enrolled in private schools, with 19 (82.6% in the age bracket) enrolled. Conversely, the age group of 20 to 24 year olds has the lowest likelihood of being enrolled in a private school, with 3 (100.0% in the age bracket) attending a public institution.
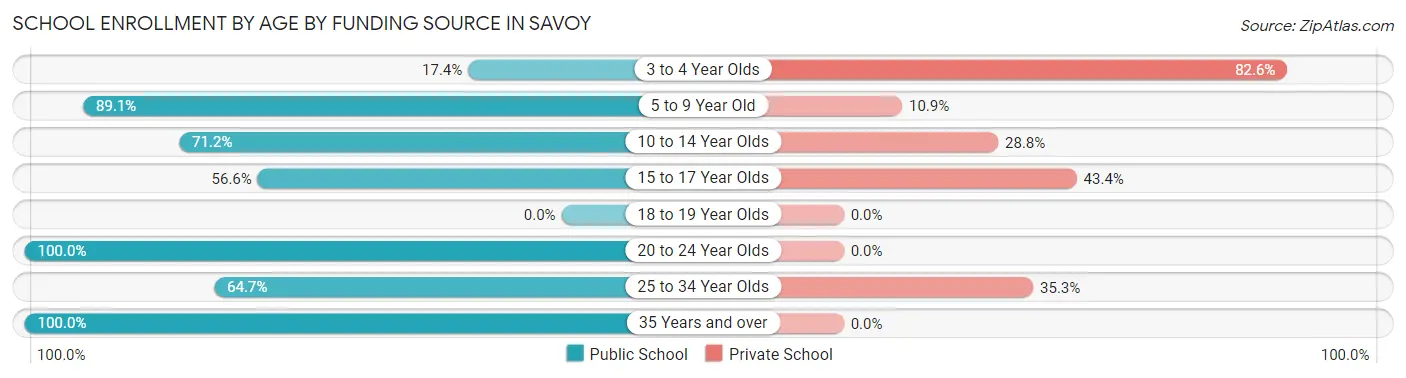
| Age Bracket | Public School | Private School |
| 3 to 4 Year Olds | 4 (17.4%) | 19 (82.6%) |
| 5 to 9 Year Old | 41 (89.1%) | 5 (10.9%) |
| 10 to 14 Year Olds | 52 (71.2%) | 21 (28.8%) |
| 15 to 17 Year Olds | 30 (56.6%) | 23 (43.4%) |
| 18 to 19 Year Olds | 0 (0.0%) | 0 (0.0%) |
| 20 to 24 Year Olds | 3 (100.0%) | 0 (0.0%) |
| 25 to 34 Year Olds | 11 (64.7%) | 6 (35.3%) |
| 35 Years and over | 10 (100.0%) | 0 (0.0%) |
| Total | 151 (67.1%) | 74 (32.9%) |
Educational Attainment by Field of Study in Savoy
Education (18 | 20.2%), science & technology (17 | 19.1%), arts & humanities (14 | 15.7%), psychology (10 | 11.2%), and computers & mathematics (8 | 9.0%) are the most common fields of study among 89 individuals in Savoy who have obtained a bachelor's degree or higher.
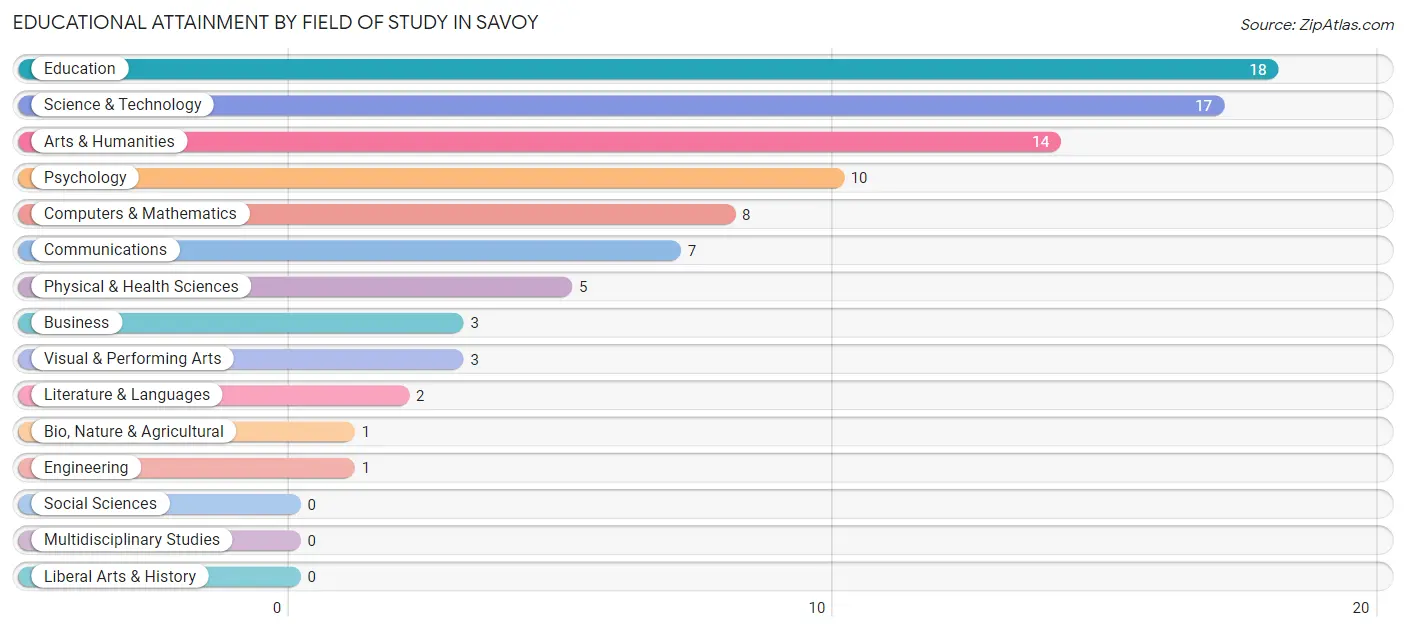
| Field of Study | # Graduates | % Graduates |
| Computers & Mathematics | 8 | 9.0% |
| Bio, Nature & Agricultural | 1 | 1.1% |
| Physical & Health Sciences | 5 | 5.6% |
| Psychology | 10 | 11.2% |
| Social Sciences | 0 | 0.0% |
| Engineering | 1 | 1.1% |
| Multidisciplinary Studies | 0 | 0.0% |
| Science & Technology | 17 | 19.1% |
| Business | 3 | 3.4% |
| Education | 18 | 20.2% |
| Literature & Languages | 2 | 2.2% |
| Liberal Arts & History | 0 | 0.0% |
| Visual & Performing Arts | 3 | 3.4% |
| Communications | 7 | 7.9% |
| Arts & Humanities | 14 | 15.7% |
| Total | 89 | 100.0% |
Transportation & Commute in Savoy
Vehicle Availability by Sex in Savoy
The most prevalent vehicle ownership categories in Savoy are males with 2 vehicles (76, accounting for 46.9%) and females with 2 vehicles (169, making up 25.2%).
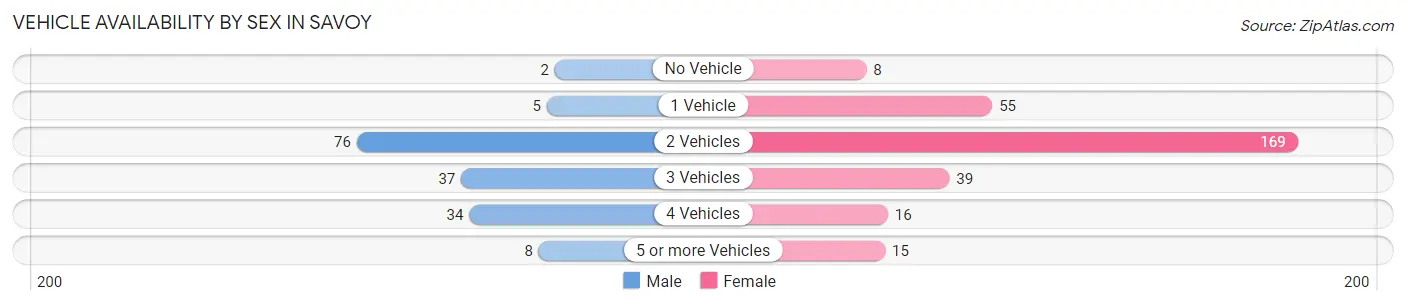
| Vehicles Available | Male | Female |
| No Vehicle | 2 (1.2%) | 8 (2.6%) |
| 1 Vehicle | 5 (3.1%) | 55 (18.2%) |
| 2 Vehicles | 76 (46.9%) | 169 (56.0%) |
| 3 Vehicles | 37 (22.8%) | 39 (12.9%) |
| 4 Vehicles | 34 (21.0%) | 16 (5.3%) |
| 5 or more Vehicles | 8 (4.9%) | 15 (5.0%) |
| Total | 162 (100.0%) | 302 (100.0%) |
Commute Time in Savoy
The most frequently occuring commute durations in Savoy are 20 to 24 minutes (94 commuters, 21.5%), less than 5 minutes (90 commuters, 20.6%), and 45 to 59 minutes (65 commuters, 14.9%).
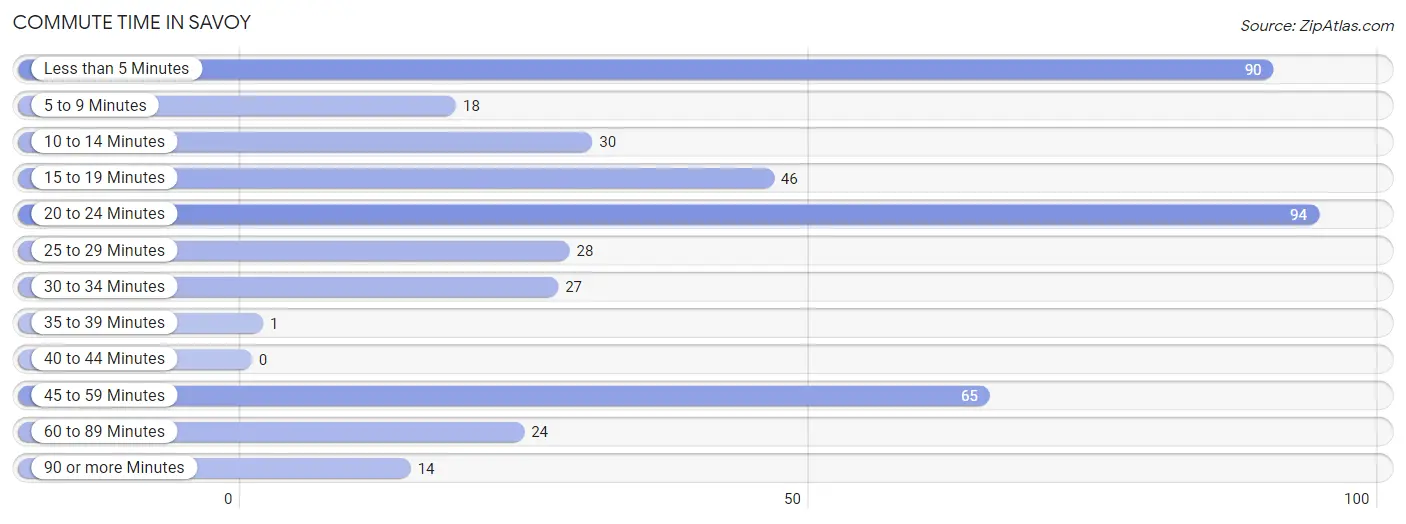
| Commute Time | # Commuters | % Commuters |
| Less than 5 Minutes | 90 | 20.6% |
| 5 to 9 Minutes | 18 | 4.1% |
| 10 to 14 Minutes | 30 | 6.9% |
| 15 to 19 Minutes | 46 | 10.5% |
| 20 to 24 Minutes | 94 | 21.5% |
| 25 to 29 Minutes | 28 | 6.4% |
| 30 to 34 Minutes | 27 | 6.2% |
| 35 to 39 Minutes | 1 | 0.2% |
| 40 to 44 Minutes | 0 | 0.0% |
| 45 to 59 Minutes | 65 | 14.9% |
| 60 to 89 Minutes | 24 | 5.5% |
| 90 or more Minutes | 14 | 3.2% |
Commute Time by Sex in Savoy
The most common commute times in Savoy are 20 to 24 minutes (24 commuters, 15.2%) for males and less than 5 minutes (80 commuters, 28.7%) for females.
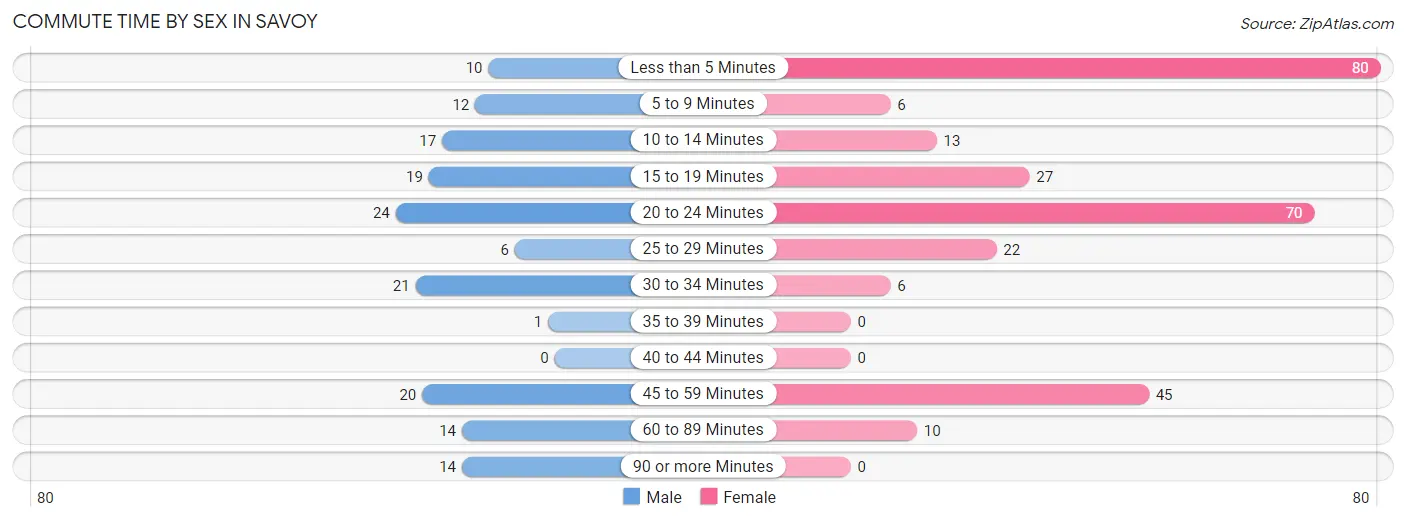
| Commute Time | Male | Female |
| Less than 5 Minutes | 10 (6.3%) | 80 (28.7%) |
| 5 to 9 Minutes | 12 (7.6%) | 6 (2.1%) |
| 10 to 14 Minutes | 17 (10.8%) | 13 (4.7%) |
| 15 to 19 Minutes | 19 (12.0%) | 27 (9.7%) |
| 20 to 24 Minutes | 24 (15.2%) | 70 (25.1%) |
| 25 to 29 Minutes | 6 (3.8%) | 22 (7.9%) |
| 30 to 34 Minutes | 21 (13.3%) | 6 (2.1%) |
| 35 to 39 Minutes | 1 (0.6%) | 0 (0.0%) |
| 40 to 44 Minutes | 0 (0.0%) | 0 (0.0%) |
| 45 to 59 Minutes | 20 (12.7%) | 45 (16.1%) |
| 60 to 89 Minutes | 14 (8.9%) | 10 (3.6%) |
| 90 or more Minutes | 14 (8.9%) | 0 (0.0%) |
Time of Departure to Work by Sex in Savoy
The most frequent times of departure to work in Savoy are 5:00 AM to 5:29 AM (28, 17.7%) for males and 4:00 PM to 11:59 PM (65, 23.3%) for females.
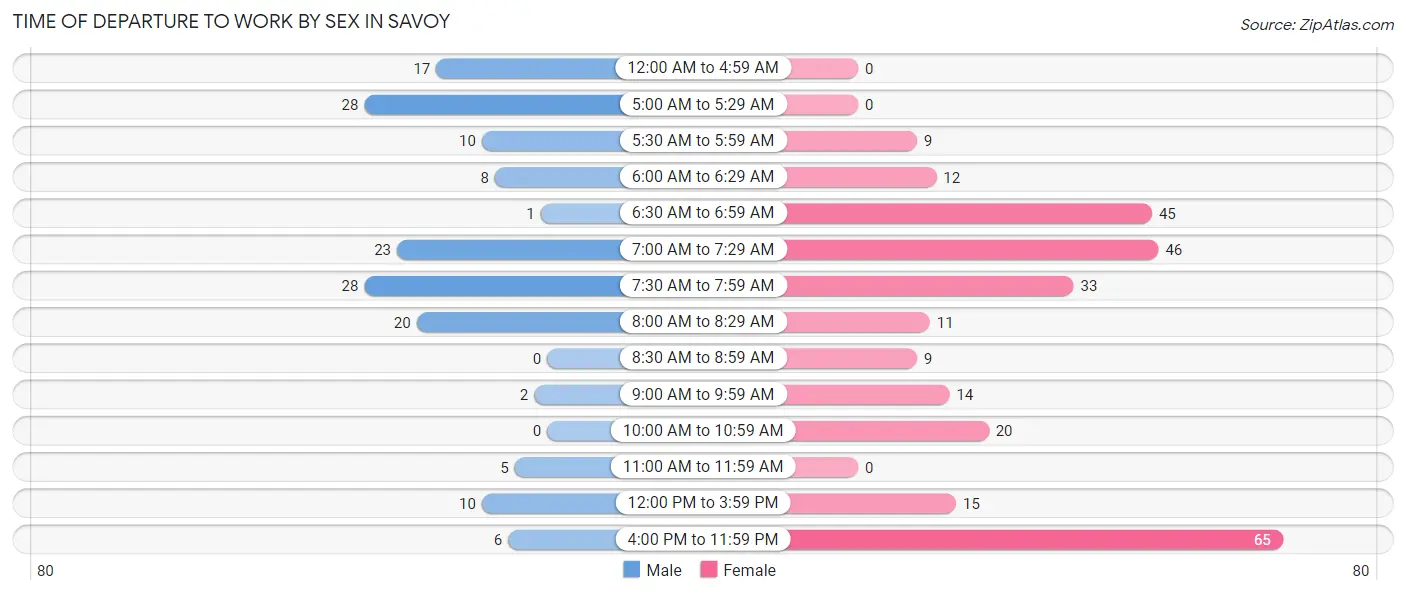
| Time of Departure | Male | Female |
| 12:00 AM to 4:59 AM | 17 (10.8%) | 0 (0.0%) |
| 5:00 AM to 5:29 AM | 28 (17.7%) | 0 (0.0%) |
| 5:30 AM to 5:59 AM | 10 (6.3%) | 9 (3.2%) |
| 6:00 AM to 6:29 AM | 8 (5.1%) | 12 (4.3%) |
| 6:30 AM to 6:59 AM | 1 (0.6%) | 45 (16.1%) |
| 7:00 AM to 7:29 AM | 23 (14.6%) | 46 (16.5%) |
| 7:30 AM to 7:59 AM | 28 (17.7%) | 33 (11.8%) |
| 8:00 AM to 8:29 AM | 20 (12.7%) | 11 (3.9%) |
| 8:30 AM to 8:59 AM | 0 (0.0%) | 9 (3.2%) |
| 9:00 AM to 9:59 AM | 2 (1.3%) | 14 (5.0%) |
| 10:00 AM to 10:59 AM | 0 (0.0%) | 20 (7.2%) |
| 11:00 AM to 11:59 AM | 5 (3.2%) | 0 (0.0%) |
| 12:00 PM to 3:59 PM | 10 (6.3%) | 15 (5.4%) |
| 4:00 PM to 11:59 PM | 6 (3.8%) | 65 (23.3%) |
| Total | 158 (100.0%) | 279 (100.0%) |
Housing Occupancy in Savoy
Occupancy by Ownership in Savoy
Of the total 304 dwellings in Savoy, owner-occupied units account for 194 (63.8%), while renter-occupied units make up 110 (36.2%).
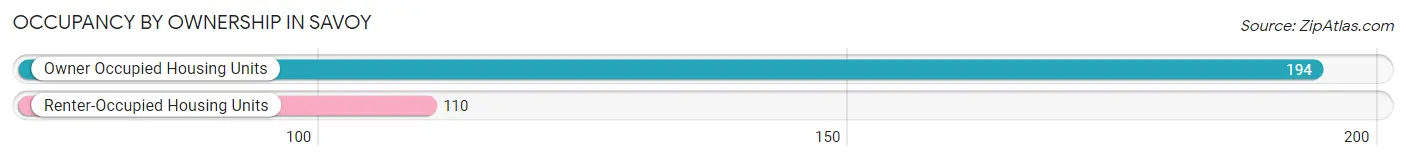
| Occupancy | # Housing Units | % Housing Units |
| Owner Occupied Housing Units | 194 | 63.8% |
| Renter-Occupied Housing Units | 110 | 36.2% |
| Total Occupied Housing Units | 304 | 100.0% |
Occupancy by Household Size in Savoy
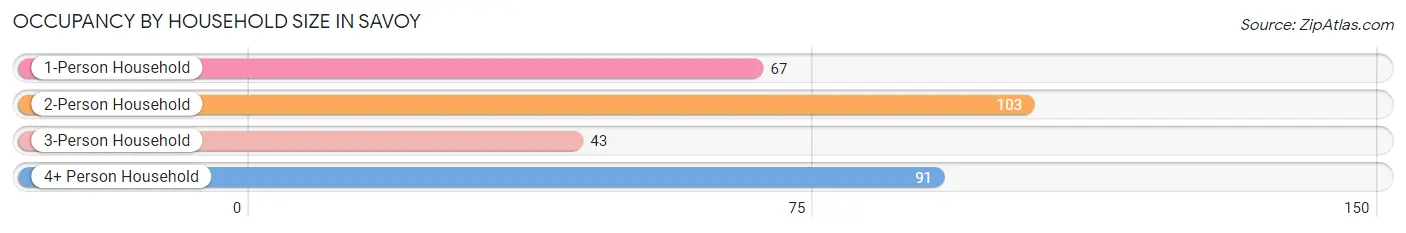
| Household Size | # Housing Units | % Housing Units |
| 1-Person Household | 67 | 22.0% |
| 2-Person Household | 103 | 33.9% |
| 3-Person Household | 43 | 14.1% |
| 4+ Person Household | 91 | 29.9% |
| Total Housing Units | 304 | 100.0% |
Occupancy by Ownership by Household Size in Savoy
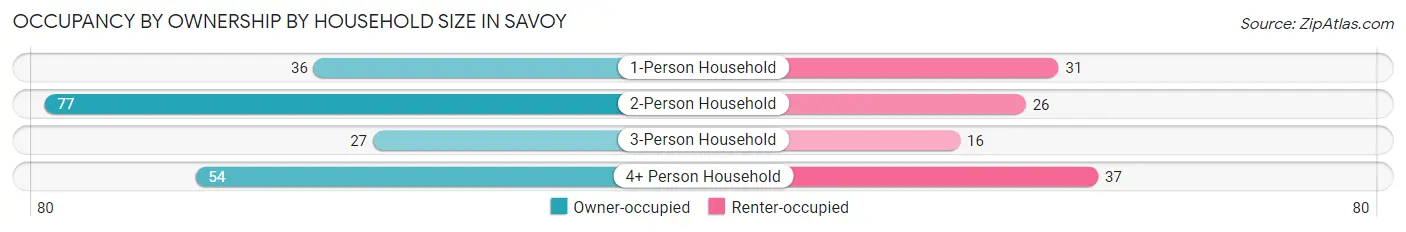
| Household Size | Owner-occupied | Renter-occupied |
| 1-Person Household | 36 (53.7%) | 31 (46.3%) |
| 2-Person Household | 77 (74.8%) | 26 (25.2%) |
| 3-Person Household | 27 (62.8%) | 16 (37.2%) |
| 4+ Person Household | 54 (59.3%) | 37 (40.7%) |
| Total Housing Units | 194 (63.8%) | 110 (36.2%) |
Occupancy by Educational Attainment in Savoy
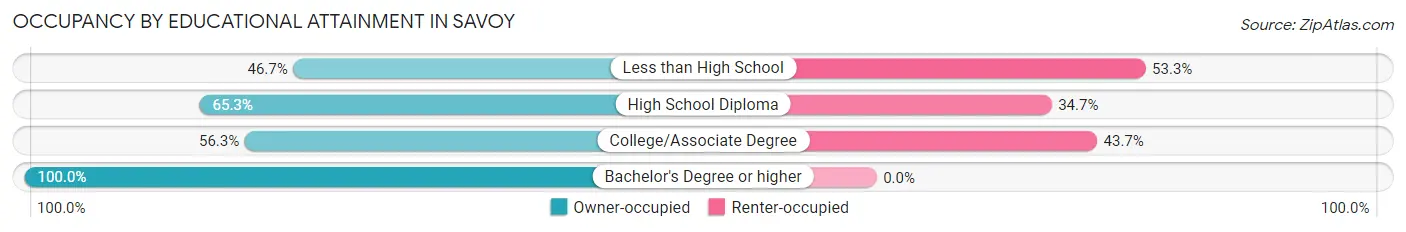
| Household Size | Owner-occupied | Renter-occupied |
| Less than High School | 14 (46.7%) | 16 (53.3%) |
| High School Diploma | 79 (65.3%) | 42 (34.7%) |
| College/Associate Degree | 67 (56.3%) | 52 (43.7%) |
| Bachelor's Degree or higher | 34 (100.0%) | 0 (0.0%) |
Occupancy by Age of Householder in Savoy
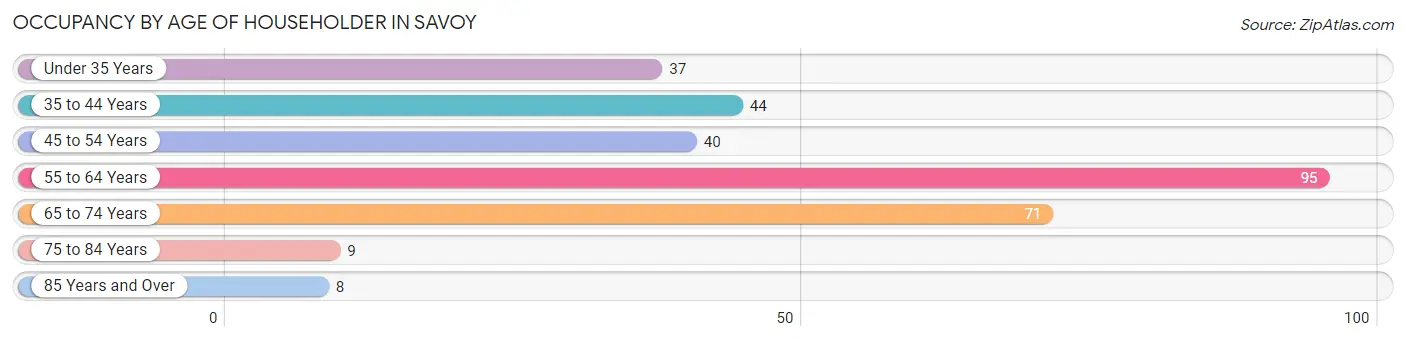
| Age Bracket | # Households | % Households |
| Under 35 Years | 37 | 12.2% |
| 35 to 44 Years | 44 | 14.5% |
| 45 to 54 Years | 40 | 13.2% |
| 55 to 64 Years | 95 | 31.2% |
| 65 to 74 Years | 71 | 23.4% |
| 75 to 84 Years | 9 | 3.0% |
| 85 Years and Over | 8 | 2.6% |
| Total | 304 | 100.0% |
Housing Finances in Savoy
Median Income by Occupancy in Savoy
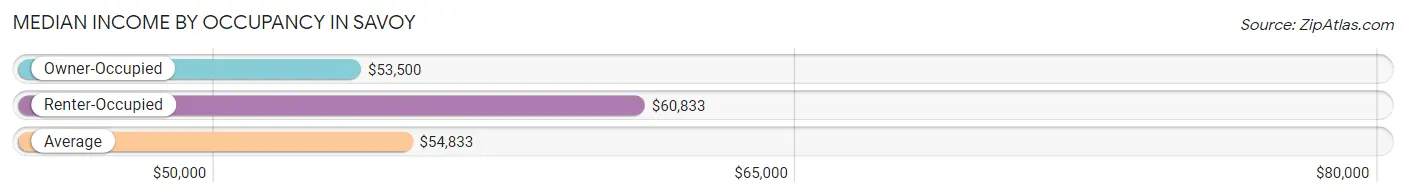
| Occupancy Type | # Households | Median Income |
| Owner-Occupied | 194 (63.8%) | $53,500 |
| Renter-Occupied | 110 (36.2%) | $60,833 |
| Average | 304 (100.0%) | $54,833 |
Occupancy by Householder Income Bracket in Savoy
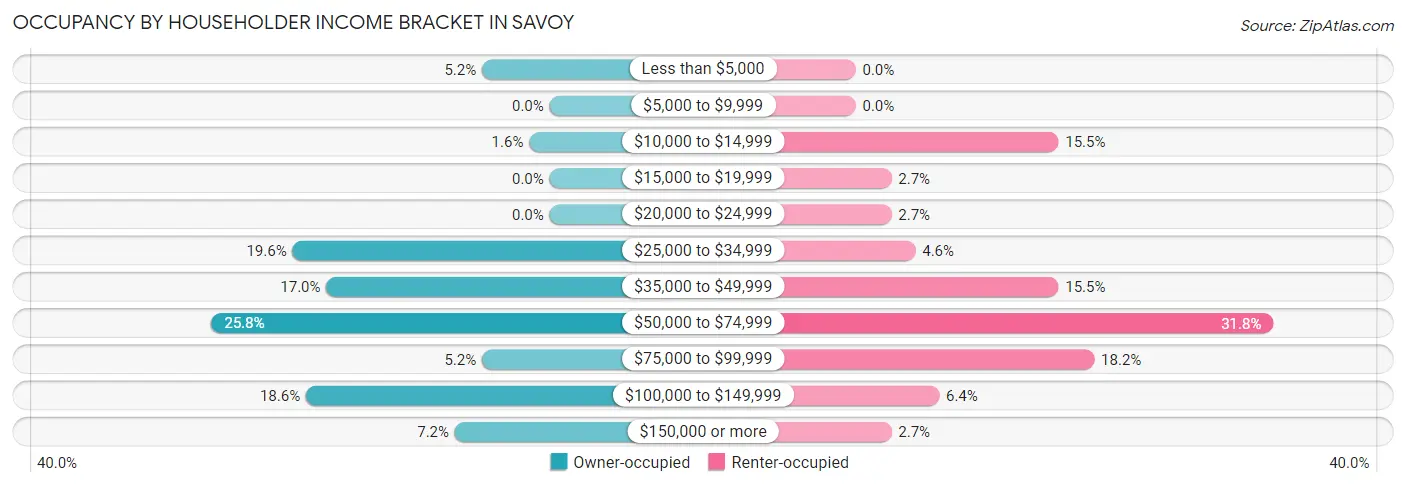
| Income Bracket | Owner-occupied | Renter-occupied |
| Less than $5,000 | 10 (5.1%) | 0 (0.0%) |
| $5,000 to $9,999 | 0 (0.0%) | 0 (0.0%) |
| $10,000 to $14,999 | 3 (1.5%) | 17 (15.4%) |
| $15,000 to $19,999 | 0 (0.0%) | 3 (2.7%) |
| $20,000 to $24,999 | 0 (0.0%) | 3 (2.7%) |
| $25,000 to $34,999 | 38 (19.6%) | 5 (4.5%) |
| $35,000 to $49,999 | 33 (17.0%) | 17 (15.4%) |
| $50,000 to $74,999 | 50 (25.8%) | 35 (31.8%) |
| $75,000 to $99,999 | 10 (5.1%) | 20 (18.2%) |
| $100,000 to $149,999 | 36 (18.6%) | 7 (6.4%) |
| $150,000 or more | 14 (7.2%) | 3 (2.7%) |
| Total | 194 (100.0%) | 110 (100.0%) |
Monthly Housing Cost Tiers in Savoy
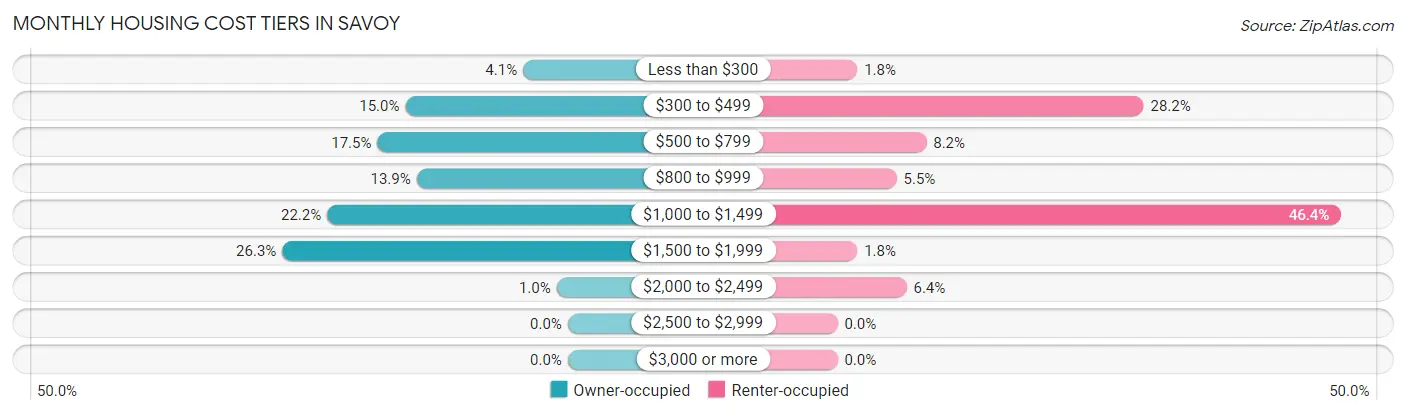
| Monthly Cost | Owner-occupied | Renter-occupied |
| Less than $300 | 8 (4.1%) | 2 (1.8%) |
| $300 to $499 | 29 (14.9%) | 31 (28.2%) |
| $500 to $799 | 34 (17.5%) | 9 (8.2%) |
| $800 to $999 | 27 (13.9%) | 6 (5.4%) |
| $1,000 to $1,499 | 43 (22.2%) | 51 (46.4%) |
| $1,500 to $1,999 | 51 (26.3%) | 2 (1.8%) |
| $2,000 to $2,499 | 2 (1.0%) | 7 (6.4%) |
| $2,500 to $2,999 | 0 (0.0%) | 0 (0.0%) |
| $3,000 or more | 0 (0.0%) | 0 (0.0%) |
| Total | 194 (100.0%) | 110 (100.0%) |
Physical Housing Characteristics in Savoy
Housing Structures in Savoy
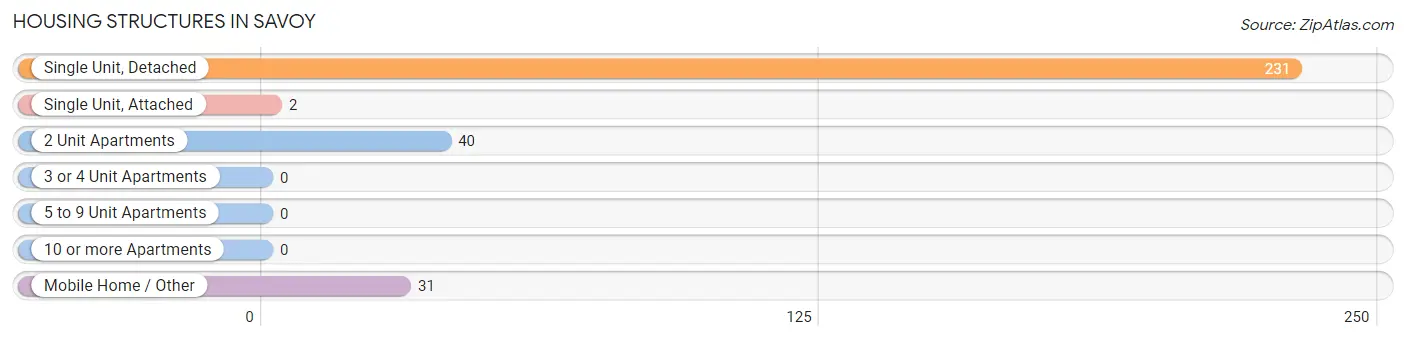
| Structure Type | # Housing Units | % Housing Units |
| Single Unit, Detached | 231 | 76.0% |
| Single Unit, Attached | 2 | 0.7% |
| 2 Unit Apartments | 40 | 13.2% |
| 3 or 4 Unit Apartments | 0 | 0.0% |
| 5 to 9 Unit Apartments | 0 | 0.0% |
| 10 or more Apartments | 0 | 0.0% |
| Mobile Home / Other | 31 | 10.2% |
| Total | 304 | 100.0% |
Housing Structures by Occupancy in Savoy
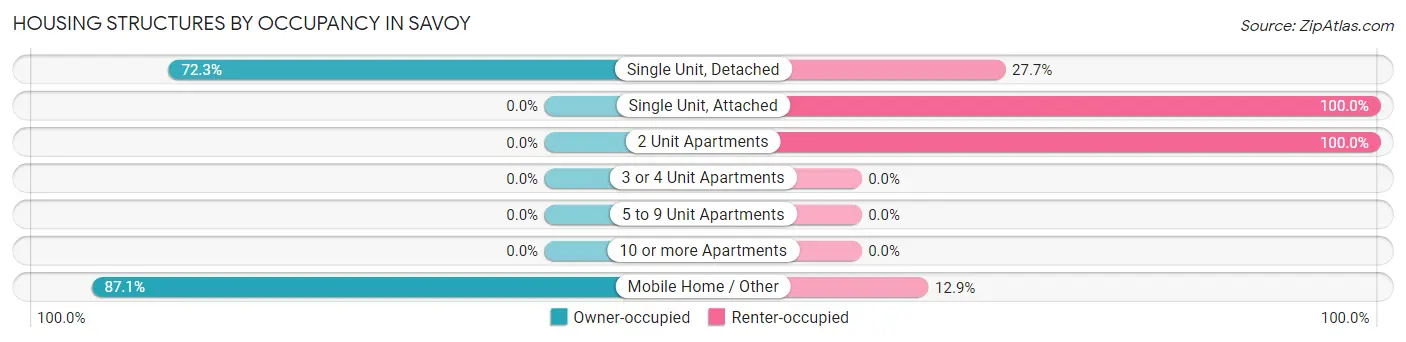
| Structure Type | Owner-occupied | Renter-occupied |
| Single Unit, Detached | 167 (72.3%) | 64 (27.7%) |
| Single Unit, Attached | 0 (0.0%) | 2 (100.0%) |
| 2 Unit Apartments | 0 (0.0%) | 40 (100.0%) |
| 3 or 4 Unit Apartments | 0 (0.0%) | 0 (0.0%) |
| 5 to 9 Unit Apartments | 0 (0.0%) | 0 (0.0%) |
| 10 or more Apartments | 0 (0.0%) | 0 (0.0%) |
| Mobile Home / Other | 27 (87.1%) | 4 (12.9%) |
| Total | 194 (63.8%) | 110 (36.2%) |
Housing Structures by Number of Rooms in Savoy
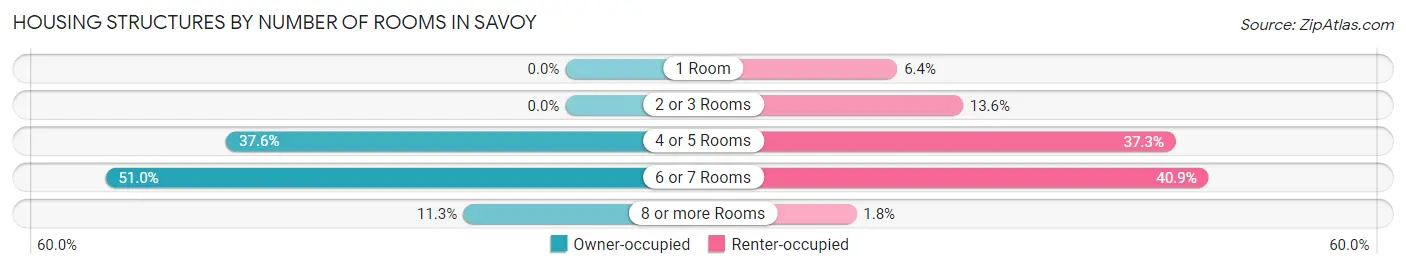
| Number of Rooms | Owner-occupied | Renter-occupied |
| 1 Room | 0 (0.0%) | 7 (6.4%) |
| 2 or 3 Rooms | 0 (0.0%) | 15 (13.6%) |
| 4 or 5 Rooms | 73 (37.6%) | 41 (37.3%) |
| 6 or 7 Rooms | 99 (51.0%) | 45 (40.9%) |
| 8 or more Rooms | 22 (11.3%) | 2 (1.8%) |
| Total | 194 (100.0%) | 110 (100.0%) |
Housing Structure by Heating Type in Savoy
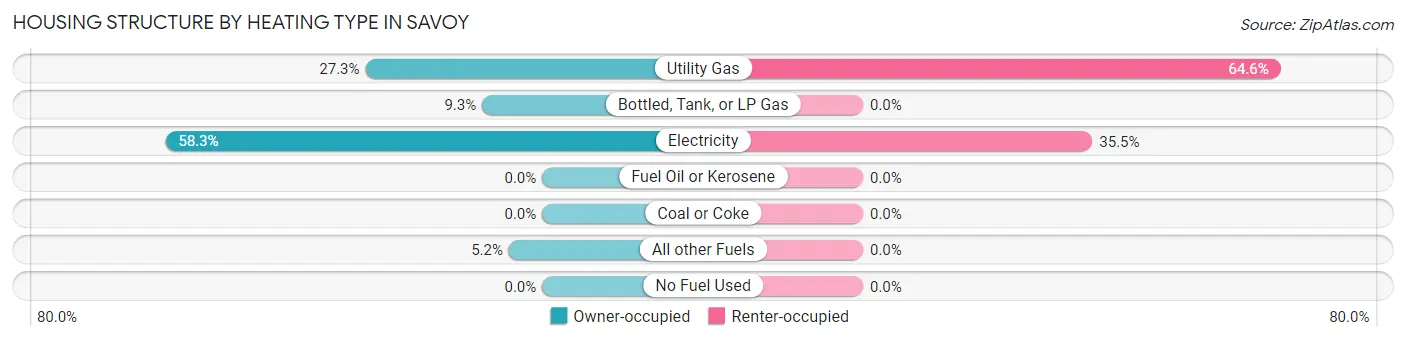
| Heating Type | Owner-occupied | Renter-occupied |
| Utility Gas | 53 (27.3%) | 71 (64.5%) |
| Bottled, Tank, or LP Gas | 18 (9.3%) | 0 (0.0%) |
| Electricity | 113 (58.3%) | 39 (35.4%) |
| Fuel Oil or Kerosene | 0 (0.0%) | 0 (0.0%) |
| Coal or Coke | 0 (0.0%) | 0 (0.0%) |
| All other Fuels | 10 (5.1%) | 0 (0.0%) |
| No Fuel Used | 0 (0.0%) | 0 (0.0%) |
| Total | 194 (100.0%) | 110 (100.0%) |
Household Vehicle Usage in Savoy
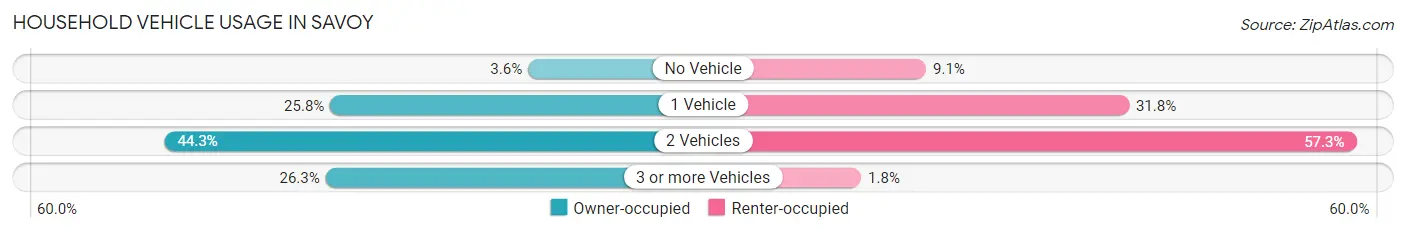
| Vehicles per Household | Owner-occupied | Renter-occupied |
| No Vehicle | 7 (3.6%) | 10 (9.1%) |
| 1 Vehicle | 50 (25.8%) | 35 (31.8%) |
| 2 Vehicles | 86 (44.3%) | 63 (57.3%) |
| 3 or more Vehicles | 51 (26.3%) | 2 (1.8%) |
| Total | 194 (100.0%) | 110 (100.0%) |
Real Estate & Mortgages in Savoy
Real Estate and Mortgage Overview in Savoy
| Characteristic | Without Mortgage | With Mortgage |
| Housing Units | 82 | 112 |
| Median Property Value | $104,200 | $139,200 |
| Median Household Income | $45,000 | $6 |
| Monthly Housing Costs | $527 | $0 |
| Real Estate Taxes | $1,571 | $0 |
Property Value by Mortgage Status in Savoy
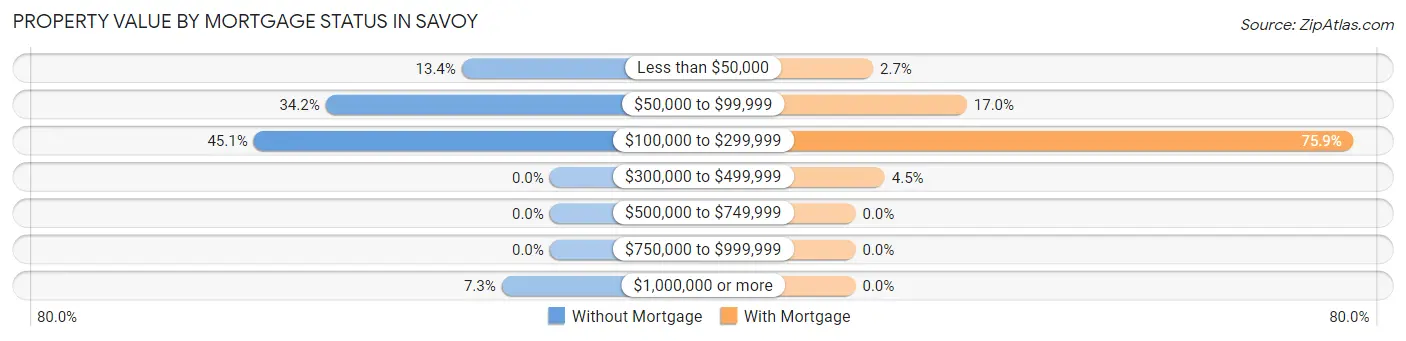
| Property Value | Without Mortgage | With Mortgage |
| Less than $50,000 | 11 (13.4%) | 3 (2.7%) |
| $50,000 to $99,999 | 28 (34.2%) | 19 (17.0%) |
| $100,000 to $299,999 | 37 (45.1%) | 85 (75.9%) |
| $300,000 to $499,999 | 0 (0.0%) | 5 (4.5%) |
| $500,000 to $749,999 | 0 (0.0%) | 0 (0.0%) |
| $750,000 to $999,999 | 0 (0.0%) | 0 (0.0%) |
| $1,000,000 or more | 6 (7.3%) | 0 (0.0%) |
| Total | 82 (100.0%) | 112 (100.0%) |
Household Income by Mortgage Status in Savoy
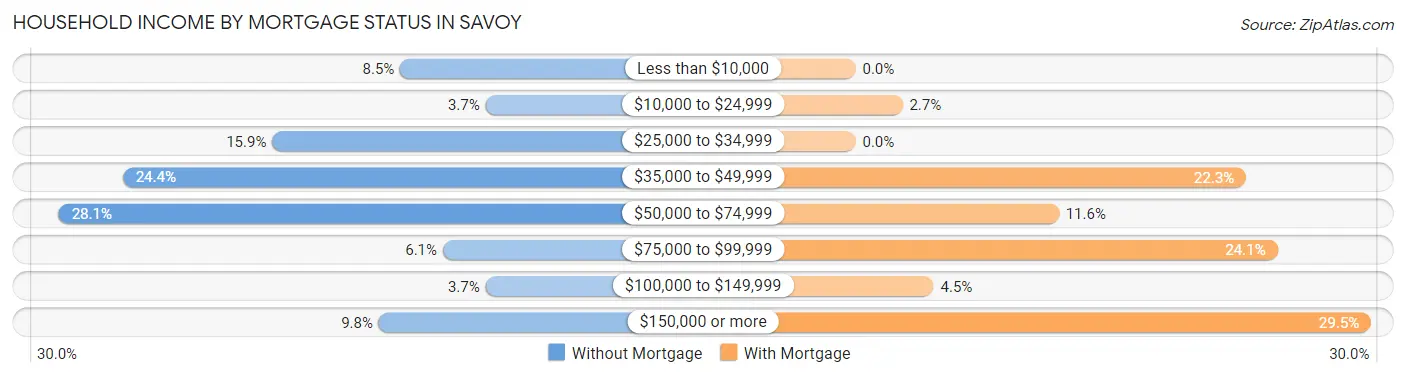
| Household Income | Without Mortgage | With Mortgage |
| Less than $10,000 | 7 (8.5%) | 0 (0.0%) |
| $10,000 to $24,999 | 3 (3.7%) | 3 (2.7%) |
| $25,000 to $34,999 | 13 (15.9%) | 0 (0.0%) |
| $35,000 to $49,999 | 20 (24.4%) | 25 (22.3%) |
| $50,000 to $74,999 | 23 (28.1%) | 13 (11.6%) |
| $75,000 to $99,999 | 5 (6.1%) | 27 (24.1%) |
| $100,000 to $149,999 | 3 (3.7%) | 5 (4.5%) |
| $150,000 or more | 8 (9.8%) | 33 (29.5%) |
| Total | 82 (100.0%) | 112 (100.0%) |
Property Value to Household Income Ratio in Savoy
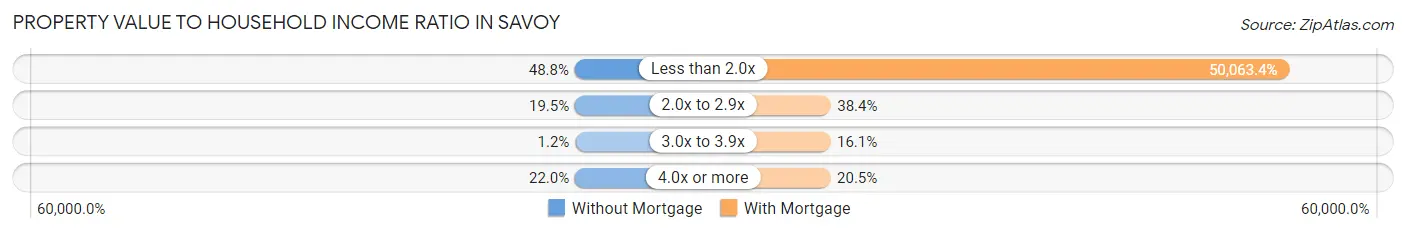
| Value-to-Income Ratio | Without Mortgage | With Mortgage |
| Less than 2.0x | 40 (48.8%) | 56,071 (50,063.4%) |
| 2.0x to 2.9x | 16 (19.5%) | 43 (38.4%) |
| 3.0x to 3.9x | 1 (1.2%) | 18 (16.1%) |
| 4.0x or more | 18 (22.0%) | 23 (20.5%) |
| Total | 82 (100.0%) | 112 (100.0%) |
Real Estate Taxes by Mortgage Status in Savoy
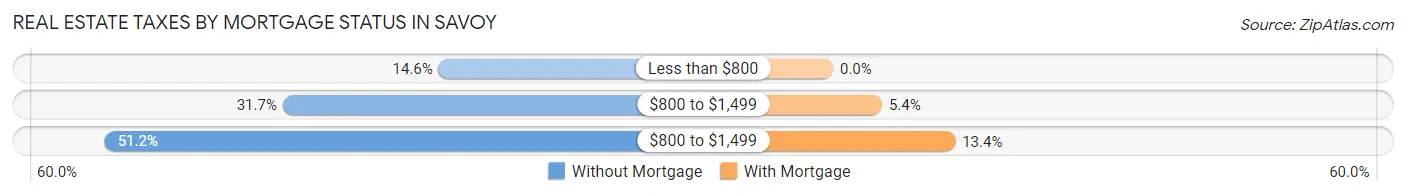
| Property Taxes | Without Mortgage | With Mortgage |
| Less than $800 | 12 (14.6%) | 0 (0.0%) |
| $800 to $1,499 | 26 (31.7%) | 6 (5.4%) |
| $800 to $1,499 | 42 (51.2%) | 15 (13.4%) |
| Total | 82 (100.0%) | 112 (100.0%) |
Health & Disability in Savoy
Health Insurance Coverage by Age in Savoy
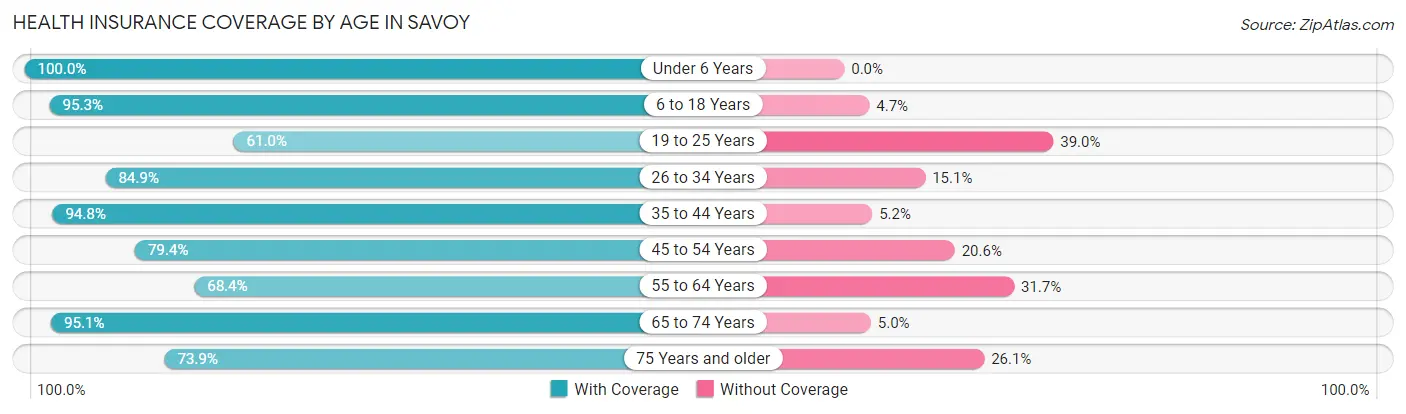
| Age Bracket | With Coverage | Without Coverage |
| Under 6 Years | 34 (100.0%) | 0 (0.0%) |
| 6 to 18 Years | 163 (95.3%) | 8 (4.7%) |
| 19 to 25 Years | 36 (61.0%) | 23 (39.0%) |
| 26 to 34 Years | 45 (84.9%) | 8 (15.1%) |
| 35 to 44 Years | 200 (94.8%) | 11 (5.2%) |
| 45 to 54 Years | 81 (79.4%) | 21 (20.6%) |
| 55 to 64 Years | 95 (68.3%) | 44 (31.7%) |
| 65 to 74 Years | 96 (95.1%) | 5 (5.0%) |
| 75 Years and older | 17 (73.9%) | 6 (26.1%) |
| Total | 767 (85.9%) | 126 (14.1%) |
Health Insurance Coverage by Citizenship Status in Savoy
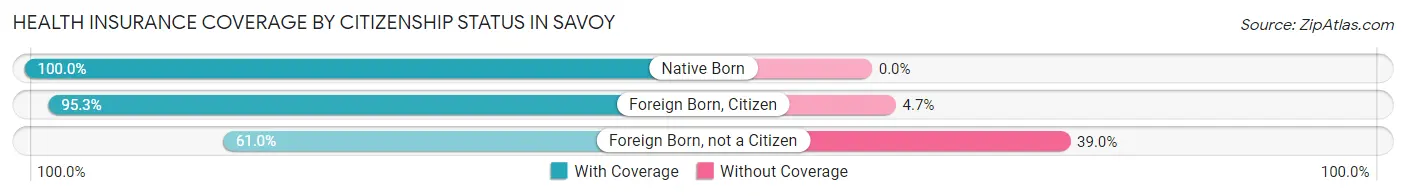
| Citizenship Status | With Coverage | Without Coverage |
| Native Born | 34 (100.0%) | 0 (0.0%) |
| Foreign Born, Citizen | 163 (95.3%) | 8 (4.7%) |
| Foreign Born, not a Citizen | 36 (61.0%) | 23 (39.0%) |
Health Insurance Coverage by Household Income in Savoy
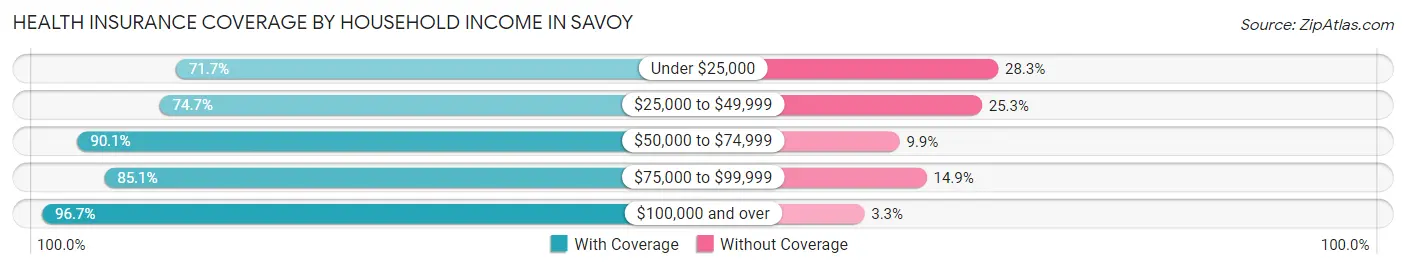
| Household Income | With Coverage | Without Coverage |
| Under $25,000 | 43 (71.7%) | 17 (28.3%) |
| $25,000 to $49,999 | 186 (74.7%) | 63 (25.3%) |
| $50,000 to $74,999 | 228 (90.1%) | 25 (9.9%) |
| $75,000 to $99,999 | 74 (85.1%) | 13 (14.9%) |
| $100,000 and over | 236 (96.7%) | 8 (3.3%) |
Public vs Private Health Insurance Coverage by Age in Savoy
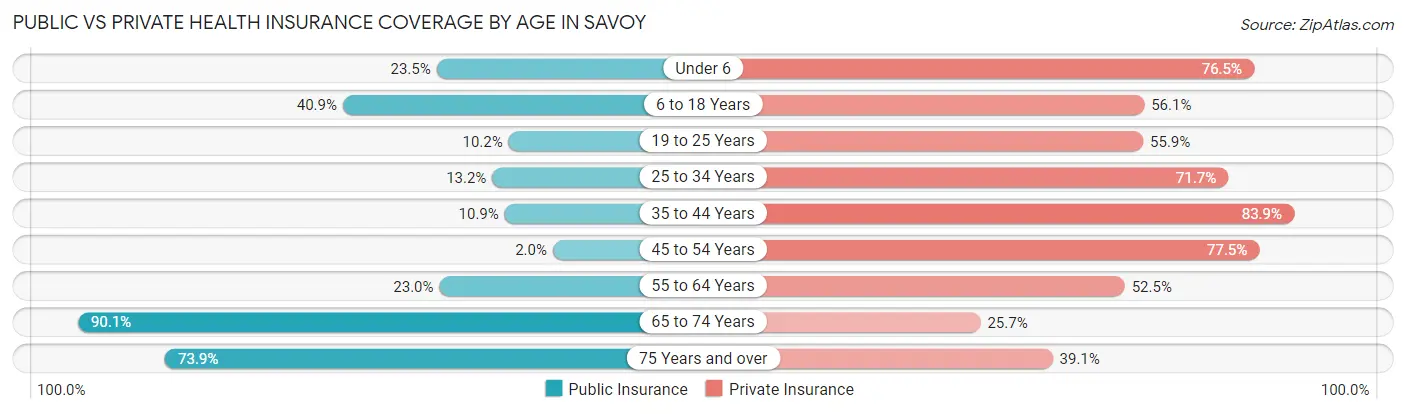
| Age Bracket | Public Insurance | Private Insurance |
| Under 6 | 8 (23.5%) | 26 (76.5%) |
| 6 to 18 Years | 70 (40.9%) | 96 (56.1%) |
| 19 to 25 Years | 6 (10.2%) | 33 (55.9%) |
| 25 to 34 Years | 7 (13.2%) | 38 (71.7%) |
| 35 to 44 Years | 23 (10.9%) | 177 (83.9%) |
| 45 to 54 Years | 2 (2.0%) | 79 (77.4%) |
| 55 to 64 Years | 32 (23.0%) | 73 (52.5%) |
| 65 to 74 Years | 91 (90.1%) | 26 (25.7%) |
| 75 Years and over | 17 (73.9%) | 9 (39.1%) |
| Total | 256 (28.7%) | 557 (62.4%) |
Disability Status by Sex by Age in Savoy
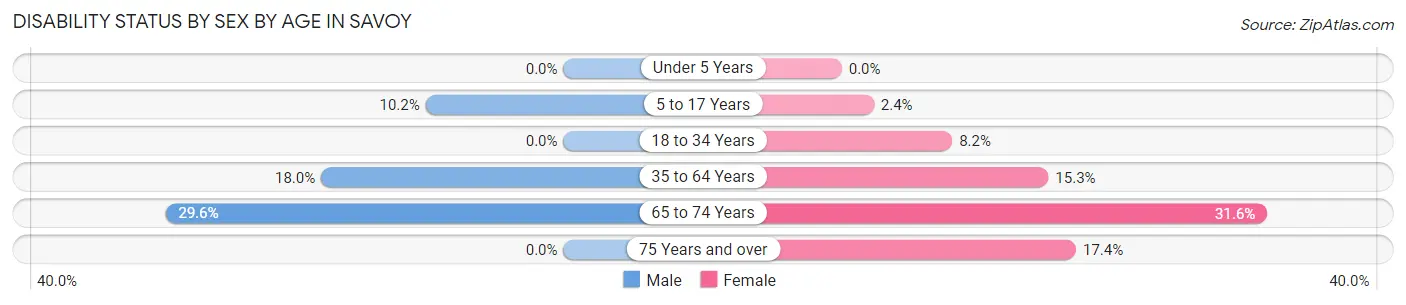
| Age Bracket | Male | Female |
| Under 5 Years | 0 (0.0%) | 0 (0.0%) |
| 5 to 17 Years | 9 (10.2%) | 2 (2.4%) |
| 18 to 34 Years | 0 (0.0%) | 5 (8.2%) |
| 35 to 64 Years | 25 (18.0%) | 48 (15.3%) |
| 65 to 74 Years | 13 (29.5%) | 18 (31.6%) |
| 75 Years and over | 0 (0.0%) | 4 (17.4%) |
Disability Class by Sex by Age in Savoy
Disability Class: Hearing Difficulty
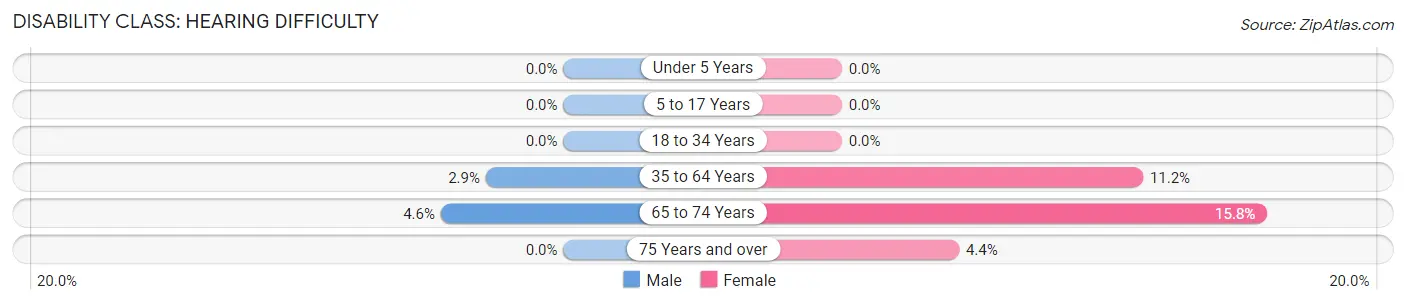
| Age Bracket | Male | Female |
| Under 5 Years | 0 (0.0%) | 0 (0.0%) |
| 5 to 17 Years | 0 (0.0%) | 0 (0.0%) |
| 18 to 34 Years | 0 (0.0%) | 0 (0.0%) |
| 35 to 64 Years | 4 (2.9%) | 35 (11.2%) |
| 65 to 74 Years | 2 (4.5%) | 9 (15.8%) |
| 75 Years and over | 0 (0.0%) | 1 (4.3%) |
Disability Class: Vision Difficulty
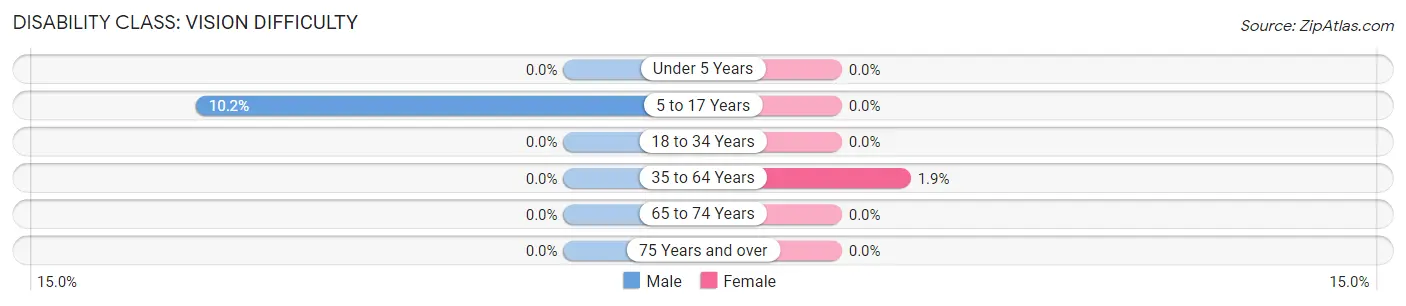
| Age Bracket | Male | Female |
| Under 5 Years | 0 (0.0%) | 0 (0.0%) |
| 5 to 17 Years | 9 (10.2%) | 0 (0.0%) |
| 18 to 34 Years | 0 (0.0%) | 0 (0.0%) |
| 35 to 64 Years | 0 (0.0%) | 6 (1.9%) |
| 65 to 74 Years | 0 (0.0%) | 0 (0.0%) |
| 75 Years and over | 0 (0.0%) | 0 (0.0%) |
Disability Class: Cognitive Difficulty
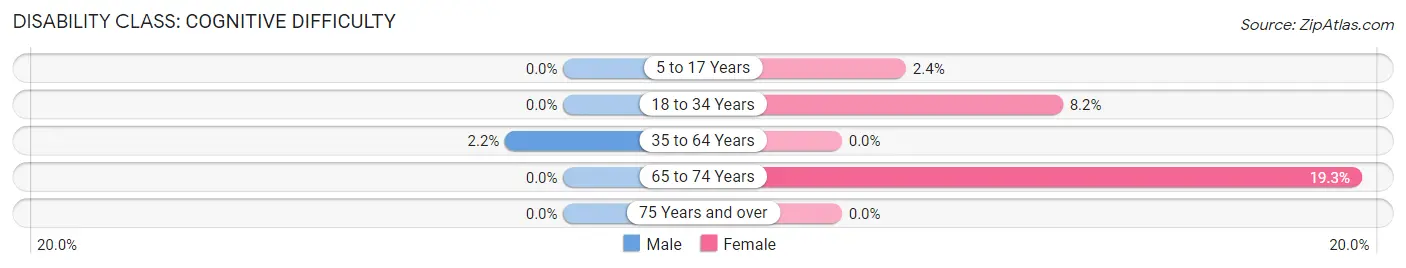
| Age Bracket | Male | Female |
| 5 to 17 Years | 0 (0.0%) | 2 (2.4%) |
| 18 to 34 Years | 0 (0.0%) | 5 (8.2%) |
| 35 to 64 Years | 3 (2.2%) | 0 (0.0%) |
| 65 to 74 Years | 0 (0.0%) | 11 (19.3%) |
| 75 Years and over | 0 (0.0%) | 0 (0.0%) |
Disability Class: Ambulatory Difficulty
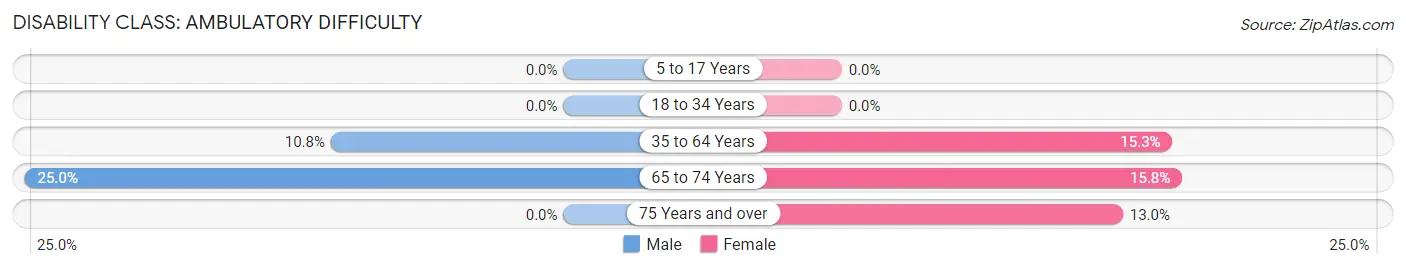
| Age Bracket | Male | Female |
| 5 to 17 Years | 0 (0.0%) | 0 (0.0%) |
| 18 to 34 Years | 0 (0.0%) | 0 (0.0%) |
| 35 to 64 Years | 15 (10.8%) | 48 (15.3%) |
| 65 to 74 Years | 11 (25.0%) | 9 (15.8%) |
| 75 Years and over | 0 (0.0%) | 3 (13.0%) |
Disability Class: Self-Care Difficulty
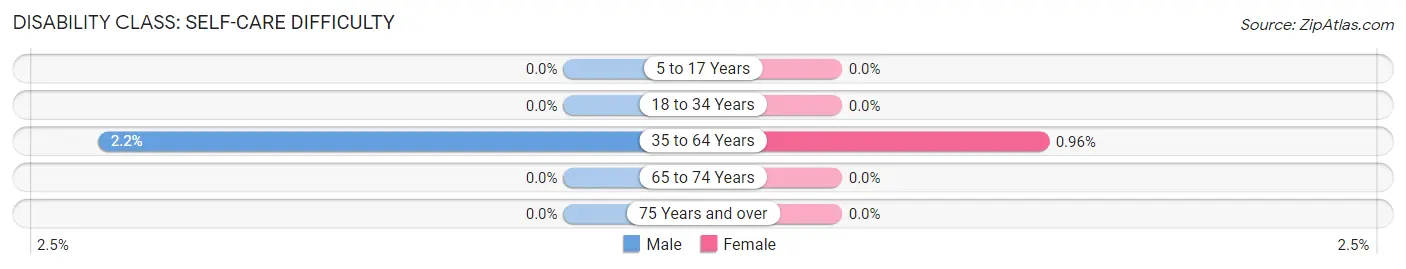
| Age Bracket | Male | Female |
| 5 to 17 Years | 0 (0.0%) | 0 (0.0%) |
| 18 to 34 Years | 0 (0.0%) | 0 (0.0%) |
| 35 to 64 Years | 3 (2.2%) | 3 (1.0%) |
| 65 to 74 Years | 0 (0.0%) | 0 (0.0%) |
| 75 Years and over | 0 (0.0%) | 0 (0.0%) |
Technology Access in Savoy
Computing Device Access in Savoy
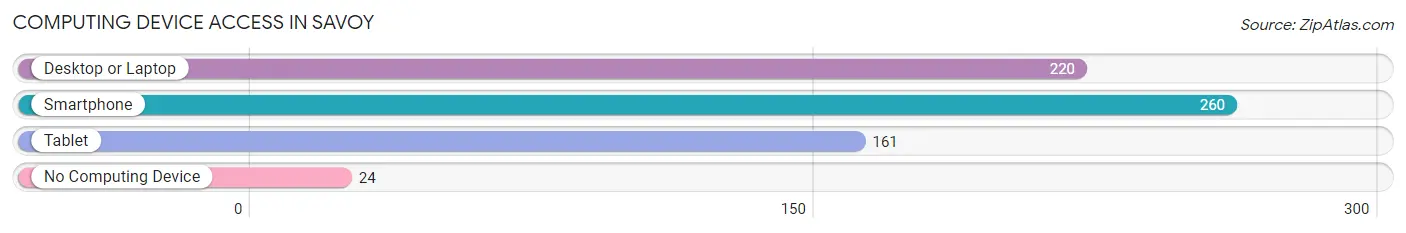
| Device Type | # Households | % Households |
| Desktop or Laptop | 220 | 72.4% |
| Smartphone | 260 | 85.5% |
| Tablet | 161 | 53.0% |
| No Computing Device | 24 | 7.9% |
| Total | 304 | 100.0% |
Internet Access in Savoy
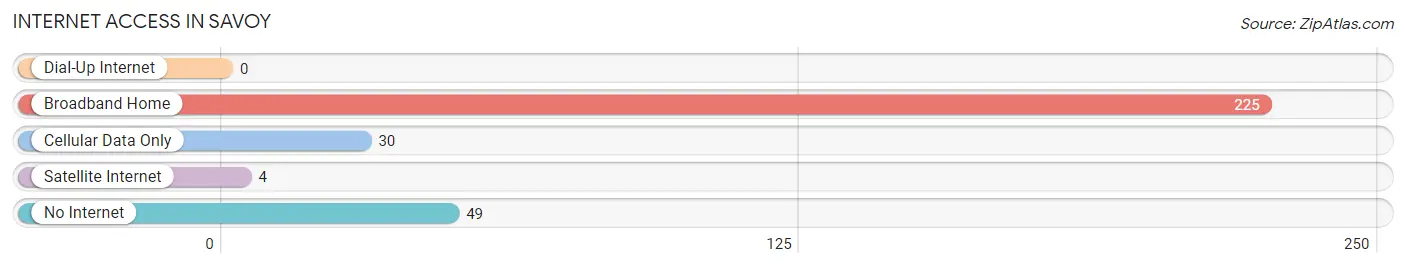
| Internet Type | # Households | % Households |
| Dial-Up Internet | 0 | 0.0% |
| Broadband Home | 225 | 74.0% |
| Cellular Data Only | 30 | 9.9% |
| Satellite Internet | 4 | 1.3% |
| No Internet | 49 | 16.1% |
| Total | 304 | 100.0% |
Savoy Summary
Savoy is a small town located in Fannin County, Texas, United States. The population was 1,072 at the 2010 census. It is part of the Sherman–Denison Metropolitan Statistical Area.
History
Savoy was founded in 1887 by the Texas and Pacific Railway. The town was named after Savoy, Illinois, the hometown of the railroad's president. The first post office was established in 1887.
In the early 1900s, Savoy was a thriving community with a population of over 1,000. The town had a bank, a hotel, a cotton gin, a blacksmith shop, a livery stable, a drug store, a hardware store, a grocery store, a barber shop, a saloon, a school, and several churches.
In the 1920s, the town began to decline as the railroad industry declined. The population dropped to around 500 by the 1940s.
Geography
Savoy is located at 33°41'25" North, 96°17'45" West (33.690278, -96.295833). According to the United States Census Bureau, the town has a total area of 0.7 square miles (1.8 km2), all of it land.
Economy
The economy of Savoy is largely based on agriculture. The town is home to several farms and ranches, as well as a few small businesses.
Demographics
As of the census of 2000, there were 1,072 people, 431 households, and 294 families residing in the town. The population density was 1,521.2 people per square mile (586.2/km2). There were 476 housing units at an average density of 672.2 per square mile (259.3/km2). The racial makeup of the town was 95.90% White, 0.09% African American, 0.09% Native American, 0.09% Asian, 0.09% Pacific Islander, 2.90% from other races, and 0.93% from two or more races. Hispanic or Latino of any race were 4.90% of the population.
There were 431 households, out of which 33.2% had children under the age of 18 living with them, 54.2% were married couples living together, 10.2% had a female householder with no husband present, and 31.7% were non-families. 28.2% of all households were made up of individuals, and 15.2% had someone living alone who was 65 years of age or older. The average household size was 2.49 and the average family size was 3.06.
In the town, the population was spread out, with 27.2% under the age of 18, 8.2% from 18 to 24, 25.2% from 25 to 44, 22.2% from 45 to 64, and 17.2% who were 65 years of age or older. The median age was 38 years. For every 100 females, there were 91.2 males. For every 100 females age 18 and over, there were 86.2 males.
The median income for a household in the town was $30,000, and the median income for a family was $35,000. Males had a median income of $30,000 versus $20,000 for females. The per capita income for the town was $14,000. About 11.2% of families and 14.2% of the population were below the poverty line, including 17.2% of those under age 18 and 14.2% of those age 65 or over.
Common Questions
What is Per Capita Income in Savoy?
Per Capita income in Savoy is $25,867.
What is the Median Family Income in Savoy?
Median Family Income in Savoy is $72,222.
What is the Median Household income in Savoy?
Median Household Income in Savoy is $54,833.
What is Income or Wage Gap in Savoy?
Income or Wage Gap in Savoy is 1.4%.
Women in Savoy earn 98.6 cents for every dollar earned by a man.
What is Inequality or Gini Index in Savoy?
Inequality or Gini Index in Savoy is 0.37.
What is the Total Population of Savoy?
Total Population of Savoy is 961.
What is the Total Male Population of Savoy?
Total Male Population of Savoy is 335.
What is the Total Female Population of Savoy?
Total Female Population of Savoy is 626.
What is the Ratio of Males per 100 Females in Savoy?
There are 53.51 Males per 100 Females in Savoy.
What is the Ratio of Females per 100 Males in Savoy?
There are 186.87 Females per 100 Males in Savoy.
What is the Median Population Age in Savoy?
Median Population Age in Savoy is 41.1 Years.
What is the Average Family Size in Savoy
Average Family Size in Savoy is 3.5 People.
What is the Average Household Size in Savoy
Average Household Size in Savoy is 2.9 People.
How Large is the Labor Force in Savoy?
There are 470 People in the Labor Forcein in Savoy.
What is the Percentage of People in the Labor Force in Savoy?
59.5% of People are in the Labor Force in Savoy.
What is the Unemployment Rate in Savoy?
Unemployment Rate in Savoy is 1.3%.