Zip Codes with the Highest Poverty Level Among Seniors Over the Age of 75 in Fort Worth, TX

RELATED REPORTS & OPTIONS

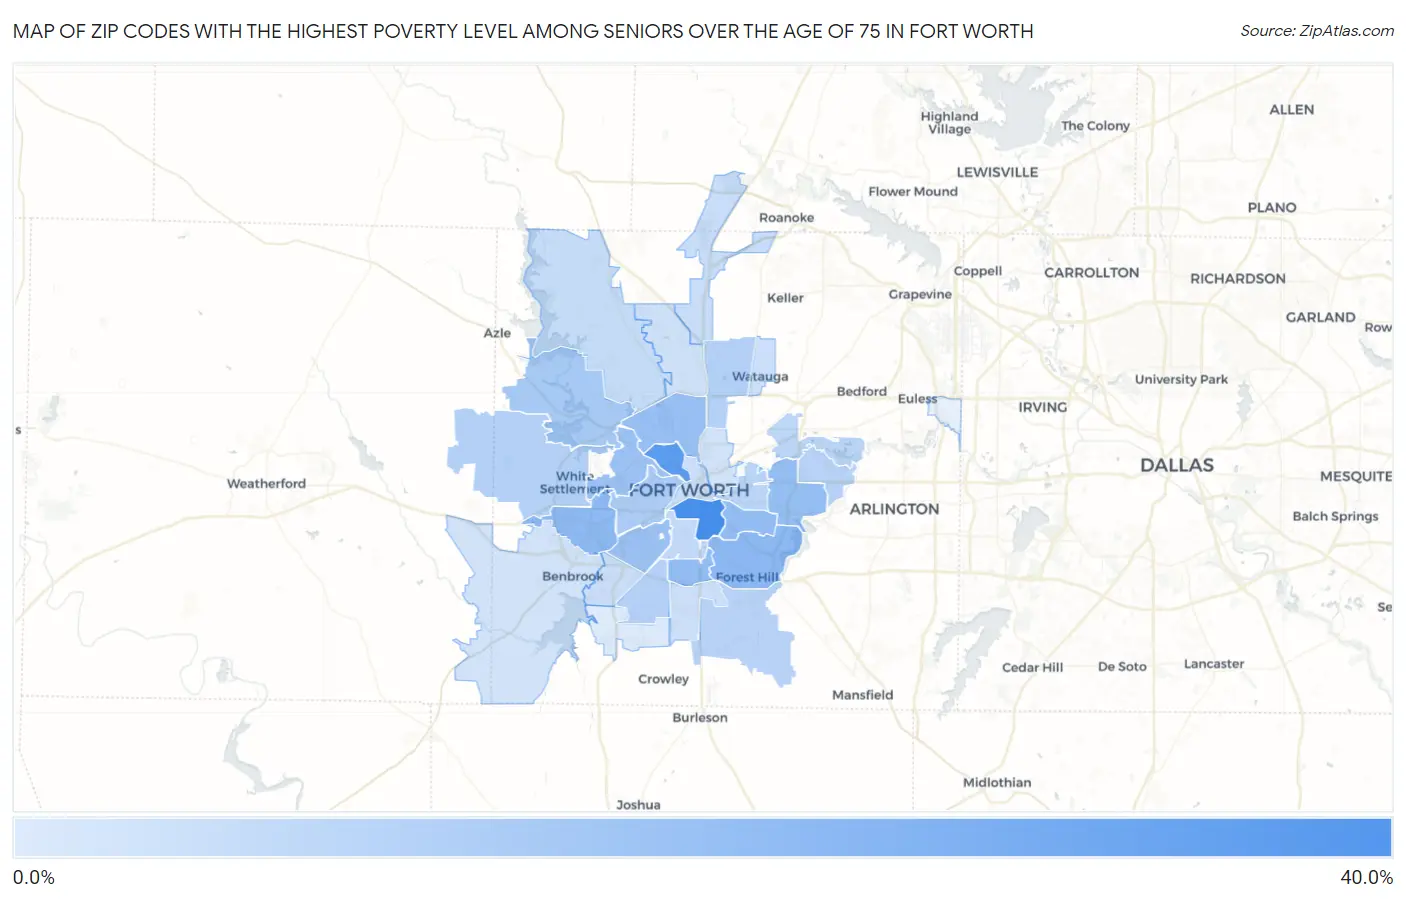
Highest Poverty | Seniors 75+
Population
Families and Households
Female Fertility
Female Fertility (Unmarried)
Race (Community Size)
Race (Percentage)
Ancestry (Community Size)
AfghanAfricanAlbanianAlsatianAmericanApacheArabArgentineanArmenianAustralianAustrianBahamianBangladeshiBarbadianBasqueBelgianBhutaneseBlackfeetBolivianBrazilianBritishBritish West IndianBulgarianBurmeseCajunCambodianCanadianCelticCentral AmericanCentral American IndianCherokeeCheyenneChickasawChileanChippewaChoctawColombianComancheCosta RicanCreekCroatianCrowCubanCzechCzechoslovakianDanishDelawareDominicanDutchDutch West IndianEastern EuropeanEcuadorianEgyptianEnglishEstonianEthiopianEuropeanFilipinoFinnishFrenchFrench American IndianFrench CanadianGermanGerman RussianGhanaianGreekGuamanian / ChamorroGuatemalanGuyaneseHaitianHonduranHopiHungarianIcelanderIndian (Asian)IndonesianInupiatIranianIraqiIrishIroquoisIsraeliItalianJamaicanJapaneseJordanianKenyanKiowaKoreanLaotianLatvianLebaneseLiberianLithuanianLuxembourgerMalaysianMalteseMexicanMexican American IndianMongolianMoroccanNative HawaiianNavajoNicaraguanNigerianNorthern EuropeanNorwegianOsageOttawaPakistaniPalestinianPanamanianPennsylvania GermanPeruvianPolishPortuguesePotawatomiPuebloPuerto RicanRomanianRussianSalvadoranSamoanScandinavianScotch-IrishScottishSerbianSiouxSlavicSlovakSloveneSomaliSouth AfricanSouth AmericanSouth American IndianSpaniardSpanishSpanish AmericanSpanish American IndianSri LankanSubsaharan AfricanSudaneseSwedishSwissSyrianThaiTonganTrinidadian and TobagonianTurkishUgandanUkrainianVenezuelanVietnameseWelshWest IndianYaquiYugoslavianZimbabwean
Ancestry (Percentage)
AfghanAfricanAlbanianAlsatianAmericanApacheArabArgentineanArmenianAustralianAustrianBahamianBangladeshiBarbadianBasqueBelgianBhutaneseBlackfeetBolivianBrazilianBritishBritish West IndianBulgarianBurmeseCajunCambodianCanadianCelticCentral AmericanCentral American IndianCherokeeCheyenneChickasawChileanChippewaChoctawColombianComancheCosta RicanCreekCroatianCrowCubanCzechCzechoslovakianDanishDelawareDominicanDutchDutch West IndianEastern EuropeanEcuadorianEgyptianEnglishEstonianEthiopianEuropeanFilipinoFinnishFrenchFrench American IndianFrench CanadianGermanGerman RussianGhanaianGreekGuamanian / ChamorroGuatemalanGuyaneseHaitianHonduranHopiHungarianIcelanderIndian (Asian)IndonesianInupiatIranianIraqiIrishIroquoisIsraeliItalianJamaicanJapaneseJordanianKenyanKiowaKoreanLaotianLatvianLebaneseLiberianLithuanianLuxembourgerMalaysianMalteseMexicanMexican American IndianMongolianMoroccanNative HawaiianNavajoNicaraguanNigerianNorthern EuropeanNorwegianOsageOttawaPakistaniPalestinianPanamanianPennsylvania GermanPeruvianPolishPortuguesePotawatomiPuebloPuerto RicanRomanianRussianSalvadoranSamoanScandinavianScotch-IrishScottishSerbianSiouxSlavicSlovakSloveneSomaliSouth AfricanSouth AmericanSouth American IndianSpaniardSpanishSpanish AmericanSpanish American IndianSri LankanSubsaharan AfricanSudaneseSwedishSwissSyrianThaiTonganTrinidadian and TobagonianTurkishUgandanUkrainianVenezuelanVietnameseWelshWest IndianYaquiYugoslavianZimbabwean
Immigrant Origin (Total)
AfghanistanAfricaAlbaniaArgentinaAsiaAustraliaBahamasBangladeshBarbadosBelarusBelizeBoliviaBosnia and HerzegovinaBrazilBulgariaBurma / MyanmarCambodiaCameroonCanadaCaribbeanCentral AmericaChileChinaColombiaCongoCosta RicaCroatiaCubaCzechoslovakiaDominican RepublicEastern AfricaEastern AsiaEastern EuropeEcuadorEgyptEl SalvadorEnglandEritreaEthiopiaEuropeFranceGermanyGhanaGreeceGuatemalaHaitiHondurasHong KongHungaryIndiaIndonesiaIranIraqIrelandIsraelItalyJamaicaJapanJordanKenyaKoreaLaosLatin AmericaLebanonLiberiaMalaysiaMexicoMicronesiaMiddle AfricaMoroccoNepalNetherlandsNicaraguaNigeriaNorthern AfricaNorthern EuropeOceaniaPakistanPanamaPeruPhilippinesPolandPortugalRomaniaRussiaScotlandSenegalSerbiaSomaliaSouth AfricaSouth AmericaSouth Central AsiaSouth Eastern AsiaSouthern EuropeSpainSri LankaSudanSwedenSwitzerlandSyriaTaiwanThailandTrinidad and TobagoTurkeyUgandaUkraineVenezuelaVietnamWestern AfricaWestern AsiaWestern EuropeZaireZimbabwe
Immigrant Origin (Percentage)
AfghanistanAfricaAlbaniaArgentinaAsiaAustraliaBahamasBangladeshBarbadosBelarusBelizeBoliviaBosnia and HerzegovinaBrazilBulgariaBurma / MyanmarCambodiaCameroonCanadaCaribbeanCentral AmericaChileChinaColombiaCongoCosta RicaCroatiaCubaCzechoslovakiaDominican RepublicEastern AfricaEastern AsiaEastern EuropeEcuadorEgyptEl SalvadorEnglandEritreaEthiopiaEuropeFranceGermanyGhanaGreeceGuatemalaHaitiHondurasHong KongHungaryIndiaIndonesiaIranIraqIrelandIsraelItalyJamaicaJapanJordanKenyaKoreaLaosLatin AmericaLebanonLiberiaMalaysiaMexicoMicronesiaMiddle AfricaMoroccoNepalNetherlandsNicaraguaNigeriaNorthern AfricaNorthern EuropeOceaniaPakistanPanamaPeruPhilippinesPolandPortugalRomaniaRussiaScotlandSenegalSerbiaSomaliaSouth AfricaSouth AmericaSouth Central AsiaSouth Eastern AsiaSouthern EuropeSpainSri LankaSudanSwedenSwitzerlandSyriaTaiwanThailandTrinidad and TobagoTurkeyUgandaUkraineVenezuelaVietnamWestern AfricaWestern AsiaWestern EuropeZaireZimbabwe
Income
Income (Families)
Income (Households)
Poverty
Poverty (Families)
Unemployment
Employment Occupations
Employment Industries
Employer Class
Commute Time
Commute Means
School Enrollment
Education by Degree Field
Occupancy
Finances
Physical Characteristics
Fort Worth
Compare Zip Codes
Comparison Subject

Map of Zip Codes with the Highest Poverty Level Among Seniors Over the Age of 75 in Fort Worth

0.0%
40.0%
Zip Codes with the Highest Poverty Level Among Seniors Over the Age of 75 in Fort Worth Map

Zip Codes with the Highest Poverty Level Among Seniors Over the Age of 75 in Fort Worth, TX

Zip Code Senior Poverty vs State vs National
1.7610432.0%12.7%(+19.3)#13911.1%(+20.9)#2,117
2.7616427.1%12.7%(+14.5)#19811.1%(+16.1)#2,895
3.7611916.6%12.7%(+3.97)#49211.1%(+5.58)#6,879
4.7611616.3%12.7%(+3.61)#50711.1%(+5.21)#7,088
5.7610515.3%12.7%(+2.62)#55211.1%(+4.23)#7,744
6.7611515.1%12.7%(+2.44)#56811.1%(+4.04)#7,873
7.7611214.5%12.7%(+1.86)#59511.1%(+3.46)#8,325
8.7610614.4%12.7%(+1.74)#60211.1%(+3.34)#8,414
9.7610913.5%12.7%(+0.813)#65911.1%(+2.41)#9,275
10.7611413.4%12.7%(+0.690)#66611.1%(+2.29)#9,366
11.7613510.8%12.7%(-1.87)#83511.1%(-0.266)#12,189
12.7610710.0%12.7%(-2.67)#88411.1%(-1.07)#13,155
13.761378.7%12.7%(-3.99)#99211.1%(-2.38)#15,055
14.761338.7%12.7%(-4.00)#99611.1%(-2.40)#15,078
15.761088.5%12.7%(-4.15)#1,00511.1%(-2.55)#15,259
16.761407.8%12.7%(-4.87)#1,05111.1%(-3.27)#16,323
17.761207.8%12.7%(-4.89)#1,05411.1%(-3.29)#16,346
18.761037.3%12.7%(-5.38)#1,08811.1%(-3.78)#17,117
19.761186.7%12.7%(-5.94)#1,12211.1%(-4.34)#17,946
20.761105.9%12.7%(-6.75)#1,17811.1%(-5.14)#19,177
21.761795.3%12.7%(-7.41)#1,24011.1%(-5.80)#20,165
22.761774.7%12.7%(-7.93)#1,28611.1%(-6.32)#20,966
23.761024.3%12.7%(-8.37)#1,31811.1%(-6.77)#21,581
24.761324.2%12.7%(-8.47)#1,32511.1%(-6.87)#21,708
25.761343.8%12.7%(-8.85)#1,35211.1%(-7.25)#22,236
26.761483.7%12.7%(-8.94)#1,36211.1%(-7.34)#22,345
27.761313.4%12.7%(-9.25)#1,38011.1%(-7.65)#22,746
28.761113.1%12.7%(-9.62)#1,40211.1%(-8.01)#23,156
29.761263.0%12.7%(-9.65)#1,40511.1%(-8.05)#23,198
30.761230.93%12.7%(-11.7)#1,49911.1%(-10.1)#24,810

Common Questions

What are the Top 10 Zip Codes with the Highest Poverty Level Among Seniors Over the Age of 75 in Fort Worth, TX?
Top 10 Zip Codes with the Highest Poverty Level Among Seniors Over the Age of 75 in Fort Worth, TX are:
#1
32.0%
#2
27.1%
#3
16.6%
#4
16.3%
#5
15.3%
#6
15.1%
#7
14.5%
#8
14.4%
#9
13.5%
#10
13.4%
What zip code has the Highest Poverty Level Among Seniors Over the Age of 75 in Fort Worth, TX?
76104 has the Highest Poverty Level Among Seniors Over the Age of 75 in Fort Worth, TX with 32.0%.
What is the Poverty Level Among Seniors Over the Age of 75 in Fort Worth, TX?
Poverty Level Among Seniors Over the Age of 75 in Fort Worth is 10.7%.
What is the Poverty Level Among Seniors Over the Age of 75 in Texas?
Poverty Level Among Seniors Over the Age of 75 in Texas is 12.7%.
What is the Poverty Level Among Seniors Over the Age of 75 in the United States?
Poverty Level Among Seniors Over the Age of 75 in the United States is 11.1%.