White Deer, TX Map & Demographics
White Deer Map
White Deer Overview
$45,297
PER CAPITA INCOME
$131,806
AVG FAMILY INCOME
$113,173
AVG HOUSEHOLD INCOME
55.7%
WAGE / INCOME GAP [ % ]
44.3¢/ $1
WAGE / INCOME GAP [ $ ]
0.37
INEQUALITY / GINI INDEX
914
TOTAL POPULATION
509
MALE POPULATION
405
FEMALE POPULATION
125.68
MALES / 100 FEMALES
79.57
FEMALES / 100 MALES
38.9
MEDIAN AGE
3.1
AVG FAMILY SIZE
2.6
AVG HOUSEHOLD SIZE
475
LABOR FORCE [ PEOPLE ]
66.3%
PERCENT IN LABOR FORCE
3.6%
UNEMPLOYMENT RATE
White Deer Zip Codes
White Deer Area Codes
Income in White Deer
Income Overview in White Deer
Per Capita Income in White Deer is $45,297, while median incomes of families and households are $131,806 and $113,173 respectively.
| Characteristic | Number | Measure |
| Per Capita Income | 914 | $45,297 |
| Median Family Income | 235 | $131,806 |
| Mean Family Income | 235 | $140,174 |
| Median Household Income | 353 | $113,173 |
| Mean Household Income | 353 | $116,612 |
| Income Deficit | 235 | $0 |
| Wage / Income Gap (%) | 914 | 55.68% |
| Wage / Income Gap ($) | 914 | 44.32¢ per $1 |
| Gini / Inequality Index | 914 | 0.37 |
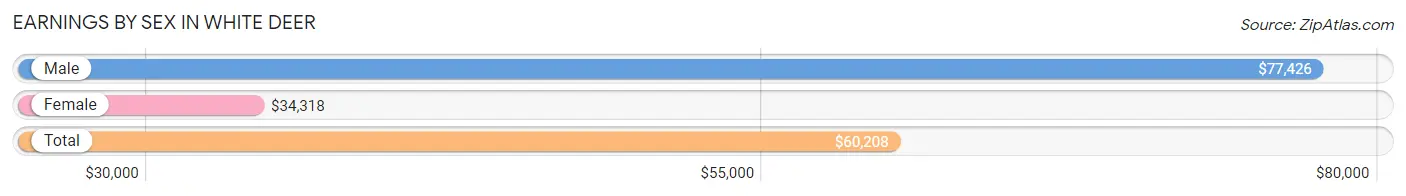
Earnings by Sex in White Deer
Average Earnings in White Deer are $60,208, $77,426 for men and $34,318 for women, a difference of 55.7%.
| Sex | Number | Average Earnings |
| Male | 309 (64.8%) | $77,426 |
| Female | 168 (35.2%) | $34,318 |
| Total | 477 (100.0%) | $60,208 |
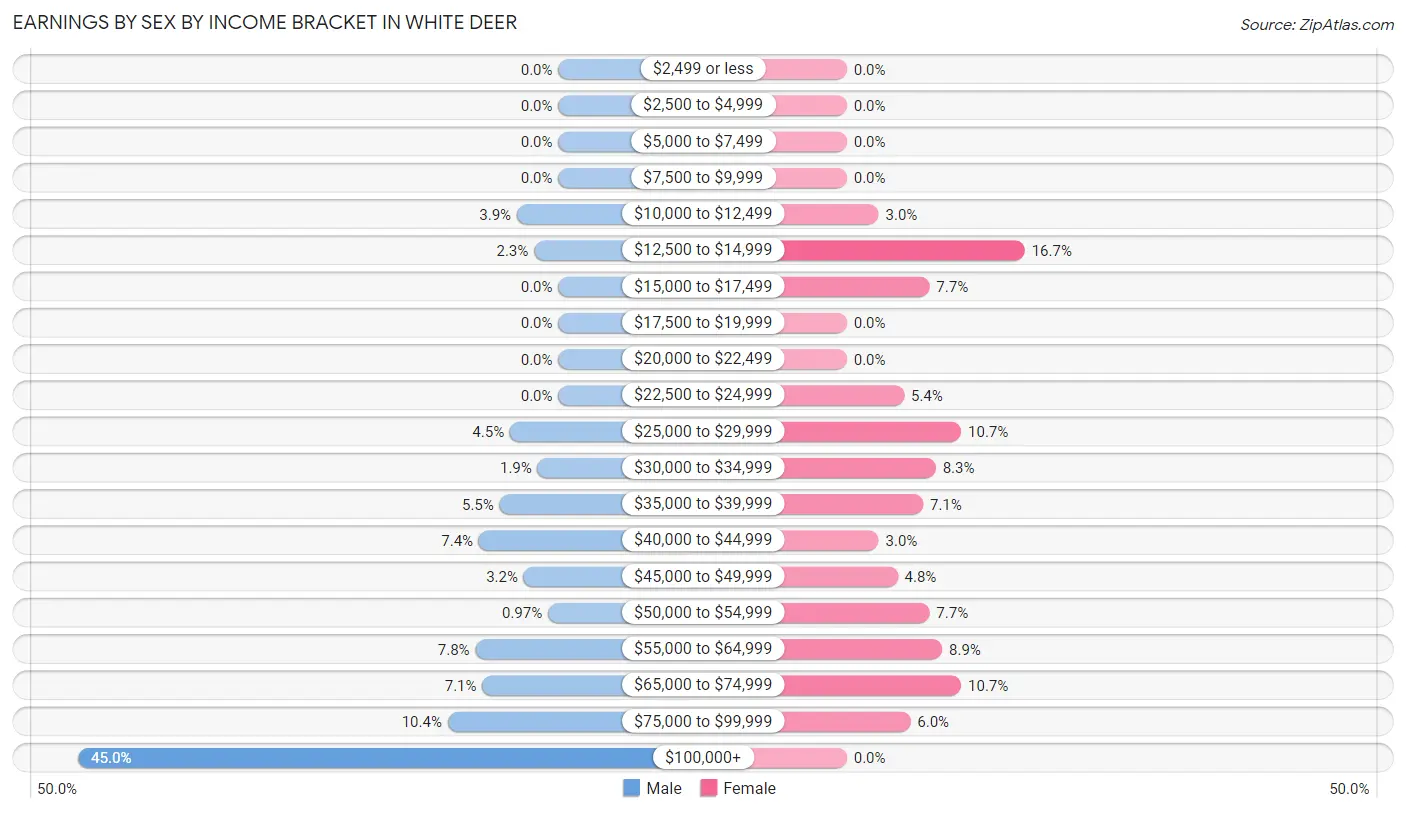
Earnings by Sex by Income Bracket in White Deer
The most common earnings brackets in White Deer are $100,000+ for men (139 | 45.0%) and $12,500 to $14,999 for women (28 | 16.7%).
| Income | Male | Female |
| $2,499 or less | 0 (0.0%) | 0 (0.0%) |
| $2,500 to $4,999 | 0 (0.0%) | 0 (0.0%) |
| $5,000 to $7,499 | 0 (0.0%) | 0 (0.0%) |
| $7,500 to $9,999 | 0 (0.0%) | 0 (0.0%) |
| $10,000 to $12,499 | 12 (3.9%) | 5 (3.0%) |
| $12,500 to $14,999 | 7 (2.3%) | 28 (16.7%) |
| $15,000 to $17,499 | 0 (0.0%) | 13 (7.7%) |
| $17,500 to $19,999 | 0 (0.0%) | 0 (0.0%) |
| $20,000 to $22,499 | 0 (0.0%) | 0 (0.0%) |
| $22,500 to $24,999 | 0 (0.0%) | 9 (5.4%) |
| $25,000 to $29,999 | 14 (4.5%) | 18 (10.7%) |
| $30,000 to $34,999 | 6 (1.9%) | 14 (8.3%) |
| $35,000 to $39,999 | 17 (5.5%) | 12 (7.1%) |
| $40,000 to $44,999 | 23 (7.4%) | 5 (3.0%) |
| $45,000 to $49,999 | 10 (3.2%) | 8 (4.8%) |
| $50,000 to $54,999 | 3 (1.0%) | 13 (7.7%) |
| $55,000 to $64,999 | 24 (7.8%) | 15 (8.9%) |
| $65,000 to $74,999 | 22 (7.1%) | 18 (10.7%) |
| $75,000 to $99,999 | 32 (10.4%) | 10 (5.9%) |
| $100,000+ | 139 (45.0%) | 0 (0.0%) |
| Total | 309 (100.0%) | 168 (100.0%) |
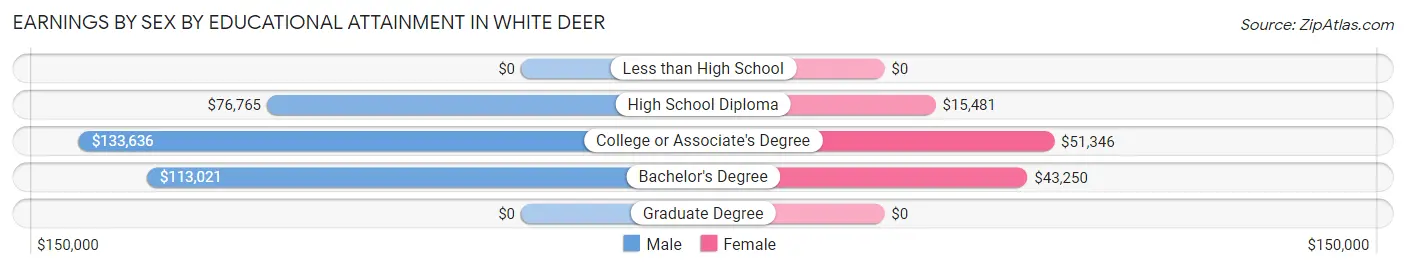
Earnings by Sex by Educational Attainment in White Deer
Average earnings in White Deer are $113,750 for men and $35,313 for women, a difference of 69.0%. Men with an educational attainment of college or associate's degree enjoy the highest average annual earnings of $133,636, while those with high school diploma education earn the least with $76,765. Women with an educational attainment of college or associate's degree earn the most with the average annual earnings of $51,346, while those with high school diploma education have the smallest earnings of $15,481.
| Educational Attainment | Male Income | Female Income |
| Less than High School | - | - |
| High School Diploma | $76,765 | $15,481 |
| College or Associate's Degree | $133,636 | $51,346 |
| Bachelor's Degree | $113,021 | $43,250 |
| Graduate Degree | - | - |
| Total | $113,750 | $35,313 |
Family Income in White Deer
Family Income Brackets in White Deer
According to the White Deer family income data, there are 66 families falling into the $200,000+ income range, which is the most common income bracket and makes up 28.1% of all families.
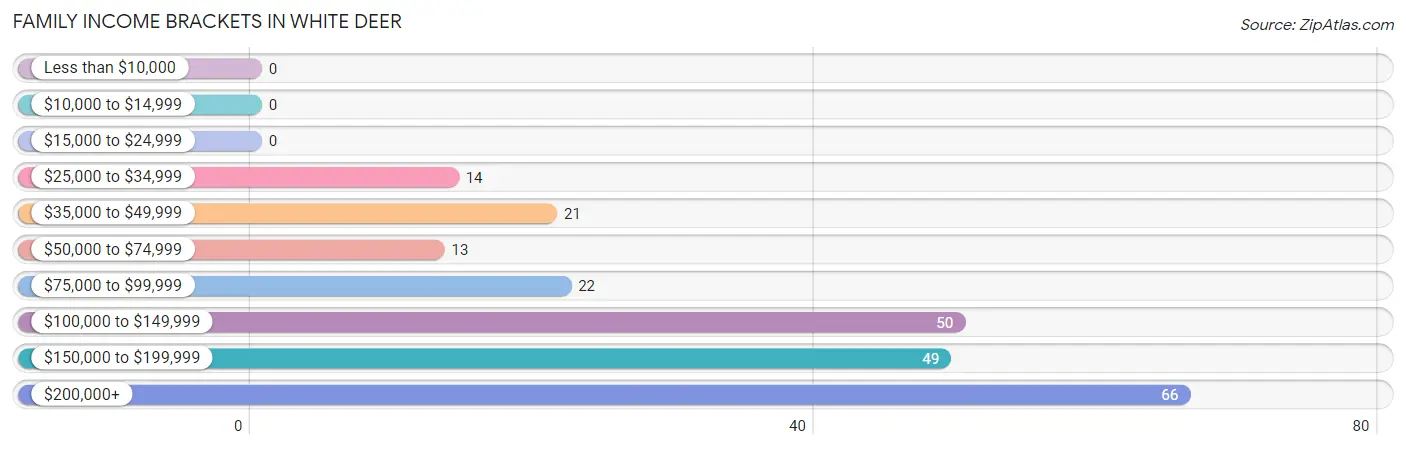
| Income Bracket | # Families | % Families |
| Less than $10,000 | 0 | 0.0% |
| $10,000 to $14,999 | 0 | 0.0% |
| $15,000 to $24,999 | 0 | 0.0% |
| $25,000 to $34,999 | 14 | 6.0% |
| $35,000 to $49,999 | 21 | 8.9% |
| $50,000 to $74,999 | 13 | 5.5% |
| $75,000 to $99,999 | 22 | 9.4% |
| $100,000 to $149,999 | 50 | 21.3% |
| $150,000 to $199,999 | 49 | 20.9% |
| $200,000+ | 66 | 28.1% |
Family Income by Famaliy Size in White Deer
3-person families (68 | 28.9%) account for the highest median family income in White Deer with $210,147 per family, while 3-person families (68 | 28.9%) have the highest median income of $70,049 per family member.

| Income Bracket | # Families | Median Income |
| 2-Person Families | 95 (40.4%) | $91,875 |
| 3-Person Families | 68 (28.9%) | $210,147 |
| 4-Person Families | 34 (14.5%) | $130,556 |
| 5-Person Families | 27 (11.5%) | $114,519 |
| 6-Person Families | 11 (4.7%) | $0 |
| 7+ Person Families | 0 (0.0%) | $0 |
| Total | 235 (100.0%) | $131,806 |
Family Income by Number of Earners in White Deer
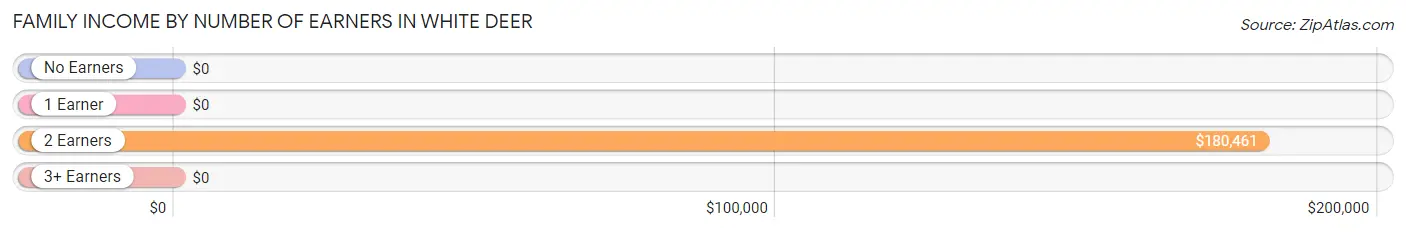
| Number of Earners | # Families | Median Income |
| No Earners | 29 (12.3%) | $0 |
| 1 Earner | 42 (17.9%) | $0 |
| 2 Earners | 153 (65.1%) | $180,461 |
| 3+ Earners | 11 (4.7%) | $0 |
| Total | 235 (100.0%) | $131,806 |
Household Income in White Deer
Household Income Brackets in White Deer
With 81 households falling in the category, the $200,000+ income range is the most frequent in White Deer, accounting for 23.0% of all households.
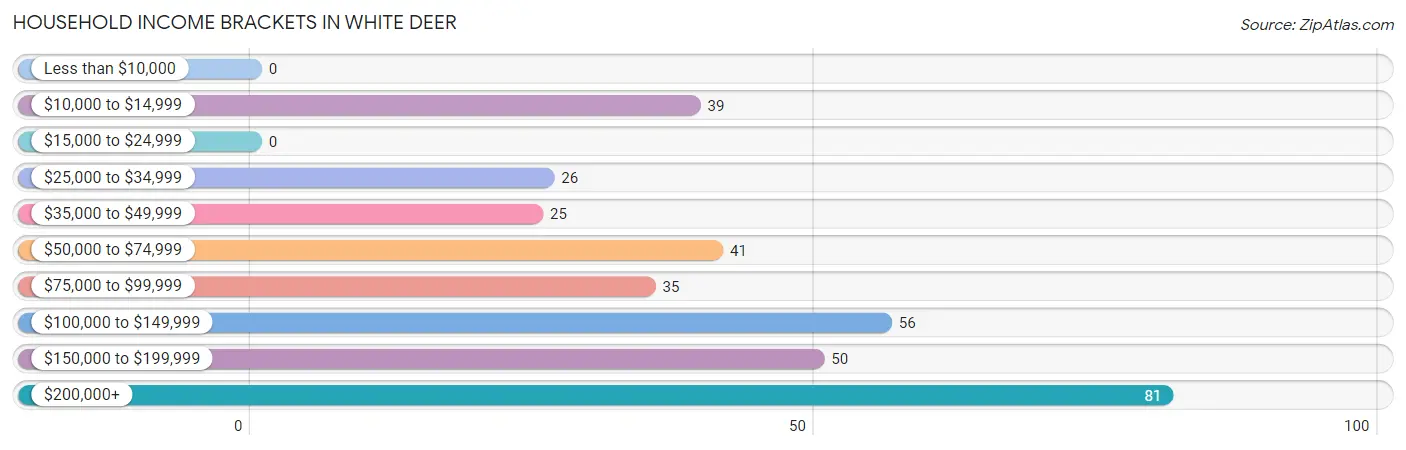
| Income Bracket | # Households | % Households |
| Less than $10,000 | 0 | 0.0% |
| $10,000 to $14,999 | 39 | 11.0% |
| $15,000 to $24,999 | 0 | 0.0% |
| $25,000 to $34,999 | 26 | 7.4% |
| $35,000 to $49,999 | 25 | 7.1% |
| $50,000 to $74,999 | 41 | 11.6% |
| $75,000 to $99,999 | 35 | 9.9% |
| $100,000 to $149,999 | 56 | 15.9% |
| $150,000 to $199,999 | 50 | 14.2% |
| $200,000+ | 81 | 22.9% |
Household Income by Householder Age in White Deer
The median household income in White Deer is $113,173, with the highest median household income of $205,066 found in the 25 to 44 years age bracket for the primary householder. A total of 161 households (45.6%) fall into this category. Meanwhile, the 65+ years age bracket for the primary householder has the lowest median household income of $29,375, with 75 households (21.2%) in this group.
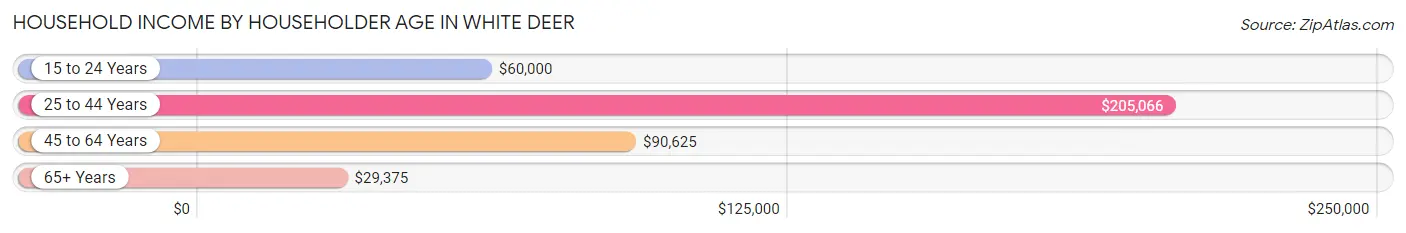
| Income Bracket | # Households | Median Income |
| 15 to 24 Years | 14 (4.0%) | $60,000 |
| 25 to 44 Years | 161 (45.6%) | $205,066 |
| 45 to 64 Years | 103 (29.2%) | $90,625 |
| 65+ Years | 75 (21.2%) | $29,375 |
| Total | 353 (100.0%) | $113,173 |
Poverty in White Deer
Income Below Poverty by Sex and Age in White Deer
With 3.1% poverty level for males and 14.6% for females among the residents of White Deer, 75 year old and over males and 18 to 24 year old females are the most vulnerable to poverty, with 9 males (42.9%) and 29 females (64.4%) in their respective age groups living below the poverty level.
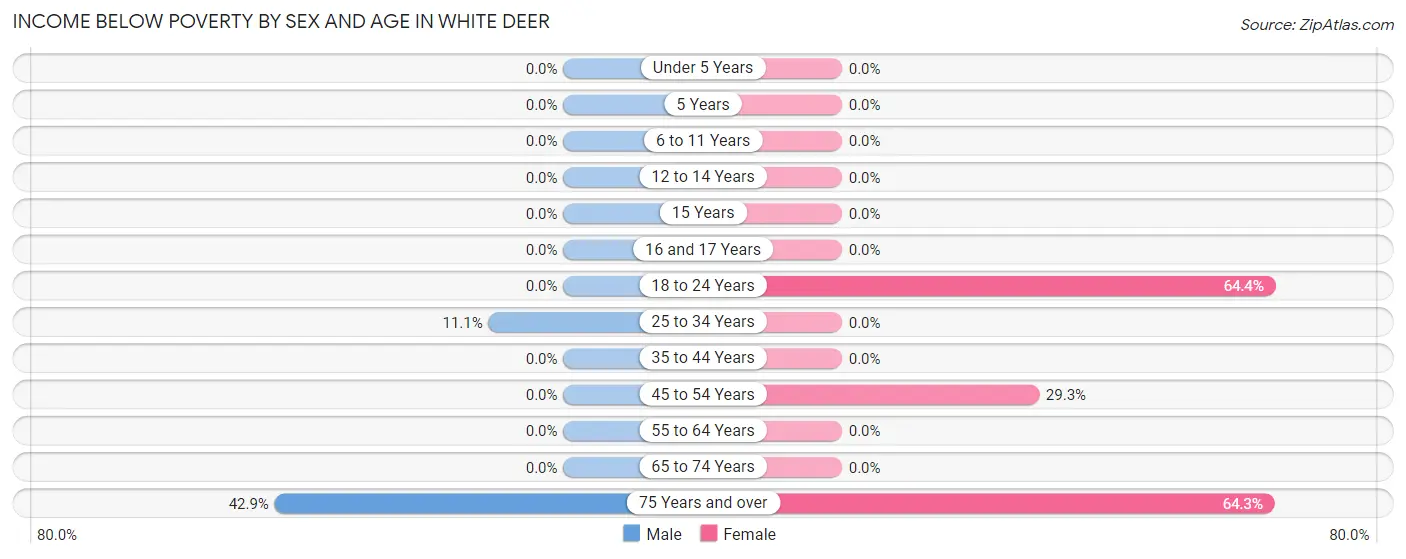
| Age Bracket | Male | Female |
| Under 5 Years | 0 (0.0%) | 0 (0.0%) |
| 5 Years | 0 (0.0%) | 0 (0.0%) |
| 6 to 11 Years | 0 (0.0%) | 0 (0.0%) |
| 12 to 14 Years | 0 (0.0%) | 0 (0.0%) |
| 15 Years | 0 (0.0%) | 0 (0.0%) |
| 16 and 17 Years | 0 (0.0%) | 0 (0.0%) |
| 18 to 24 Years | 0 (0.0%) | 29 (64.4%) |
| 25 to 34 Years | 7 (11.1%) | 0 (0.0%) |
| 35 to 44 Years | 0 (0.0%) | 0 (0.0%) |
| 45 to 54 Years | 0 (0.0%) | 12 (29.3%) |
| 55 to 64 Years | 0 (0.0%) | 0 (0.0%) |
| 65 to 74 Years | 0 (0.0%) | 0 (0.0%) |
| 75 Years and over | 9 (42.9%) | 18 (64.3%) |
| Total | 16 (3.1%) | 59 (14.6%) |
Income Above Poverty by Sex and Age in White Deer
According to the poverty statistics in White Deer, males aged under 5 years and females aged under 5 years are the age groups that are most secure financially, with 100.0% of males and 100.0% of females in these age groups living above the poverty line.
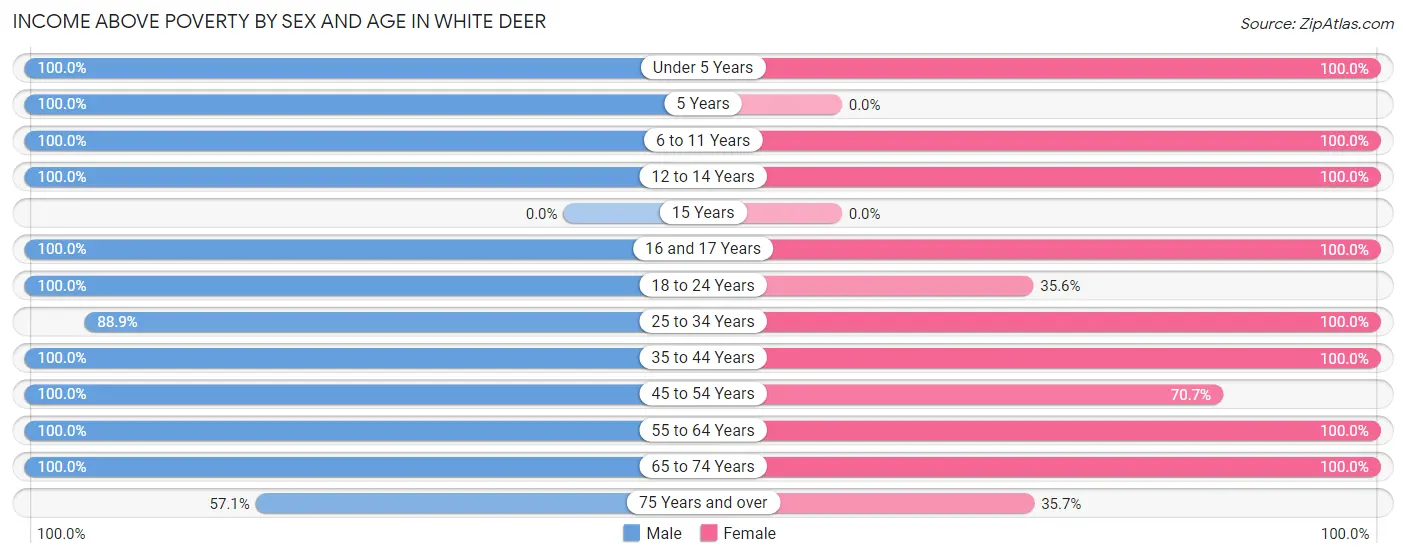
| Age Bracket | Male | Female |
| Under 5 Years | 16 (100.0%) | 36 (100.0%) |
| 5 Years | 8 (100.0%) | 0 (0.0%) |
| 6 to 11 Years | 60 (100.0%) | 33 (100.0%) |
| 12 to 14 Years | 16 (100.0%) | 29 (100.0%) |
| 15 Years | 0 (0.0%) | 0 (0.0%) |
| 16 and 17 Years | 14 (100.0%) | 14 (100.0%) |
| 18 to 24 Years | 46 (100.0%) | 16 (35.6%) |
| 25 to 34 Years | 56 (88.9%) | 29 (100.0%) |
| 35 to 44 Years | 131 (100.0%) | 69 (100.0%) |
| 45 to 54 Years | 23 (100.0%) | 29 (70.7%) |
| 55 to 64 Years | 54 (100.0%) | 55 (100.0%) |
| 65 to 74 Years | 57 (100.0%) | 26 (100.0%) |
| 75 Years and over | 12 (57.1%) | 10 (35.7%) |
| Total | 493 (96.9%) | 346 (85.4%) |
Income Below Poverty Among Married-Couple Families in White Deer
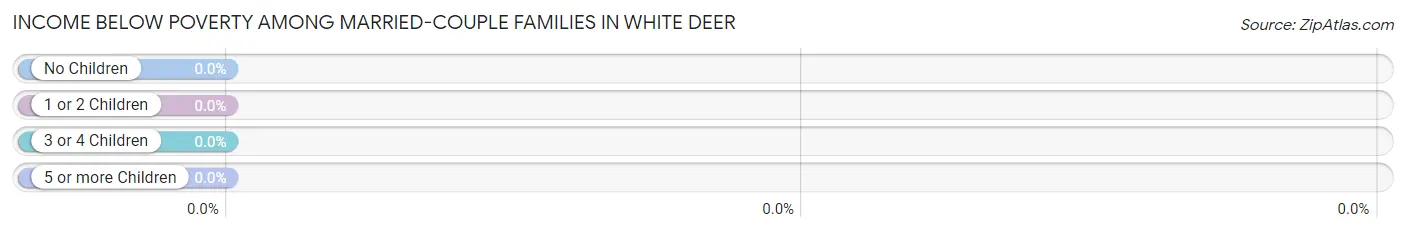
| Children | Above Poverty | Below Poverty |
| No Children | 118 (100.0%) | 0 (0.0%) |
| 1 or 2 Children | 36 (100.0%) | 0 (0.0%) |
| 3 or 4 Children | 38 (100.0%) | 0 (0.0%) |
| 5 or more Children | 0 (0.0%) | 0 (0.0%) |
| Total | 192 (100.0%) | 0 (0.0%) |
Income Below Poverty Among Single-Parent Households in White Deer
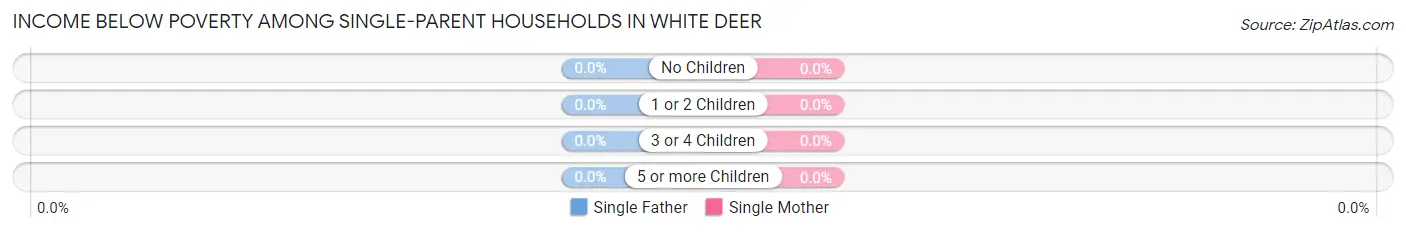
| Children | Single Father | Single Mother |
| No Children | 0 (0.0%) | 0 (0.0%) |
| 1 or 2 Children | 0 (0.0%) | 0 (0.0%) |
| 3 or 4 Children | 0 (0.0%) | 0 (0.0%) |
| 5 or more Children | 0 (0.0%) | 0 (0.0%) |
| Total | 0 (0.0%) | 0 (0.0%) |
Income Below Poverty Among Married-Couple vs Single-Parent Households in White Deer
| Children | Married-Couple Families | Single-Parent Households |
| No Children | 0 (0.0%) | 0 (0.0%) |
| 1 or 2 Children | 0 (0.0%) | 0 (0.0%) |
| 3 or 4 Children | 0 (0.0%) | 0 (0.0%) |
| 5 or more Children | 0 (0.0%) | 0 (0.0%) |
| Total | 0 (0.0%) | 0 (0.0%) |
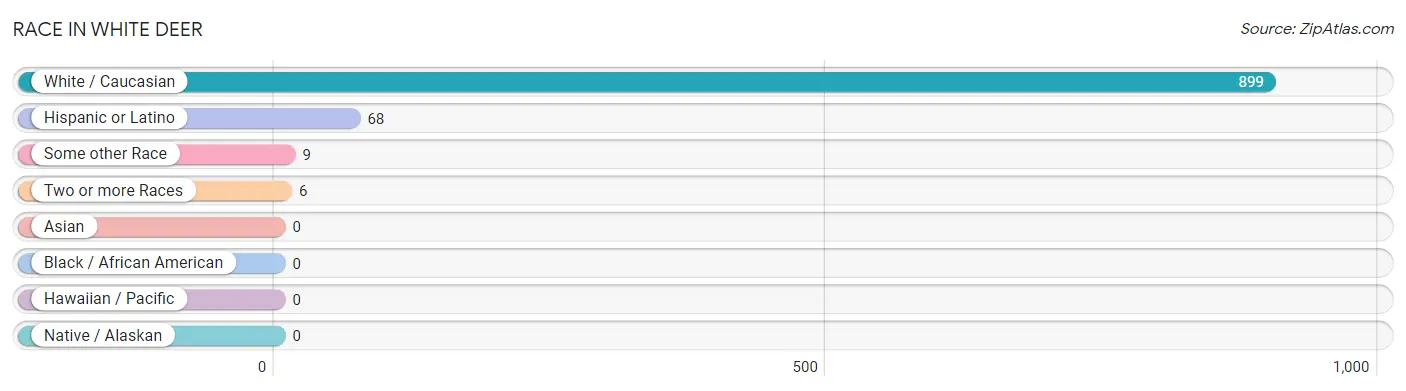
Race in White Deer
The most populous races in White Deer are White / Caucasian (899 | 98.4%), Hispanic or Latino (68 | 7.4%), and Some other Race (9 | 1.0%).
| Race | # Population | % Population |
| Asian | 0 | 0.0% |
| Black / African American | 0 | 0.0% |
| Hawaiian / Pacific | 0 | 0.0% |
| Hispanic or Latino | 68 | 7.4% |
| Native / Alaskan | 0 | 0.0% |
| White / Caucasian | 899 | 98.4% |
| Two or more Races | 6 | 0.7% |
| Some other Race | 9 | 1.0% |
| Total | 914 | 100.0% |
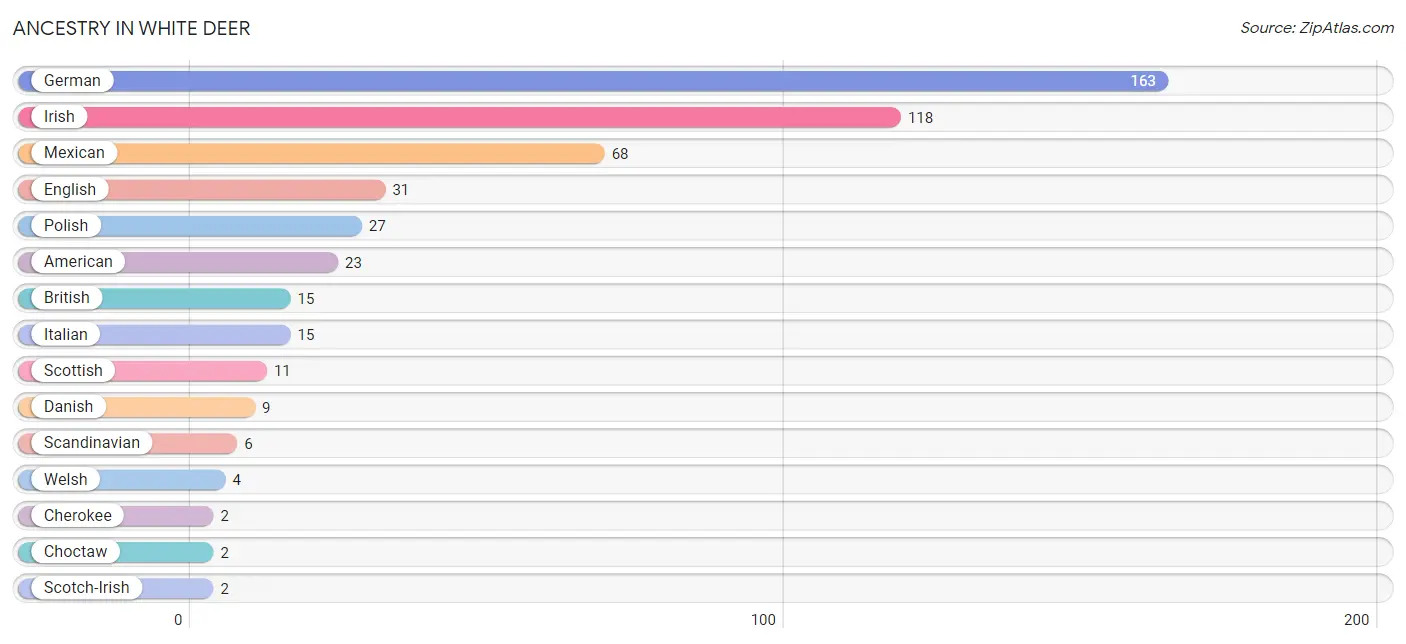
Ancestry in White Deer
The most populous ancestries reported in White Deer are German (163 | 17.8%), Irish (118 | 12.9%), Mexican (68 | 7.4%), English (31 | 3.4%), and Polish (27 | 2.9%), together accounting for 44.5% of all White Deer residents.
| Ancestry | # Population | % Population |
| American | 23 | 2.5% |
| British | 15 | 1.6% |
| Cherokee | 2 | 0.2% |
| Choctaw | 2 | 0.2% |
| Danish | 9 | 1.0% |
| English | 31 | 3.4% |
| German | 163 | 17.8% |
| Irish | 118 | 12.9% |
| Italian | 15 | 1.6% |
| Mexican | 68 | 7.4% |
| Polish | 27 | 2.9% |
| Scandinavian | 6 | 0.7% |
| Scotch-Irish | 2 | 0.2% |
| Scottish | 11 | 1.2% |
| Welsh | 4 | 0.4% | View All 15 Rows |
Immigrants in White Deer

| Immigration Origin | # Population | % Population | View All 0 Rows |
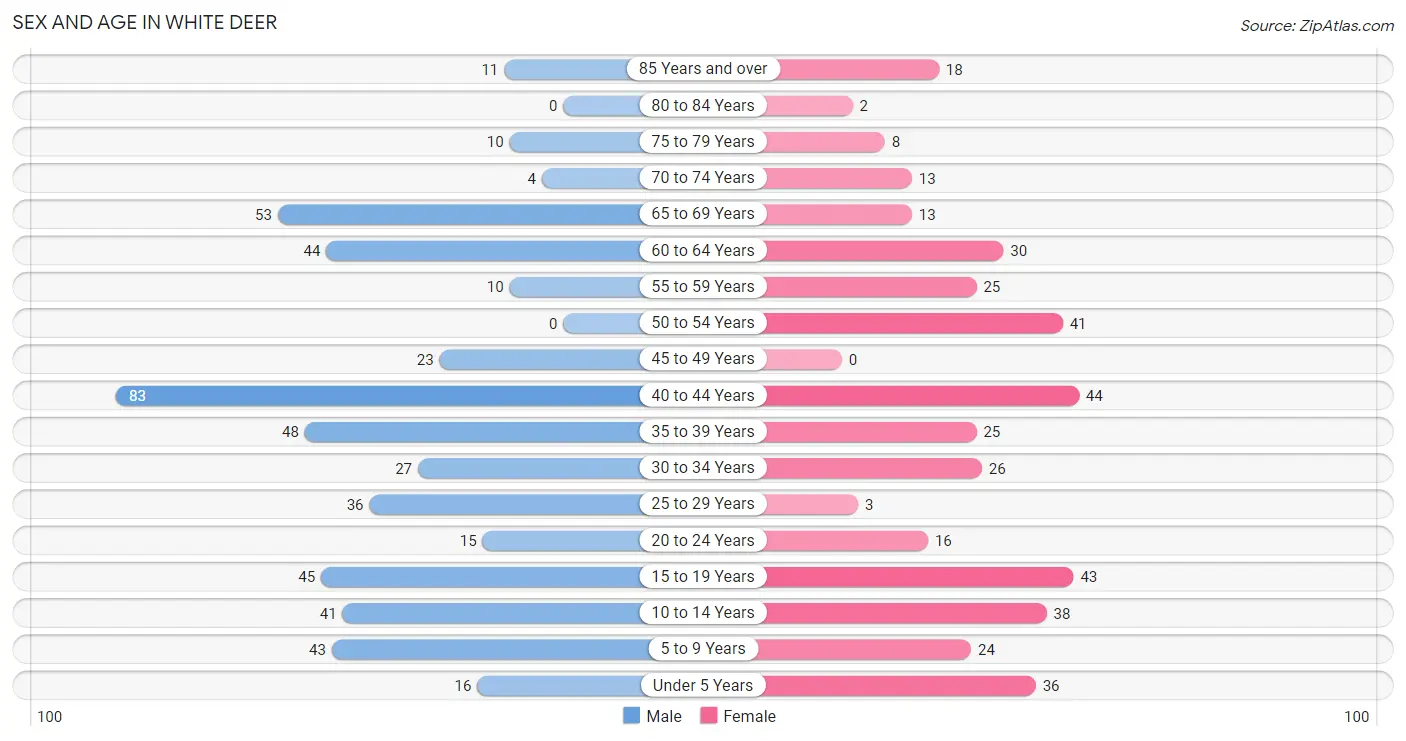
Sex and Age in White Deer
Sex and Age in White Deer
The most populous age groups in White Deer are 40 to 44 Years (83 | 16.3%) for men and 40 to 44 Years (44 | 10.9%) for women.
| Age Bracket | Male | Female |
| Under 5 Years | 16 (3.1%) | 36 (8.9%) |
| 5 to 9 Years | 43 (8.5%) | 24 (5.9%) |
| 10 to 14 Years | 41 (8.1%) | 38 (9.4%) |
| 15 to 19 Years | 45 (8.8%) | 43 (10.6%) |
| 20 to 24 Years | 15 (2.9%) | 16 (4.0%) |
| 25 to 29 Years | 36 (7.1%) | 3 (0.7%) |
| 30 to 34 Years | 27 (5.3%) | 26 (6.4%) |
| 35 to 39 Years | 48 (9.4%) | 25 (6.2%) |
| 40 to 44 Years | 83 (16.3%) | 44 (10.9%) |
| 45 to 49 Years | 23 (4.5%) | 0 (0.0%) |
| 50 to 54 Years | 0 (0.0%) | 41 (10.1%) |
| 55 to 59 Years | 10 (2.0%) | 25 (6.2%) |
| 60 to 64 Years | 44 (8.6%) | 30 (7.4%) |
| 65 to 69 Years | 53 (10.4%) | 13 (3.2%) |
| 70 to 74 Years | 4 (0.8%) | 13 (3.2%) |
| 75 to 79 Years | 10 (2.0%) | 8 (2.0%) |
| 80 to 84 Years | 0 (0.0%) | 2 (0.5%) |
| 85 Years and over | 11 (2.2%) | 18 (4.4%) |
| Total | 509 (100.0%) | 405 (100.0%) |
Families and Households in White Deer
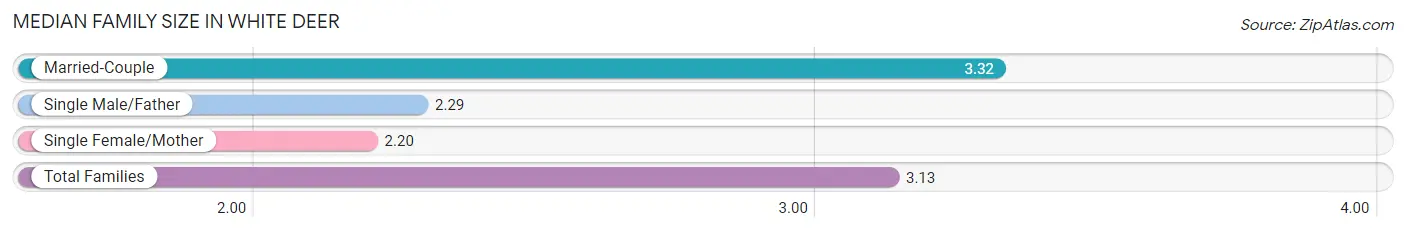
Median Family Size in White Deer
The median family size in White Deer is 3.13 persons per family, with married-couple families (192 | 81.7%) accounting for the largest median family size of 3.32 persons per family. On the other hand, single female/mother families (5 | 2.1%) represent the smallest median family size with 2.20 persons per family.
| Family Type | # Families | Family Size |
| Married-Couple | 192 (81.7%) | 3.32 |
| Single Male/Father | 38 (16.2%) | 2.29 |
| Single Female/Mother | 5 (2.1%) | 2.20 |
| Total Families | 235 (100.0%) | 3.13 |
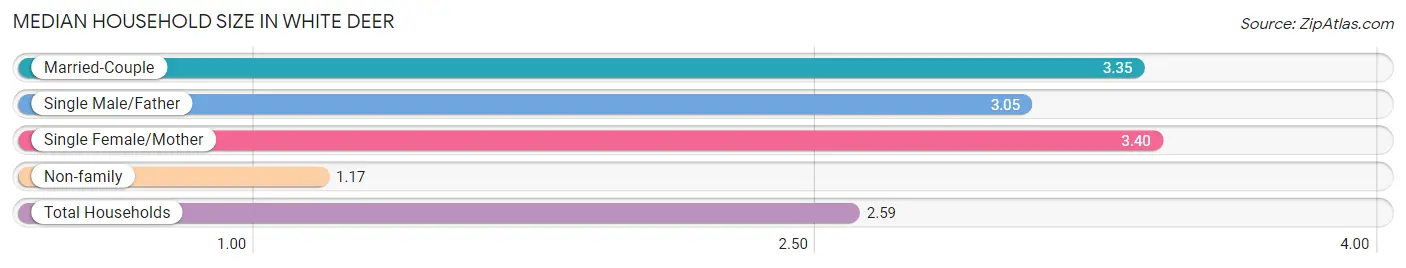
Median Household Size in White Deer
The median household size in White Deer is 2.59 persons per household, with single female/mother households (5 | 1.4%) accounting for the largest median household size of 3.4 persons per household. non-family households (118 | 33.4%) represent the smallest median household size with 1.17 persons per household.
| Household Type | # Households | Household Size |
| Married-Couple | 192 (54.4%) | 3.35 |
| Single Male/Father | 38 (10.8%) | 3.05 |
| Single Female/Mother | 5 (1.4%) | 3.40 |
| Non-family | 118 (33.4%) | 1.17 |
| Total Households | 353 (100.0%) | 2.59 |
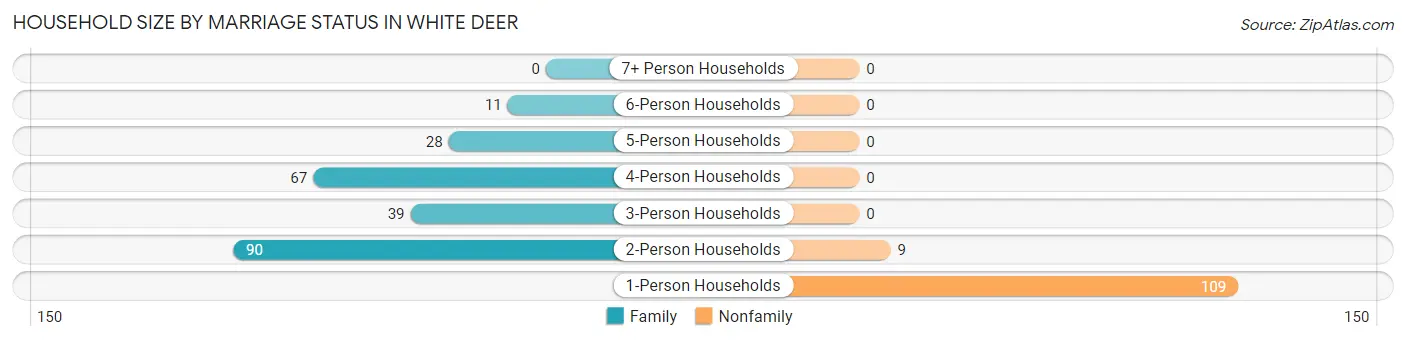
Household Size by Marriage Status in White Deer
Out of a total of 353 households in White Deer, 235 (66.6%) are family households, while 118 (33.4%) are nonfamily households. The most numerous type of family households are 2-person households, comprising 90, and the most common type of nonfamily households are 1-person households, comprising 109.
| Household Size | Family Households | Nonfamily Households |
| 1-Person Households | - | 109 (30.9%) |
| 2-Person Households | 90 (25.5%) | 9 (2.5%) |
| 3-Person Households | 39 (11.1%) | 0 (0.0%) |
| 4-Person Households | 67 (19.0%) | 0 (0.0%) |
| 5-Person Households | 28 (7.9%) | 0 (0.0%) |
| 6-Person Households | 11 (3.1%) | 0 (0.0%) |
| 7+ Person Households | 0 (0.0%) | 0 (0.0%) |
| Total | 235 (66.6%) | 118 (33.4%) |
Female Fertility in White Deer
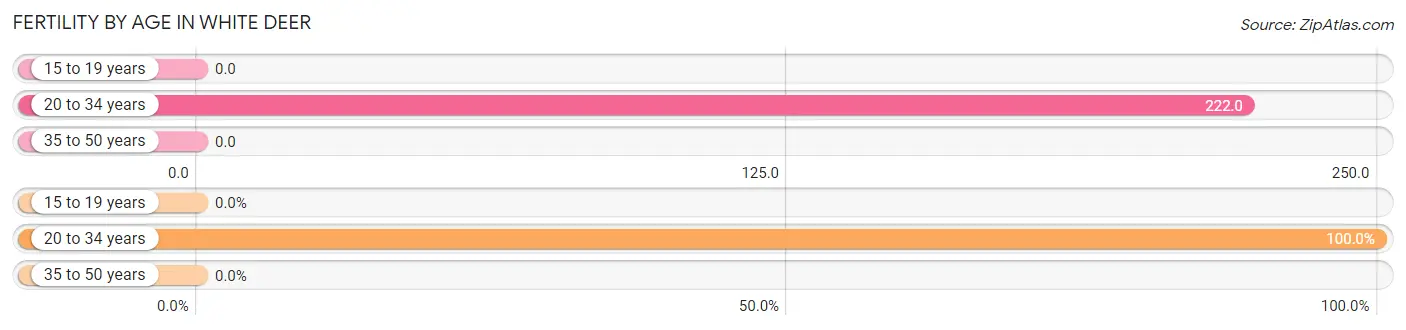
Fertility by Age in White Deer
Average fertility rate in White Deer is 64.0 births per 1,000 women. Women in the age bracket of 20 to 34 years have the highest fertility rate with 222.0 births per 1,000 women. Women in the age bracket of 20 to 34 years acount for 100.0% of all women with births.
| Age Bracket | Women with Births | Births / 1,000 Women |
| 15 to 19 years | 0 (0.0%) | 0.0 |
| 20 to 34 years | 10 (100.0%) | 222.0 |
| 35 to 50 years | 0 (0.0%) | 0.0 |
| Total | 10 (100.0%) | 64.0 |
Fertility by Age by Marriage Status in White Deer
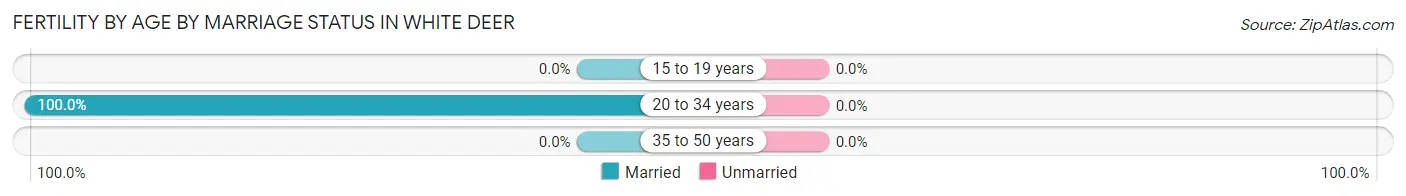
| Age Bracket | Married | Unmarried |
| 15 to 19 years | 0 (0.0%) | 0 (0.0%) |
| 20 to 34 years | 10 (100.0%) | 0 (0.0%) |
| 35 to 50 years | 0 (0.0%) | 0 (0.0%) |
| Total | 10 (100.0%) | 0 (0.0%) |
Fertility by Education in White Deer
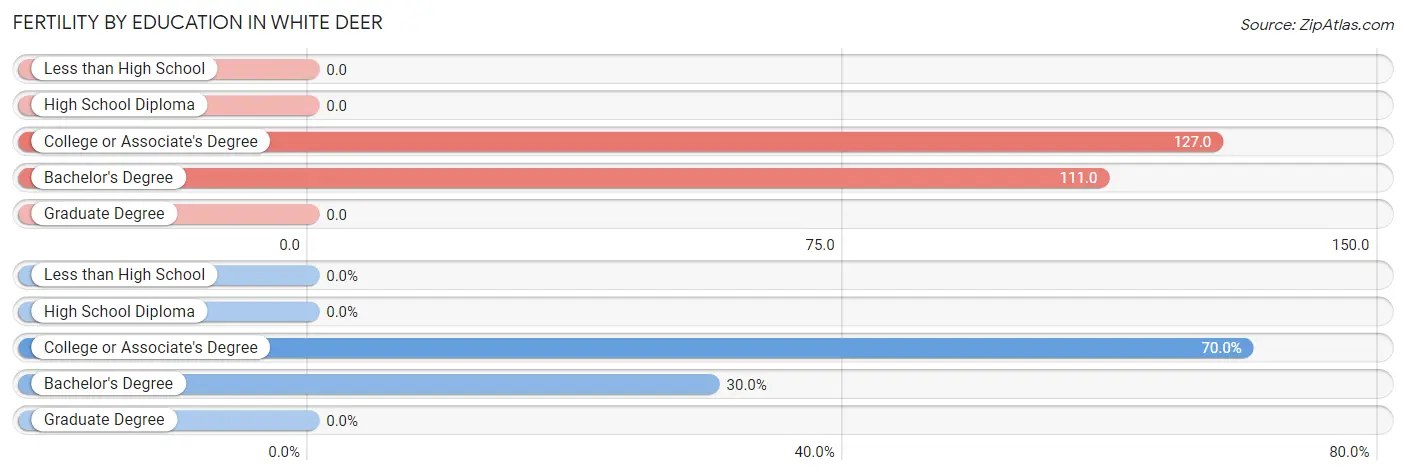
| Educational Attainment | Women with Births | Births / 1,000 Women |
| Less than High School | 0 (0.0%) | 0.0 |
| High School Diploma | 0 (0.0%) | 0.0 |
| College or Associate's Degree | 7 (70.0%) | 127.0 |
| Bachelor's Degree | 3 (30.0%) | 111.0 |
| Graduate Degree | 0 (0.0%) | 0.0 |
| Total | 10 (100.0%) | 64.0 |
Fertility by Education by Marriage Status in White Deer
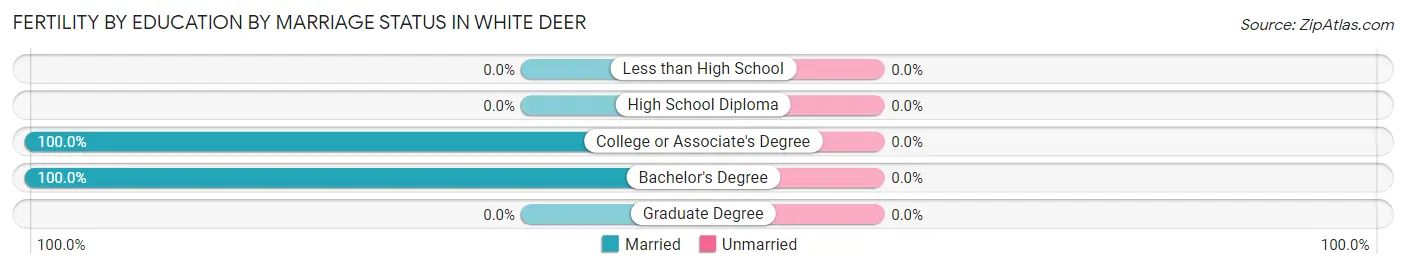
| Educational Attainment | Married | Unmarried |
| Less than High School | 0 (0.0%) | 0 (0.0%) |
| High School Diploma | 0 (0.0%) | 0 (0.0%) |
| College or Associate's Degree | 7 (100.0%) | 0 (0.0%) |
| Bachelor's Degree | 3 (100.0%) | 0 (0.0%) |
| Graduate Degree | 0 (0.0%) | 0 (0.0%) |
| Total | 10 (100.0%) | 0 (0.0%) |
Employment Characteristics in White Deer
Employment by Class of Employer in White Deer
Among the 458 employed individuals in White Deer, private company employees (257 | 56.1%), state government employees (55 | 12.0%), and self-employed (incorporated) (52 | 11.4%) make up the most common classes of employment.
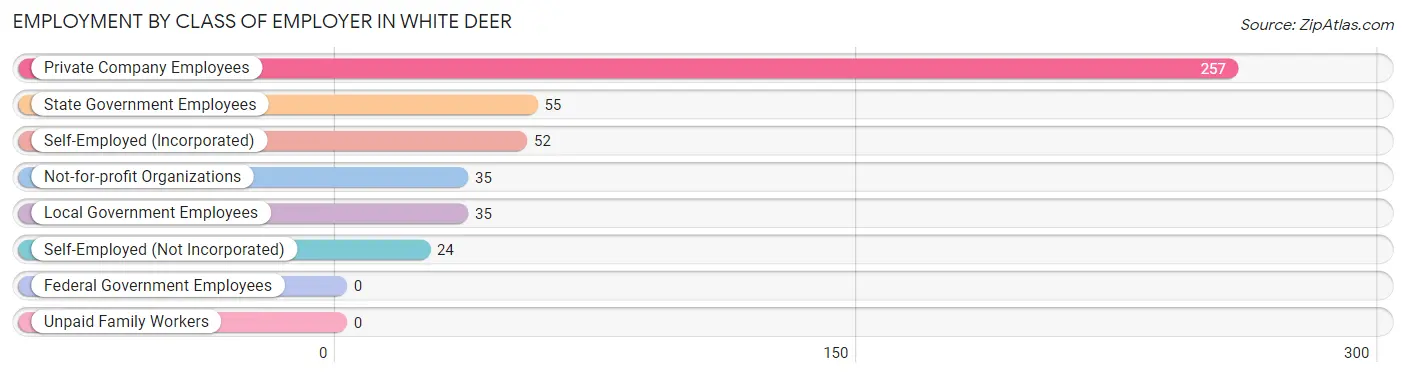
| Employer Class | # Employees | % Employees |
| Private Company Employees | 257 | 56.1% |
| Self-Employed (Incorporated) | 52 | 11.4% |
| Self-Employed (Not Incorporated) | 24 | 5.2% |
| Not-for-profit Organizations | 35 | 7.6% |
| Local Government Employees | 35 | 7.6% |
| State Government Employees | 55 | 12.0% |
| Federal Government Employees | 0 | 0.0% |
| Unpaid Family Workers | 0 | 0.0% |
| Total | 458 | 100.0% |
Employment Status by Age in White Deer
According to the labor force statistics for White Deer, out of the total population over 16 years of age (716), 66.3% or 475 individuals are in the labor force, with 3.6% or 17 of them unemployed. The age group with the highest labor force participation rate is 35 to 44 years, with 99.0% or 198 individuals in the labor force. Within the labor force, the 45 to 54 years age range has the highest percentage of unemployed individuals, with 22.2% or 12 of them being unemployed.
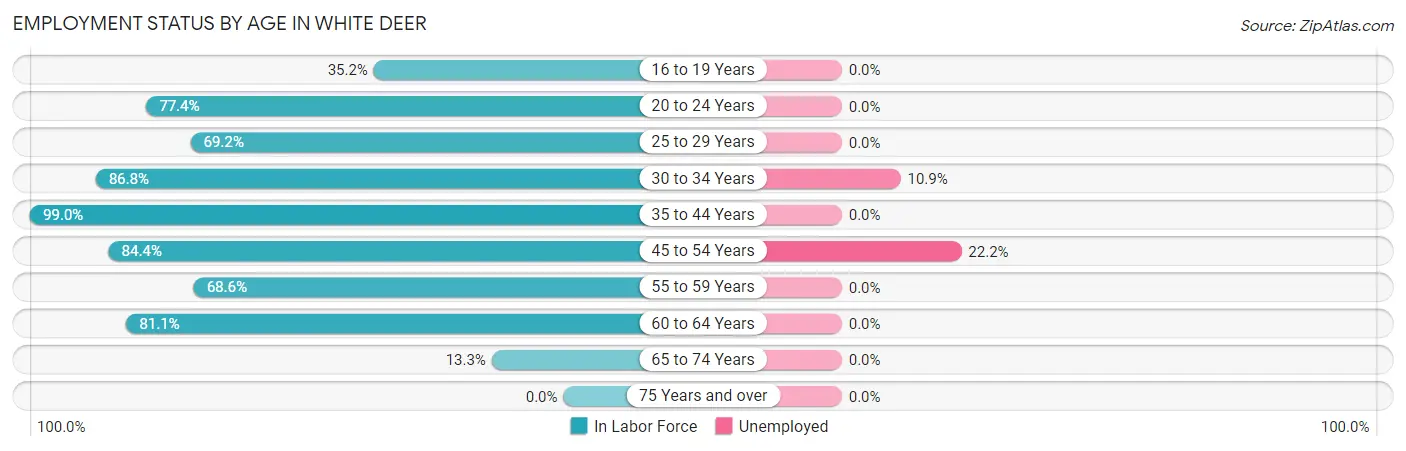
| Age Bracket | In Labor Force | Unemployed |
| 16 to 19 Years | 31 (35.2%) | 0 (0.0%) |
| 20 to 24 Years | 24 (77.4%) | 0 (0.0%) |
| 25 to 29 Years | 27 (69.2%) | 0 (0.0%) |
| 30 to 34 Years | 46 (86.8%) | 5 (10.9%) |
| 35 to 44 Years | 198 (99.0%) | 0 (0.0%) |
| 45 to 54 Years | 54 (84.4%) | 12 (22.2%) |
| 55 to 59 Years | 24 (68.6%) | 0 (0.0%) |
| 60 to 64 Years | 60 (81.1%) | 0 (0.0%) |
| 65 to 74 Years | 11 (13.3%) | 0 (0.0%) |
| 75 Years and over | 0 (0.0%) | 0 (0.0%) |
| Total | 475 (66.3%) | 17 (3.6%) |
Employment Status by Educational Attainment in White Deer
According to labor force statistics for White Deer, 88.0% of individuals (409) out of the total population between 25 and 64 years of age (465) are in the labor force, with 4.2% or 17 of them being unemployed. The group with the highest labor force participation rate are those with the educational attainment of bachelor's degree or higher, with 97.7% or 86 individuals in the labor force. Within the labor force, individuals with high school diploma education have the highest percentage of unemployment, with 11.2% or 12 of them being unemployed.
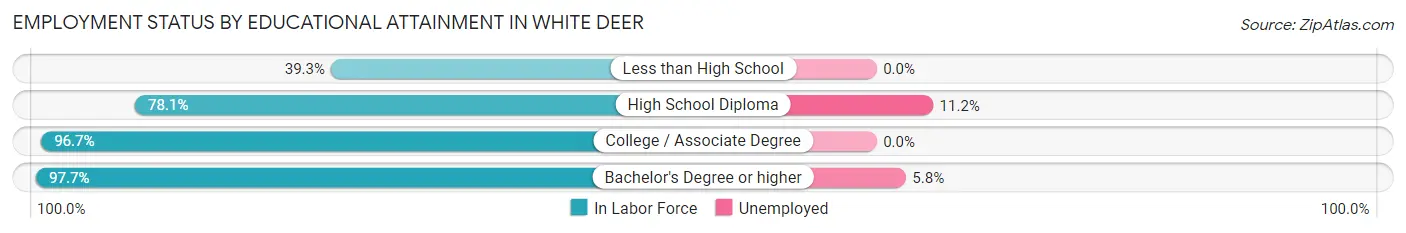
| Educational Attainment | In Labor Force | Unemployed |
| Less than High School | 11 (39.3%) | 0 (0.0%) |
| High School Diploma | 107 (78.1%) | 15 (11.2%) |
| College / Associate Degree | 205 (96.7%) | 0 (0.0%) |
| Bachelor's Degree or higher | 86 (97.7%) | 5 (5.8%) |
| Total | 409 (88.0%) | 20 (4.2%) |
Employment Occupations by Sex in White Deer
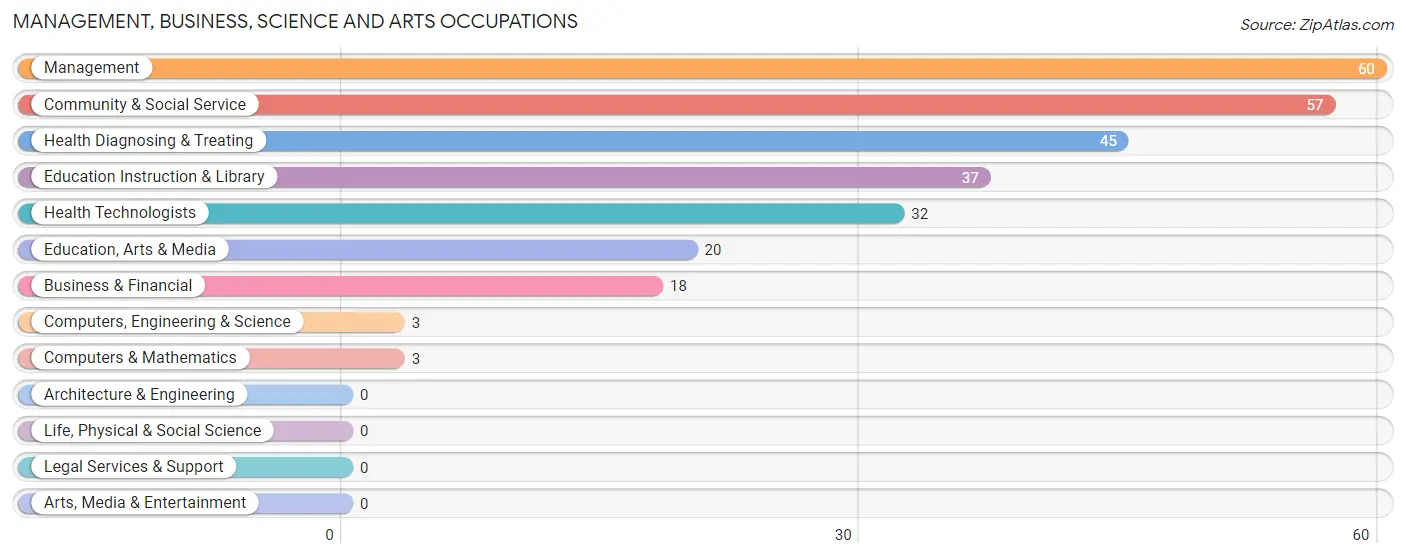
Management, Business, Science and Arts Occupations
The most common Management, Business, Science and Arts occupations in White Deer are Management (60 | 13.1%), Community & Social Service (57 | 12.4%), Health Diagnosing & Treating (45 | 9.8%), Education Instruction & Library (37 | 8.1%), and Health Technologists (32 | 7.0%).
Management, Business, Science and Arts Occupations by Sex
Within the Management, Business, Science and Arts occupations in White Deer, the most male-oriented occupations are Computers, Engineering & Science (100.0%), Computers & Mathematics (100.0%), and Education, Arts & Media (100.0%), while the most female-oriented occupations are Education Instruction & Library (100.0%), Business & Financial (66.7%), and Health Diagnosing & Treating (66.7%).
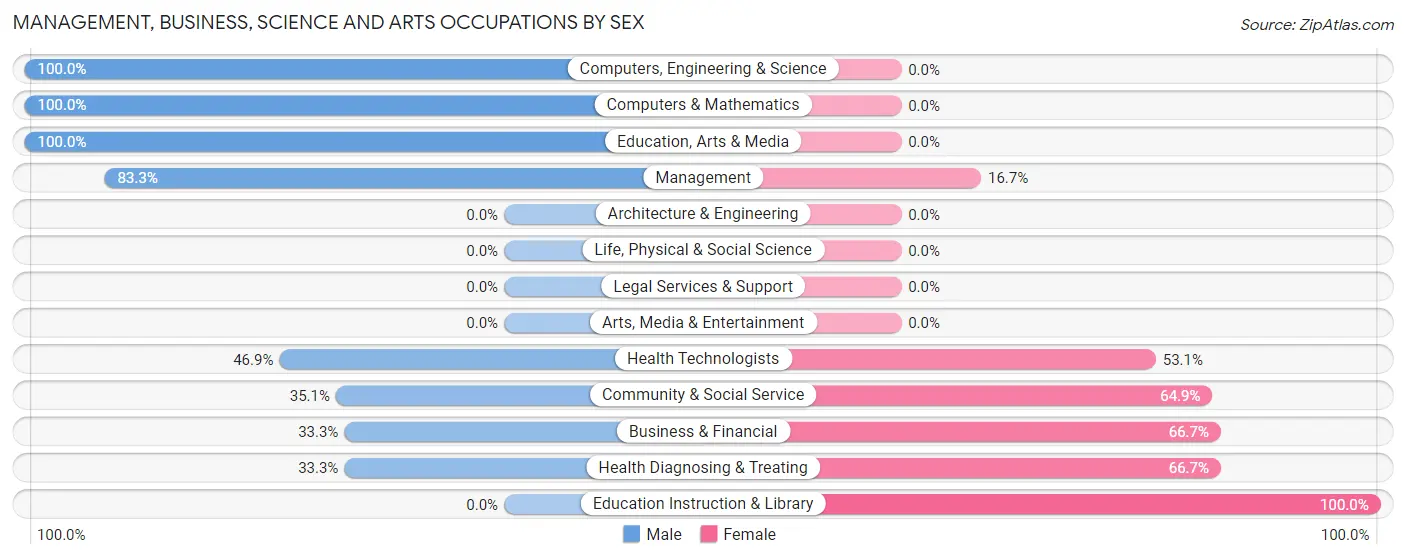
| Occupation | Male | Female |
| Management | 50 (83.3%) | 10 (16.7%) |
| Business & Financial | 6 (33.3%) | 12 (66.7%) |
| Computers, Engineering & Science | 3 (100.0%) | 0 (0.0%) |
| Computers & Mathematics | 3 (100.0%) | 0 (0.0%) |
| Architecture & Engineering | 0 (0.0%) | 0 (0.0%) |
| Life, Physical & Social Science | 0 (0.0%) | 0 (0.0%) |
| Community & Social Service | 20 (35.1%) | 37 (64.9%) |
| Education, Arts & Media | 20 (100.0%) | 0 (0.0%) |
| Legal Services & Support | 0 (0.0%) | 0 (0.0%) |
| Education Instruction & Library | 0 (0.0%) | 37 (100.0%) |
| Arts, Media & Entertainment | 0 (0.0%) | 0 (0.0%) |
| Health Diagnosing & Treating | 15 (33.3%) | 30 (66.7%) |
| Health Technologists | 15 (46.9%) | 17 (53.1%) |
| Total (Category) | 94 (51.4%) | 89 (48.6%) |
| Total (Overall) | 302 (65.9%) | 156 (34.1%) |
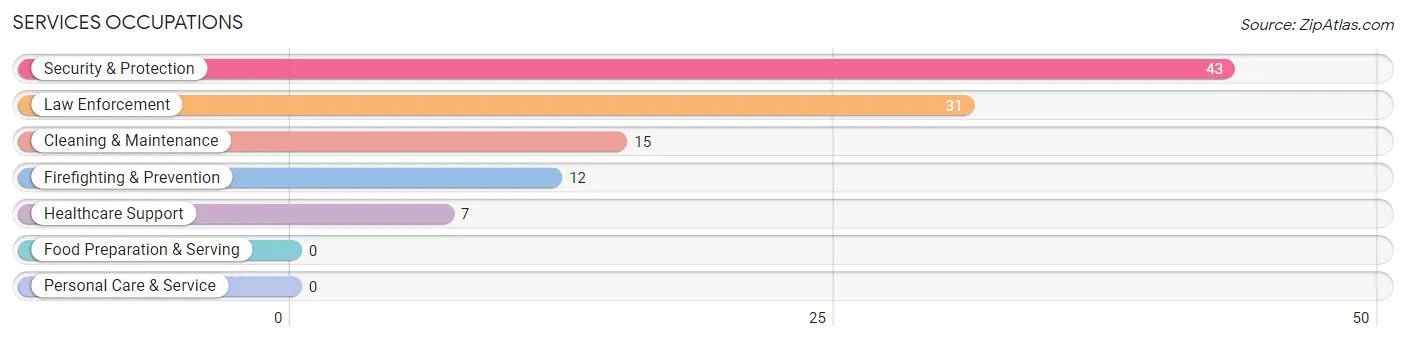
Services Occupations
The most common Services occupations in White Deer are Security & Protection (43 | 9.4%), Law Enforcement (31 | 6.8%), Cleaning & Maintenance (15 | 3.3%), Firefighting & Prevention (12 | 2.6%), and Healthcare Support (7 | 1.5%).
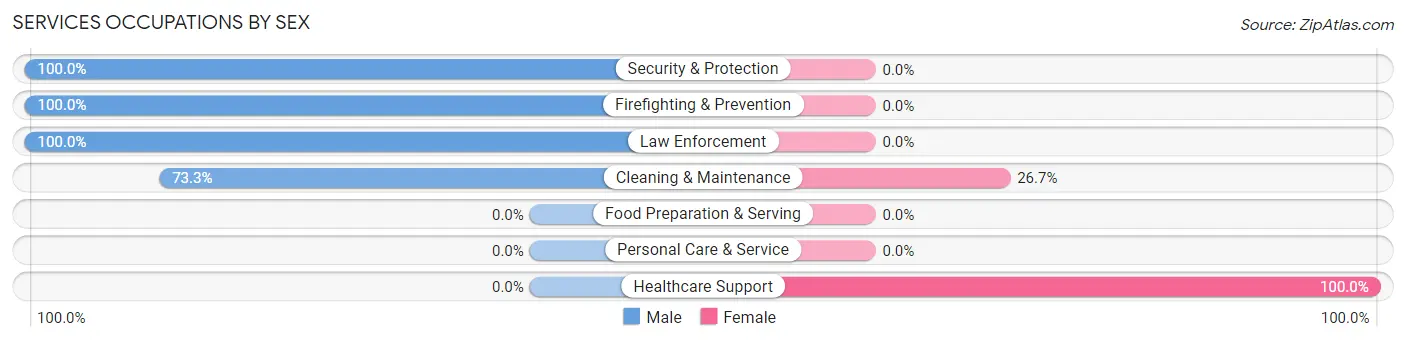
Services Occupations by Sex
Within the Services occupations in White Deer, the most male-oriented occupations are Security & Protection (100.0%), Firefighting & Prevention (100.0%), and Law Enforcement (100.0%), while the most female-oriented occupations are Healthcare Support (100.0%), and Cleaning & Maintenance (26.7%).
| Occupation | Male | Female |
| Healthcare Support | 0 (0.0%) | 7 (100.0%) |
| Security & Protection | 43 (100.0%) | 0 (0.0%) |
| Firefighting & Prevention | 12 (100.0%) | 0 (0.0%) |
| Law Enforcement | 31 (100.0%) | 0 (0.0%) |
| Food Preparation & Serving | 0 (0.0%) | 0 (0.0%) |
| Cleaning & Maintenance | 11 (73.3%) | 4 (26.7%) |
| Personal Care & Service | 0 (0.0%) | 0 (0.0%) |
| Total (Category) | 54 (83.1%) | 11 (16.9%) |
| Total (Overall) | 302 (65.9%) | 156 (34.1%) |
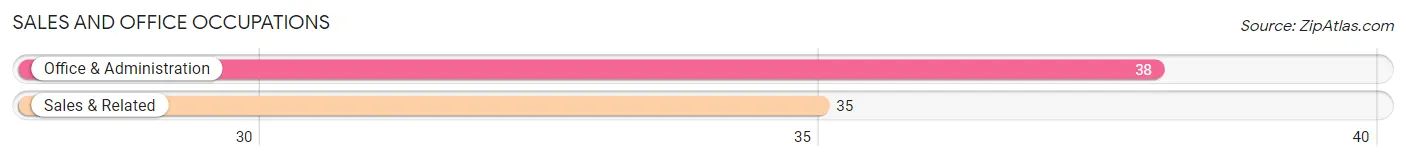
Sales and Office Occupations
The most common Sales and Office occupations in White Deer are Office & Administration (38 | 8.3%), and Sales & Related (35 | 7.6%).
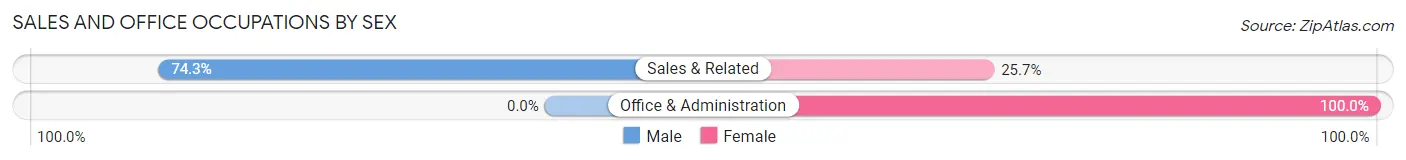
Sales and Office Occupations by Sex
| Occupation | Male | Female |
| Sales & Related | 26 (74.3%) | 9 (25.7%) |
| Office & Administration | 0 (0.0%) | 38 (100.0%) |
| Total (Category) | 26 (35.6%) | 47 (64.4%) |
| Total (Overall) | 302 (65.9%) | 156 (34.1%) |
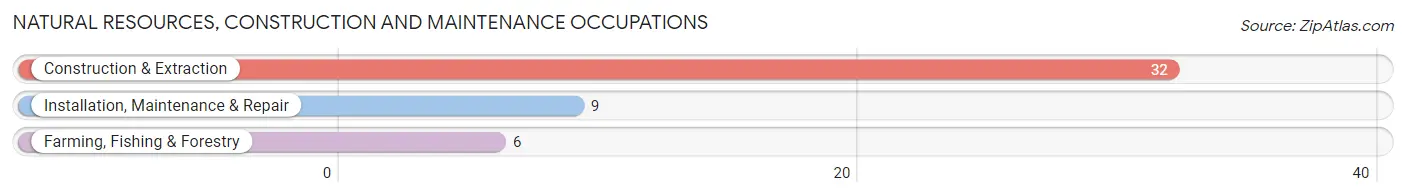
Natural Resources, Construction and Maintenance Occupations
The most common Natural Resources, Construction and Maintenance occupations in White Deer are Construction & Extraction (32 | 7.0%), Installation, Maintenance & Repair (9 | 2.0%), and Farming, Fishing & Forestry (6 | 1.3%).
Natural Resources, Construction and Maintenance Occupations by Sex
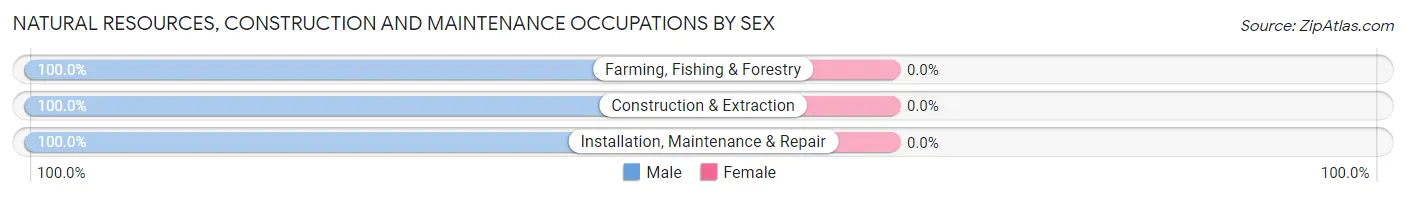
| Occupation | Male | Female |
| Farming, Fishing & Forestry | 6 (100.0%) | 0 (0.0%) |
| Construction & Extraction | 32 (100.0%) | 0 (0.0%) |
| Installation, Maintenance & Repair | 9 (100.0%) | 0 (0.0%) |
| Total (Category) | 47 (100.0%) | 0 (0.0%) |
| Total (Overall) | 302 (65.9%) | 156 (34.1%) |
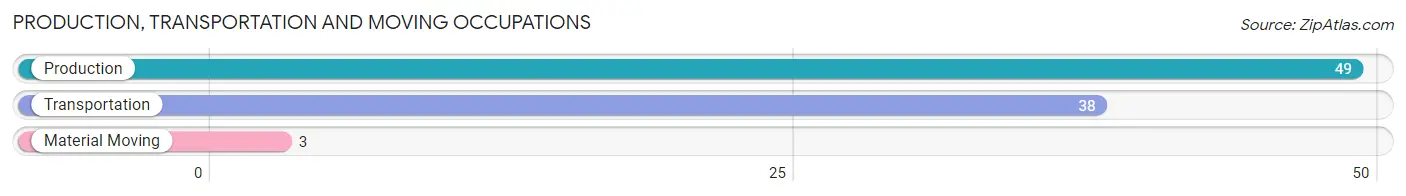
Production, Transportation and Moving Occupations
The most common Production, Transportation and Moving occupations in White Deer are Production (49 | 10.7%), Transportation (38 | 8.3%), and Material Moving (3 | 0.7%).
Production, Transportation and Moving Occupations by Sex
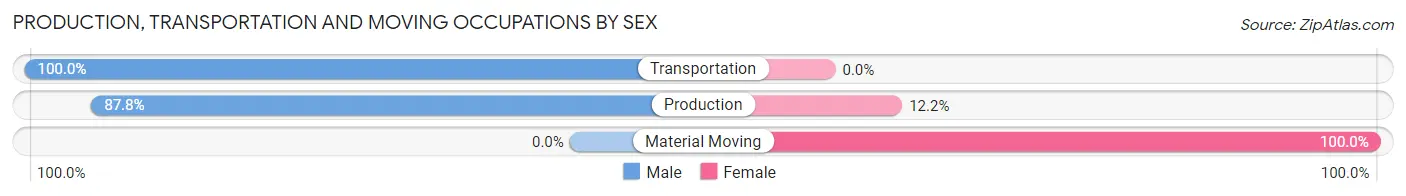
| Occupation | Male | Female |
| Production | 43 (87.8%) | 6 (12.2%) |
| Transportation | 38 (100.0%) | 0 (0.0%) |
| Material Moving | 0 (0.0%) | 3 (100.0%) |
| Total (Category) | 81 (90.0%) | 9 (10.0%) |
| Total (Overall) | 302 (65.9%) | 156 (34.1%) |
Employment Industries by Sex in White Deer
Employment Industries in White Deer
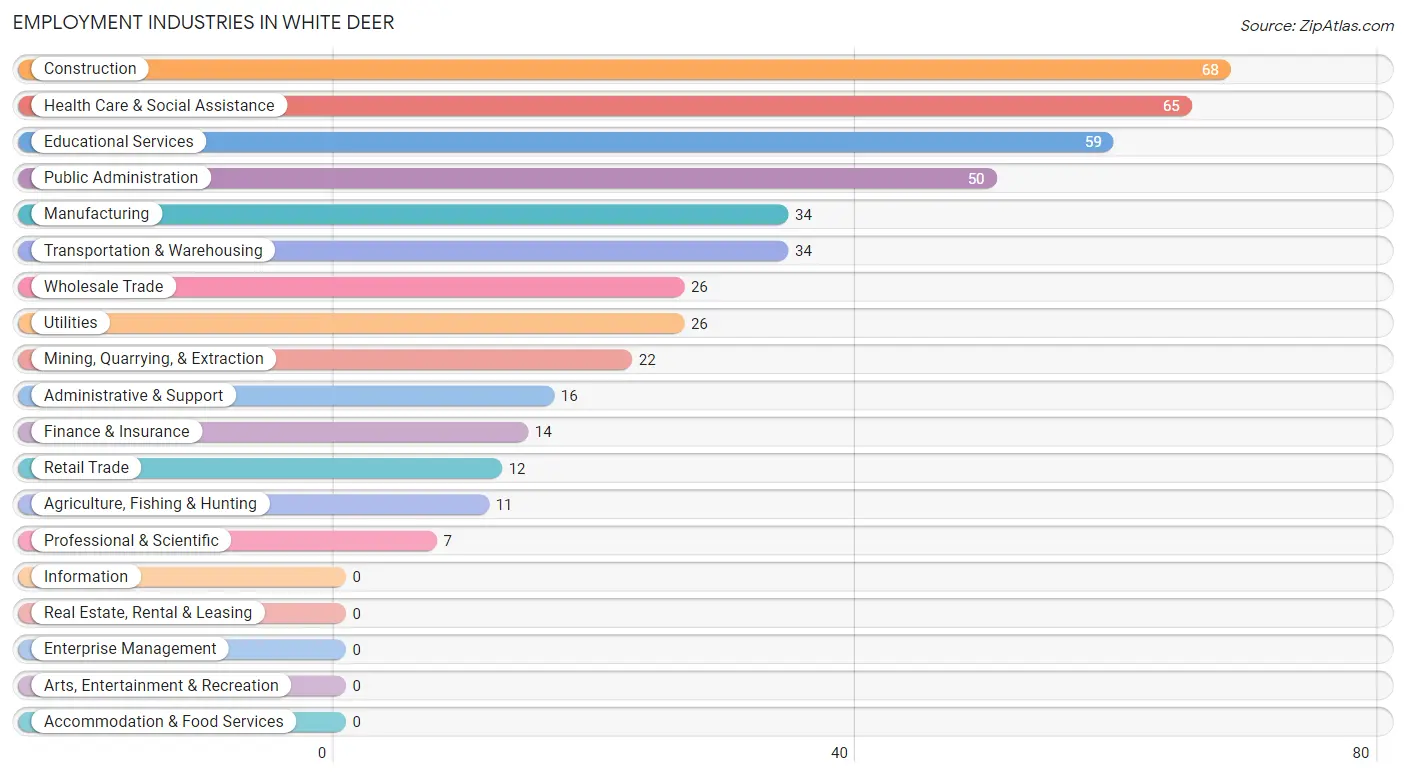
The major employment industries in White Deer include Construction (68 | 14.8%), Health Care & Social Assistance (65 | 14.2%), Educational Services (59 | 12.9%), Public Administration (50 | 10.9%), and Manufacturing (34 | 7.4%).
Employment Industries by Sex in White Deer
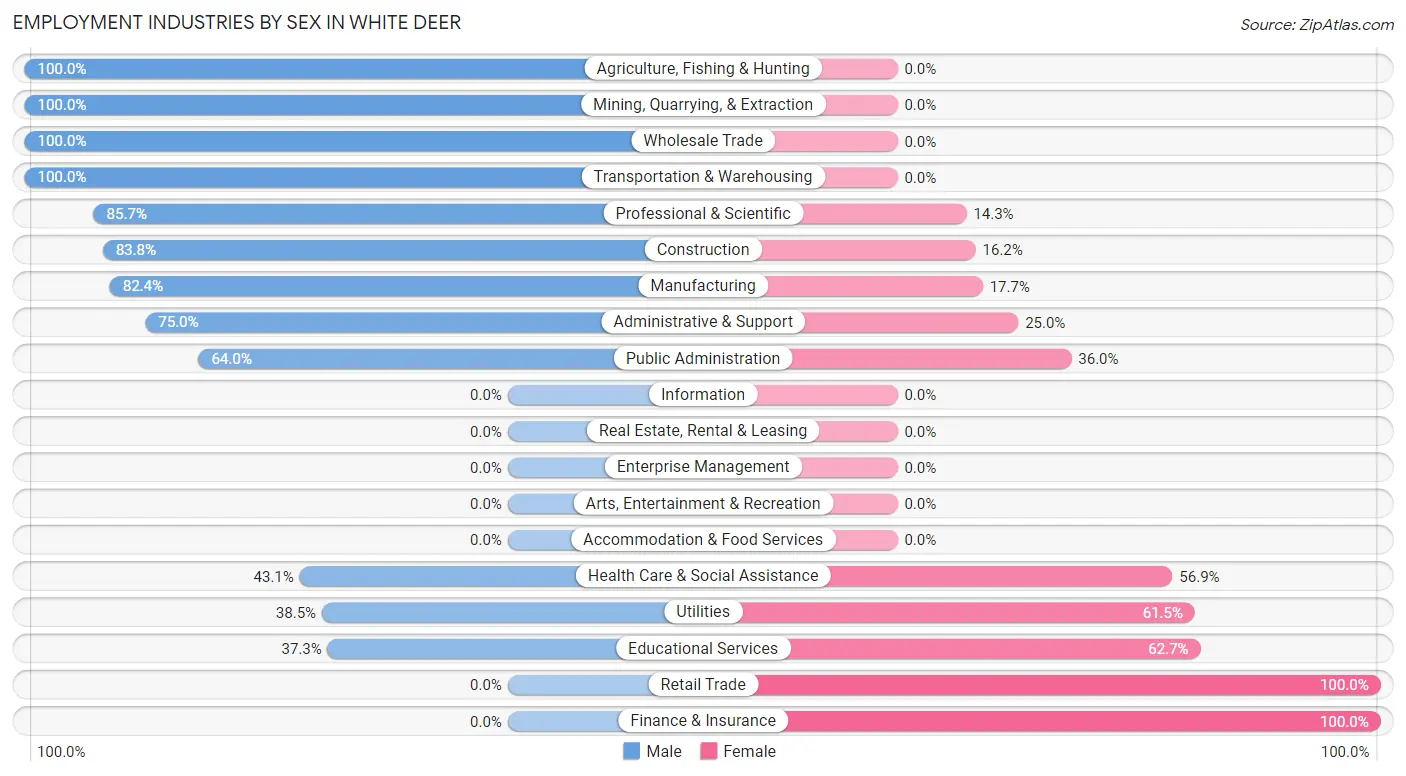
The White Deer industries that see more men than women are Agriculture, Fishing & Hunting (100.0%), Mining, Quarrying, & Extraction (100.0%), and Wholesale Trade (100.0%), whereas the industries that tend to have a higher number of women are Retail Trade (100.0%), Finance & Insurance (100.0%), and Educational Services (62.7%).
| Industry | Male | Female |
| Agriculture, Fishing & Hunting | 11 (100.0%) | 0 (0.0%) |
| Mining, Quarrying, & Extraction | 22 (100.0%) | 0 (0.0%) |
| Construction | 57 (83.8%) | 11 (16.2%) |
| Manufacturing | 28 (82.4%) | 6 (17.6%) |
| Wholesale Trade | 26 (100.0%) | 0 (0.0%) |
| Retail Trade | 0 (0.0%) | 12 (100.0%) |
| Transportation & Warehousing | 34 (100.0%) | 0 (0.0%) |
| Utilities | 10 (38.5%) | 16 (61.5%) |
| Information | 0 (0.0%) | 0 (0.0%) |
| Finance & Insurance | 0 (0.0%) | 14 (100.0%) |
| Real Estate, Rental & Leasing | 0 (0.0%) | 0 (0.0%) |
| Professional & Scientific | 6 (85.7%) | 1 (14.3%) |
| Enterprise Management | 0 (0.0%) | 0 (0.0%) |
| Administrative & Support | 12 (75.0%) | 4 (25.0%) |
| Educational Services | 22 (37.3%) | 37 (62.7%) |
| Health Care & Social Assistance | 28 (43.1%) | 37 (56.9%) |
| Arts, Entertainment & Recreation | 0 (0.0%) | 0 (0.0%) |
| Accommodation & Food Services | 0 (0.0%) | 0 (0.0%) |
| Public Administration | 32 (64.0%) | 18 (36.0%) |
| Total | 302 (65.9%) | 156 (34.1%) |
Education in White Deer
School Enrollment in White Deer
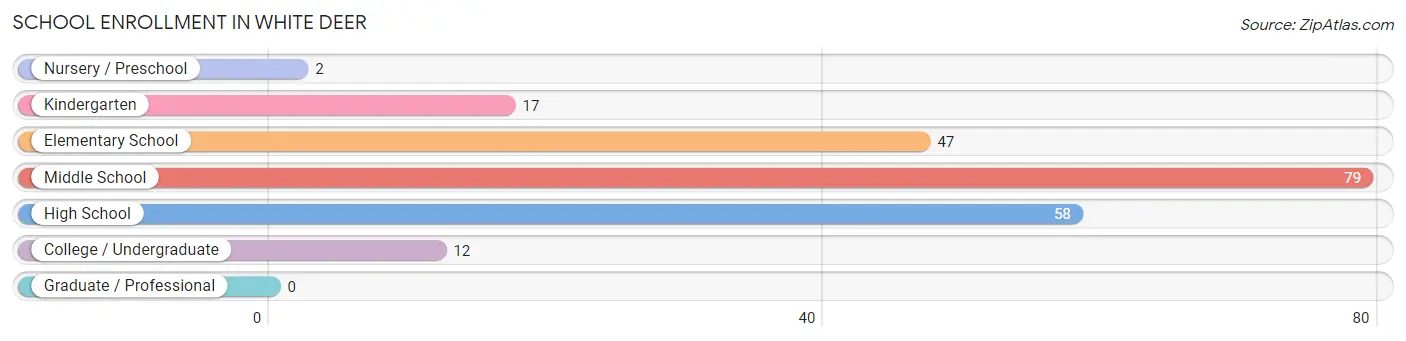
The most common levels of schooling among the 215 students in White Deer are middle school (79 | 36.7%), high school (58 | 27.0%), and elementary school (47 | 21.9%).
| School Level | # Students | % Students |
| Nursery / Preschool | 2 | 0.9% |
| Kindergarten | 17 | 7.9% |
| Elementary School | 47 | 21.9% |
| Middle School | 79 | 36.7% |
| High School | 58 | 27.0% |
| College / Undergraduate | 12 | 5.6% |
| Graduate / Professional | 0 | 0.0% |
| Total | 215 | 100.0% |
School Enrollment by Age by Funding Source in White Deer
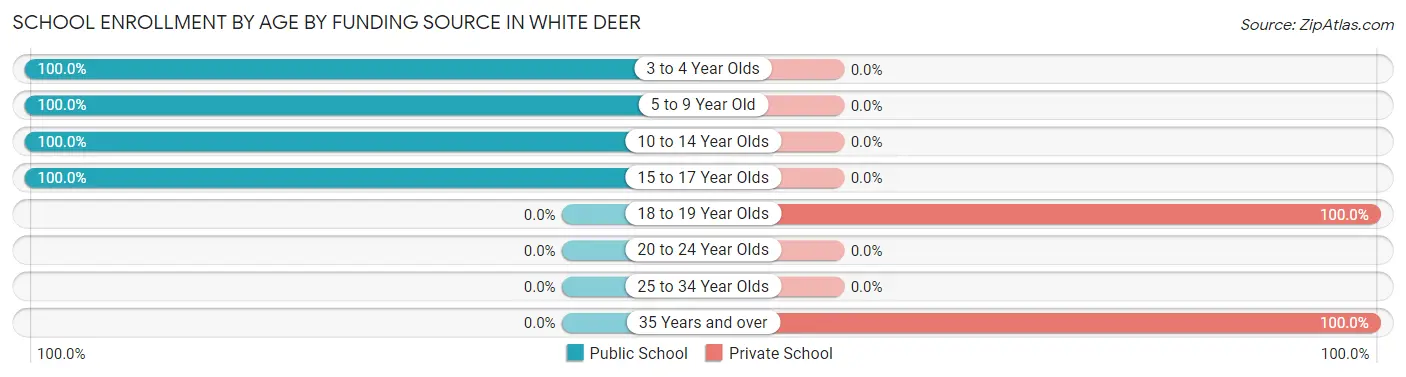
Out of a total of 215 students who are enrolled in schools in White Deer, 42 (19.5%) attend a private institution, while the remaining 173 (80.5%) are enrolled in public schools. The age group of 18 to 19 year olds has the highest likelihood of being enrolled in private schools, with 12 (100.0% in the age bracket) enrolled. Conversely, the age group of 3 to 4 year olds has the lowest likelihood of being enrolled in a private school, with 2 (100.0% in the age bracket) attending a public institution.
| Age Bracket | Public School | Private School |
| 3 to 4 Year Olds | 2 (100.0%) | 0 (0.0%) |
| 5 to 9 Year Old | 64 (100.0%) | 0 (0.0%) |
| 10 to 14 Year Olds | 79 (100.0%) | 0 (0.0%) |
| 15 to 17 Year Olds | 28 (100.0%) | 0 (0.0%) |
| 18 to 19 Year Olds | 0 (0.0%) | 12 (100.0%) |
| 20 to 24 Year Olds | 0 (0.0%) | 0 (0.0%) |
| 25 to 34 Year Olds | 0 (0.0%) | 0 (0.0%) |
| 35 Years and over | 0 (0.0%) | 30 (100.0%) |
| Total | 173 (80.5%) | 42 (19.5%) |
Educational Attainment by Field of Study in White Deer
Physical & health sciences (36 | 34.6%), science & technology (13 | 12.5%), psychology (12 | 11.5%), arts & humanities (12 | 11.5%), and business (9 | 8.6%) are the most common fields of study among 104 individuals in White Deer who have obtained a bachelor's degree or higher.
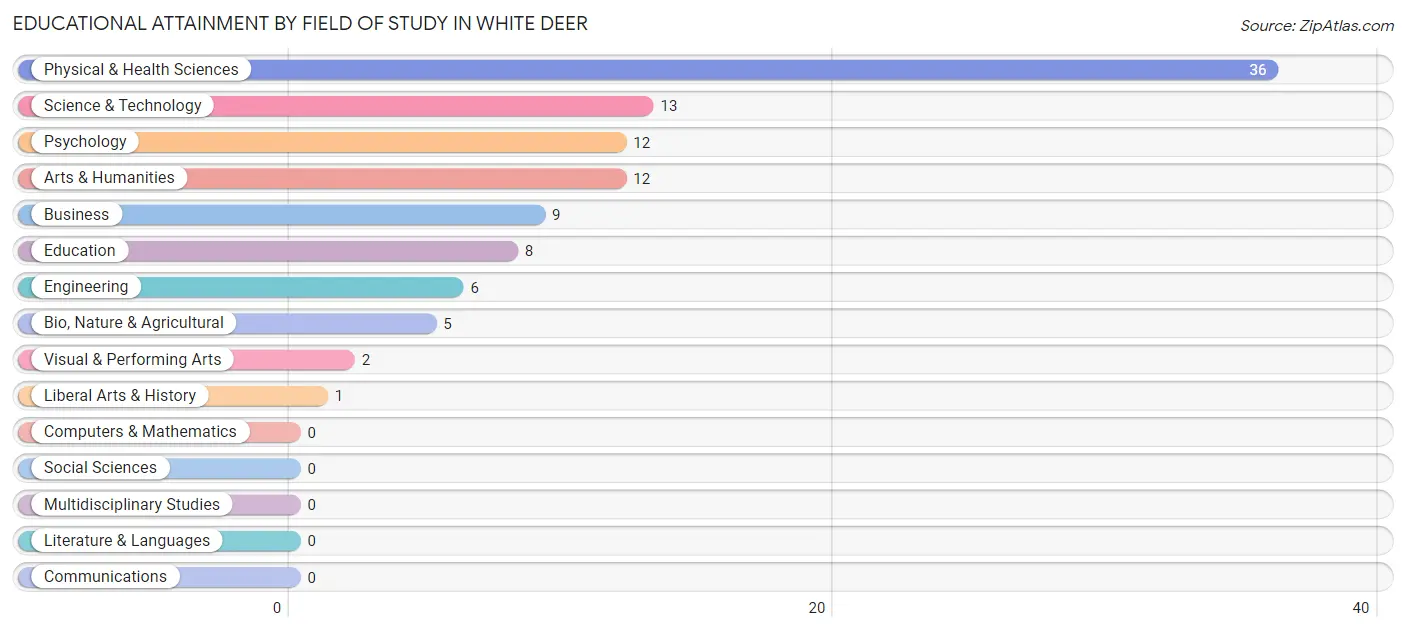
| Field of Study | # Graduates | % Graduates |
| Computers & Mathematics | 0 | 0.0% |
| Bio, Nature & Agricultural | 5 | 4.8% |
| Physical & Health Sciences | 36 | 34.6% |
| Psychology | 12 | 11.5% |
| Social Sciences | 0 | 0.0% |
| Engineering | 6 | 5.8% |
| Multidisciplinary Studies | 0 | 0.0% |
| Science & Technology | 13 | 12.5% |
| Business | 9 | 8.6% |
| Education | 8 | 7.7% |
| Literature & Languages | 0 | 0.0% |
| Liberal Arts & History | 1 | 1.0% |
| Visual & Performing Arts | 2 | 1.9% |
| Communications | 0 | 0.0% |
| Arts & Humanities | 12 | 11.5% |
| Total | 104 | 100.0% |
Transportation & Commute in White Deer
Vehicle Availability by Sex in White Deer
The most prevalent vehicle ownership categories in White Deer are males with 2 vehicles (192, accounting for 63.6%) and females with 2 vehicles (104, making up 123.1%).
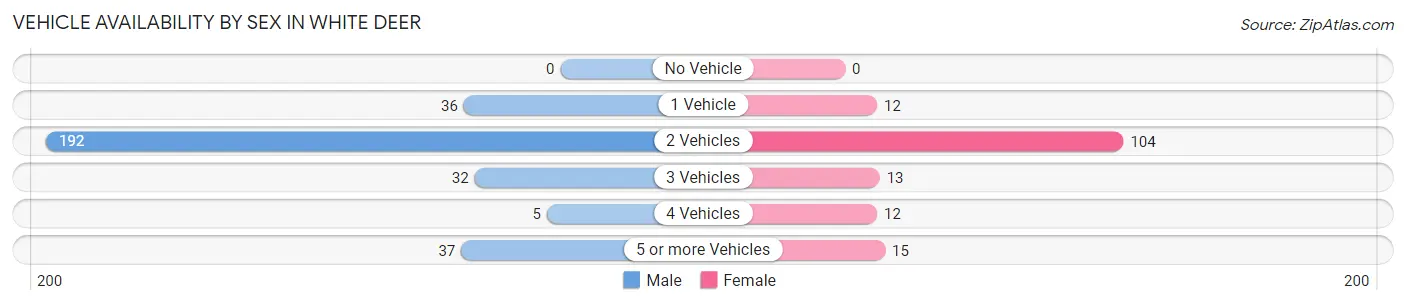
| Vehicles Available | Male | Female |
| No Vehicle | 0 (0.0%) | 0 (0.0%) |
| 1 Vehicle | 36 (11.9%) | 12 (7.7%) |
| 2 Vehicles | 192 (63.6%) | 104 (66.7%) |
| 3 Vehicles | 32 (10.6%) | 13 (8.3%) |
| 4 Vehicles | 5 (1.7%) | 12 (7.7%) |
| 5 or more Vehicles | 37 (12.2%) | 15 (9.6%) |
| Total | 302 (100.0%) | 156 (100.0%) |
Commute Time in White Deer
The most frequently occuring commute durations in White Deer are less than 5 minutes (69 commuters, 17.5%), 30 to 34 minutes (69 commuters, 17.5%), and 15 to 19 minutes (56 commuters, 14.2%).
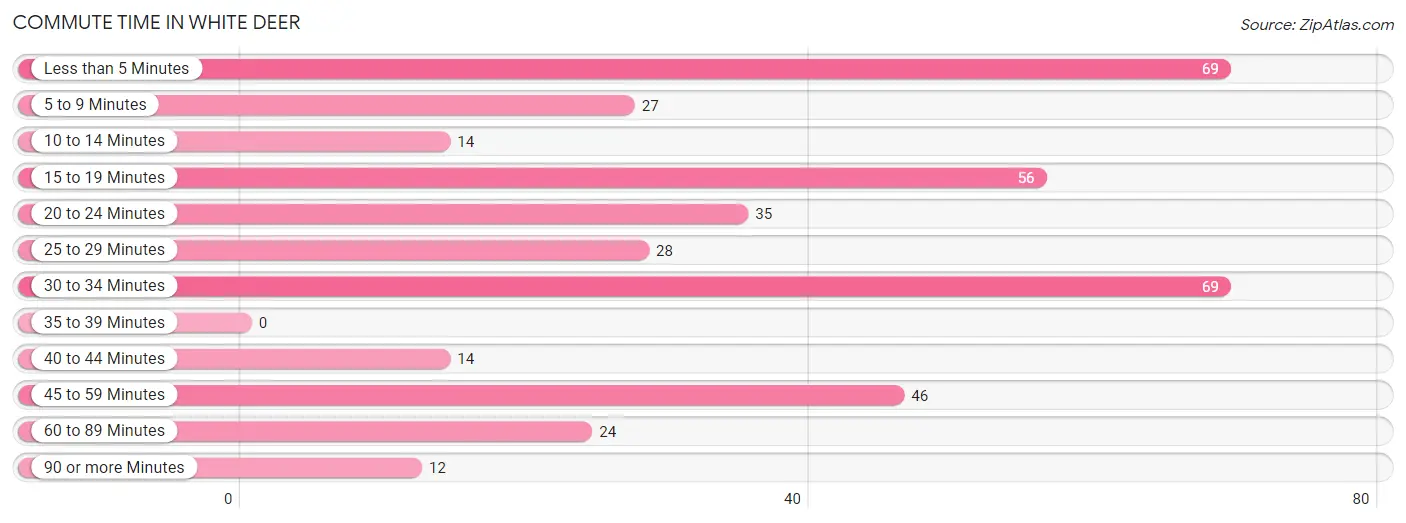
| Commute Time | # Commuters | % Commuters |
| Less than 5 Minutes | 69 | 17.5% |
| 5 to 9 Minutes | 27 | 6.9% |
| 10 to 14 Minutes | 14 | 3.5% |
| 15 to 19 Minutes | 56 | 14.2% |
| 20 to 24 Minutes | 35 | 8.9% |
| 25 to 29 Minutes | 28 | 7.1% |
| 30 to 34 Minutes | 69 | 17.5% |
| 35 to 39 Minutes | 0 | 0.0% |
| 40 to 44 Minutes | 14 | 3.5% |
| 45 to 59 Minutes | 46 | 11.7% |
| 60 to 89 Minutes | 24 | 6.1% |
| 90 or more Minutes | 12 | 3.0% |
Commute Time by Sex in White Deer
The most common commute times in White Deer are less than 5 minutes (41 commuters, 15.3%) for males and 30 to 34 minutes (31 commuters, 24.6%) for females.
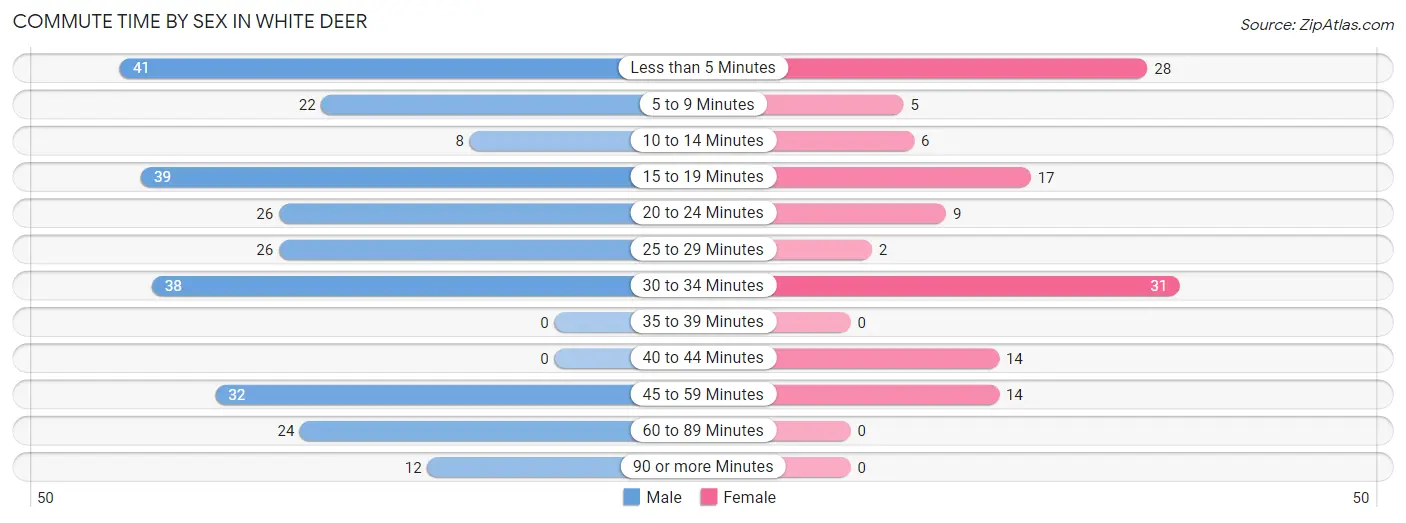
| Commute Time | Male | Female |
| Less than 5 Minutes | 41 (15.3%) | 28 (22.2%) |
| 5 to 9 Minutes | 22 (8.2%) | 5 (4.0%) |
| 10 to 14 Minutes | 8 (3.0%) | 6 (4.8%) |
| 15 to 19 Minutes | 39 (14.5%) | 17 (13.5%) |
| 20 to 24 Minutes | 26 (9.7%) | 9 (7.1%) |
| 25 to 29 Minutes | 26 (9.7%) | 2 (1.6%) |
| 30 to 34 Minutes | 38 (14.2%) | 31 (24.6%) |
| 35 to 39 Minutes | 0 (0.0%) | 0 (0.0%) |
| 40 to 44 Minutes | 0 (0.0%) | 14 (11.1%) |
| 45 to 59 Minutes | 32 (11.9%) | 14 (11.1%) |
| 60 to 89 Minutes | 24 (9.0%) | 0 (0.0%) |
| 90 or more Minutes | 12 (4.5%) | 0 (0.0%) |
Time of Departure to Work by Sex in White Deer
The most frequent times of departure to work in White Deer are 5:30 AM to 5:59 AM (48, 17.9%) for males and 7:00 AM to 7:29 AM (37, 29.4%) for females.
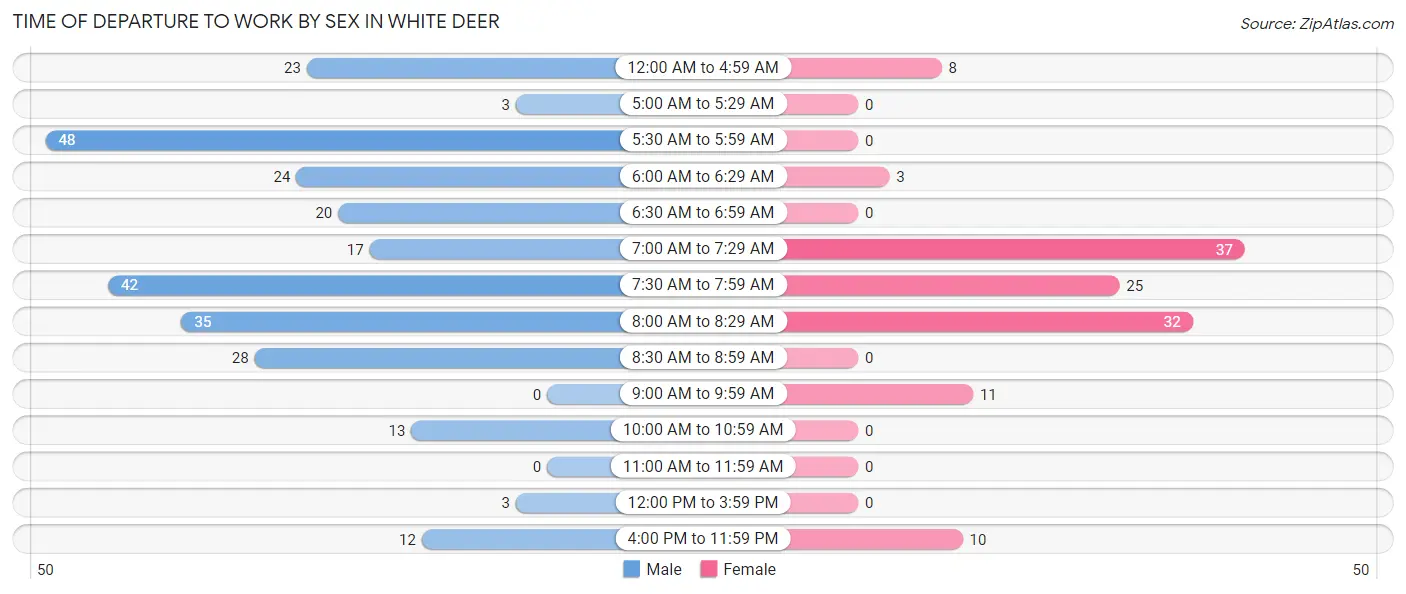
| Time of Departure | Male | Female |
| 12:00 AM to 4:59 AM | 23 (8.6%) | 8 (6.4%) |
| 5:00 AM to 5:29 AM | 3 (1.1%) | 0 (0.0%) |
| 5:30 AM to 5:59 AM | 48 (17.9%) | 0 (0.0%) |
| 6:00 AM to 6:29 AM | 24 (9.0%) | 3 (2.4%) |
| 6:30 AM to 6:59 AM | 20 (7.5%) | 0 (0.0%) |
| 7:00 AM to 7:29 AM | 17 (6.3%) | 37 (29.4%) |
| 7:30 AM to 7:59 AM | 42 (15.7%) | 25 (19.8%) |
| 8:00 AM to 8:29 AM | 35 (13.1%) | 32 (25.4%) |
| 8:30 AM to 8:59 AM | 28 (10.4%) | 0 (0.0%) |
| 9:00 AM to 9:59 AM | 0 (0.0%) | 11 (8.7%) |
| 10:00 AM to 10:59 AM | 13 (4.9%) | 0 (0.0%) |
| 11:00 AM to 11:59 AM | 0 (0.0%) | 0 (0.0%) |
| 12:00 PM to 3:59 PM | 3 (1.1%) | 0 (0.0%) |
| 4:00 PM to 11:59 PM | 12 (4.5%) | 10 (7.9%) |
| Total | 268 (100.0%) | 126 (100.0%) |
Housing Occupancy in White Deer
Occupancy by Ownership in White Deer
Of the total 353 dwellings in White Deer, owner-occupied units account for 295 (83.6%), while renter-occupied units make up 58 (16.4%).
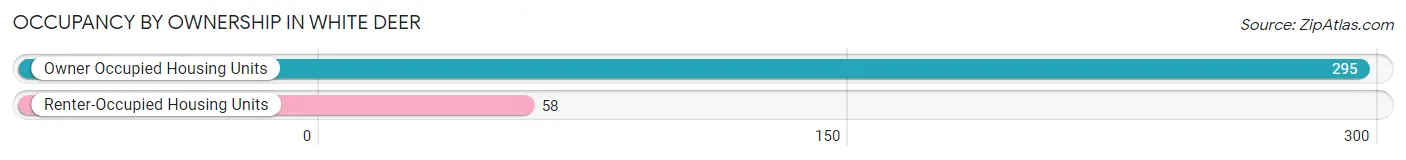
| Occupancy | # Housing Units | % Housing Units |
| Owner Occupied Housing Units | 295 | 83.6% |
| Renter-Occupied Housing Units | 58 | 16.4% |
| Total Occupied Housing Units | 353 | 100.0% |
Occupancy by Household Size in White Deer
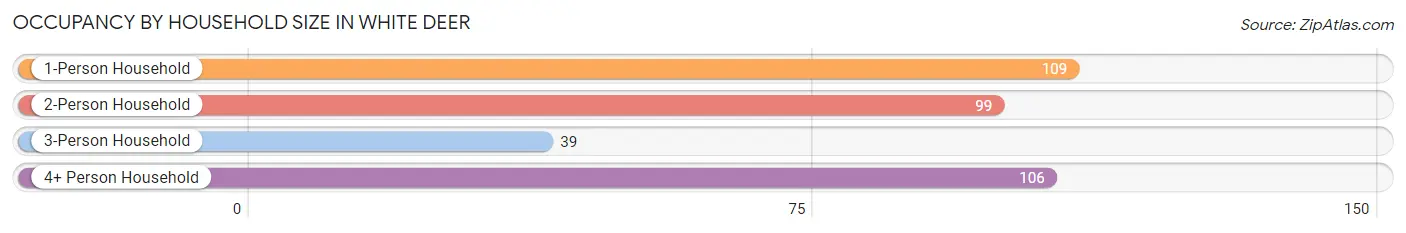
| Household Size | # Housing Units | % Housing Units |
| 1-Person Household | 109 | 30.9% |
| 2-Person Household | 99 | 28.1% |
| 3-Person Household | 39 | 11.1% |
| 4+ Person Household | 106 | 30.0% |
| Total Housing Units | 353 | 100.0% |
Occupancy by Ownership by Household Size in White Deer
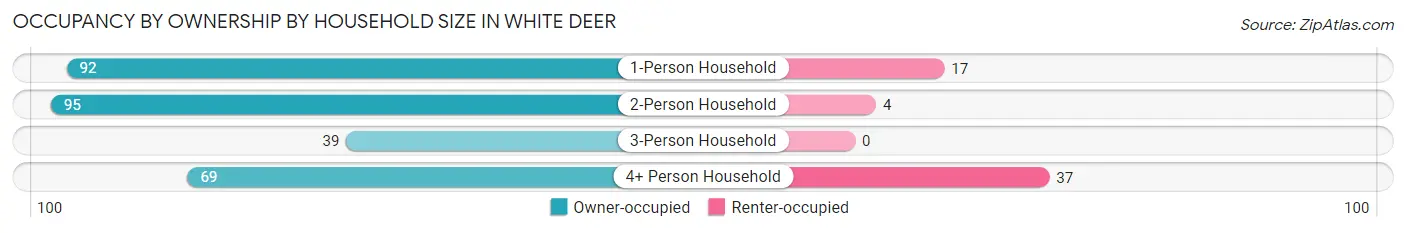
| Household Size | Owner-occupied | Renter-occupied |
| 1-Person Household | 92 (84.4%) | 17 (15.6%) |
| 2-Person Household | 95 (96.0%) | 4 (4.0%) |
| 3-Person Household | 39 (100.0%) | 0 (0.0%) |
| 4+ Person Household | 69 (65.1%) | 37 (34.9%) |
| Total Housing Units | 295 (83.6%) | 58 (16.4%) |
Occupancy by Educational Attainment in White Deer
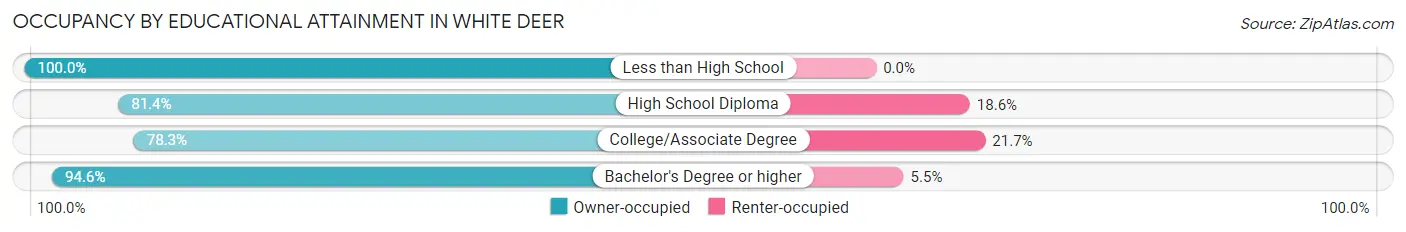
| Household Size | Owner-occupied | Renter-occupied |
| Less than High School | 28 (100.0%) | 0 (0.0%) |
| High School Diploma | 92 (81.4%) | 21 (18.6%) |
| College/Associate Degree | 123 (78.3%) | 34 (21.7%) |
| Bachelor's Degree or higher | 52 (94.6%) | 3 (5.4%) |
Occupancy by Age of Householder in White Deer
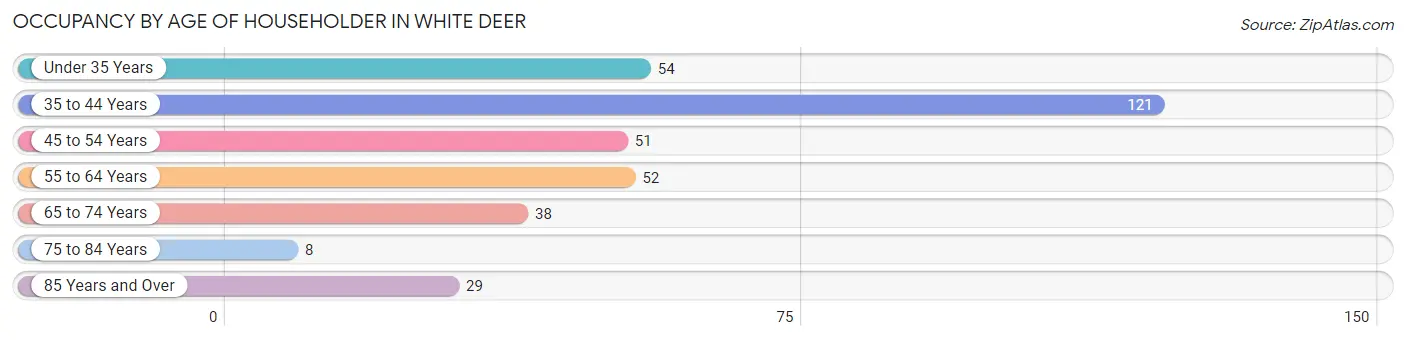
| Age Bracket | # Households | % Households |
| Under 35 Years | 54 | 15.3% |
| 35 to 44 Years | 121 | 34.3% |
| 45 to 54 Years | 51 | 14.4% |
| 55 to 64 Years | 52 | 14.7% |
| 65 to 74 Years | 38 | 10.8% |
| 75 to 84 Years | 8 | 2.3% |
| 85 Years and Over | 29 | 8.2% |
| Total | 353 | 100.0% |
Housing Finances in White Deer
Median Income by Occupancy in White Deer
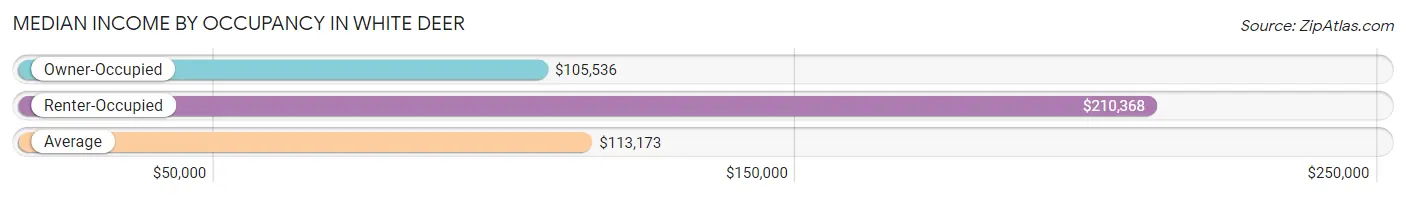
| Occupancy Type | # Households | Median Income |
| Owner-Occupied | 295 (83.6%) | $105,536 |
| Renter-Occupied | 58 (16.4%) | $210,368 |
| Average | 353 (100.0%) | $113,173 |
Occupancy by Householder Income Bracket in White Deer
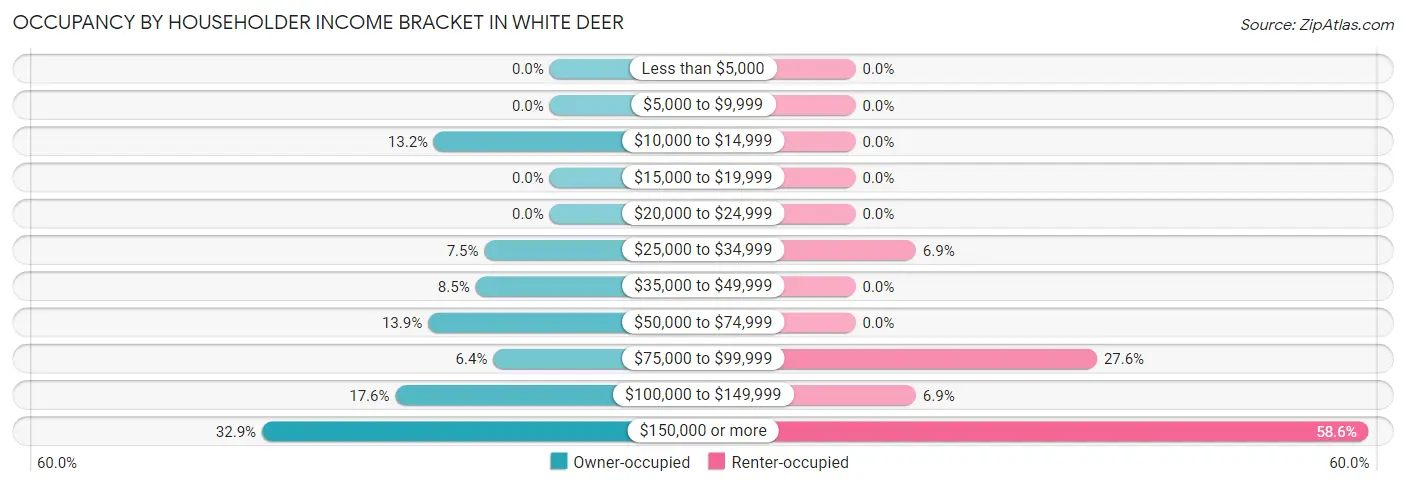
| Income Bracket | Owner-occupied | Renter-occupied |
| Less than $5,000 | 0 (0.0%) | 0 (0.0%) |
| $5,000 to $9,999 | 0 (0.0%) | 0 (0.0%) |
| $10,000 to $14,999 | 39 (13.2%) | 0 (0.0%) |
| $15,000 to $19,999 | 0 (0.0%) | 0 (0.0%) |
| $20,000 to $24,999 | 0 (0.0%) | 0 (0.0%) |
| $25,000 to $34,999 | 22 (7.5%) | 4 (6.9%) |
| $35,000 to $49,999 | 25 (8.5%) | 0 (0.0%) |
| $50,000 to $74,999 | 41 (13.9%) | 0 (0.0%) |
| $75,000 to $99,999 | 19 (6.4%) | 16 (27.6%) |
| $100,000 to $149,999 | 52 (17.6%) | 4 (6.9%) |
| $150,000 or more | 97 (32.9%) | 34 (58.6%) |
| Total | 295 (100.0%) | 58 (100.0%) |
Monthly Housing Cost Tiers in White Deer
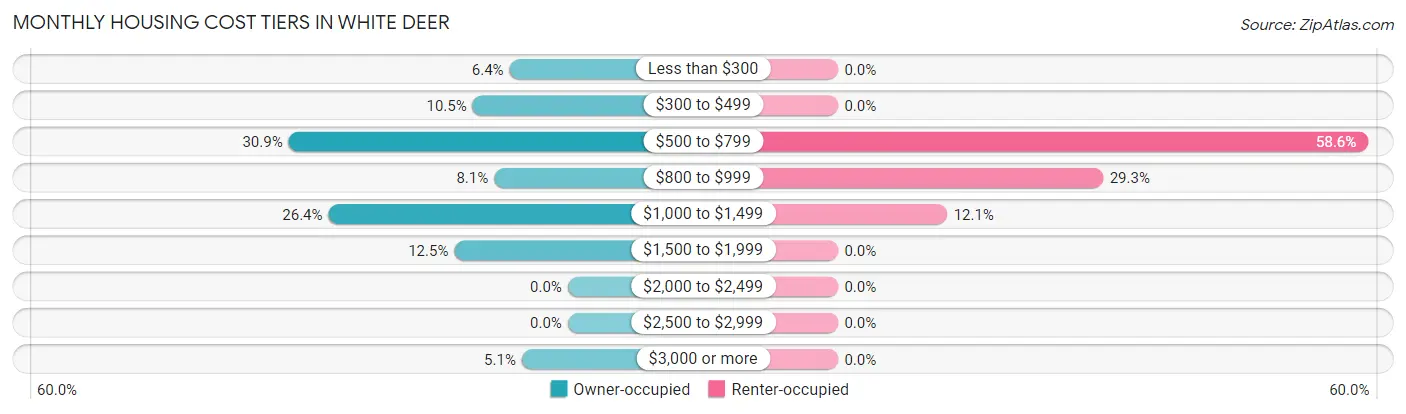
| Monthly Cost | Owner-occupied | Renter-occupied |
| Less than $300 | 19 (6.4%) | 0 (0.0%) |
| $300 to $499 | 31 (10.5%) | 0 (0.0%) |
| $500 to $799 | 91 (30.8%) | 34 (58.6%) |
| $800 to $999 | 24 (8.1%) | 17 (29.3%) |
| $1,000 to $1,499 | 78 (26.4%) | 7 (12.1%) |
| $1,500 to $1,999 | 37 (12.5%) | 0 (0.0%) |
| $2,000 to $2,499 | 0 (0.0%) | 0 (0.0%) |
| $2,500 to $2,999 | 0 (0.0%) | 0 (0.0%) |
| $3,000 or more | 15 (5.1%) | 0 (0.0%) |
| Total | 295 (100.0%) | 58 (100.0%) |
Physical Housing Characteristics in White Deer
Housing Structures in White Deer
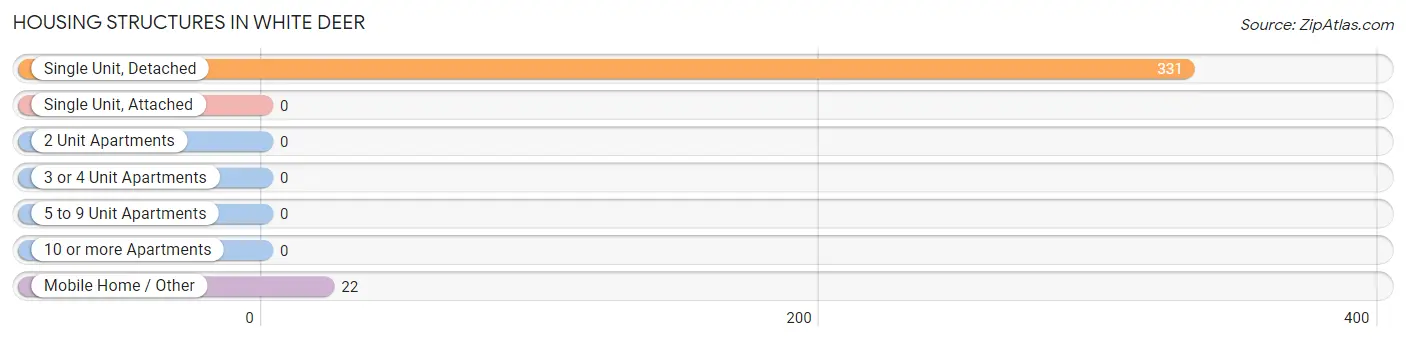
| Structure Type | # Housing Units | % Housing Units |
| Single Unit, Detached | 331 | 93.8% |
| Single Unit, Attached | 0 | 0.0% |
| 2 Unit Apartments | 0 | 0.0% |
| 3 or 4 Unit Apartments | 0 | 0.0% |
| 5 to 9 Unit Apartments | 0 | 0.0% |
| 10 or more Apartments | 0 | 0.0% |
| Mobile Home / Other | 22 | 6.2% |
| Total | 353 | 100.0% |
Housing Structures by Occupancy in White Deer
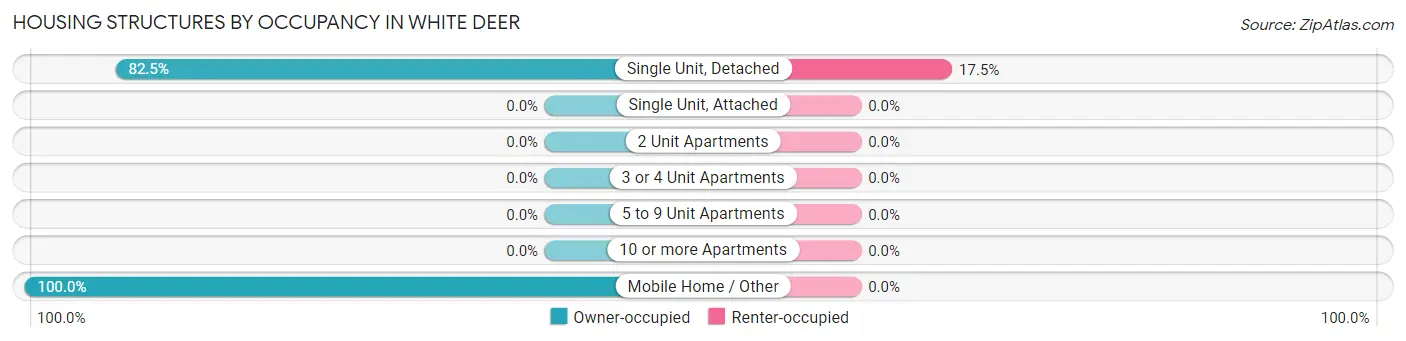
| Structure Type | Owner-occupied | Renter-occupied |
| Single Unit, Detached | 273 (82.5%) | 58 (17.5%) |
| Single Unit, Attached | 0 (0.0%) | 0 (0.0%) |
| 2 Unit Apartments | 0 (0.0%) | 0 (0.0%) |
| 3 or 4 Unit Apartments | 0 (0.0%) | 0 (0.0%) |
| 5 to 9 Unit Apartments | 0 (0.0%) | 0 (0.0%) |
| 10 or more Apartments | 0 (0.0%) | 0 (0.0%) |
| Mobile Home / Other | 22 (100.0%) | 0 (0.0%) |
| Total | 295 (83.6%) | 58 (16.4%) |
Housing Structures by Number of Rooms in White Deer
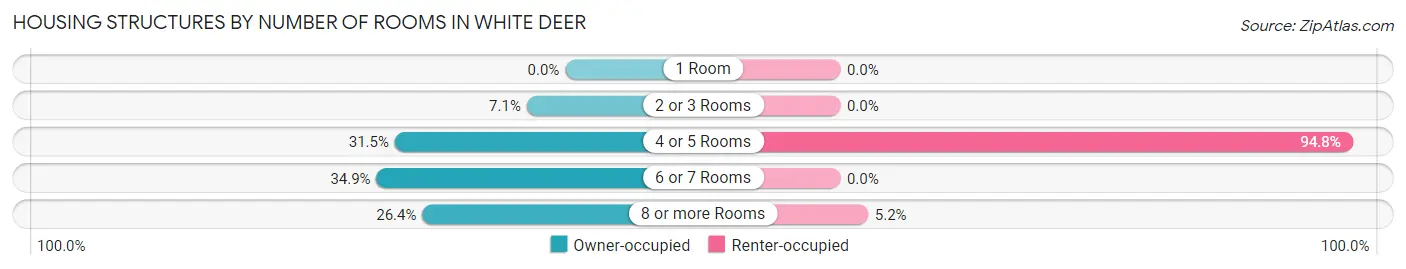
| Number of Rooms | Owner-occupied | Renter-occupied |
| 1 Room | 0 (0.0%) | 0 (0.0%) |
| 2 or 3 Rooms | 21 (7.1%) | 0 (0.0%) |
| 4 or 5 Rooms | 93 (31.5%) | 55 (94.8%) |
| 6 or 7 Rooms | 103 (34.9%) | 0 (0.0%) |
| 8 or more Rooms | 78 (26.4%) | 3 (5.2%) |
| Total | 295 (100.0%) | 58 (100.0%) |
Housing Structure by Heating Type in White Deer
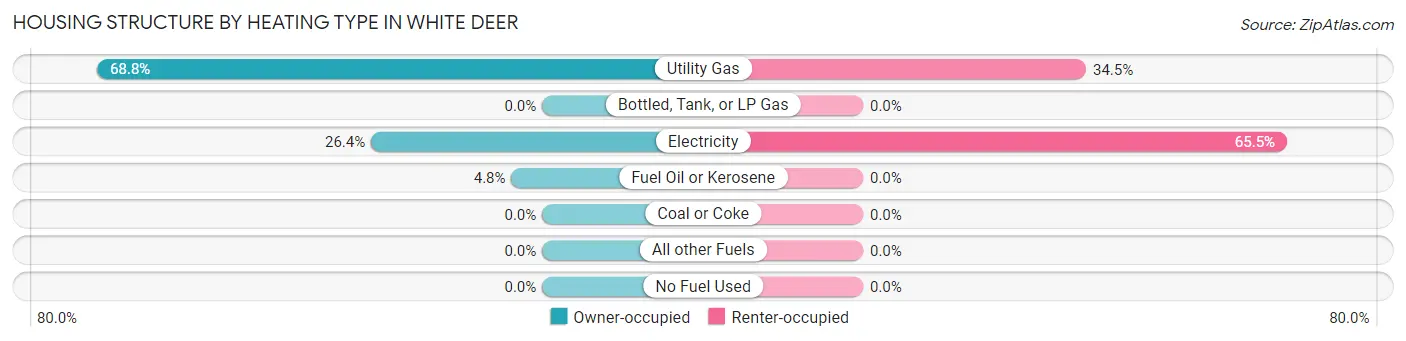
| Heating Type | Owner-occupied | Renter-occupied |
| Utility Gas | 203 (68.8%) | 20 (34.5%) |
| Bottled, Tank, or LP Gas | 0 (0.0%) | 0 (0.0%) |
| Electricity | 78 (26.4%) | 38 (65.5%) |
| Fuel Oil or Kerosene | 14 (4.8%) | 0 (0.0%) |
| Coal or Coke | 0 (0.0%) | 0 (0.0%) |
| All other Fuels | 0 (0.0%) | 0 (0.0%) |
| No Fuel Used | 0 (0.0%) | 0 (0.0%) |
| Total | 295 (100.0%) | 58 (100.0%) |
Household Vehicle Usage in White Deer
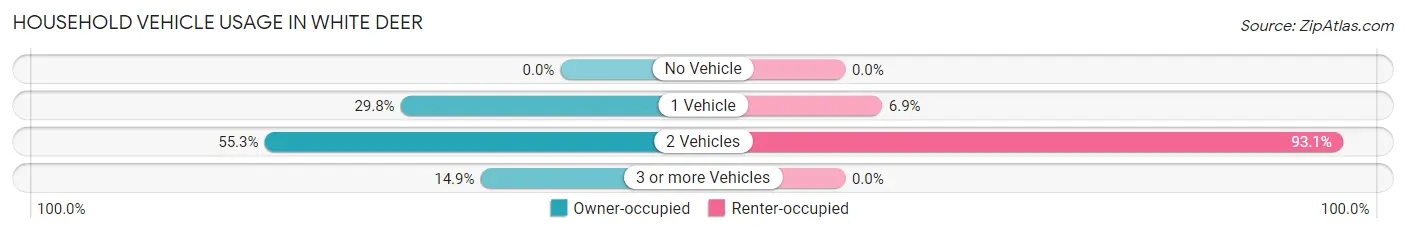
| Vehicles per Household | Owner-occupied | Renter-occupied |
| No Vehicle | 0 (0.0%) | 0 (0.0%) |
| 1 Vehicle | 88 (29.8%) | 4 (6.9%) |
| 2 Vehicles | 163 (55.2%) | 54 (93.1%) |
| 3 or more Vehicles | 44 (14.9%) | 0 (0.0%) |
| Total | 295 (100.0%) | 58 (100.0%) |
Real Estate & Mortgages in White Deer
Real Estate and Mortgage Overview in White Deer
| Characteristic | Without Mortgage | With Mortgage |
| Housing Units | 148 | 147 |
| Median Property Value | $147,700 | $151,300 |
| Median Household Income | $51,923 | $69 |
| Monthly Housing Costs | $619 | $15 |
| Real Estate Taxes | $2,171 | $0 |
Property Value by Mortgage Status in White Deer
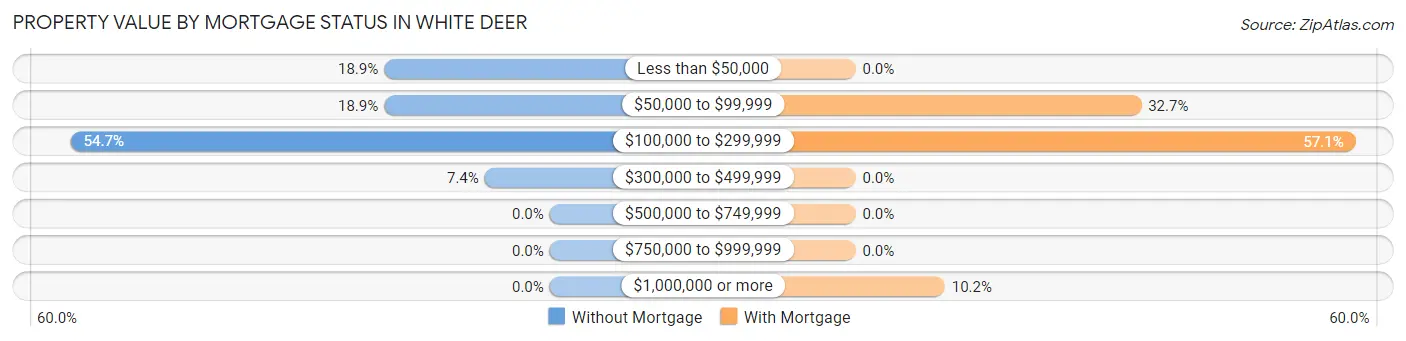
| Property Value | Without Mortgage | With Mortgage |
| Less than $50,000 | 28 (18.9%) | 0 (0.0%) |
| $50,000 to $99,999 | 28 (18.9%) | 48 (32.7%) |
| $100,000 to $299,999 | 81 (54.7%) | 84 (57.1%) |
| $300,000 to $499,999 | 11 (7.4%) | 0 (0.0%) |
| $500,000 to $749,999 | 0 (0.0%) | 0 (0.0%) |
| $750,000 to $999,999 | 0 (0.0%) | 0 (0.0%) |
| $1,000,000 or more | 0 (0.0%) | 15 (10.2%) |
| Total | 148 (100.0%) | 147 (100.0%) |
Household Income by Mortgage Status in White Deer
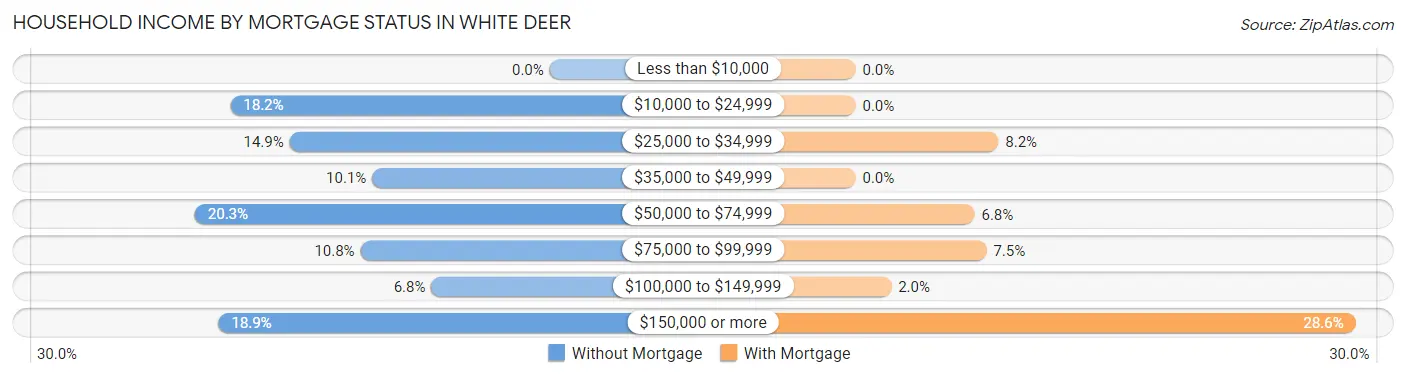
| Household Income | Without Mortgage | With Mortgage |
| Less than $10,000 | 0 (0.0%) | 0 (0.0%) |
| $10,000 to $24,999 | 27 (18.2%) | 0 (0.0%) |
| $25,000 to $34,999 | 22 (14.9%) | 12 (8.2%) |
| $35,000 to $49,999 | 15 (10.1%) | 0 (0.0%) |
| $50,000 to $74,999 | 30 (20.3%) | 10 (6.8%) |
| $75,000 to $99,999 | 16 (10.8%) | 11 (7.5%) |
| $100,000 to $149,999 | 10 (6.8%) | 3 (2.0%) |
| $150,000 or more | 28 (18.9%) | 42 (28.6%) |
| Total | 148 (100.0%) | 147 (100.0%) |
Property Value to Household Income Ratio in White Deer
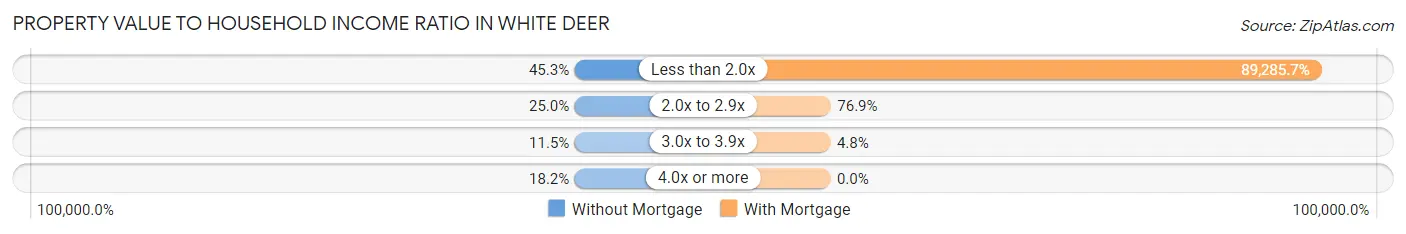
| Value-to-Income Ratio | Without Mortgage | With Mortgage |
| Less than 2.0x | 67 (45.3%) | 131,250 (89,285.7%) |
| 2.0x to 2.9x | 37 (25.0%) | 113 (76.9%) |
| 3.0x to 3.9x | 17 (11.5%) | 7 (4.8%) |
| 4.0x or more | 27 (18.2%) | 0 (0.0%) |
| Total | 148 (100.0%) | 147 (100.0%) |
Real Estate Taxes by Mortgage Status in White Deer
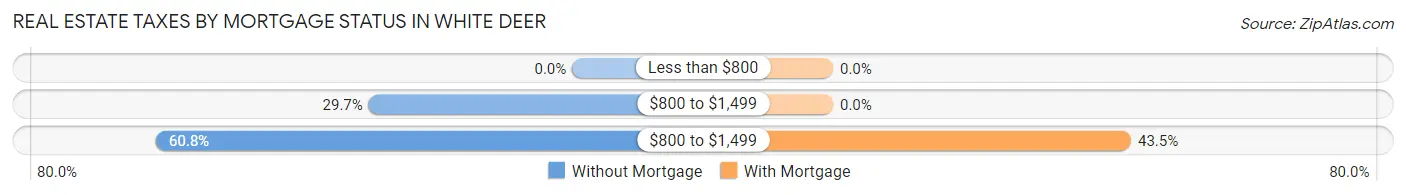
| Property Taxes | Without Mortgage | With Mortgage |
| Less than $800 | 0 (0.0%) | 0 (0.0%) |
| $800 to $1,499 | 44 (29.7%) | 0 (0.0%) |
| $800 to $1,499 | 90 (60.8%) | 64 (43.5%) |
| Total | 148 (100.0%) | 147 (100.0%) |
Health & Disability in White Deer
Health Insurance Coverage by Age in White Deer
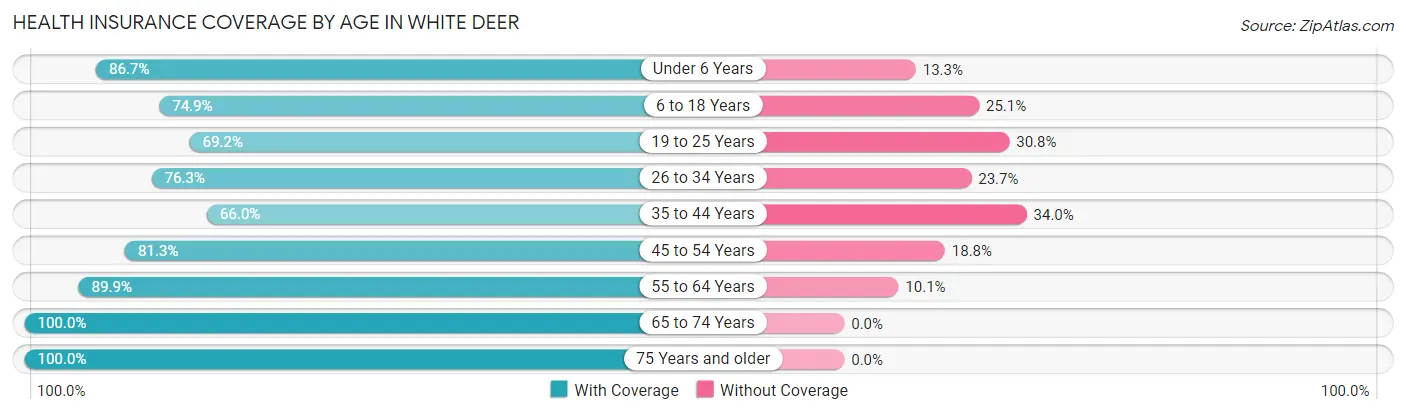
| Age Bracket | With Coverage | Without Coverage |
| Under 6 Years | 52 (86.7%) | 8 (13.3%) |
| 6 to 18 Years | 146 (74.9%) | 49 (25.1%) |
| 19 to 25 Years | 54 (69.2%) | 24 (30.8%) |
| 26 to 34 Years | 58 (76.3%) | 18 (23.7%) |
| 35 to 44 Years | 132 (66.0%) | 68 (34.0%) |
| 45 to 54 Years | 52 (81.2%) | 12 (18.8%) |
| 55 to 64 Years | 98 (89.9%) | 11 (10.1%) |
| 65 to 74 Years | 83 (100.0%) | 0 (0.0%) |
| 75 Years and older | 49 (100.0%) | 0 (0.0%) |
| Total | 724 (79.2%) | 190 (20.8%) |
Health Insurance Coverage by Citizenship Status in White Deer
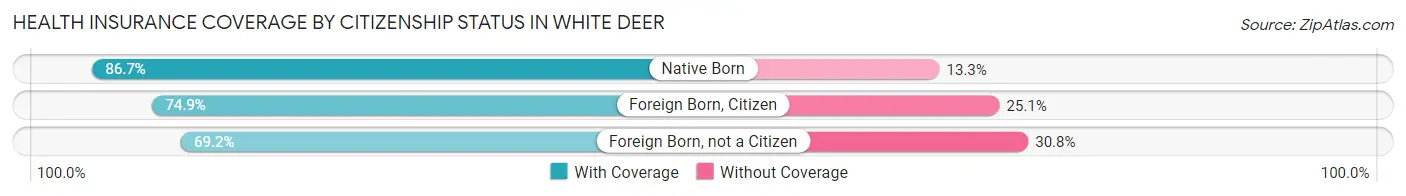
| Citizenship Status | With Coverage | Without Coverage |
| Native Born | 52 (86.7%) | 8 (13.3%) |
| Foreign Born, Citizen | 146 (74.9%) | 49 (25.1%) |
| Foreign Born, not a Citizen | 54 (69.2%) | 24 (30.8%) |
Health Insurance Coverage by Household Income in White Deer
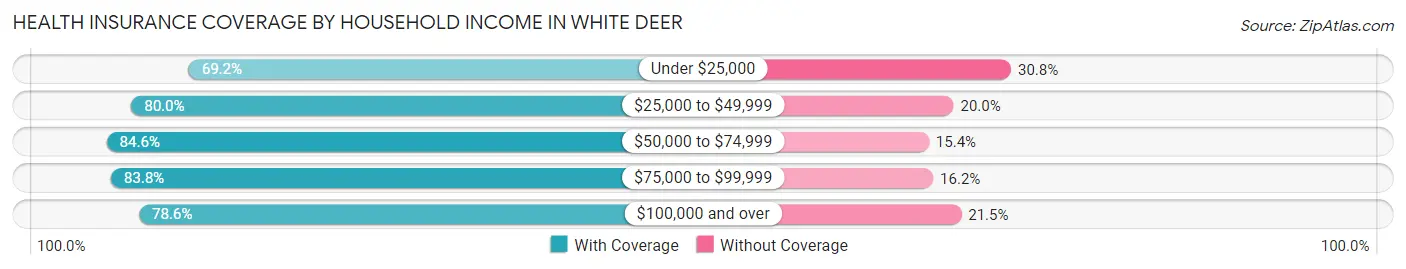
| Household Income | With Coverage | Without Coverage |
| Under $25,000 | 27 (69.2%) | 12 (30.8%) |
| $25,000 to $49,999 | 76 (80.0%) | 19 (20.0%) |
| $50,000 to $74,999 | 66 (84.6%) | 12 (15.4%) |
| $75,000 to $99,999 | 57 (83.8%) | 11 (16.2%) |
| $100,000 and over | 498 (78.5%) | 136 (21.4%) |
Public vs Private Health Insurance Coverage by Age in White Deer
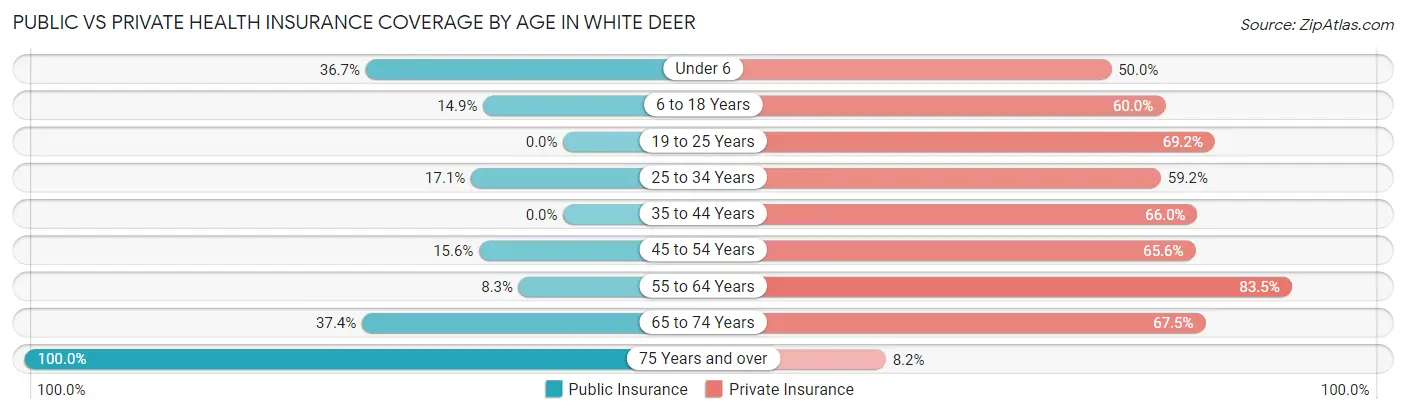
| Age Bracket | Public Insurance | Private Insurance |
| Under 6 | 22 (36.7%) | 30 (50.0%) |
| 6 to 18 Years | 29 (14.9%) | 117 (60.0%) |
| 19 to 25 Years | 0 (0.0%) | 54 (69.2%) |
| 25 to 34 Years | 13 (17.1%) | 45 (59.2%) |
| 35 to 44 Years | 0 (0.0%) | 132 (66.0%) |
| 45 to 54 Years | 10 (15.6%) | 42 (65.6%) |
| 55 to 64 Years | 9 (8.3%) | 91 (83.5%) |
| 65 to 74 Years | 31 (37.3%) | 56 (67.5%) |
| 75 Years and over | 49 (100.0%) | 4 (8.2%) |
| Total | 163 (17.8%) | 571 (62.5%) |
Disability Status by Sex by Age in White Deer
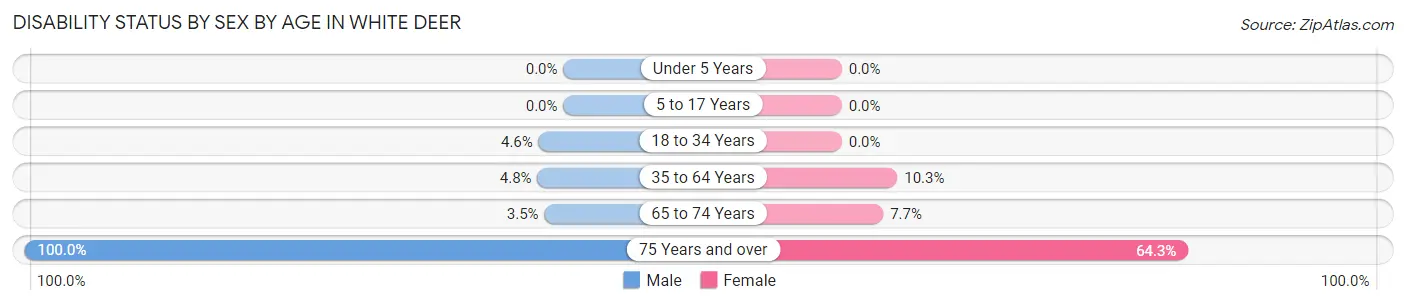
| Age Bracket | Male | Female |
| Under 5 Years | 0 (0.0%) | 0 (0.0%) |
| 5 to 17 Years | 0 (0.0%) | 0 (0.0%) |
| 18 to 34 Years | 5 (4.6%) | 0 (0.0%) |
| 35 to 64 Years | 10 (4.8%) | 17 (10.3%) |
| 65 to 74 Years | 2 (3.5%) | 2 (7.7%) |
| 75 Years and over | 21 (100.0%) | 18 (64.3%) |
Disability Class by Sex by Age in White Deer
Disability Class: Hearing Difficulty
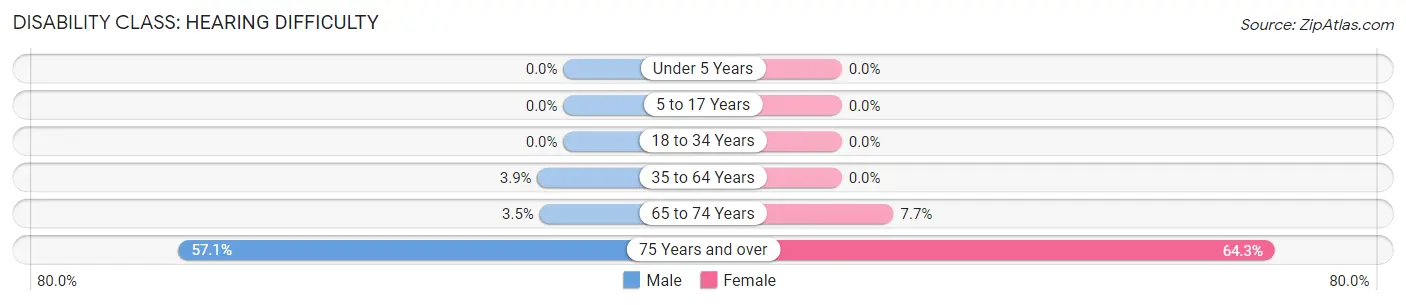
| Age Bracket | Male | Female |
| Under 5 Years | 0 (0.0%) | 0 (0.0%) |
| 5 to 17 Years | 0 (0.0%) | 0 (0.0%) |
| 18 to 34 Years | 0 (0.0%) | 0 (0.0%) |
| 35 to 64 Years | 8 (3.8%) | 0 (0.0%) |
| 65 to 74 Years | 2 (3.5%) | 2 (7.7%) |
| 75 Years and over | 12 (57.1%) | 18 (64.3%) |
Disability Class: Vision Difficulty
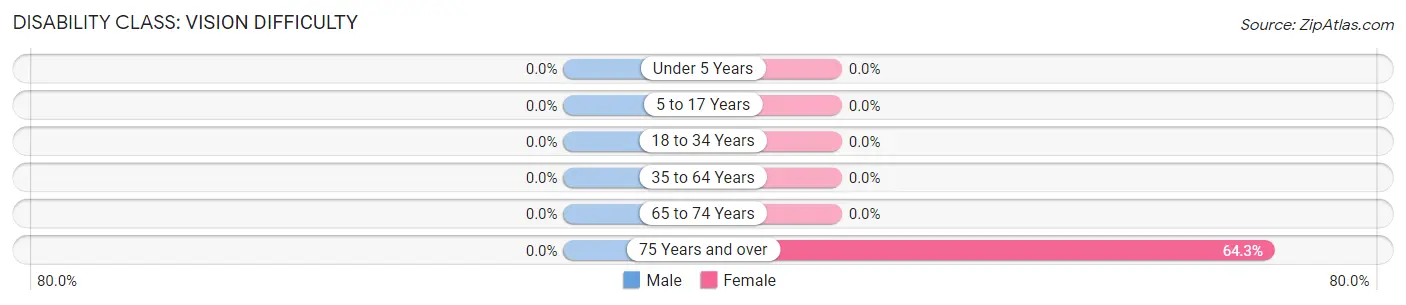
| Age Bracket | Male | Female |
| Under 5 Years | 0 (0.0%) | 0 (0.0%) |
| 5 to 17 Years | 0 (0.0%) | 0 (0.0%) |
| 18 to 34 Years | 0 (0.0%) | 0 (0.0%) |
| 35 to 64 Years | 0 (0.0%) | 0 (0.0%) |
| 65 to 74 Years | 0 (0.0%) | 0 (0.0%) |
| 75 Years and over | 0 (0.0%) | 18 (64.3%) |
Disability Class: Cognitive Difficulty
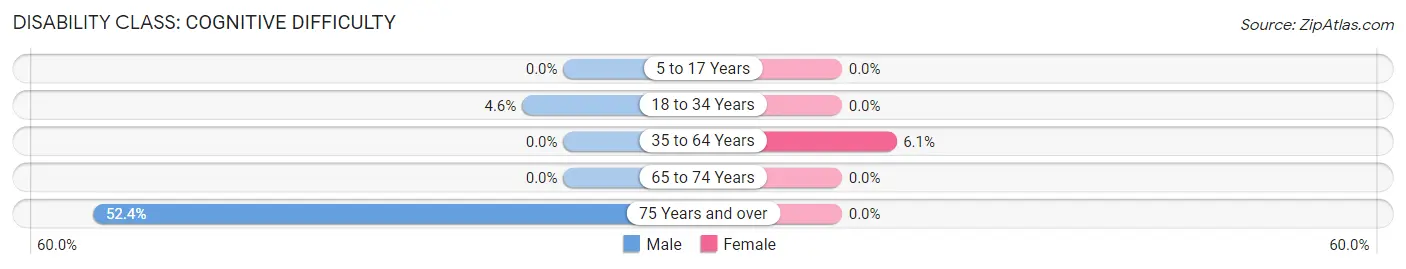
| Age Bracket | Male | Female |
| 5 to 17 Years | 0 (0.0%) | 0 (0.0%) |
| 18 to 34 Years | 5 (4.6%) | 0 (0.0%) |
| 35 to 64 Years | 0 (0.0%) | 10 (6.1%) |
| 65 to 74 Years | 0 (0.0%) | 0 (0.0%) |
| 75 Years and over | 11 (52.4%) | 0 (0.0%) |
Disability Class: Ambulatory Difficulty
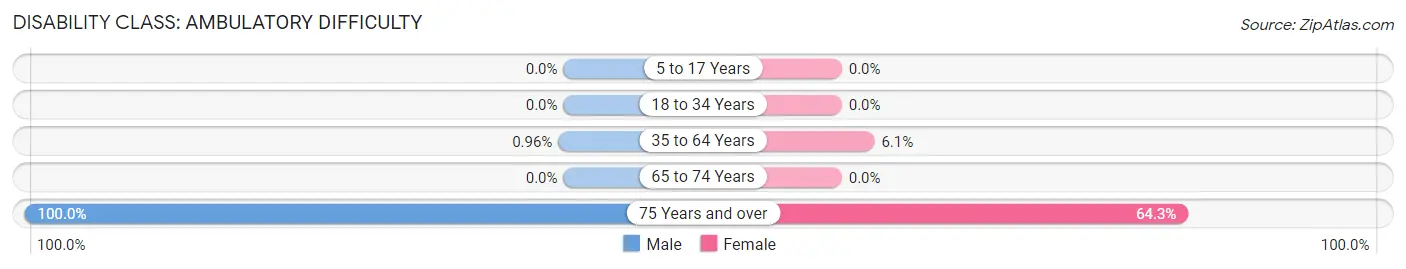
| Age Bracket | Male | Female |
| 5 to 17 Years | 0 (0.0%) | 0 (0.0%) |
| 18 to 34 Years | 0 (0.0%) | 0 (0.0%) |
| 35 to 64 Years | 2 (1.0%) | 10 (6.1%) |
| 65 to 74 Years | 0 (0.0%) | 0 (0.0%) |
| 75 Years and over | 21 (100.0%) | 18 (64.3%) |
Disability Class: Self-Care Difficulty
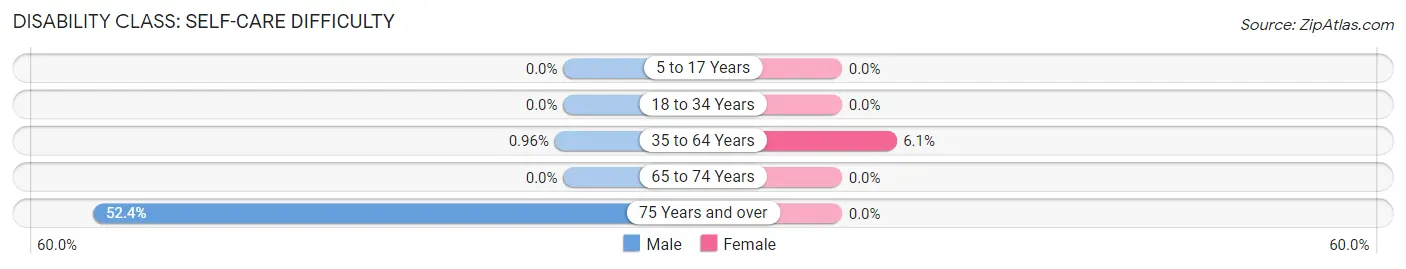
| Age Bracket | Male | Female |
| 5 to 17 Years | 0 (0.0%) | 0 (0.0%) |
| 18 to 34 Years | 0 (0.0%) | 0 (0.0%) |
| 35 to 64 Years | 2 (1.0%) | 10 (6.1%) |
| 65 to 74 Years | 0 (0.0%) | 0 (0.0%) |
| 75 Years and over | 11 (52.4%) | 0 (0.0%) |
Technology Access in White Deer
Computing Device Access in White Deer
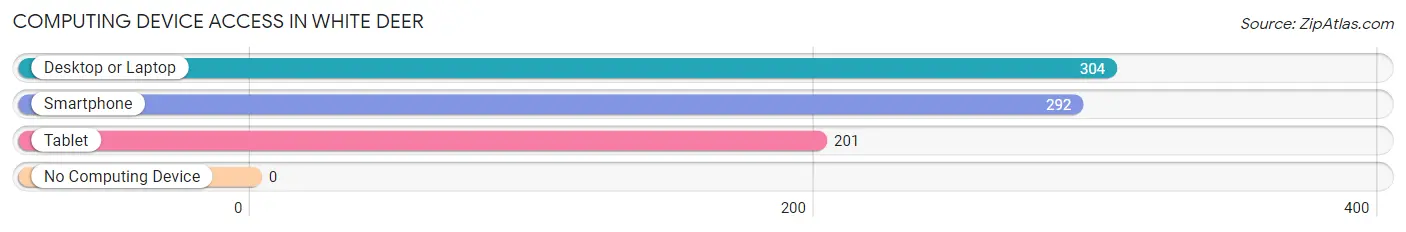
| Device Type | # Households | % Households |
| Desktop or Laptop | 304 | 86.1% |
| Smartphone | 292 | 82.7% |
| Tablet | 201 | 56.9% |
| No Computing Device | 0 | 0.0% |
| Total | 353 | 100.0% |
Internet Access in White Deer
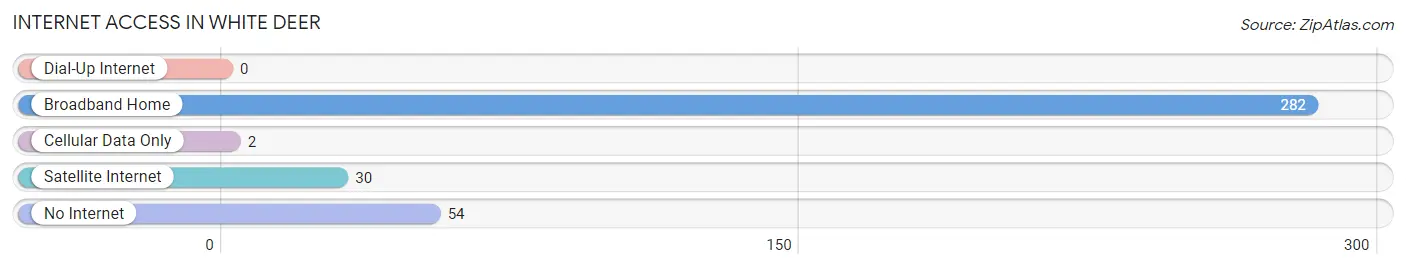
| Internet Type | # Households | % Households |
| Dial-Up Internet | 0 | 0.0% |
| Broadband Home | 282 | 79.9% |
| Cellular Data Only | 2 | 0.6% |
| Satellite Internet | 30 | 8.5% |
| No Internet | 54 | 15.3% |
| Total | 353 | 100.0% |
White Deer Summary
White Deer is a small town located in the northern part of Texas, in the Panhandle region. It is situated in the county of Carson, and is part of the Amarillo Metropolitan Statistical Area. The town has a population of 1,741 people, according to the 2010 census.
History
White Deer was founded in 1887 by a group of settlers from the nearby town of Mobeetie. The town was named after the white deer that were seen in the area. The first post office was established in 1891, and the town was incorporated in 1909.
The town was originally a farming and ranching community, and the main crops grown were cotton, corn, and wheat. The town also had a number of businesses, including a bank, a hotel, a general store, and a blacksmith shop.
In the early 1900s, the town began to grow and prosper. The Santa Fe Railroad built a line through the town, and the population increased to over 1,000 people. The town also had a number of churches, schools, and other businesses.
In the 1920s, the town began to decline. The Great Depression caused many of the businesses to close, and the population began to decline. The town was also affected by the Dust Bowl, and many of the farmers and ranchers left the area.
In the 1950s, the town began to revive. The oil industry began to boom in the area, and the population began to increase. The town also had a number of new businesses, including a grocery store, a hardware store, and a movie theater.
Geography
White Deer is located in the northern part of Texas, in the Panhandle region. It is situated in the county of Carson, and is part of the Amarillo Metropolitan Statistical Area. The town is located at an elevation of 2,845 feet above sea level.
The town is located in a semi-arid climate, with hot summers and cold winters. The average annual temperature is 64 degrees Fahrenheit, and the average annual precipitation is 17.5 inches.
Economy
The economy of White Deer is largely based on agriculture and oil production. The town is home to a number of farms and ranches, and the main crops grown are cotton, corn, and wheat. The town also has a number of businesses, including a grocery store, a hardware store, and a movie theater.
The oil industry is also an important part of the economy. The town is home to a number of oil and gas companies, and the town is also home to a number of oil and gas related businesses.
Demographics
According to the 2010 census, the population of White Deer is 1,741 people. The population is made up of a mix of races, with the majority being White (83.3%), followed by Hispanic (10.2%), African American (3.2%), and Native American (1.3%).
The median household income in White Deer is $37,917, and the median age is 37. The town has a high rate of poverty, with 24.3% of the population living below the poverty line. The town also has a high rate of unemployment, with 8.3% of the population unemployed.
Common Questions
What is Per Capita Income in White Deer?
Per Capita income in White Deer is $45,297.
What is the Median Family Income in White Deer?
Median Family Income in White Deer is $131,806.
What is the Median Household income in White Deer?
Median Household Income in White Deer is $113,173.
What is Income or Wage Gap in White Deer?
Income or Wage Gap in White Deer is 55.7%.
Women in White Deer earn 44.3 cents for every dollar earned by a man.
What is Inequality or Gini Index in White Deer?
Inequality or Gini Index in White Deer is 0.37.
What is the Total Population of White Deer?
Total Population of White Deer is 914.
What is the Total Male Population of White Deer?
Total Male Population of White Deer is 509.
What is the Total Female Population of White Deer?
Total Female Population of White Deer is 405.
What is the Ratio of Males per 100 Females in White Deer?
There are 125.68 Males per 100 Females in White Deer.
What is the Ratio of Females per 100 Males in White Deer?
There are 79.57 Females per 100 Males in White Deer.
What is the Median Population Age in White Deer?
Median Population Age in White Deer is 38.9 Years.
What is the Average Family Size in White Deer
Average Family Size in White Deer is 3.1 People.
What is the Average Household Size in White Deer
Average Household Size in White Deer is 2.6 People.
How Large is the Labor Force in White Deer?
There are 475 People in the Labor Forcein in White Deer.
What is the Percentage of People in the Labor Force in White Deer?
66.3% of People are in the Labor Force in White Deer.
What is the Unemployment Rate in White Deer?
Unemployment Rate in White Deer is 3.6%.