Mikes, TX Map & Demographics
Mikes Map
Mikes Overview
$16,571
PER CAPITA INCOME
$53,487
AVG FAMILY INCOME
0.48
INEQUALITY / GINI INDEX
1,364
TOTAL POPULATION
705
MALE POPULATION
659
FEMALE POPULATION
106.98
MALES / 100 FEMALES
93.48
FEMALES / 100 MALES
33.2
MEDIAN AGE
5.0
AVG FAMILY SIZE
3.8
AVG HOUSEHOLD SIZE
570
LABOR FORCE [ PEOPLE ]
59.6%
PERCENT IN LABOR FORCE
3.5%
UNEMPLOYMENT RATE
Income in Mikes
Income Overview in Mikes
| Characteristic | Number | Measure |
| Per Capita Income | 1,364 | $16,571 |
| Median Family Income | 251 | $53,487 |
| Mean Family Income | 251 | $65,004 |
| Median Household Income | 362 | $0 |
| Mean Household Income | 362 | $48,061 |
| Income Deficit | 251 | $0 |
| Wage / Income Gap (%) | 1,364 | 0.00% |
| Wage / Income Gap ($) | 1,364 | 100.00¢ per $1 |
| Gini / Inequality Index | 1,364 | 0.48 |
Earnings by Sex in Mikes
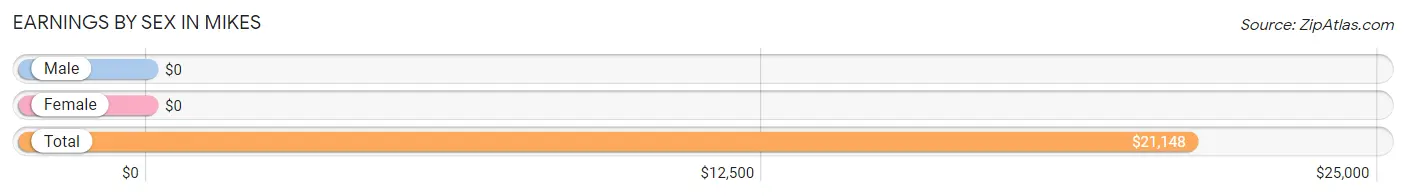
| Sex | Number | Average Earnings |
| Male | 453 (76.1%) | $0 |
| Female | 142 (23.9%) | $0 |
| Total | 595 (100.0%) | $21,148 |
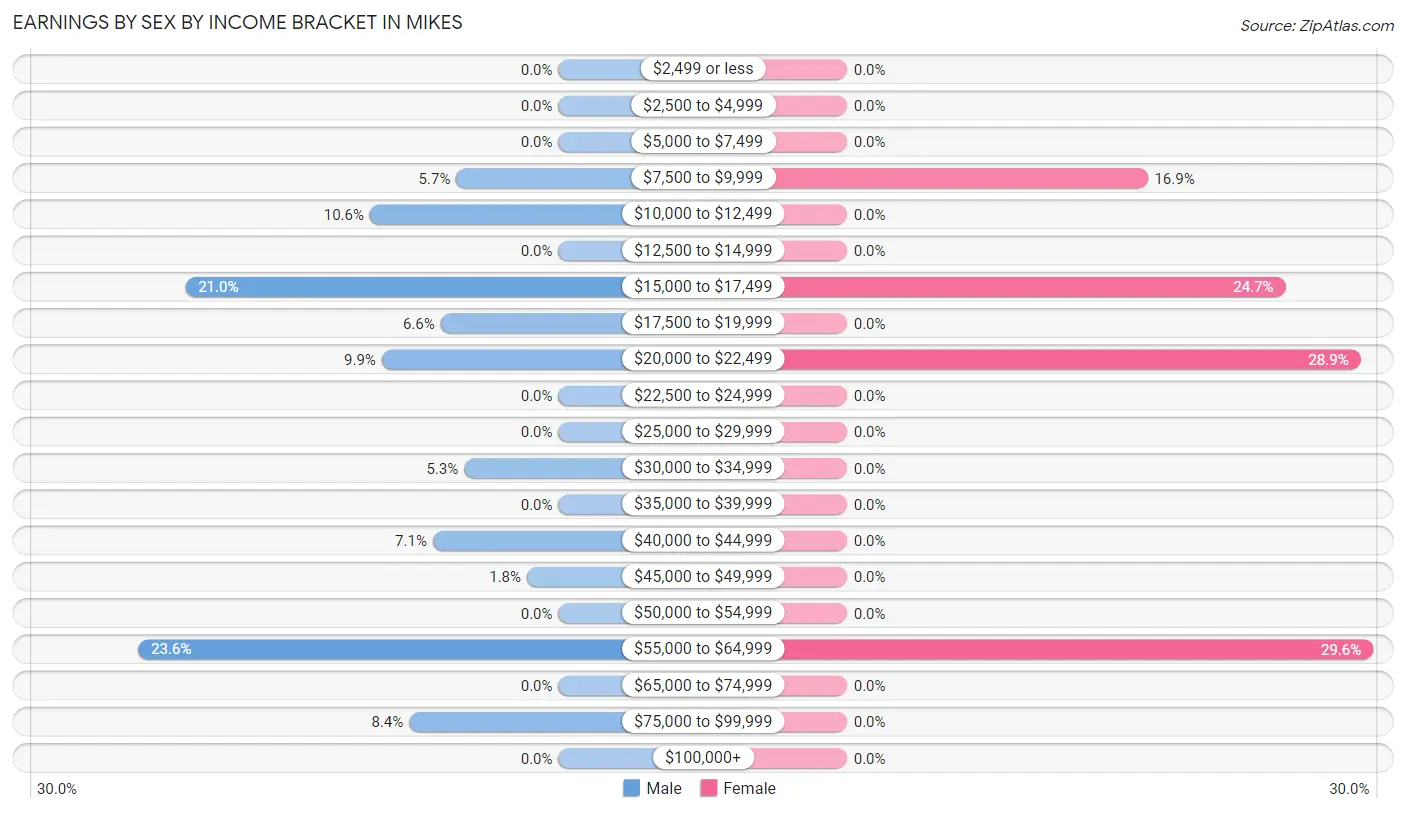
Earnings by Sex by Income Bracket in Mikes
The most common earnings brackets in Mikes are $55,000 to $64,999 for men (107 | 23.6%) and $55,000 to $64,999 for women (42 | 29.6%).
| Income | Male | Female |
| $2,499 or less | 0 (0.0%) | 0 (0.0%) |
| $2,500 to $4,999 | 0 (0.0%) | 0 (0.0%) |
| $5,000 to $7,499 | 0 (0.0%) | 0 (0.0%) |
| $7,500 to $9,999 | 26 (5.7%) | 24 (16.9%) |
| $10,000 to $12,499 | 48 (10.6%) | 0 (0.0%) |
| $12,500 to $14,999 | 0 (0.0%) | 0 (0.0%) |
| $15,000 to $17,499 | 95 (21.0%) | 35 (24.6%) |
| $17,500 to $19,999 | 30 (6.6%) | 0 (0.0%) |
| $20,000 to $22,499 | 45 (9.9%) | 41 (28.9%) |
| $22,500 to $24,999 | 0 (0.0%) | 0 (0.0%) |
| $25,000 to $29,999 | 0 (0.0%) | 0 (0.0%) |
| $30,000 to $34,999 | 24 (5.3%) | 0 (0.0%) |
| $35,000 to $39,999 | 0 (0.0%) | 0 (0.0%) |
| $40,000 to $44,999 | 32 (7.1%) | 0 (0.0%) |
| $45,000 to $49,999 | 8 (1.8%) | 0 (0.0%) |
| $50,000 to $54,999 | 0 (0.0%) | 0 (0.0%) |
| $55,000 to $64,999 | 107 (23.6%) | 42 (29.6%) |
| $65,000 to $74,999 | 0 (0.0%) | 0 (0.0%) |
| $75,000 to $99,999 | 38 (8.4%) | 0 (0.0%) |
| $100,000+ | 0 (0.0%) | 0 (0.0%) |
| Total | 453 (100.0%) | 142 (100.0%) |
Earnings by Sex by Educational Attainment in Mikes
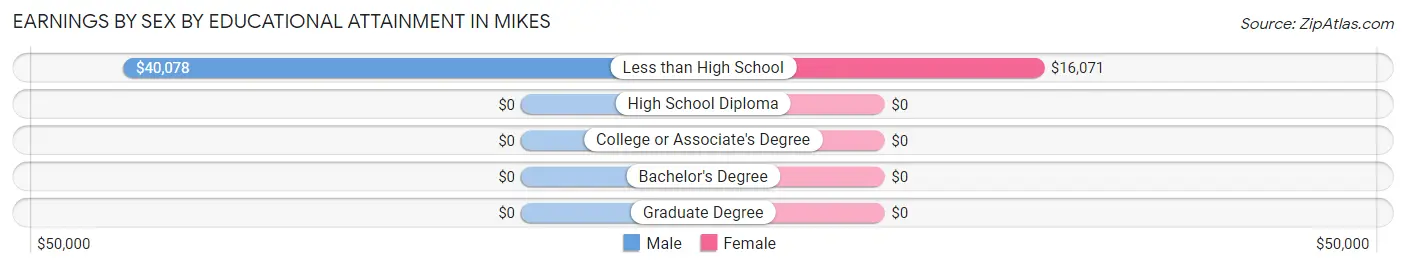
| Educational Attainment | Male Income | Female Income |
| Less than High School | $40,078 | $16,071 |
| High School Diploma | - | - |
| College or Associate's Degree | - | - |
| Bachelor's Degree | - | - |
| Graduate Degree | - | - |
| Total | $33,594 | $0 |
Family Income in Mikes
Family Income Brackets in Mikes
According to the Mikes family income data, there are 77 families falling into the $100,000 to $149,999 income range, which is the most common income bracket and makes up 30.7% of all families.
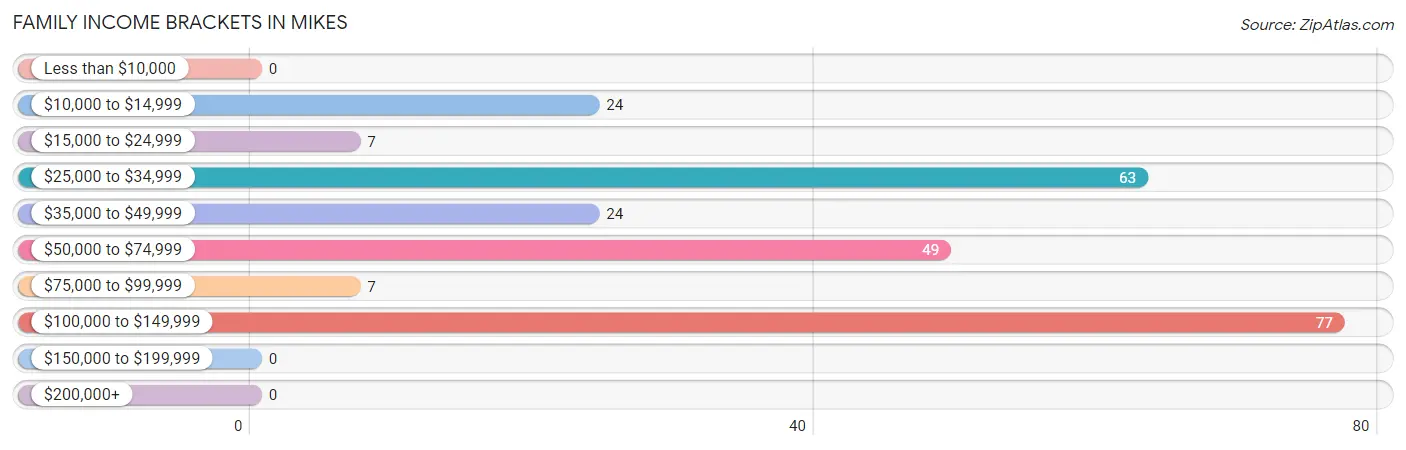
| Income Bracket | # Families | % Families |
| Less than $10,000 | 0 | 0.0% |
| $10,000 to $14,999 | 24 | 9.6% |
| $15,000 to $24,999 | 7 | 2.8% |
| $25,000 to $34,999 | 63 | 25.1% |
| $35,000 to $49,999 | 24 | 9.6% |
| $50,000 to $74,999 | 49 | 19.5% |
| $75,000 to $99,999 | 7 | 2.8% |
| $100,000 to $149,999 | 77 | 30.7% |
| $150,000 to $199,999 | 0 | 0.0% |
| $200,000+ | 0 | 0.0% |
Family Income by Famaliy Size in Mikes
5-person families (27 | 10.8%) account for the highest median family income in Mikes with $67,969 per family, while 2-person families (68 | 27.1%) have the highest median income of $13,852 per family member.
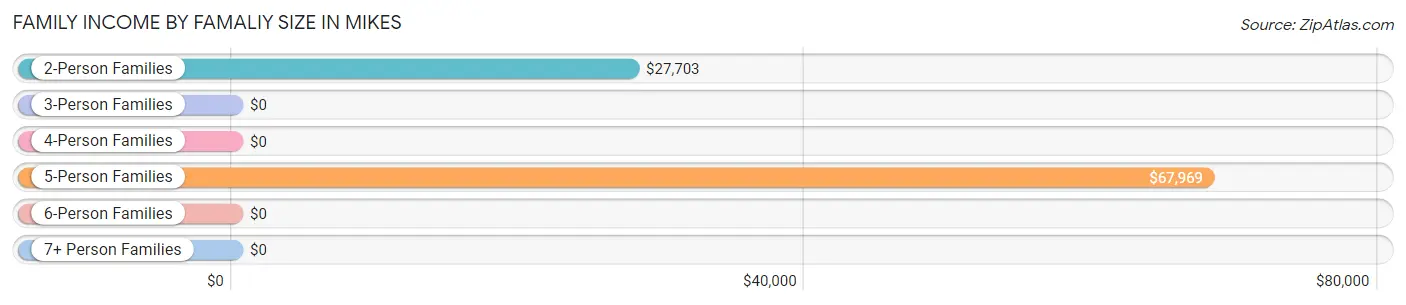
| Income Bracket | # Families | Median Income |
| 2-Person Families | 68 (27.1%) | $27,703 |
| 3-Person Families | 19 (7.6%) | $0 |
| 4-Person Families | 86 (34.3%) | $0 |
| 5-Person Families | 27 (10.8%) | $67,969 |
| 6-Person Families | 51 (20.3%) | $0 |
| 7+ Person Families | 0 (0.0%) | $0 |
| Total | 251 (100.0%) | $53,487 |
Family Income by Number of Earners in Mikes
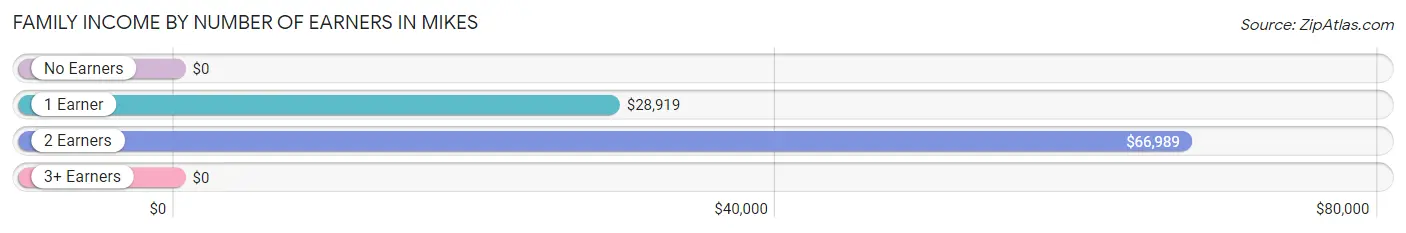
| Number of Earners | # Families | Median Income |
| No Earners | 31 (12.3%) | $0 |
| 1 Earner | 70 (27.9%) | $28,919 |
| 2 Earners | 83 (33.1%) | $66,989 |
| 3+ Earners | 67 (26.7%) | $0 |
| Total | 251 (100.0%) | $53,487 |
Household Income in Mikes
Household Income Brackets in Mikes
With 77 households falling in the category, the $100,000 to $149,999 income range is the most frequent in Mikes, accounting for 21.3% of all households.
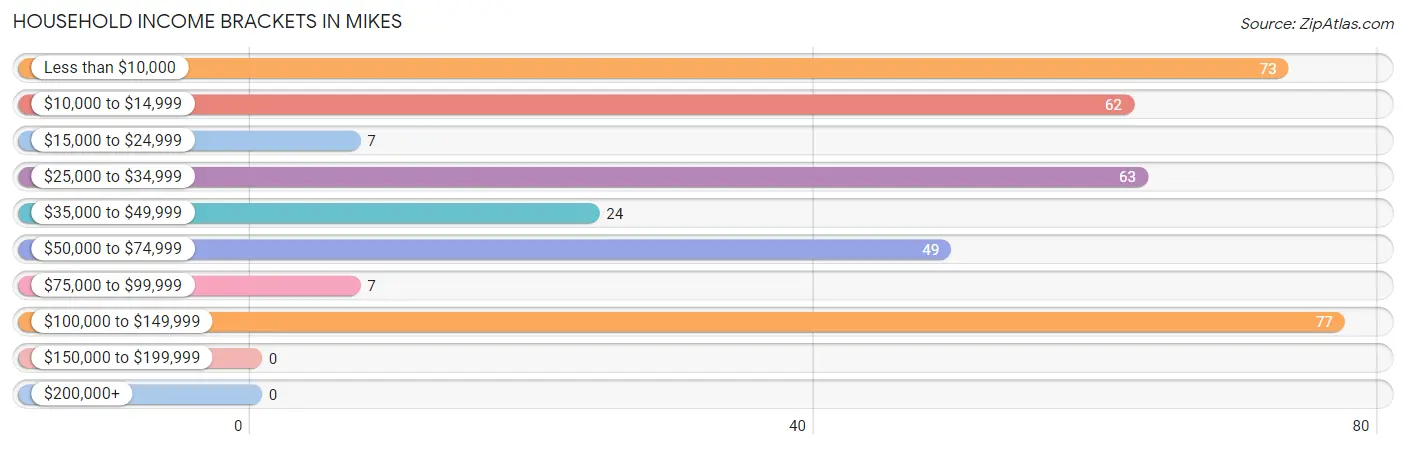
| Income Bracket | # Households | % Households |
| Less than $10,000 | 73 | 20.2% |
| $10,000 to $14,999 | 62 | 17.1% |
| $15,000 to $24,999 | 7 | 1.9% |
| $25,000 to $34,999 | 63 | 17.4% |
| $35,000 to $49,999 | 24 | 6.6% |
| $50,000 to $74,999 | 49 | 13.5% |
| $75,000 to $99,999 | 7 | 1.9% |
| $100,000 to $149,999 | 77 | 21.3% |
| $150,000 to $199,999 | 0 | 0.0% |
| $200,000+ | 0 | 0.0% |
Household Income by Householder Age in Mikes
The median household income in Mikes is $0, with the highest median household income of $130,547 found in the 45 to 64 years age bracket for the primary householder. A total of 75 households (20.7%) fall into this category.
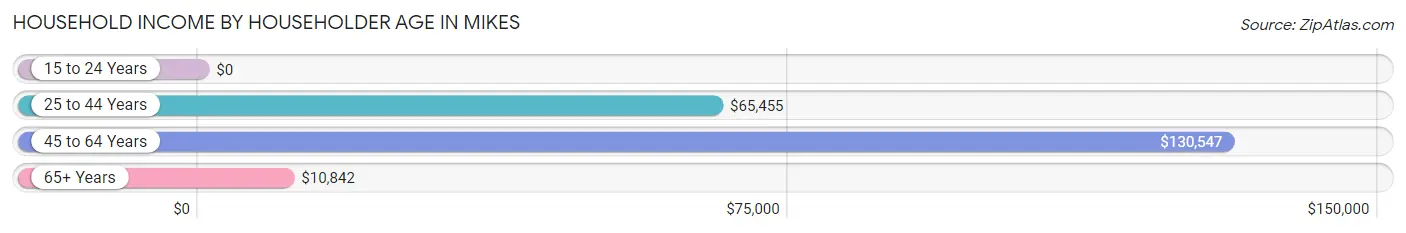
| Income Bracket | # Households | Median Income |
| 15 to 24 Years | 0 (0.0%) | $0 |
| 25 to 44 Years | 108 (29.8%) | $65,455 |
| 45 to 64 Years | 75 (20.7%) | $130,547 |
| 65+ Years | 179 (49.4%) | $10,842 |
| Total | 362 (100.0%) | $0 |
Poverty in Mikes
Income Below Poverty by Sex and Age in Mikes
With 27.7% poverty level for males and 32.2% for females among the residents of Mikes, 5 year old males and 75 year old and over females are the most vulnerable to poverty, with 51 males (100.0%) and 133 females (100.0%) in their respective age groups living below the poverty level.
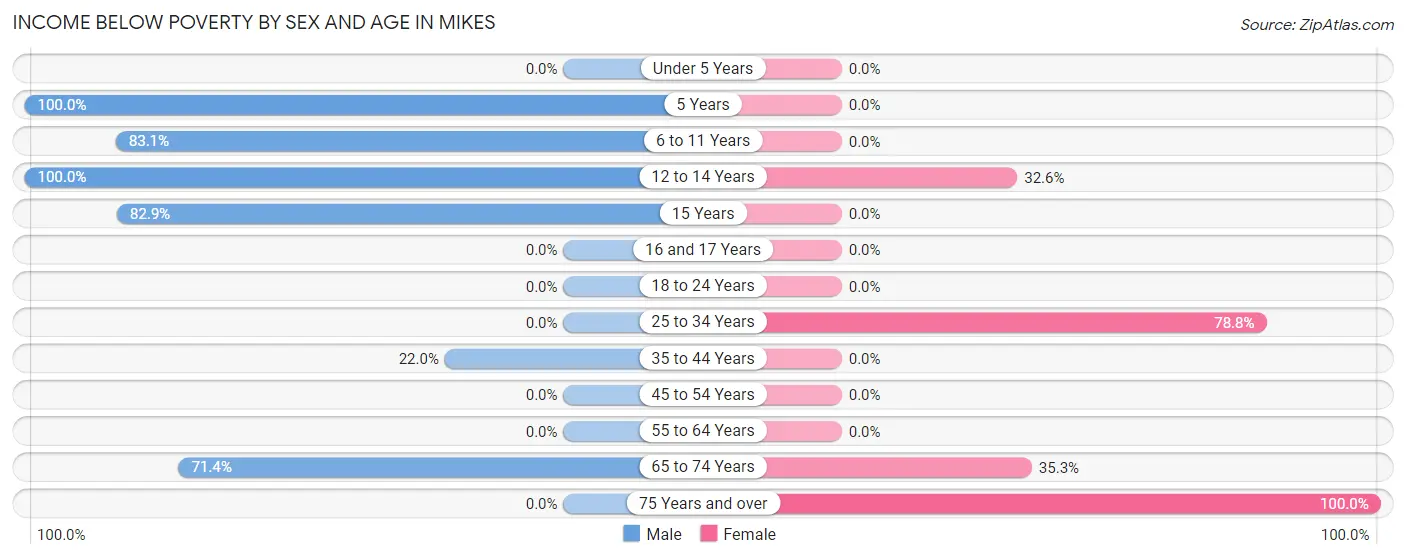
| Age Bracket | Male | Female |
| Under 5 Years | 0 (0.0%) | 0 (0.0%) |
| 5 Years | 51 (100.0%) | 0 (0.0%) |
| 6 to 11 Years | 49 (83.1%) | 0 (0.0%) |
| 12 to 14 Years | 17 (100.0%) | 29 (32.6%) |
| 15 Years | 29 (82.9%) | 0 (0.0%) |
| 16 and 17 Years | 0 (0.0%) | 0 (0.0%) |
| 18 to 24 Years | 0 (0.0%) | 0 (0.0%) |
| 25 to 34 Years | 0 (0.0%) | 26 (78.8%) |
| 35 to 44 Years | 24 (22.0%) | 0 (0.0%) |
| 45 to 54 Years | 0 (0.0%) | 0 (0.0%) |
| 55 to 64 Years | 0 (0.0%) | 0 (0.0%) |
| 65 to 74 Years | 25 (71.4%) | 24 (35.3%) |
| 75 Years and over | 0 (0.0%) | 133 (100.0%) |
| Total | 195 (27.7%) | 212 (32.2%) |
Income Above Poverty by Sex and Age in Mikes
According to the poverty statistics in Mikes, males aged under 5 years and females aged 6 to 11 years are the age groups that are most secure financially, with 100.0% of males and 100.0% of females in these age groups living above the poverty line.
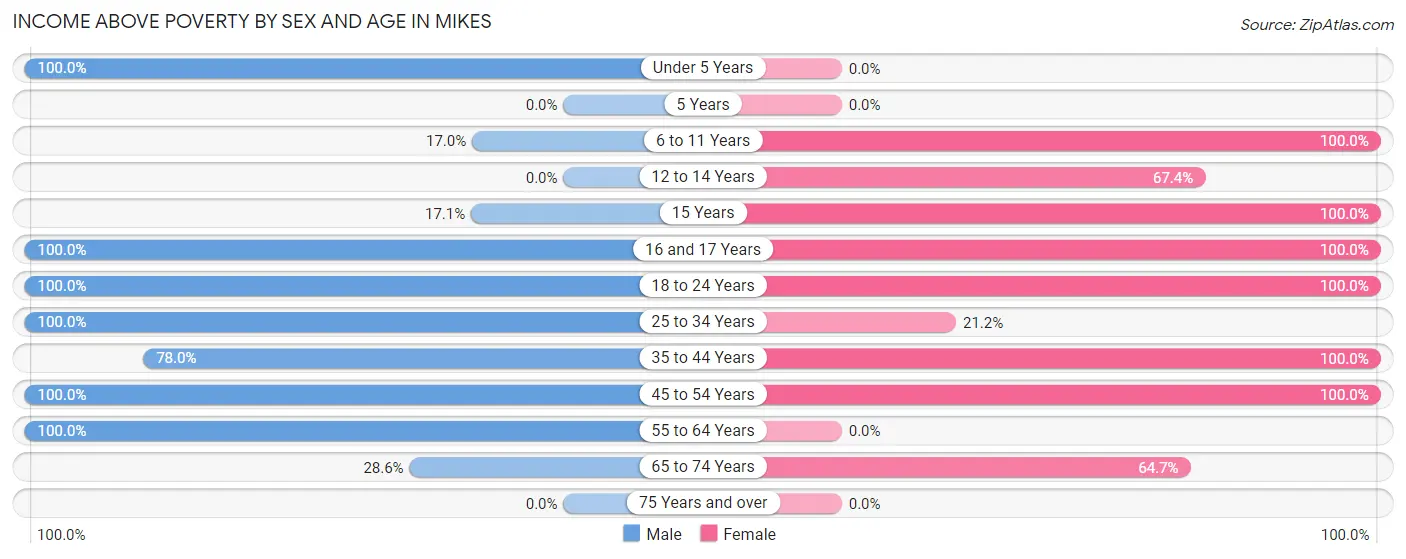
| Age Bracket | Male | Female |
| Under 5 Years | 36 (100.0%) | 0 (0.0%) |
| 5 Years | 0 (0.0%) | 0 (0.0%) |
| 6 to 11 Years | 10 (17.0%) | 96 (100.0%) |
| 12 to 14 Years | 0 (0.0%) | 60 (67.4%) |
| 15 Years | 6 (17.1%) | 24 (100.0%) |
| 16 and 17 Years | 19 (100.0%) | 38 (100.0%) |
| 18 to 24 Years | 56 (100.0%) | 36 (100.0%) |
| 25 to 34 Years | 202 (100.0%) | 7 (21.2%) |
| 35 to 44 Years | 85 (78.0%) | 67 (100.0%) |
| 45 to 54 Years | 78 (100.0%) | 75 (100.0%) |
| 55 to 64 Years | 8 (100.0%) | 0 (0.0%) |
| 65 to 74 Years | 10 (28.6%) | 44 (64.7%) |
| 75 Years and over | 0 (0.0%) | 0 (0.0%) |
| Total | 510 (72.3%) | 447 (67.8%) |
Income Below Poverty Among Married-Couple Families in Mikes
The poverty statistics for married-couple families in Mikes show that 6.8% or 12 of the total 176 families live below the poverty line. Families with 3 or 4 children have the highest poverty rate of 17.1%, comprising of 12 families. On the other hand, families with no children have the lowest poverty rate of 0.0%, which includes 0 families.
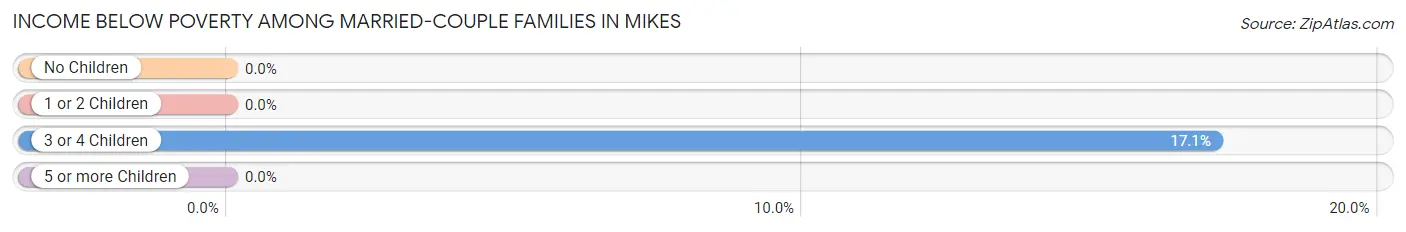
| Children | Above Poverty | Below Poverty |
| No Children | 26 (100.0%) | 0 (0.0%) |
| 1 or 2 Children | 80 (100.0%) | 0 (0.0%) |
| 3 or 4 Children | 58 (82.9%) | 12 (17.1%) |
| 5 or more Children | 0 (0.0%) | 0 (0.0%) |
| Total | 164 (93.2%) | 12 (6.8%) |
Income Below Poverty Among Single-Parent Households in Mikes
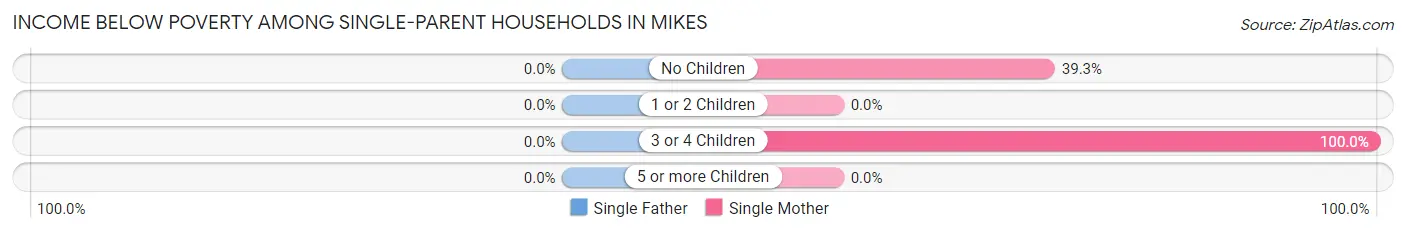
| Children | Single Father | Single Mother |
| No Children | 0 (0.0%) | 24 (39.3%) |
| 1 or 2 Children | 0 (0.0%) | 0 (0.0%) |
| 3 or 4 Children | 0 (0.0%) | 14 (100.0%) |
| 5 or more Children | 0 (0.0%) | 0 (0.0%) |
| Total | 0 (0.0%) | 38 (50.7%) |
Income Below Poverty Among Married-Couple vs Single-Parent Households in Mikes
The poverty data for Mikes shows that 12 of the married-couple family households (6.8%) and 38 of the single-parent households (50.7%) are living below the poverty level. Within the married-couple family households, those with 3 or 4 children have the highest poverty rate, with 12 households (17.1%) falling below the poverty line. Among the single-parent households, those with 3 or 4 children have the highest poverty rate, with 14 household (100.0%) living below poverty.
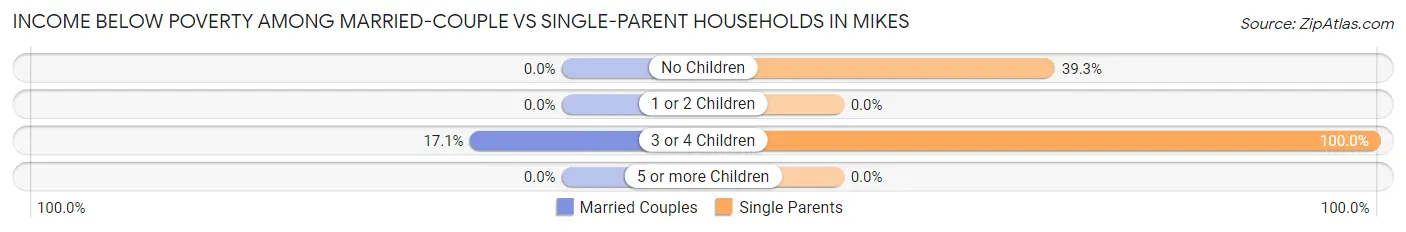
| Children | Married-Couple Families | Single-Parent Households |
| No Children | 0 (0.0%) | 24 (39.3%) |
| 1 or 2 Children | 0 (0.0%) | 0 (0.0%) |
| 3 or 4 Children | 12 (17.1%) | 14 (100.0%) |
| 5 or more Children | 0 (0.0%) | 0 (0.0%) |
| Total | 12 (6.8%) | 38 (50.7%) |
Race in Mikes
The most populous races in Mikes are Hispanic or Latino (1,364 | 100.0%), Two or more Races (806 | 59.1%), and White / Caucasian (409 | 30.0%).
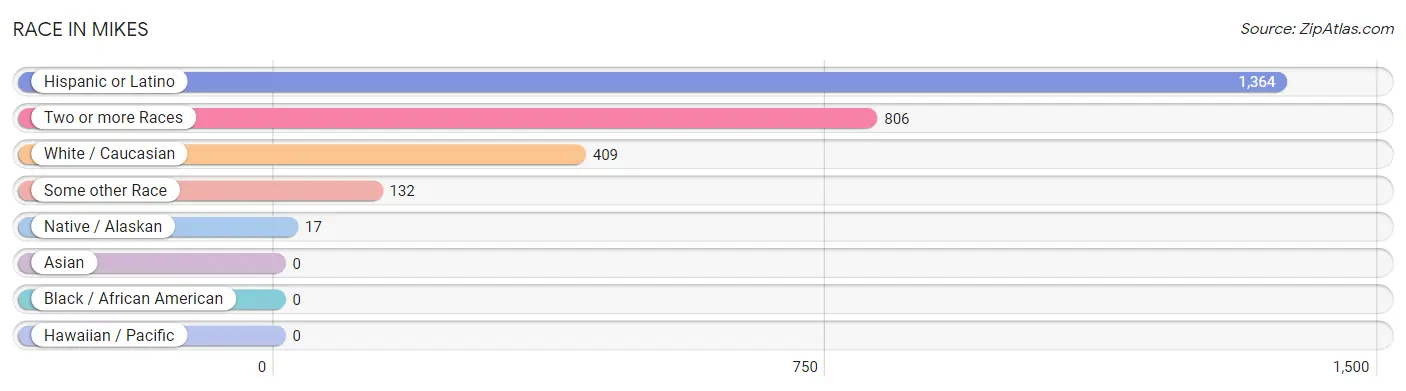
| Race | # Population | % Population |
| Asian | 0 | 0.0% |
| Black / African American | 0 | 0.0% |
| Hawaiian / Pacific | 0 | 0.0% |
| Hispanic or Latino | 1,364 | 100.0% |
| Native / Alaskan | 17 | 1.3% |
| White / Caucasian | 409 | 30.0% |
| Two or more Races | 806 | 59.1% |
| Some other Race | 132 | 9.7% |
| Total | 1,364 | 100.0% |
Ancestry in Mikes
The most populous ancestries reported in Mikes are Mexican (1,364 | 100.0%), and Apache (17 | 1.3%), together accounting for 101.2% of all Mikes residents.
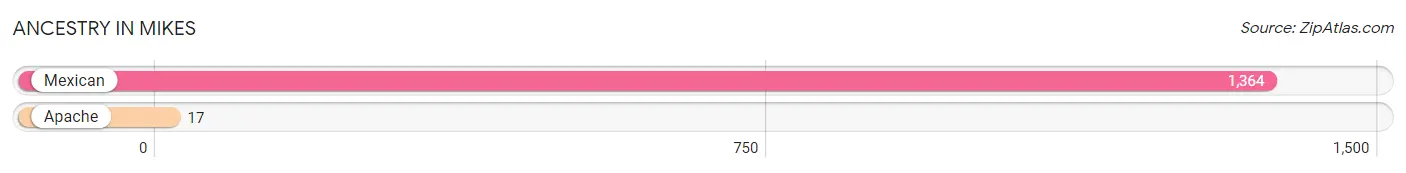
| Ancestry | # Population | % Population |
| Apache | 17 | 1.3% |
| Mexican | 1,364 | 100.0% | View All 2 Rows |
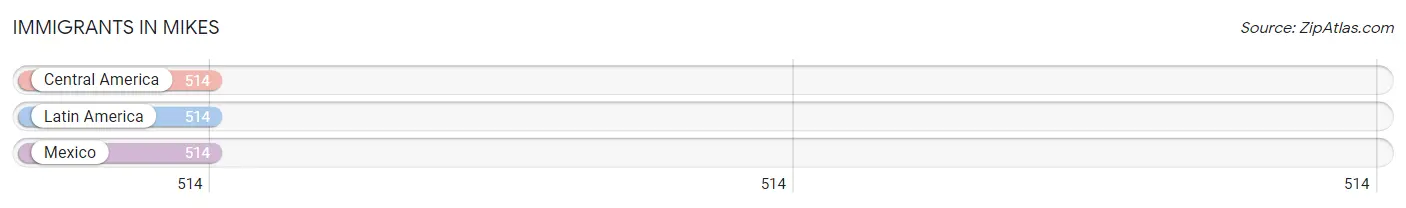
Immigrants in Mikes
The most numerous immigrant groups reported in Mikes came from Central America (514 | 37.7%), Latin America (514 | 37.7%), and Mexico (514 | 37.7%), together accounting for 113.0% of all Mikes residents.
| Immigration Origin | # Population | % Population |
| Central America | 514 | 37.7% |
| Latin America | 514 | 37.7% |
| Mexico | 514 | 37.7% | View All 3 Rows |
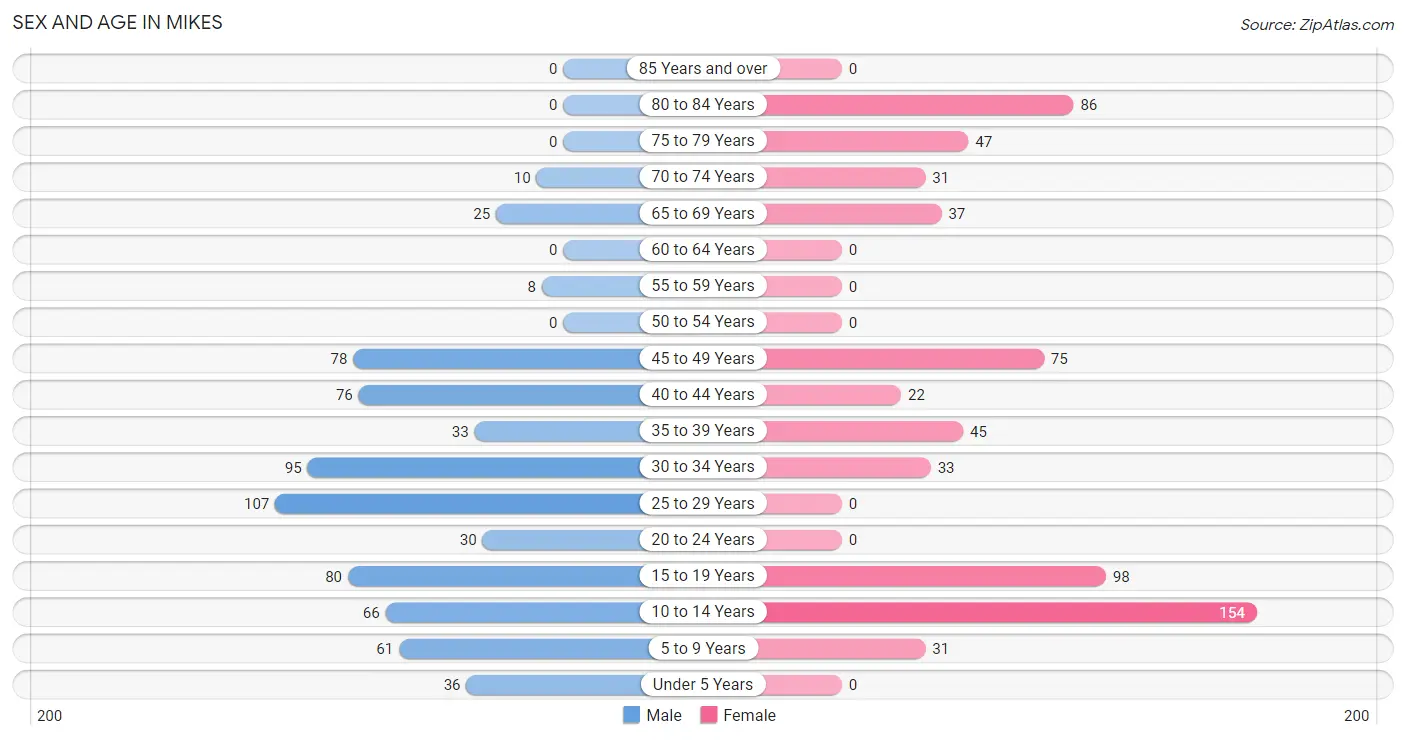
Sex and Age in Mikes
Sex and Age in Mikes
The most populous age groups in Mikes are 25 to 29 Years (107 | 15.2%) for men and 10 to 14 Years (154 | 23.4%) for women.
| Age Bracket | Male | Female |
| Under 5 Years | 36 (5.1%) | 0 (0.0%) |
| 5 to 9 Years | 61 (8.6%) | 31 (4.7%) |
| 10 to 14 Years | 66 (9.4%) | 154 (23.4%) |
| 15 to 19 Years | 80 (11.4%) | 98 (14.9%) |
| 20 to 24 Years | 30 (4.3%) | 0 (0.0%) |
| 25 to 29 Years | 107 (15.2%) | 0 (0.0%) |
| 30 to 34 Years | 95 (13.5%) | 33 (5.0%) |
| 35 to 39 Years | 33 (4.7%) | 45 (6.8%) |
| 40 to 44 Years | 76 (10.8%) | 22 (3.3%) |
| 45 to 49 Years | 78 (11.1%) | 75 (11.4%) |
| 50 to 54 Years | 0 (0.0%) | 0 (0.0%) |
| 55 to 59 Years | 8 (1.1%) | 0 (0.0%) |
| 60 to 64 Years | 0 (0.0%) | 0 (0.0%) |
| 65 to 69 Years | 25 (3.5%) | 37 (5.6%) |
| 70 to 74 Years | 10 (1.4%) | 31 (4.7%) |
| 75 to 79 Years | 0 (0.0%) | 47 (7.1%) |
| 80 to 84 Years | 0 (0.0%) | 86 (13.1%) |
| 85 Years and over | 0 (0.0%) | 0 (0.0%) |
| Total | 705 (100.0%) | 659 (100.0%) |
Families and Households in Mikes
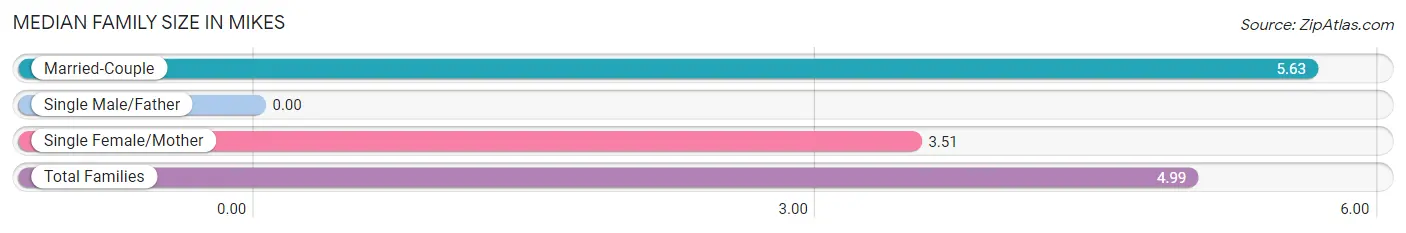
Median Family Size in Mikes
| Family Type | # Families | Family Size |
| Married-Couple | 176 (70.1%) | 5.63 |
| Single Male/Father | 0 (0.0%) | - |
| Single Female/Mother | 75 (29.9%) | 3.51 |
| Total Families | 251 (100.0%) | 4.99 |
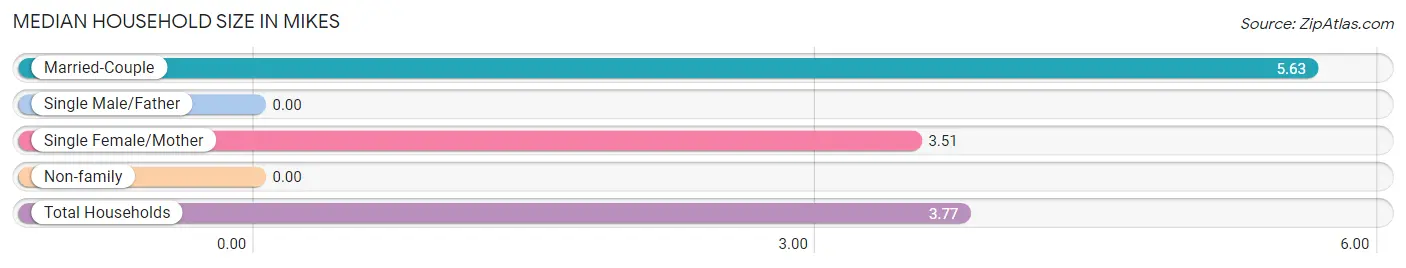
Median Household Size in Mikes
| Household Type | # Households | Household Size |
| Married-Couple | 176 (48.6%) | 5.63 |
| Single Male/Father | 0 (0.0%) | - |
| Single Female/Mother | 75 (20.7%) | 3.51 |
| Non-family | 111 (30.7%) | - |
| Total Households | 362 (100.0%) | 3.77 |
Household Size by Marriage Status in Mikes
Out of a total of 362 households in Mikes, 251 (69.3%) are family households, while 111 (30.7%) are nonfamily households. The most numerous type of family households are 4-person households, comprising 86, and the most common type of nonfamily households are 1-person households, comprising 111.
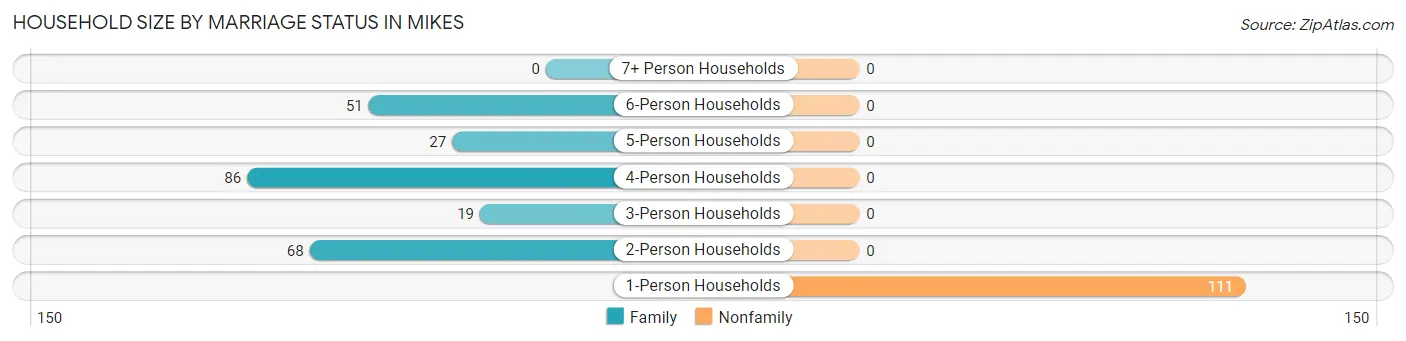
| Household Size | Family Households | Nonfamily Households |
| 1-Person Households | - | 111 (30.7%) |
| 2-Person Households | 68 (18.8%) | 0 (0.0%) |
| 3-Person Households | 19 (5.2%) | 0 (0.0%) |
| 4-Person Households | 86 (23.8%) | 0 (0.0%) |
| 5-Person Households | 27 (7.5%) | 0 (0.0%) |
| 6-Person Households | 51 (14.1%) | 0 (0.0%) |
| 7+ Person Households | 0 (0.0%) | 0 (0.0%) |
| Total | 251 (69.3%) | 111 (30.7%) |
Female Fertility in Mikes
Fertility by Age in Mikes
| Age Bracket | Women with Births | Births / 1,000 Women |
| 15 to 19 years | 0 (0.0%) | 0.0 |
| 20 to 34 years | 0 (0.0%) | 0.0 |
| 35 to 50 years | 0 (0.0%) | 0.0 |
| Total | 0 (0.0%) | 0.0 |
Fertility by Age by Marriage Status in Mikes
| Age Bracket | Married | Unmarried |
| 15 to 19 years | 0 (0.0%) | 0 (0.0%) |
| 20 to 34 years | 0 (0.0%) | 0 (0.0%) |
| 35 to 50 years | 0 (0.0%) | 0 (0.0%) |
| Total | 0 (0.0%) | 0 (0.0%) |
Fertility by Education in Mikes
| Educational Attainment | Women with Births | Births / 1,000 Women |
| Less than High School | 0 (0.0%) | 0.0 |
| High School Diploma | 0 (0.0%) | 0.0 |
| College or Associate's Degree | 0 (0.0%) | 0.0 |
| Bachelor's Degree | 0 (0.0%) | 0.0 |
| Graduate Degree | 0 (0.0%) | 0.0 |
| Total | 0 (0.0%) | 0.0 |
Fertility by Education by Marriage Status in Mikes
| Educational Attainment | Married | Unmarried |
| Less than High School | 0 (0.0%) | 0 (0.0%) |
| High School Diploma | 0 (0.0%) | 0 (0.0%) |
| College or Associate's Degree | 0 (0.0%) | 0 (0.0%) |
| Bachelor's Degree | 0 (0.0%) | 0 (0.0%) |
| Graduate Degree | 0 (0.0%) | 0 (0.0%) |
| Total | 0 (0.0%) | 0 (0.0%) |
Employment Characteristics in Mikes
Employment by Class of Employer in Mikes
Among the 550 employed individuals in Mikes, private company employees (435 | 79.1%), local government employees (85 | 15.4%), and self-employed (not incorporated) (30 | 5.4%) make up the most common classes of employment.
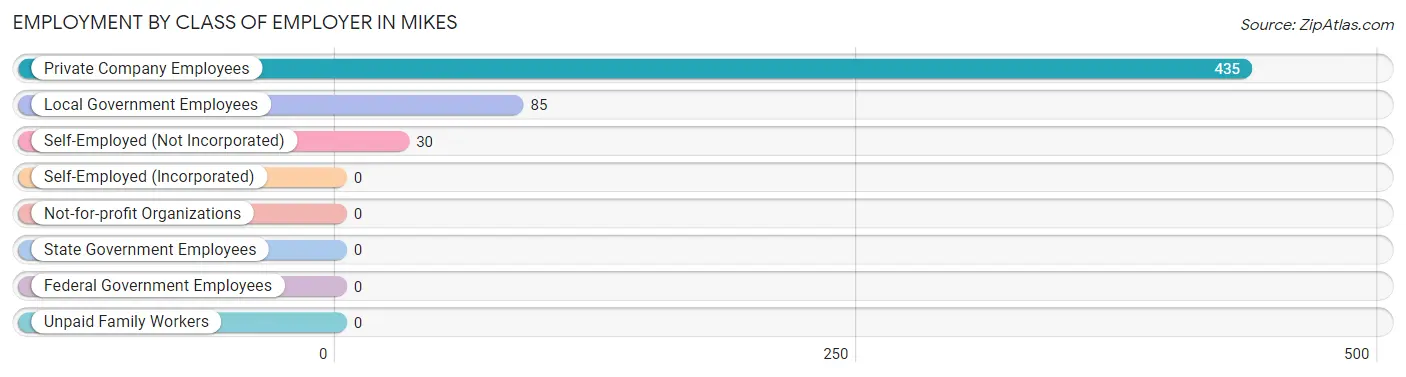
| Employer Class | # Employees | % Employees |
| Private Company Employees | 435 | 79.1% |
| Self-Employed (Incorporated) | 0 | 0.0% |
| Self-Employed (Not Incorporated) | 30 | 5.4% |
| Not-for-profit Organizations | 0 | 0.0% |
| Local Government Employees | 85 | 15.4% |
| State Government Employees | 0 | 0.0% |
| Federal Government Employees | 0 | 0.0% |
| Unpaid Family Workers | 0 | 0.0% |
| Total | 550 | 100.0% |
Employment Status by Age in Mikes
According to the labor force statistics for Mikes, out of the total population over 16 years of age (957), 59.6% or 570 individuals are in the labor force, with 3.5% or 20 of them unemployed. The age group with the highest labor force participation rate is 20 to 24 years, with 100.0% or 30 individuals in the labor force. Within the labor force, the 55 to 59 years age range has the highest percentage of unemployed individuals, with 100.0% or 8 of them being unemployed.
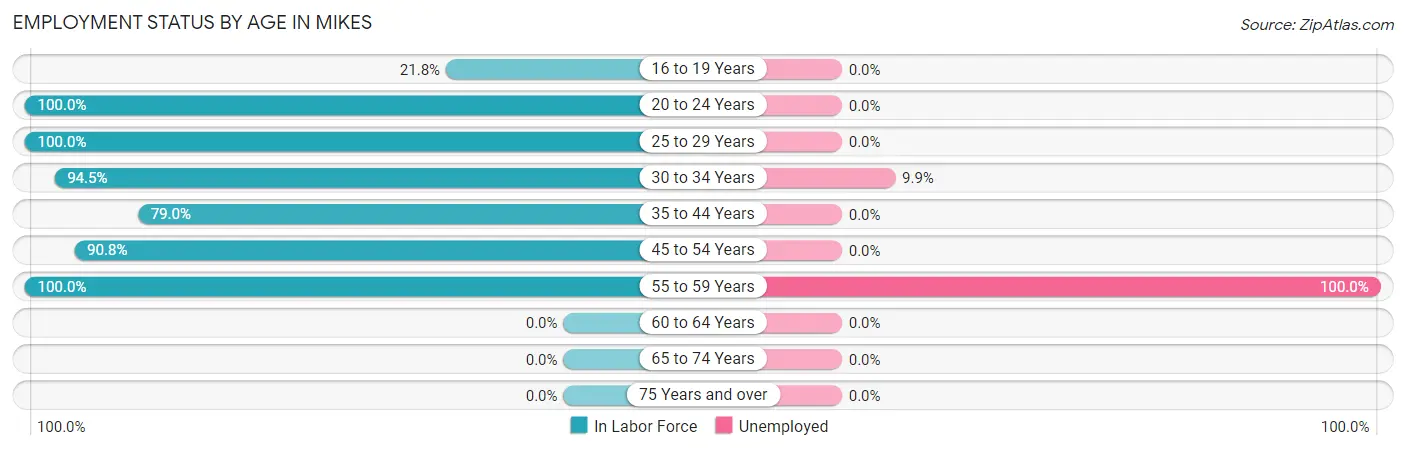
| Age Bracket | In Labor Force | Unemployed |
| 16 to 19 Years | 26 (21.8%) | 0 (0.0%) |
| 20 to 24 Years | 30 (100.0%) | 0 (0.0%) |
| 25 to 29 Years | 107 (100.0%) | 0 (0.0%) |
| 30 to 34 Years | 121 (94.5%) | 12 (9.9%) |
| 35 to 44 Years | 139 (79.0%) | 0 (0.0%) |
| 45 to 54 Years | 139 (90.8%) | 0 (0.0%) |
| 55 to 59 Years | 8 (100.0%) | 8 (100.0%) |
| 60 to 64 Years | 0 (0.0%) | 0 (0.0%) |
| 65 to 74 Years | 0 (0.0%) | 0 (0.0%) |
| 75 Years and over | 0 (0.0%) | 0 (0.0%) |
| Total | 570 (59.6%) | 20 (3.5%) |
Employment Status by Educational Attainment in Mikes
According to labor force statistics for Mikes, 89.9% of individuals (514) out of the total population between 25 and 64 years of age (572) are in the labor force, with 3.9% or 20 of them being unemployed. The group with the highest labor force participation rate are those with the educational attainment of college / associate degree, with 100.0% or 21 individuals in the labor force. Within the labor force, individuals with high school diploma education have the highest percentage of unemployment, with 5.7% or 20 of them being unemployed.
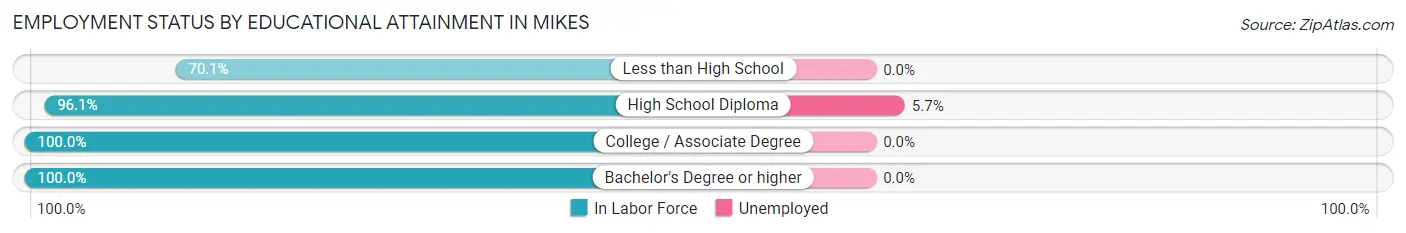
| Educational Attainment | In Labor Force | Unemployed |
| Less than High School | 103 (70.1%) | 0 (0.0%) |
| High School Diploma | 348 (96.1%) | 21 (5.7%) |
| College / Associate Degree | 21 (100.0%) | 0 (0.0%) |
| Bachelor's Degree or higher | 42 (100.0%) | 0 (0.0%) |
| Total | 514 (89.9%) | 22 (3.9%) |
Employment Occupations by Sex in Mikes
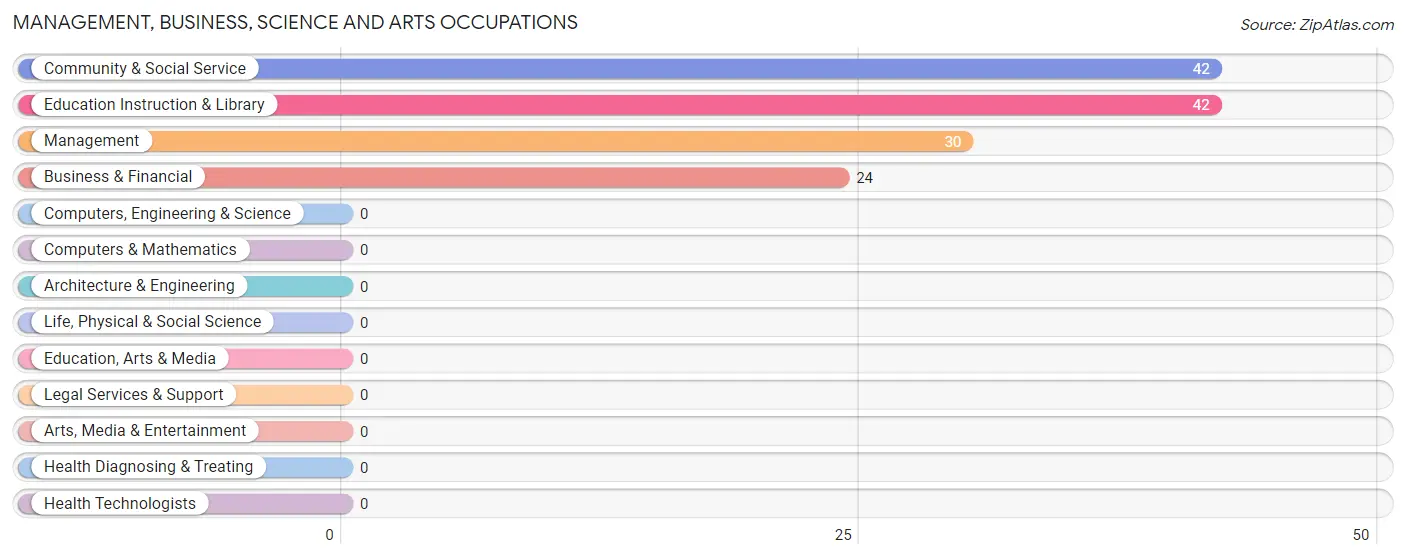
Management, Business, Science and Arts Occupations
The most common Management, Business, Science and Arts occupations in Mikes are Community & Social Service (42 | 7.6%), Education Instruction & Library (42 | 7.6%), Management (30 | 5.4%), and Business & Financial (24 | 4.4%).
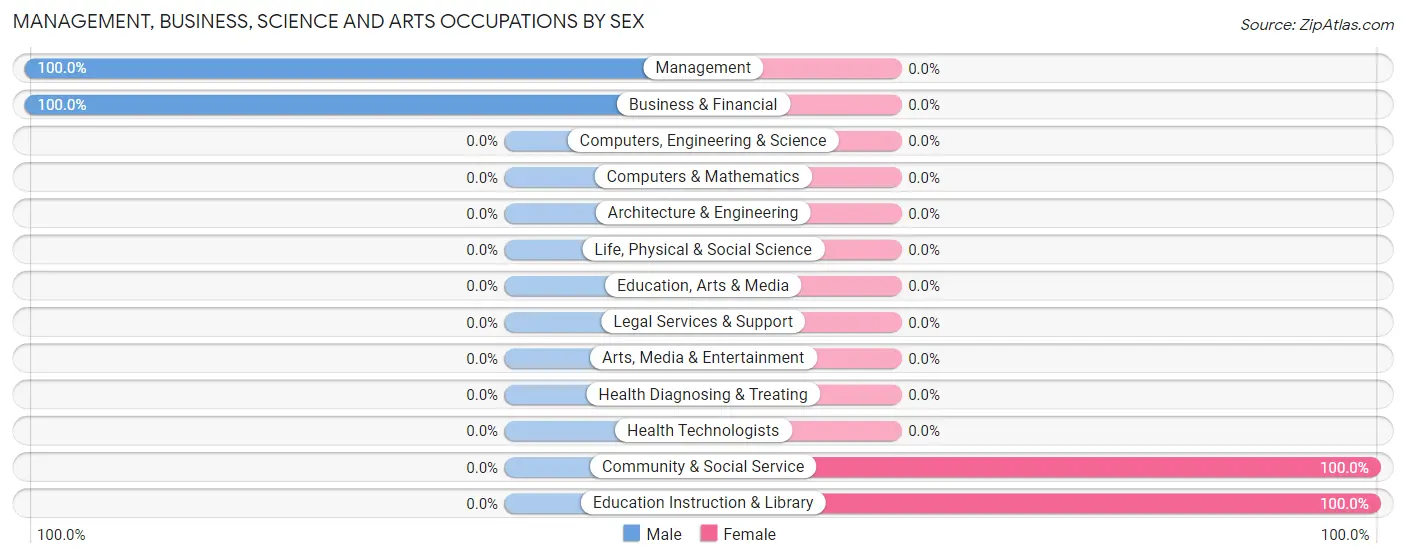
Management, Business, Science and Arts Occupations by Sex
Within the Management, Business, Science and Arts occupations in Mikes, the most male-oriented occupations are Management (100.0%), and Business & Financial (100.0%), while the most female-oriented occupations are Community & Social Service (100.0%), and Education Instruction & Library (100.0%).
| Occupation | Male | Female |
| Management | 30 (100.0%) | 0 (0.0%) |
| Business & Financial | 24 (100.0%) | 0 (0.0%) |
| Computers, Engineering & Science | 0 (0.0%) | 0 (0.0%) |
| Computers & Mathematics | 0 (0.0%) | 0 (0.0%) |
| Architecture & Engineering | 0 (0.0%) | 0 (0.0%) |
| Life, Physical & Social Science | 0 (0.0%) | 0 (0.0%) |
| Community & Social Service | 0 (0.0%) | 42 (100.0%) |
| Education, Arts & Media | 0 (0.0%) | 0 (0.0%) |
| Legal Services & Support | 0 (0.0%) | 0 (0.0%) |
| Education Instruction & Library | 0 (0.0%) | 42 (100.0%) |
| Arts, Media & Entertainment | 0 (0.0%) | 0 (0.0%) |
| Health Diagnosing & Treating | 0 (0.0%) | 0 (0.0%) |
| Health Technologists | 0 (0.0%) | 0 (0.0%) |
| Total (Category) | 54 (56.2%) | 42 (43.8%) |
| Total (Overall) | 430 (78.2%) | 120 (21.8%) |
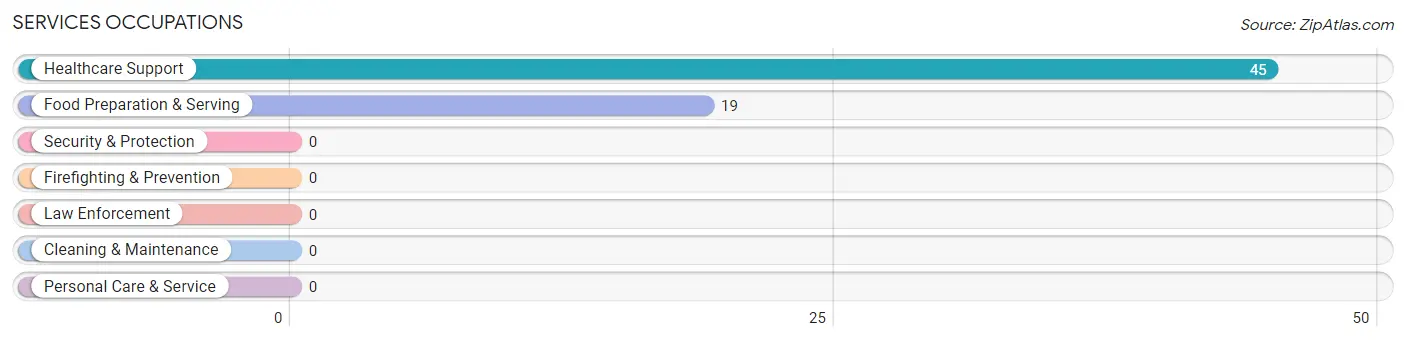
Services Occupations
The most common Services occupations in Mikes are Healthcare Support (45 | 8.2%), and Food Preparation & Serving (19 | 3.5%).
Services Occupations by Sex
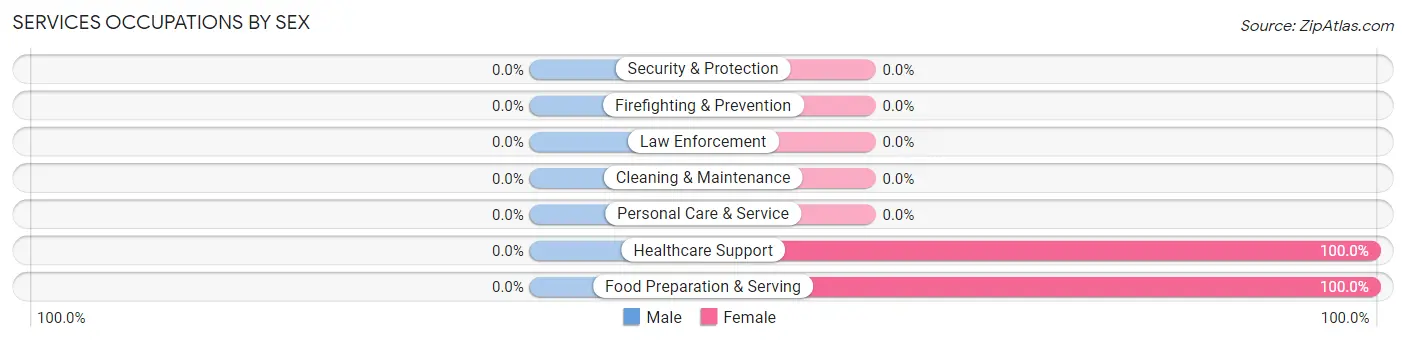
| Occupation | Male | Female |
| Healthcare Support | 0 (0.0%) | 45 (100.0%) |
| Security & Protection | 0 (0.0%) | 0 (0.0%) |
| Firefighting & Prevention | 0 (0.0%) | 0 (0.0%) |
| Law Enforcement | 0 (0.0%) | 0 (0.0%) |
| Food Preparation & Serving | 0 (0.0%) | 19 (100.0%) |
| Cleaning & Maintenance | 0 (0.0%) | 0 (0.0%) |
| Personal Care & Service | 0 (0.0%) | 0 (0.0%) |
| Total (Category) | 0 (0.0%) | 64 (100.0%) |
| Total (Overall) | 430 (78.2%) | 120 (21.8%) |
Sales and Office Occupations
The most common Sales and Office occupations in Mikes are , and Sales & Related (109 | 19.8%).

Sales and Office Occupations by Sex
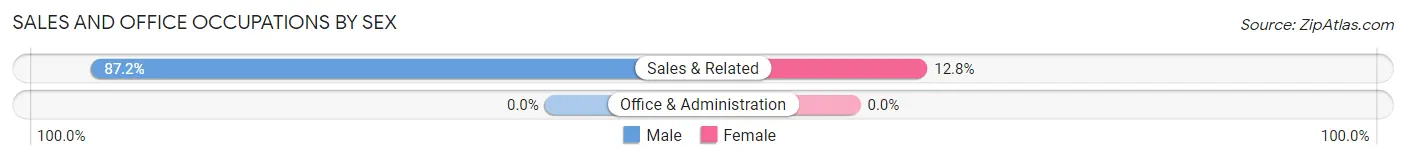
| Occupation | Male | Female |
| Sales & Related | 95 (87.2%) | 14 (12.8%) |
| Office & Administration | 0 (0.0%) | 0 (0.0%) |
| Total (Category) | 95 (87.2%) | 14 (12.8%) |
| Total (Overall) | 430 (78.2%) | 120 (21.8%) |
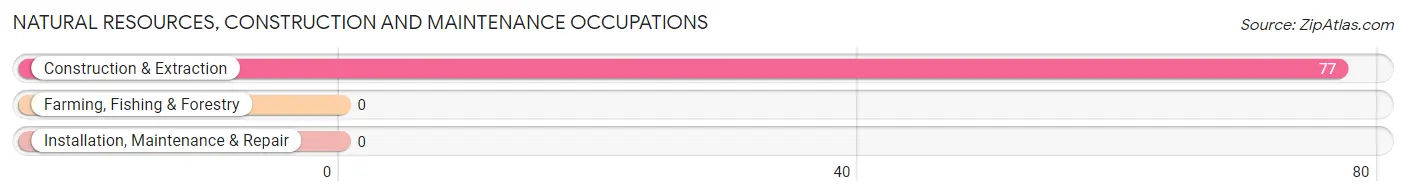
Natural Resources, Construction and Maintenance Occupations
The most common Natural Resources, Construction and Maintenance occupations in Mikes are , and Construction & Extraction (77 | 14.0%).
Natural Resources, Construction and Maintenance Occupations by Sex
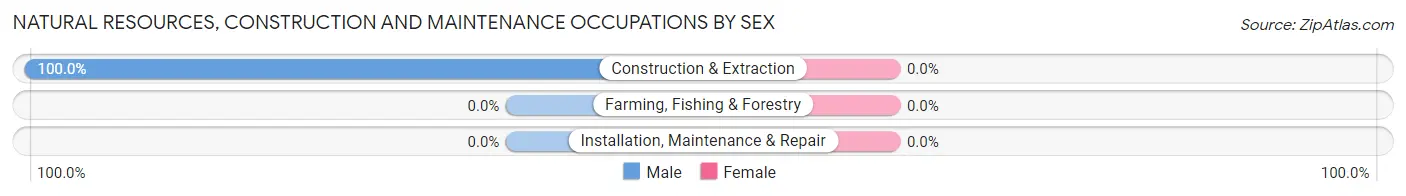
| Occupation | Male | Female |
| Farming, Fishing & Forestry | 0 (0.0%) | 0 (0.0%) |
| Construction & Extraction | 77 (100.0%) | 0 (0.0%) |
| Installation, Maintenance & Repair | 0 (0.0%) | 0 (0.0%) |
| Total (Category) | 77 (100.0%) | 0 (0.0%) |
| Total (Overall) | 430 (78.2%) | 120 (21.8%) |
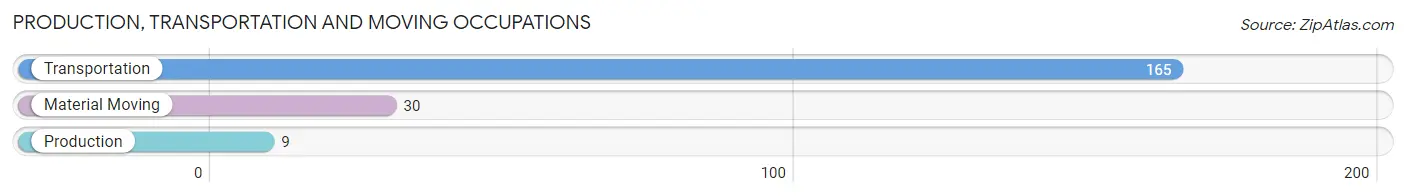
Production, Transportation and Moving Occupations
The most common Production, Transportation and Moving occupations in Mikes are Transportation (165 | 30.0%), Material Moving (30 | 5.4%), and Production (9 | 1.6%).
Production, Transportation and Moving Occupations by Sex
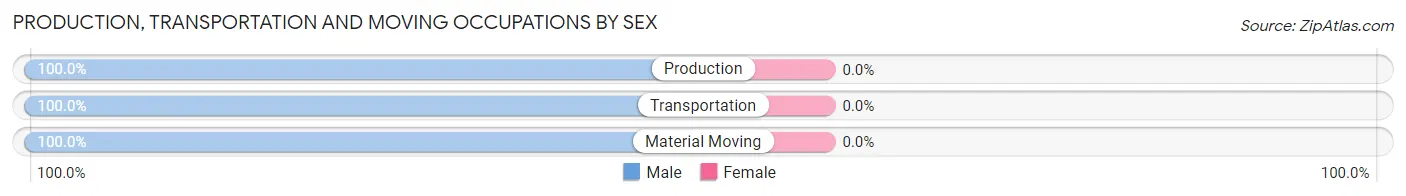
| Occupation | Male | Female |
| Production | 9 (100.0%) | 0 (0.0%) |
| Transportation | 165 (100.0%) | 0 (0.0%) |
| Material Moving | 30 (100.0%) | 0 (0.0%) |
| Total (Category) | 204 (100.0%) | 0 (0.0%) |
| Total (Overall) | 430 (78.2%) | 120 (21.8%) |
Employment Industries by Sex in Mikes
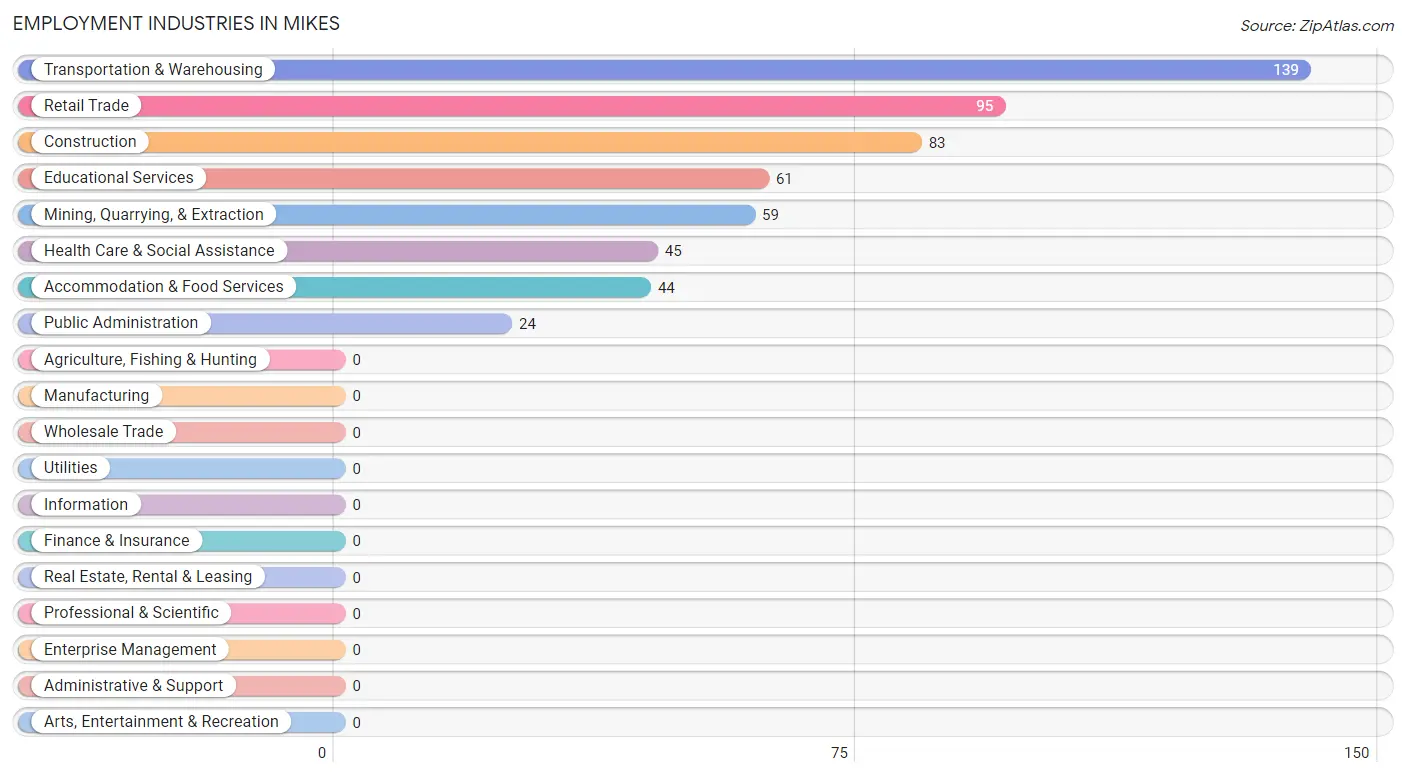
Employment Industries in Mikes
The major employment industries in Mikes include Transportation & Warehousing (139 | 25.3%), Retail Trade (95 | 17.3%), Construction (83 | 15.1%), Educational Services (61 | 11.1%), and Mining, Quarrying, & Extraction (59 | 10.7%).
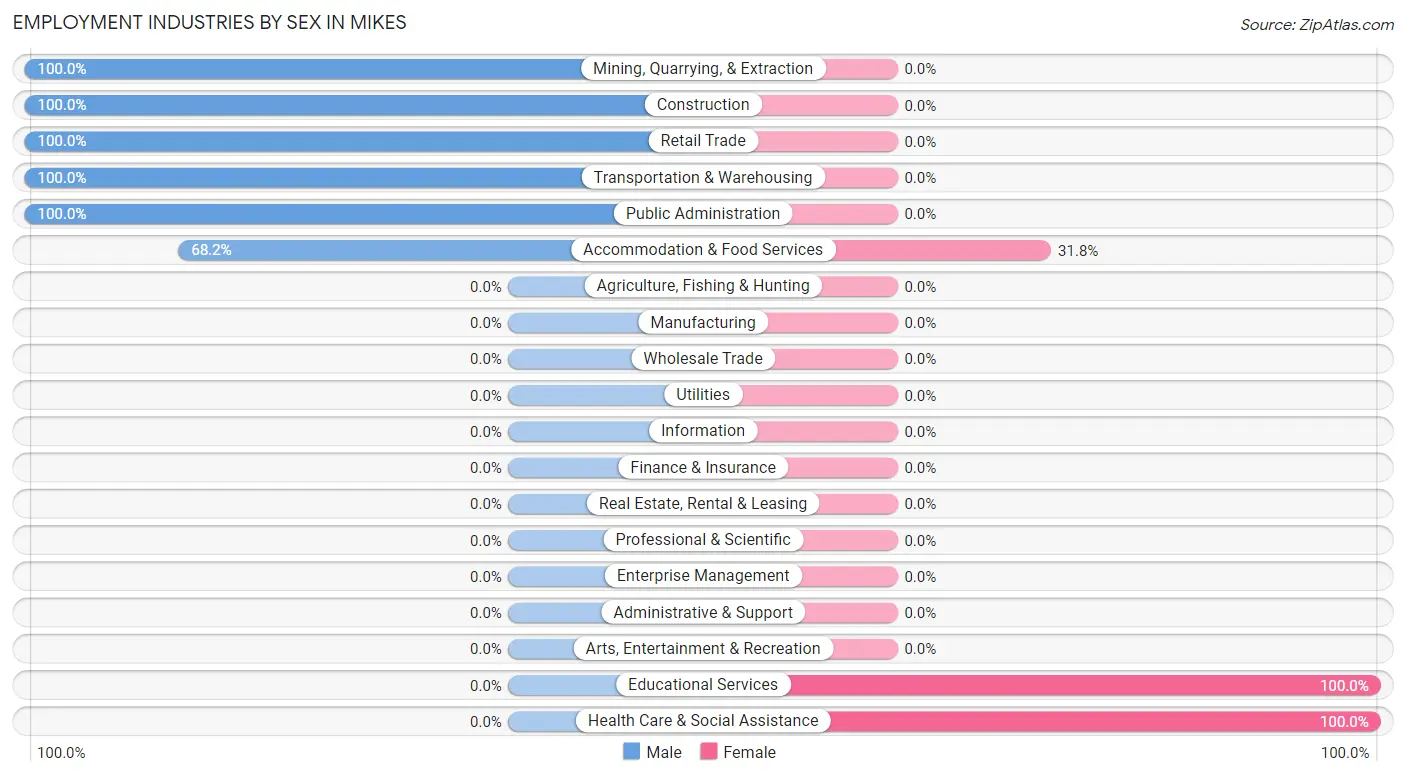
Employment Industries by Sex in Mikes
The Mikes industries that see more men than women are Mining, Quarrying, & Extraction (100.0%), Construction (100.0%), and Retail Trade (100.0%), whereas the industries that tend to have a higher number of women are Educational Services (100.0%), Health Care & Social Assistance (100.0%), and Accommodation & Food Services (31.8%).
| Industry | Male | Female |
| Agriculture, Fishing & Hunting | 0 (0.0%) | 0 (0.0%) |
| Mining, Quarrying, & Extraction | 59 (100.0%) | 0 (0.0%) |
| Construction | 83 (100.0%) | 0 (0.0%) |
| Manufacturing | 0 (0.0%) | 0 (0.0%) |
| Wholesale Trade | 0 (0.0%) | 0 (0.0%) |
| Retail Trade | 95 (100.0%) | 0 (0.0%) |
| Transportation & Warehousing | 139 (100.0%) | 0 (0.0%) |
| Utilities | 0 (0.0%) | 0 (0.0%) |
| Information | 0 (0.0%) | 0 (0.0%) |
| Finance & Insurance | 0 (0.0%) | 0 (0.0%) |
| Real Estate, Rental & Leasing | 0 (0.0%) | 0 (0.0%) |
| Professional & Scientific | 0 (0.0%) | 0 (0.0%) |
| Enterprise Management | 0 (0.0%) | 0 (0.0%) |
| Administrative & Support | 0 (0.0%) | 0 (0.0%) |
| Educational Services | 0 (0.0%) | 61 (100.0%) |
| Health Care & Social Assistance | 0 (0.0%) | 45 (100.0%) |
| Arts, Entertainment & Recreation | 0 (0.0%) | 0 (0.0%) |
| Accommodation & Food Services | 30 (68.2%) | 14 (31.8%) |
| Public Administration | 24 (100.0%) | 0 (0.0%) |
| Total | 430 (78.2%) | 120 (21.8%) |
Education in Mikes
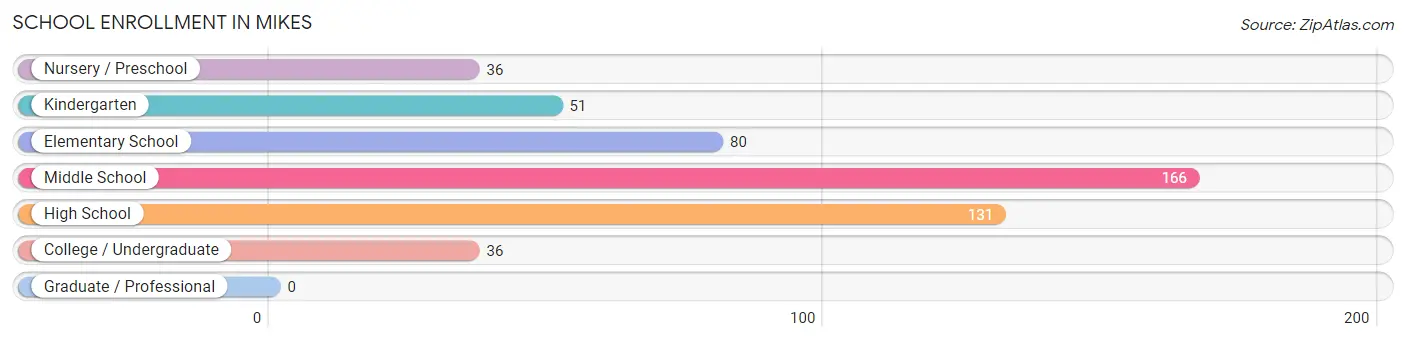
School Enrollment in Mikes
The most common levels of schooling among the 500 students in Mikes are middle school (166 | 33.2%), high school (131 | 26.2%), and elementary school (80 | 16.0%).
| School Level | # Students | % Students |
| Nursery / Preschool | 36 | 7.2% |
| Kindergarten | 51 | 10.2% |
| Elementary School | 80 | 16.0% |
| Middle School | 166 | 33.2% |
| High School | 131 | 26.2% |
| College / Undergraduate | 36 | 7.2% |
| Graduate / Professional | 0 | 0.0% |
| Total | 500 | 100.0% |
School Enrollment by Age by Funding Source in Mikes
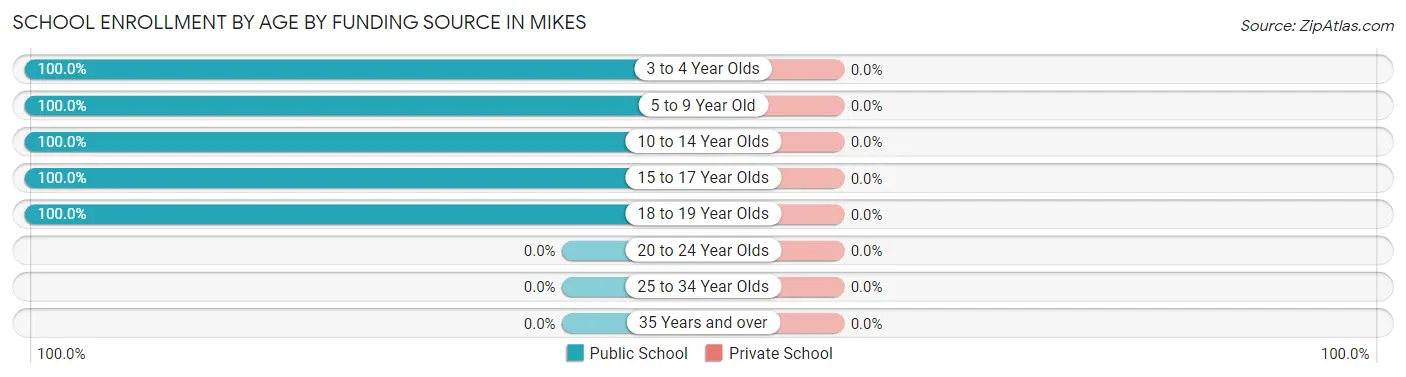
| Age Bracket | Public School | Private School |
| 3 to 4 Year Olds | 36 (100.0%) | 0 (0.0%) |
| 5 to 9 Year Old | 92 (100.0%) | 0 (0.0%) |
| 10 to 14 Year Olds | 220 (100.0%) | 0 (0.0%) |
| 15 to 17 Year Olds | 116 (100.0%) | 0 (0.0%) |
| 18 to 19 Year Olds | 36 (100.0%) | 0 (0.0%) |
| 20 to 24 Year Olds | 0 (0.0%) | 0 (0.0%) |
| 25 to 34 Year Olds | 0 (0.0%) | 0 (0.0%) |
| 35 Years and over | 0 (0.0%) | 0 (0.0%) |
| Total | 500 (100.0%) | 0 (0.0%) |
Educational Attainment by Field of Study in Mikes
, and multidisciplinary studies (42 | 100.0%) are the most common fields of study among 42 individuals in Mikes who have obtained a bachelor's degree or higher.
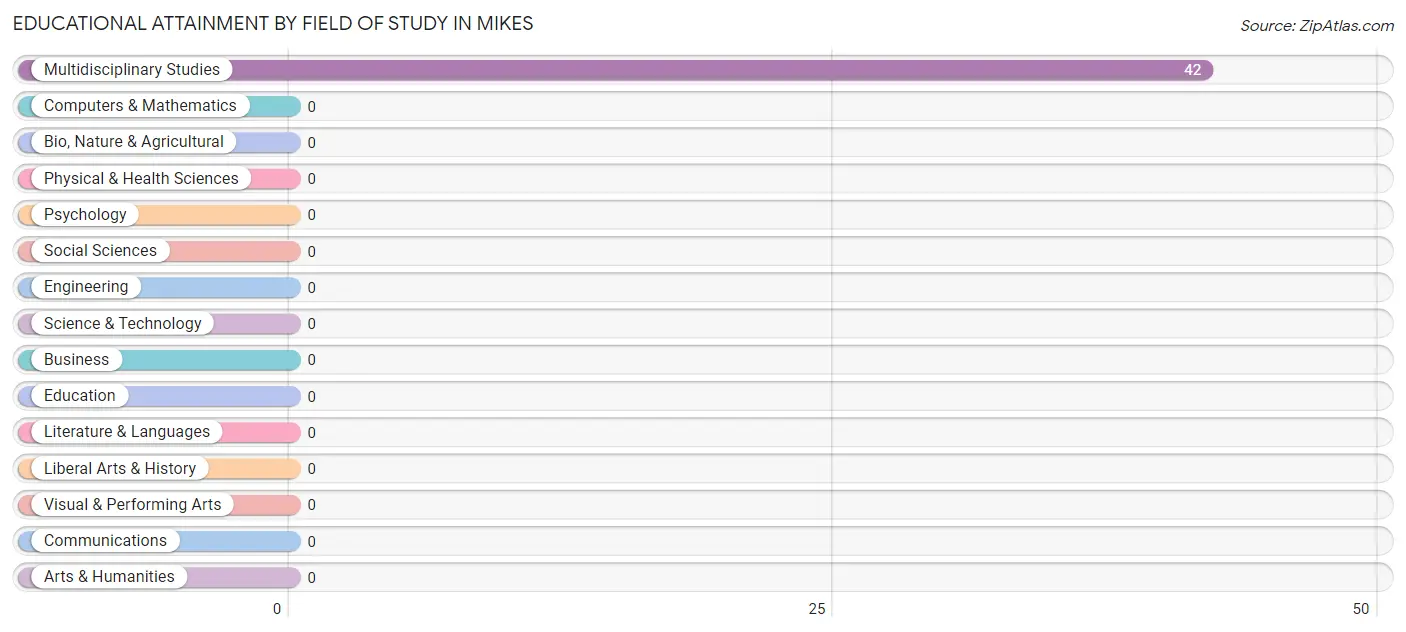
| Field of Study | # Graduates | % Graduates |
| Computers & Mathematics | 0 | 0.0% |
| Bio, Nature & Agricultural | 0 | 0.0% |
| Physical & Health Sciences | 0 | 0.0% |
| Psychology | 0 | 0.0% |
| Social Sciences | 0 | 0.0% |
| Engineering | 0 | 0.0% |
| Multidisciplinary Studies | 42 | 100.0% |
| Science & Technology | 0 | 0.0% |
| Business | 0 | 0.0% |
| Education | 0 | 0.0% |
| Literature & Languages | 0 | 0.0% |
| Liberal Arts & History | 0 | 0.0% |
| Visual & Performing Arts | 0 | 0.0% |
| Communications | 0 | 0.0% |
| Arts & Humanities | 0 | 0.0% |
| Total | 42 | 100.0% |
Transportation & Commute in Mikes
Vehicle Availability by Sex in Mikes
The most prevalent vehicle ownership categories in Mikes are males with 3 vehicles (235, accounting for 54.6%) and females with 3 vehicles (61, making up 195.8%).
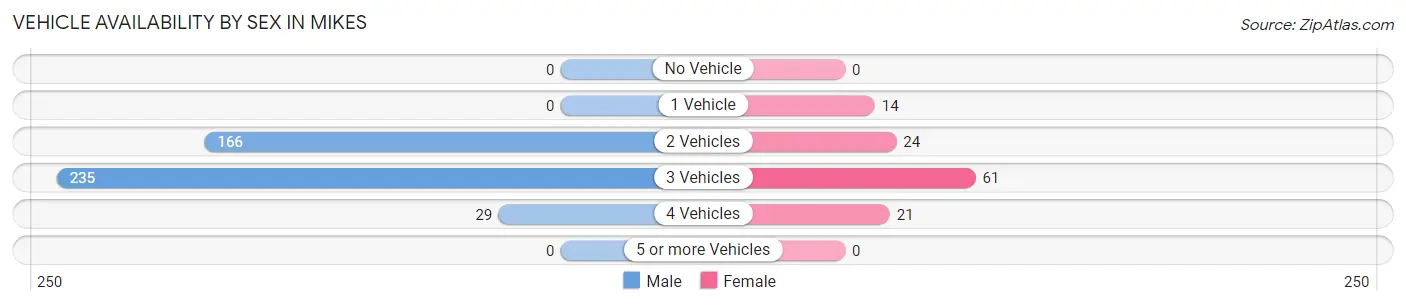
| Vehicles Available | Male | Female |
| No Vehicle | 0 (0.0%) | 0 (0.0%) |
| 1 Vehicle | 0 (0.0%) | 14 (11.7%) |
| 2 Vehicles | 166 (38.6%) | 24 (20.0%) |
| 3 Vehicles | 235 (54.6%) | 61 (50.8%) |
| 4 Vehicles | 29 (6.7%) | 21 (17.5%) |
| 5 or more Vehicles | 0 (0.0%) | 0 (0.0%) |
| Total | 430 (100.0%) | 120 (100.0%) |
Commute Time in Mikes
The most frequently occuring commute durations in Mikes are 15 to 19 minutes (174 commuters, 31.6%), 30 to 34 minutes (160 commuters, 29.1%), and 20 to 24 minutes (116 commuters, 21.1%).
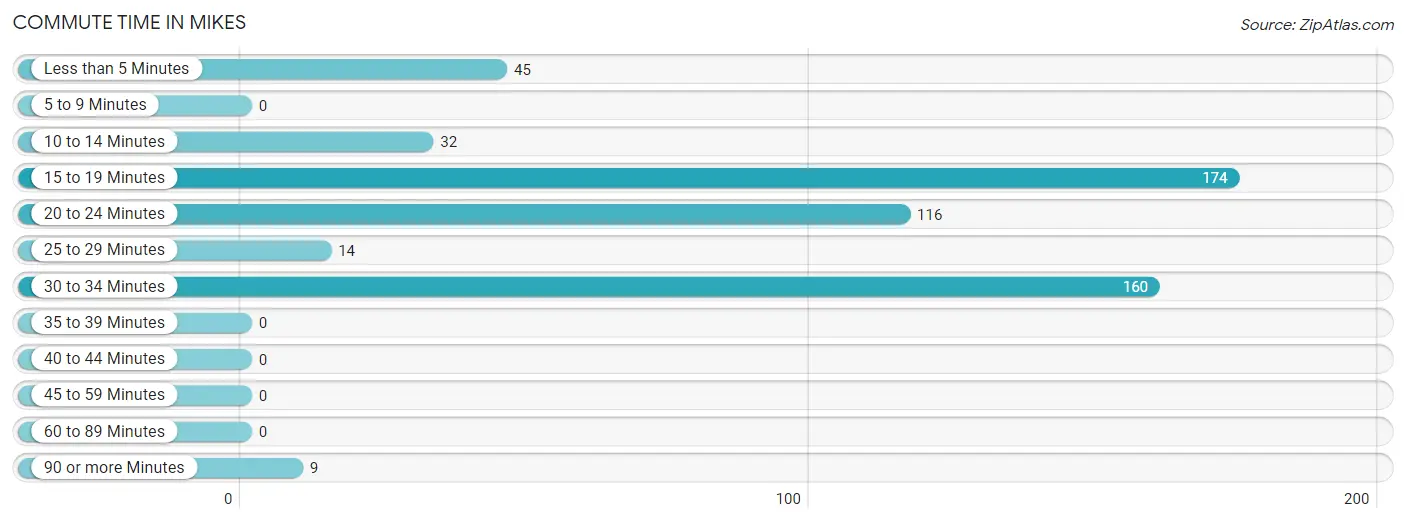
| Commute Time | # Commuters | % Commuters |
| Less than 5 Minutes | 45 | 8.2% |
| 5 to 9 Minutes | 0 | 0.0% |
| 10 to 14 Minutes | 32 | 5.8% |
| 15 to 19 Minutes | 174 | 31.6% |
| 20 to 24 Minutes | 116 | 21.1% |
| 25 to 29 Minutes | 14 | 2.5% |
| 30 to 34 Minutes | 160 | 29.1% |
| 35 to 39 Minutes | 0 | 0.0% |
| 40 to 44 Minutes | 0 | 0.0% |
| 45 to 59 Minutes | 0 | 0.0% |
| 60 to 89 Minutes | 0 | 0.0% |
| 90 or more Minutes | 9 | 1.6% |
Commute Time by Sex in Mikes
The most common commute times in Mikes are 30 to 34 minutes (160 commuters, 37.2%) for males and 15 to 19 minutes (66 commuters, 55.0%) for females.
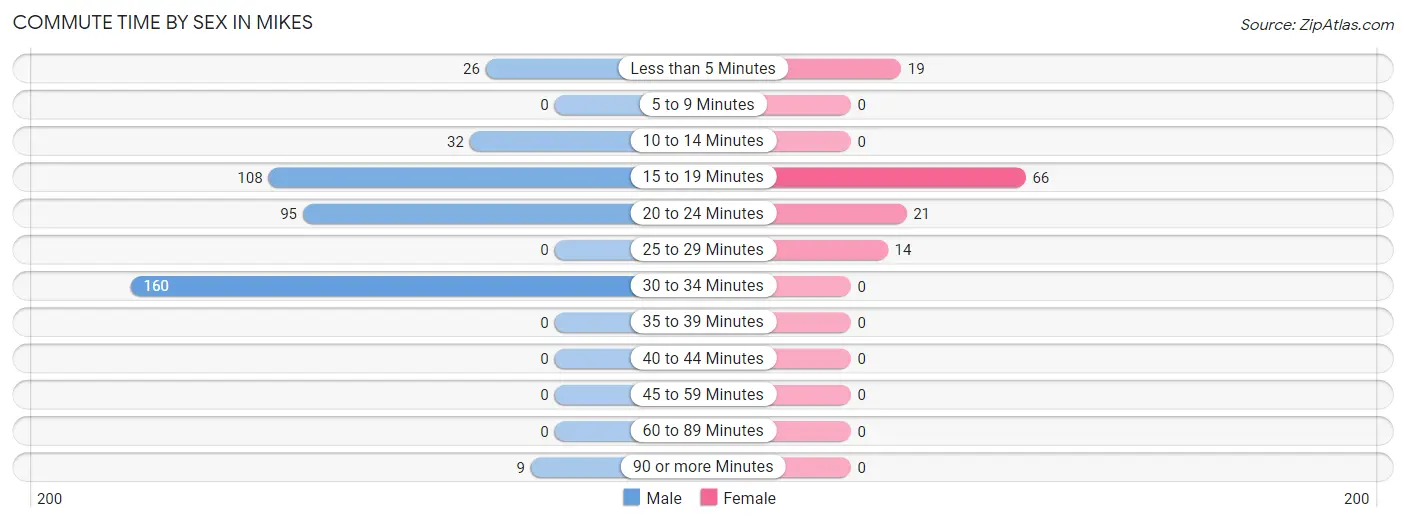
| Commute Time | Male | Female |
| Less than 5 Minutes | 26 (6.0%) | 19 (15.8%) |
| 5 to 9 Minutes | 0 (0.0%) | 0 (0.0%) |
| 10 to 14 Minutes | 32 (7.4%) | 0 (0.0%) |
| 15 to 19 Minutes | 108 (25.1%) | 66 (55.0%) |
| 20 to 24 Minutes | 95 (22.1%) | 21 (17.5%) |
| 25 to 29 Minutes | 0 (0.0%) | 14 (11.7%) |
| 30 to 34 Minutes | 160 (37.2%) | 0 (0.0%) |
| 35 to 39 Minutes | 0 (0.0%) | 0 (0.0%) |
| 40 to 44 Minutes | 0 (0.0%) | 0 (0.0%) |
| 45 to 59 Minutes | 0 (0.0%) | 0 (0.0%) |
| 60 to 89 Minutes | 0 (0.0%) | 0 (0.0%) |
| 90 or more Minutes | 9 (2.1%) | 0 (0.0%) |
Time of Departure to Work by Sex in Mikes
The most frequent times of departure to work in Mikes are 7:00 AM to 7:29 AM (161, 37.4%) for males and 7:00 AM to 7:29 AM (61, 50.8%) for females.
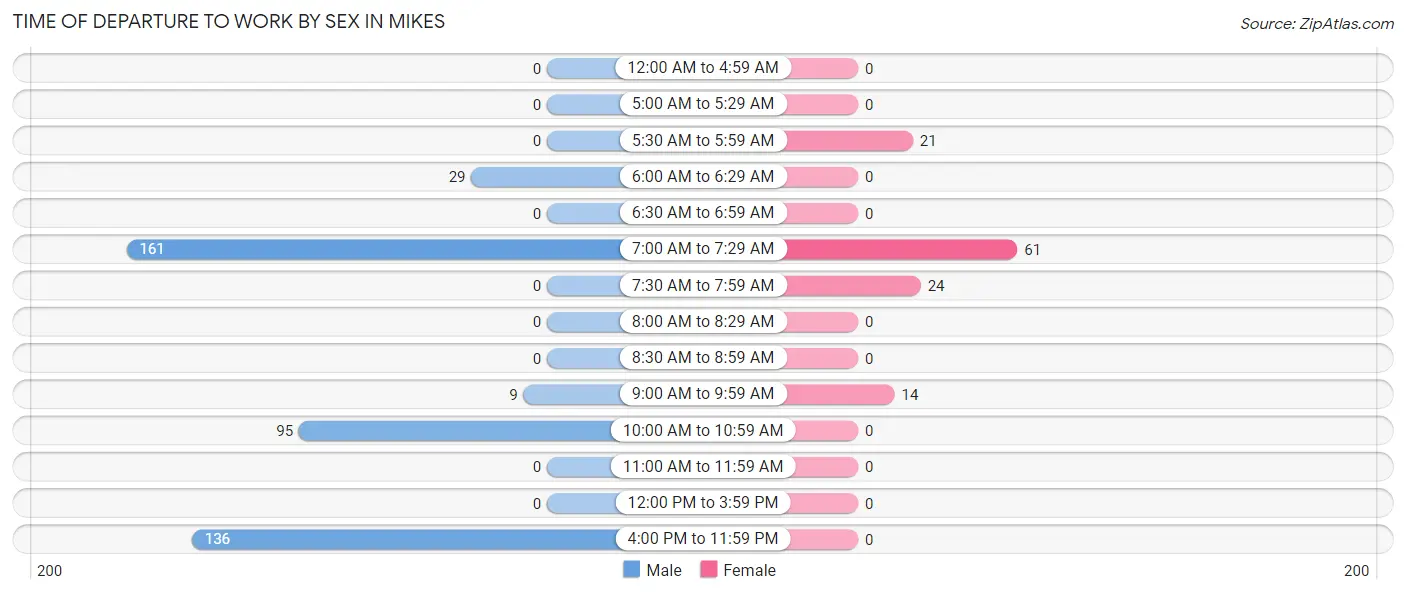
| Time of Departure | Male | Female |
| 12:00 AM to 4:59 AM | 0 (0.0%) | 0 (0.0%) |
| 5:00 AM to 5:29 AM | 0 (0.0%) | 0 (0.0%) |
| 5:30 AM to 5:59 AM | 0 (0.0%) | 21 (17.5%) |
| 6:00 AM to 6:29 AM | 29 (6.7%) | 0 (0.0%) |
| 6:30 AM to 6:59 AM | 0 (0.0%) | 0 (0.0%) |
| 7:00 AM to 7:29 AM | 161 (37.4%) | 61 (50.8%) |
| 7:30 AM to 7:59 AM | 0 (0.0%) | 24 (20.0%) |
| 8:00 AM to 8:29 AM | 0 (0.0%) | 0 (0.0%) |
| 8:30 AM to 8:59 AM | 0 (0.0%) | 0 (0.0%) |
| 9:00 AM to 9:59 AM | 9 (2.1%) | 14 (11.7%) |
| 10:00 AM to 10:59 AM | 95 (22.1%) | 0 (0.0%) |
| 11:00 AM to 11:59 AM | 0 (0.0%) | 0 (0.0%) |
| 12:00 PM to 3:59 PM | 0 (0.0%) | 0 (0.0%) |
| 4:00 PM to 11:59 PM | 136 (31.6%) | 0 (0.0%) |
| Total | 430 (100.0%) | 120 (100.0%) |
Housing Occupancy in Mikes
Occupancy by Ownership in Mikes
Of the total 362 dwellings in Mikes, owner-occupied units account for 302 (83.4%), while renter-occupied units make up 60 (16.6%).
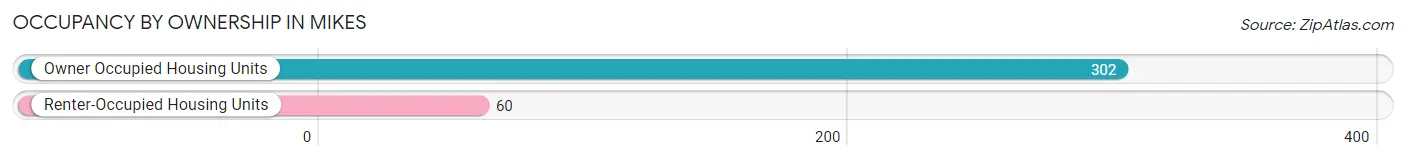
| Occupancy | # Housing Units | % Housing Units |
| Owner Occupied Housing Units | 302 | 83.4% |
| Renter-Occupied Housing Units | 60 | 16.6% |
| Total Occupied Housing Units | 362 | 100.0% |
Occupancy by Household Size in Mikes
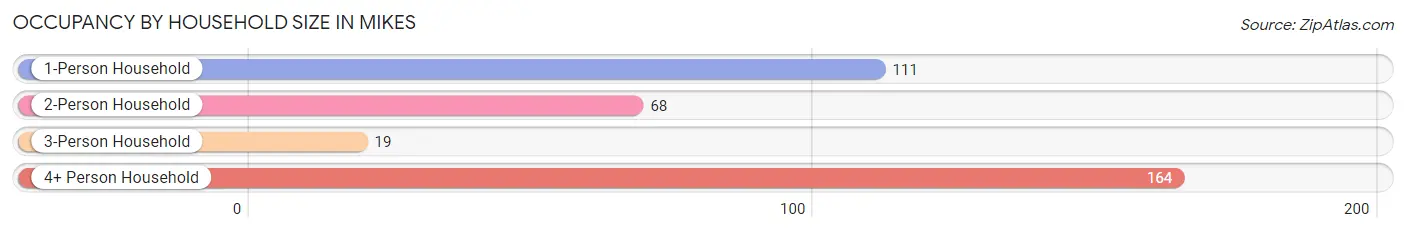
| Household Size | # Housing Units | % Housing Units |
| 1-Person Household | 111 | 30.7% |
| 2-Person Household | 68 | 18.8% |
| 3-Person Household | 19 | 5.2% |
| 4+ Person Household | 164 | 45.3% |
| Total Housing Units | 362 | 100.0% |
Occupancy by Ownership by Household Size in Mikes
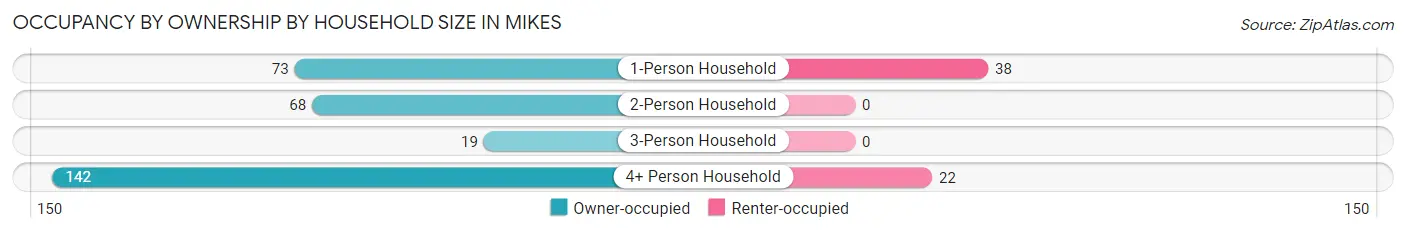
| Household Size | Owner-occupied | Renter-occupied |
| 1-Person Household | 73 (65.8%) | 38 (34.2%) |
| 2-Person Household | 68 (100.0%) | 0 (0.0%) |
| 3-Person Household | 19 (100.0%) | 0 (0.0%) |
| 4+ Person Household | 142 (86.6%) | 22 (13.4%) |
| Total Housing Units | 302 (83.4%) | 60 (16.6%) |
Occupancy by Educational Attainment in Mikes
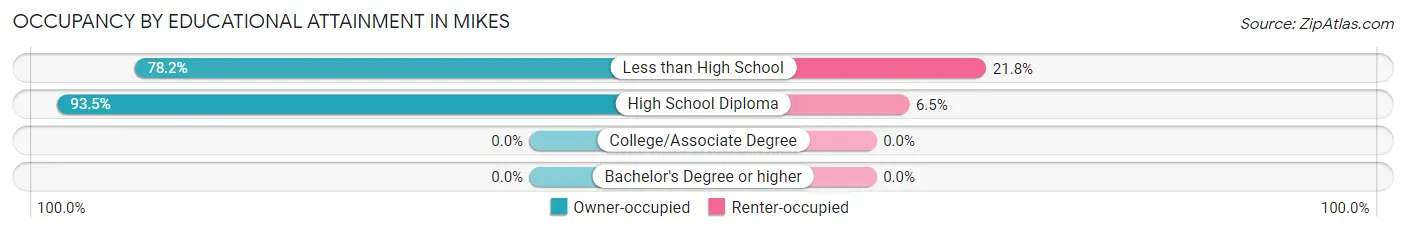
| Household Size | Owner-occupied | Renter-occupied |
| Less than High School | 187 (78.2%) | 52 (21.8%) |
| High School Diploma | 115 (93.5%) | 8 (6.5%) |
| College/Associate Degree | 0 (0.0%) | 0 (0.0%) |
| Bachelor's Degree or higher | 0 (0.0%) | 0 (0.0%) |
Occupancy by Age of Householder in Mikes
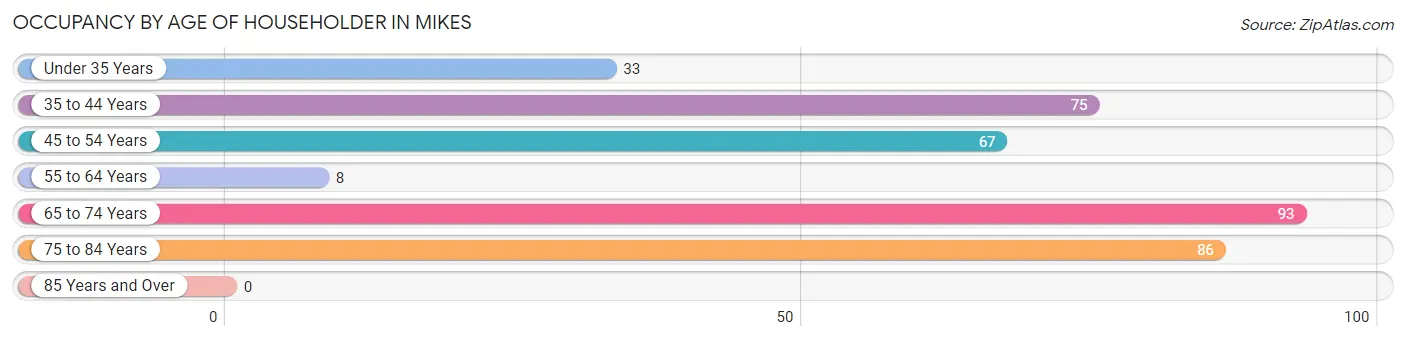
| Age Bracket | # Households | % Households |
| Under 35 Years | 33 | 9.1% |
| 35 to 44 Years | 75 | 20.7% |
| 45 to 54 Years | 67 | 18.5% |
| 55 to 64 Years | 8 | 2.2% |
| 65 to 74 Years | 93 | 25.7% |
| 75 to 84 Years | 86 | 23.8% |
| 85 Years and Over | 0 | 0.0% |
| Total | 362 | 100.0% |
Housing Finances in Mikes
Median Income by Occupancy in Mikes
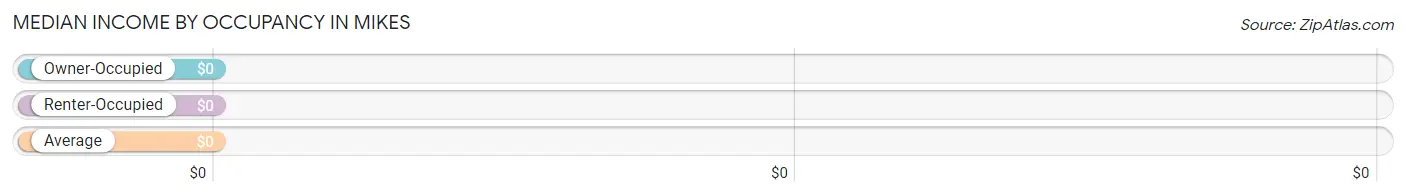
| Occupancy Type | # Households | Median Income |
| Owner-Occupied | 302 (83.4%) | $0 |
| Renter-Occupied | 60 (16.6%) | $0 |
| Average | 362 (100.0%) | $0 |
Occupancy by Householder Income Bracket in Mikes
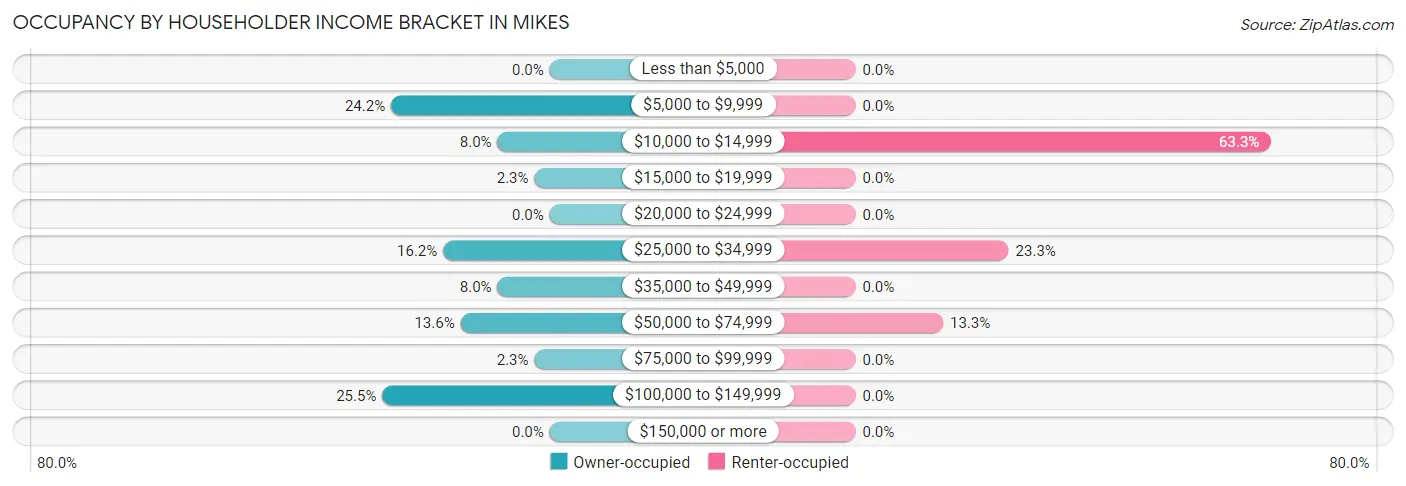
| Income Bracket | Owner-occupied | Renter-occupied |
| Less than $5,000 | 0 (0.0%) | 0 (0.0%) |
| $5,000 to $9,999 | 73 (24.2%) | 0 (0.0%) |
| $10,000 to $14,999 | 24 (8.0%) | 38 (63.3%) |
| $15,000 to $19,999 | 7 (2.3%) | 0 (0.0%) |
| $20,000 to $24,999 | 0 (0.0%) | 0 (0.0%) |
| $25,000 to $34,999 | 49 (16.2%) | 14 (23.3%) |
| $35,000 to $49,999 | 24 (8.0%) | 0 (0.0%) |
| $50,000 to $74,999 | 41 (13.6%) | 8 (13.3%) |
| $75,000 to $99,999 | 7 (2.3%) | 0 (0.0%) |
| $100,000 to $149,999 | 77 (25.5%) | 0 (0.0%) |
| $150,000 or more | 0 (0.0%) | 0 (0.0%) |
| Total | 302 (100.0%) | 60 (100.0%) |
Monthly Housing Cost Tiers in Mikes
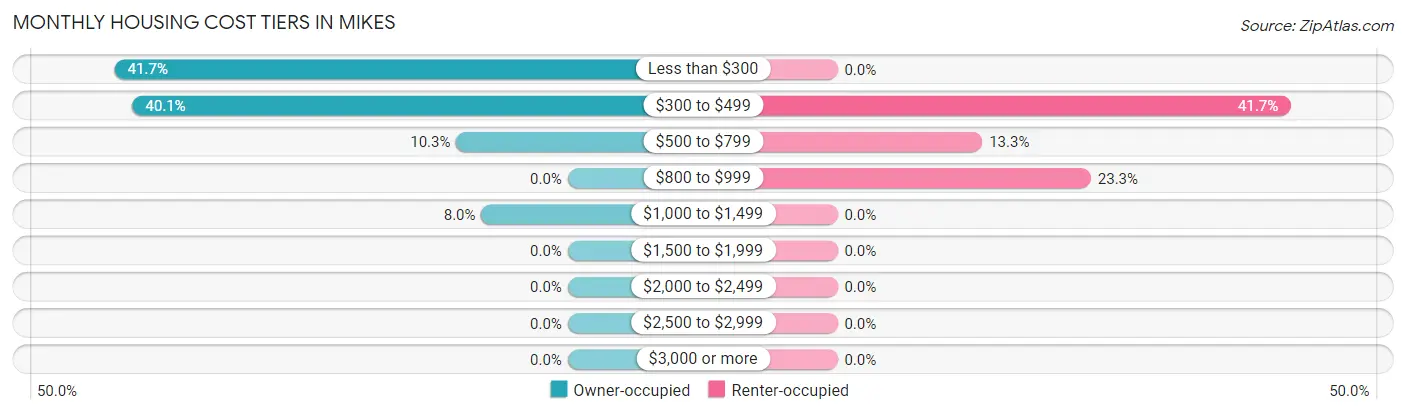
| Monthly Cost | Owner-occupied | Renter-occupied |
| Less than $300 | 126 (41.7%) | 0 (0.0%) |
| $300 to $499 | 121 (40.1%) | 25 (41.7%) |
| $500 to $799 | 31 (10.3%) | 8 (13.3%) |
| $800 to $999 | 0 (0.0%) | 14 (23.3%) |
| $1,000 to $1,499 | 24 (8.0%) | 0 (0.0%) |
| $1,500 to $1,999 | 0 (0.0%) | 0 (0.0%) |
| $2,000 to $2,499 | 0 (0.0%) | 0 (0.0%) |
| $2,500 to $2,999 | 0 (0.0%) | 0 (0.0%) |
| $3,000 or more | 0 (0.0%) | 0 (0.0%) |
| Total | 302 (100.0%) | 60 (100.0%) |
Physical Housing Characteristics in Mikes
Housing Structures in Mikes
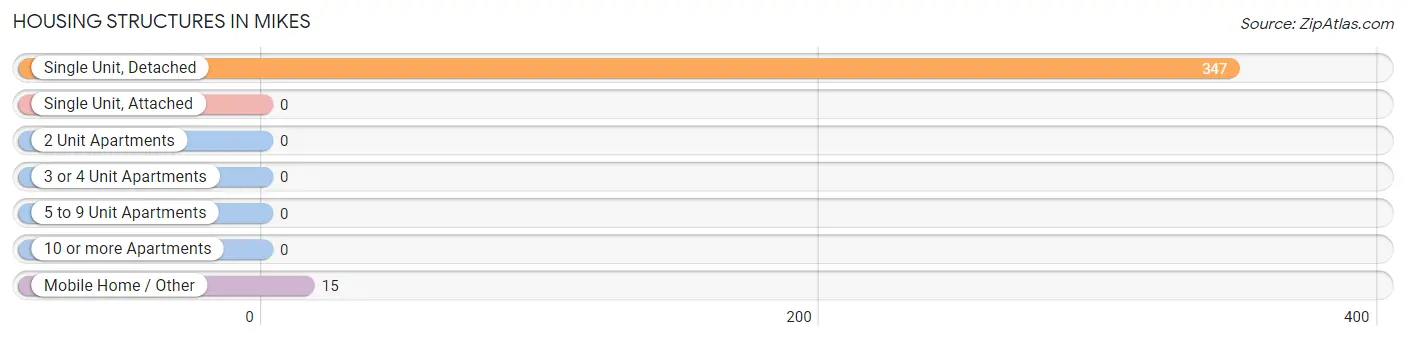
| Structure Type | # Housing Units | % Housing Units |
| Single Unit, Detached | 347 | 95.9% |
| Single Unit, Attached | 0 | 0.0% |
| 2 Unit Apartments | 0 | 0.0% |
| 3 or 4 Unit Apartments | 0 | 0.0% |
| 5 to 9 Unit Apartments | 0 | 0.0% |
| 10 or more Apartments | 0 | 0.0% |
| Mobile Home / Other | 15 | 4.1% |
| Total | 362 | 100.0% |
Housing Structures by Occupancy in Mikes
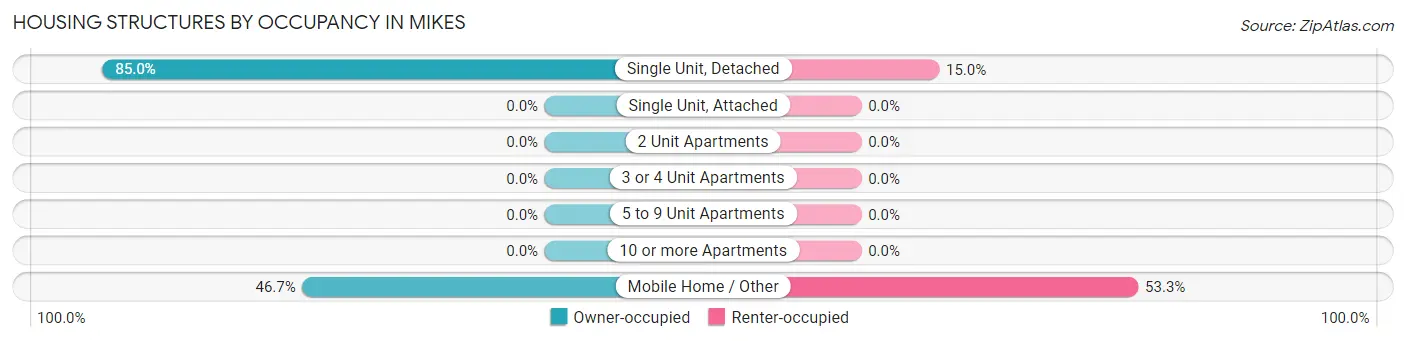
| Structure Type | Owner-occupied | Renter-occupied |
| Single Unit, Detached | 295 (85.0%) | 52 (15.0%) |
| Single Unit, Attached | 0 (0.0%) | 0 (0.0%) |
| 2 Unit Apartments | 0 (0.0%) | 0 (0.0%) |
| 3 or 4 Unit Apartments | 0 (0.0%) | 0 (0.0%) |
| 5 to 9 Unit Apartments | 0 (0.0%) | 0 (0.0%) |
| 10 or more Apartments | 0 (0.0%) | 0 (0.0%) |
| Mobile Home / Other | 7 (46.7%) | 8 (53.3%) |
| Total | 302 (83.4%) | 60 (16.6%) |
Housing Structures by Number of Rooms in Mikes
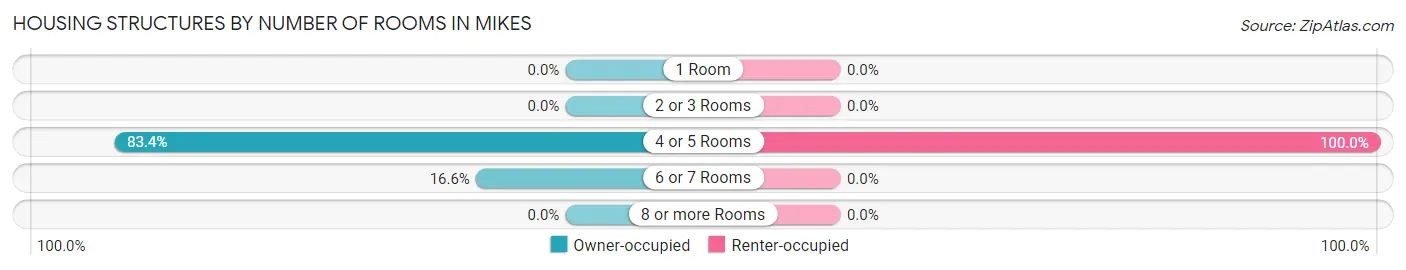
| Number of Rooms | Owner-occupied | Renter-occupied |
| 1 Room | 0 (0.0%) | 0 (0.0%) |
| 2 or 3 Rooms | 0 (0.0%) | 0 (0.0%) |
| 4 or 5 Rooms | 252 (83.4%) | 60 (100.0%) |
| 6 or 7 Rooms | 50 (16.6%) | 0 (0.0%) |
| 8 or more Rooms | 0 (0.0%) | 0 (0.0%) |
| Total | 302 (100.0%) | 60 (100.0%) |
Housing Structure by Heating Type in Mikes
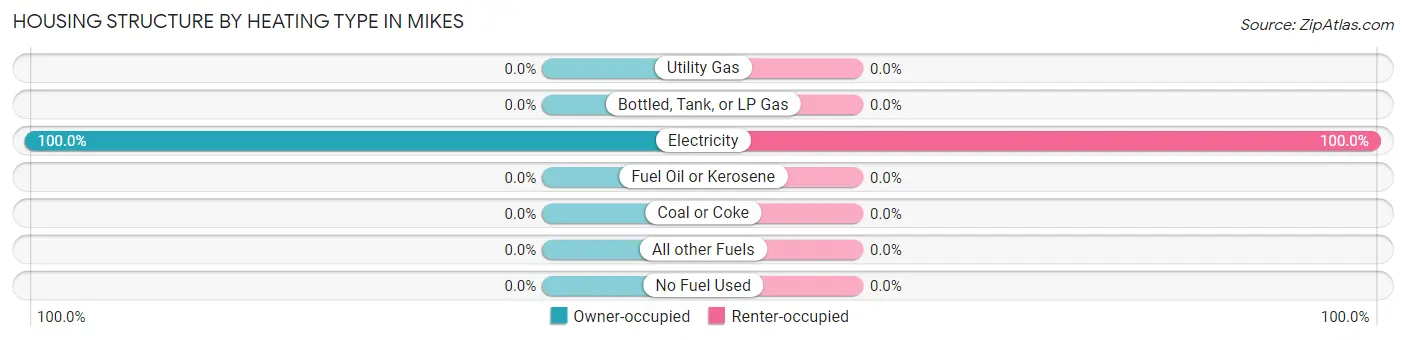
| Heating Type | Owner-occupied | Renter-occupied |
| Utility Gas | 0 (0.0%) | 0 (0.0%) |
| Bottled, Tank, or LP Gas | 0 (0.0%) | 0 (0.0%) |
| Electricity | 302 (100.0%) | 60 (100.0%) |
| Fuel Oil or Kerosene | 0 (0.0%) | 0 (0.0%) |
| Coal or Coke | 0 (0.0%) | 0 (0.0%) |
| All other Fuels | 0 (0.0%) | 0 (0.0%) |
| No Fuel Used | 0 (0.0%) | 0 (0.0%) |
| Total | 302 (100.0%) | 60 (100.0%) |
Household Vehicle Usage in Mikes
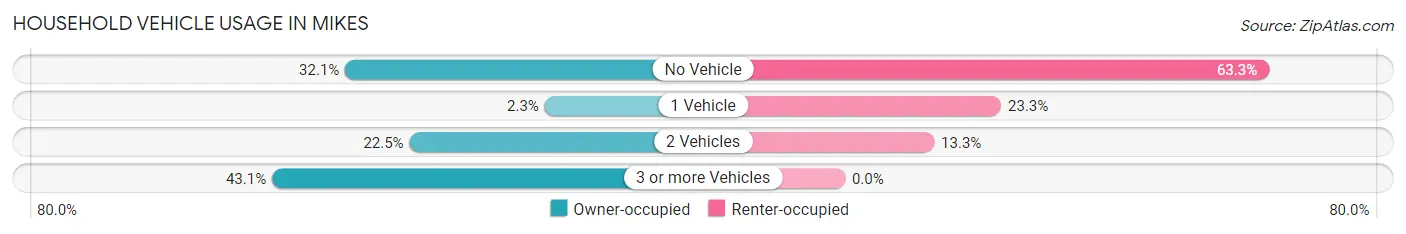
| Vehicles per Household | Owner-occupied | Renter-occupied |
| No Vehicle | 97 (32.1%) | 38 (63.3%) |
| 1 Vehicle | 7 (2.3%) | 14 (23.3%) |
| 2 Vehicles | 68 (22.5%) | 8 (13.3%) |
| 3 or more Vehicles | 130 (43.0%) | 0 (0.0%) |
| Total | 302 (100.0%) | 60 (100.0%) |
Real Estate & Mortgages in Mikes
Real Estate and Mortgage Overview in Mikes
| Characteristic | Without Mortgage | With Mortgage |
| Housing Units | 278 | 24 |
| Median Property Value | $109,200 | $0 |
| Median Household Income | - | - |
| Monthly Housing Costs | $358 | $0 |
| Real Estate Taxes | $717 | $0 |
Property Value by Mortgage Status in Mikes
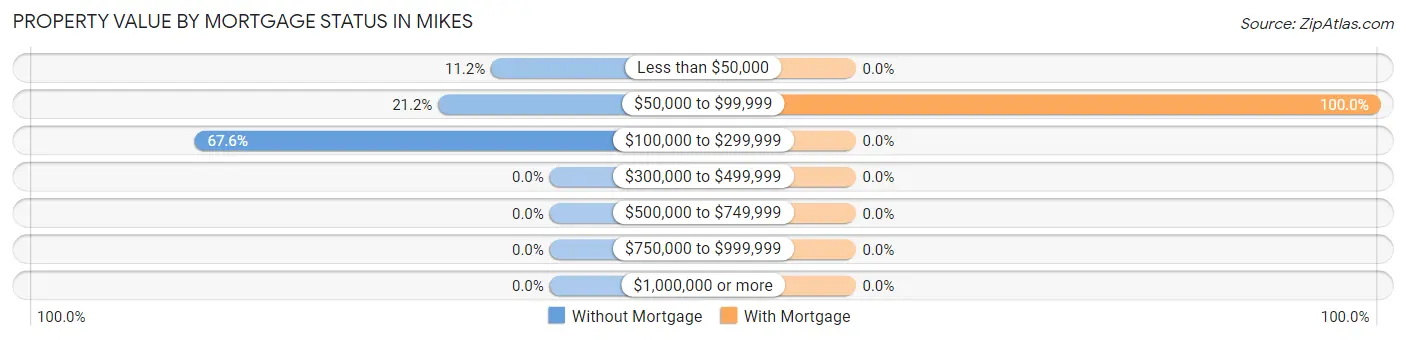
| Property Value | Without Mortgage | With Mortgage |
| Less than $50,000 | 31 (11.2%) | 0 (0.0%) |
| $50,000 to $99,999 | 59 (21.2%) | 24 (100.0%) |
| $100,000 to $299,999 | 188 (67.6%) | 0 (0.0%) |
| $300,000 to $499,999 | 0 (0.0%) | 0 (0.0%) |
| $500,000 to $749,999 | 0 (0.0%) | 0 (0.0%) |
| $750,000 to $999,999 | 0 (0.0%) | 0 (0.0%) |
| $1,000,000 or more | 0 (0.0%) | 0 (0.0%) |
| Total | 278 (100.0%) | 24 (100.0%) |
Household Income by Mortgage Status in Mikes
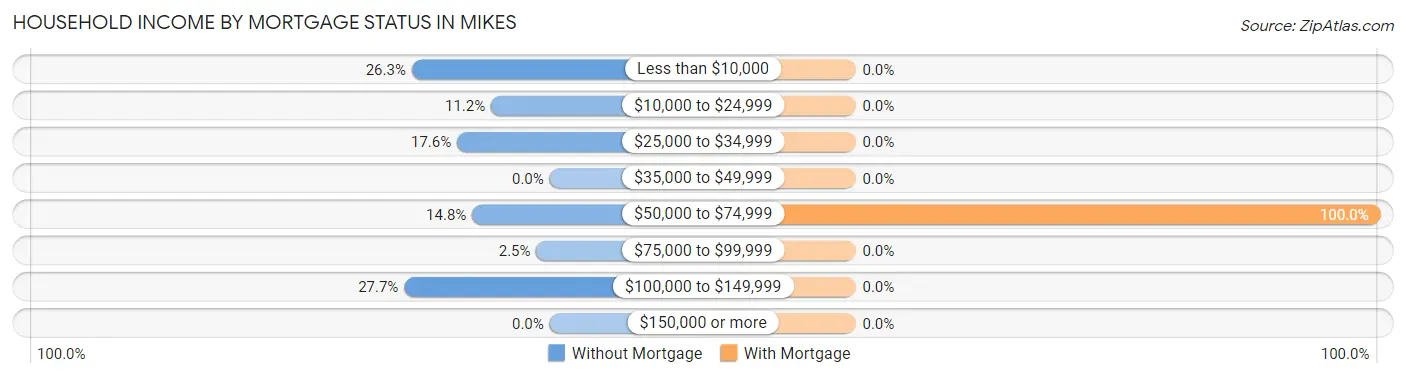
| Household Income | Without Mortgage | With Mortgage |
| Less than $10,000 | 73 (26.3%) | 0 (0.0%) |
| $10,000 to $24,999 | 31 (11.2%) | 0 (0.0%) |
| $25,000 to $34,999 | 49 (17.6%) | 0 (0.0%) |
| $35,000 to $49,999 | 0 (0.0%) | 0 (0.0%) |
| $50,000 to $74,999 | 41 (14.7%) | 24 (100.0%) |
| $75,000 to $99,999 | 7 (2.5%) | 0 (0.0%) |
| $100,000 to $149,999 | 77 (27.7%) | 0 (0.0%) |
| $150,000 or more | 0 (0.0%) | 0 (0.0%) |
| Total | 278 (100.0%) | 24 (100.0%) |
Property Value to Household Income Ratio in Mikes
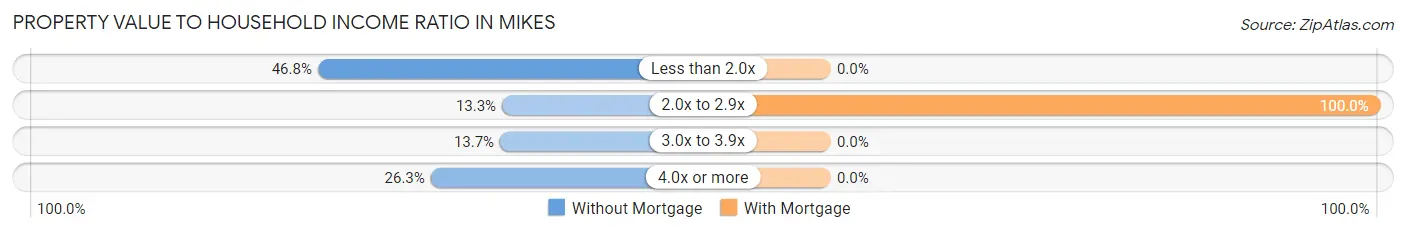
| Value-to-Income Ratio | Without Mortgage | With Mortgage |
| Less than 2.0x | 130 (46.8%) | 0 (0.0%) |
| 2.0x to 2.9x | 37 (13.3%) | 24 (100.0%) |
| 3.0x to 3.9x | 38 (13.7%) | 0 (0.0%) |
| 4.0x or more | 73 (26.3%) | 0 (0.0%) |
| Total | 278 (100.0%) | 24 (100.0%) |
Real Estate Taxes by Mortgage Status in Mikes
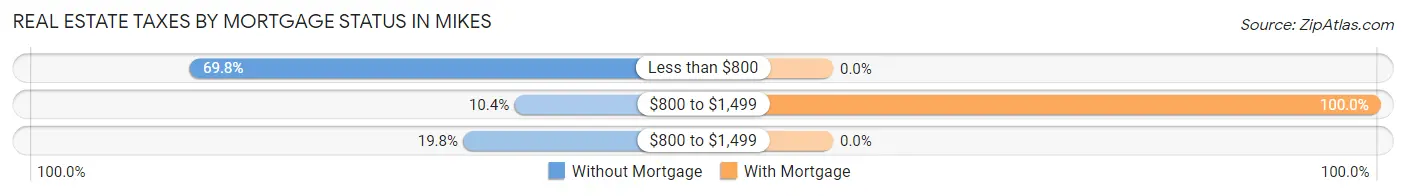
| Property Taxes | Without Mortgage | With Mortgage |
| Less than $800 | 194 (69.8%) | 0 (0.0%) |
| $800 to $1,499 | 29 (10.4%) | 24 (100.0%) |
| $800 to $1,499 | 55 (19.8%) | 0 (0.0%) |
| Total | 278 (100.0%) | 24 (100.0%) |
Health & Disability in Mikes
Health Insurance Coverage by Age in Mikes
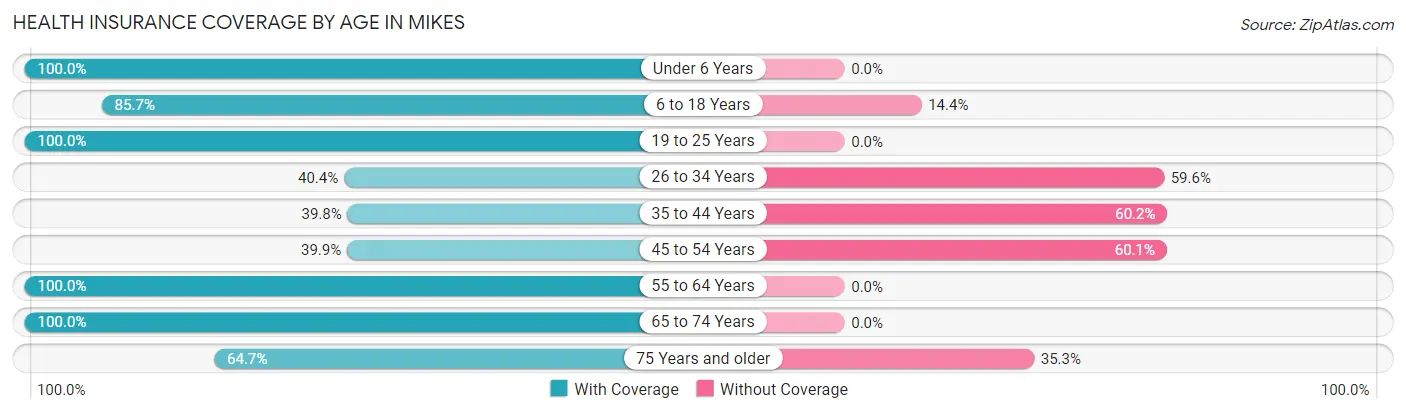
| Age Bracket | With Coverage | Without Coverage |
| Under 6 Years | 87 (100.0%) | 0 (0.0%) |
| 6 to 18 Years | 376 (85.7%) | 63 (14.3%) |
| 19 to 25 Years | 30 (100.0%) | 0 (0.0%) |
| 26 to 34 Years | 95 (40.4%) | 140 (59.6%) |
| 35 to 44 Years | 70 (39.8%) | 106 (60.2%) |
| 45 to 54 Years | 61 (39.9%) | 92 (60.1%) |
| 55 to 64 Years | 8 (100.0%) | 0 (0.0%) |
| 65 to 74 Years | 103 (100.0%) | 0 (0.0%) |
| 75 Years and older | 86 (64.7%) | 47 (35.3%) |
| Total | 916 (67.2%) | 448 (32.8%) |
Health Insurance Coverage by Citizenship Status in Mikes
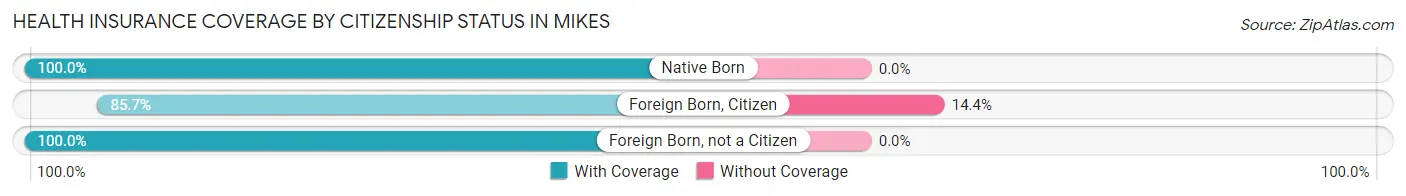
| Citizenship Status | With Coverage | Without Coverage |
| Native Born | 87 (100.0%) | 0 (0.0%) |
| Foreign Born, Citizen | 376 (85.7%) | 63 (14.3%) |
| Foreign Born, not a Citizen | 30 (100.0%) | 0 (0.0%) |
Health Insurance Coverage by Household Income in Mikes
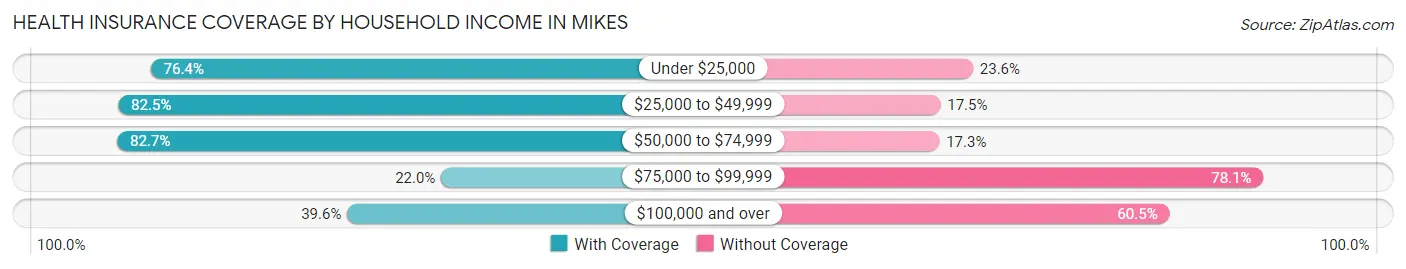
| Household Income | With Coverage | Without Coverage |
| Under $25,000 | 152 (76.4%) | 47 (23.6%) |
| $25,000 to $49,999 | 386 (82.5%) | 82 (17.5%) |
| $50,000 to $74,999 | 210 (82.7%) | 44 (17.3%) |
| $75,000 to $99,999 | 9 (22.0%) | 32 (78.0%) |
| $100,000 and over | 159 (39.6%) | 243 (60.5%) |
Public vs Private Health Insurance Coverage by Age in Mikes
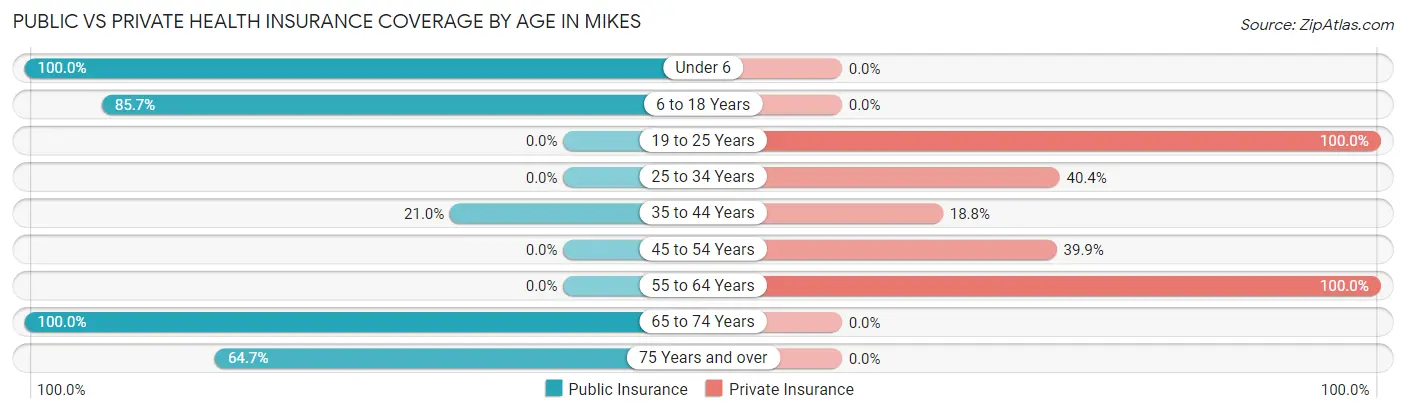
| Age Bracket | Public Insurance | Private Insurance |
| Under 6 | 87 (100.0%) | 0 (0.0%) |
| 6 to 18 Years | 376 (85.7%) | 0 (0.0%) |
| 19 to 25 Years | 0 (0.0%) | 30 (100.0%) |
| 25 to 34 Years | 0 (0.0%) | 95 (40.4%) |
| 35 to 44 Years | 37 (21.0%) | 33 (18.8%) |
| 45 to 54 Years | 0 (0.0%) | 61 (39.9%) |
| 55 to 64 Years | 0 (0.0%) | 8 (100.0%) |
| 65 to 74 Years | 103 (100.0%) | 0 (0.0%) |
| 75 Years and over | 86 (64.7%) | 0 (0.0%) |
| Total | 689 (50.5%) | 227 (16.6%) |
Disability Status by Sex by Age in Mikes
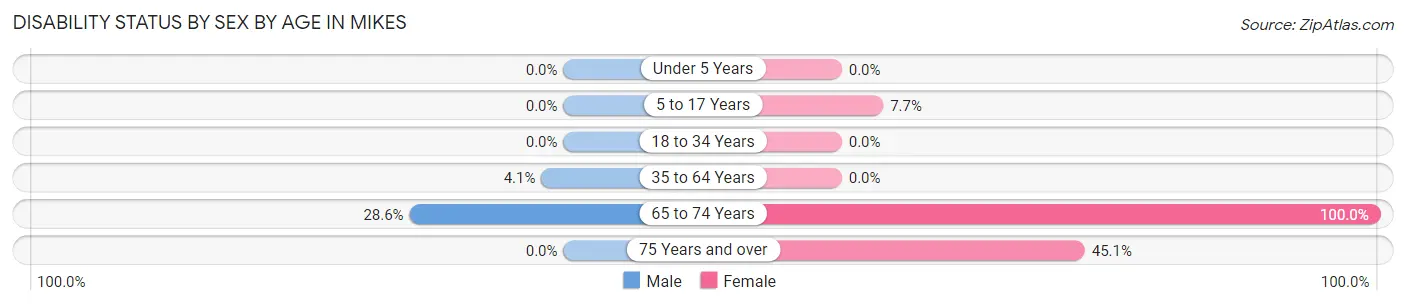
| Age Bracket | Male | Female |
| Under 5 Years | 0 (0.0%) | 0 (0.0%) |
| 5 to 17 Years | 0 (0.0%) | 19 (7.7%) |
| 18 to 34 Years | 0 (0.0%) | 0 (0.0%) |
| 35 to 64 Years | 8 (4.1%) | 0 (0.0%) |
| 65 to 74 Years | 10 (28.6%) | 68 (100.0%) |
| 75 Years and over | 0 (0.0%) | 60 (45.1%) |
Disability Class by Sex by Age in Mikes
Disability Class: Hearing Difficulty
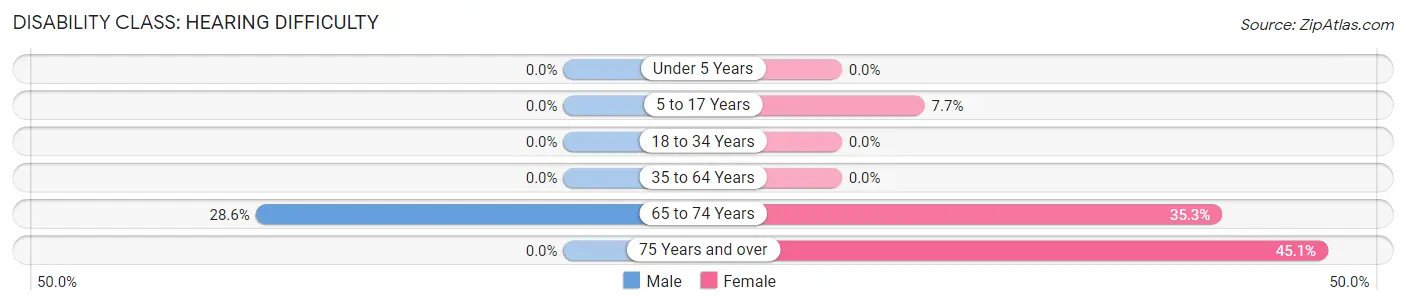
| Age Bracket | Male | Female |
| Under 5 Years | 0 (0.0%) | 0 (0.0%) |
| 5 to 17 Years | 0 (0.0%) | 19 (7.7%) |
| 18 to 34 Years | 0 (0.0%) | 0 (0.0%) |
| 35 to 64 Years | 0 (0.0%) | 0 (0.0%) |
| 65 to 74 Years | 10 (28.6%) | 24 (35.3%) |
| 75 Years and over | 0 (0.0%) | 60 (45.1%) |
Disability Class: Vision Difficulty
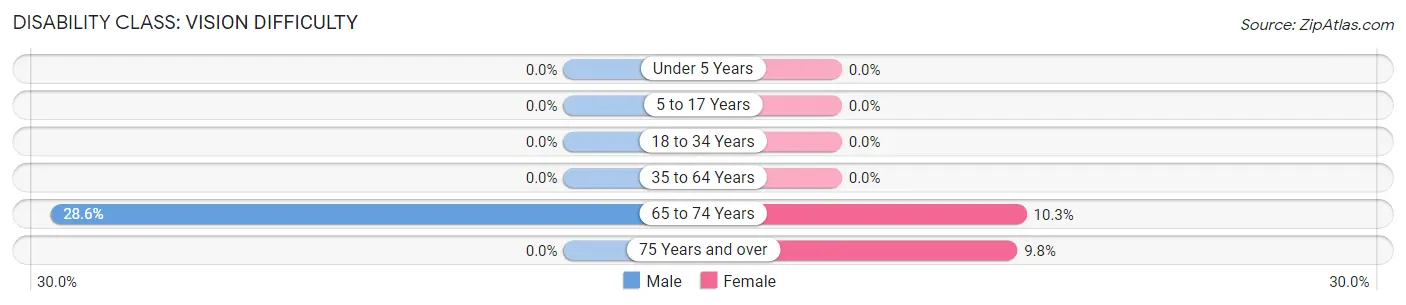
| Age Bracket | Male | Female |
| Under 5 Years | 0 (0.0%) | 0 (0.0%) |
| 5 to 17 Years | 0 (0.0%) | 0 (0.0%) |
| 18 to 34 Years | 0 (0.0%) | 0 (0.0%) |
| 35 to 64 Years | 0 (0.0%) | 0 (0.0%) |
| 65 to 74 Years | 10 (28.6%) | 7 (10.3%) |
| 75 Years and over | 0 (0.0%) | 13 (9.8%) |
Disability Class: Cognitive Difficulty
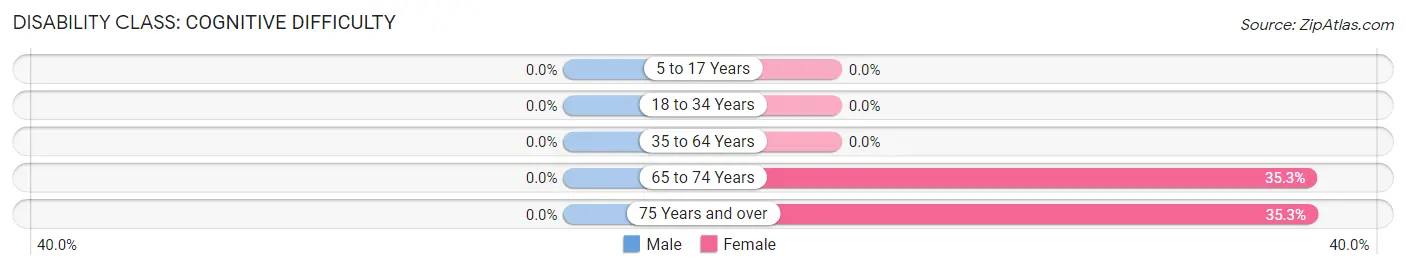
| Age Bracket | Male | Female |
| 5 to 17 Years | 0 (0.0%) | 0 (0.0%) |
| 18 to 34 Years | 0 (0.0%) | 0 (0.0%) |
| 35 to 64 Years | 0 (0.0%) | 0 (0.0%) |
| 65 to 74 Years | 0 (0.0%) | 24 (35.3%) |
| 75 Years and over | 0 (0.0%) | 47 (35.3%) |
Disability Class: Ambulatory Difficulty
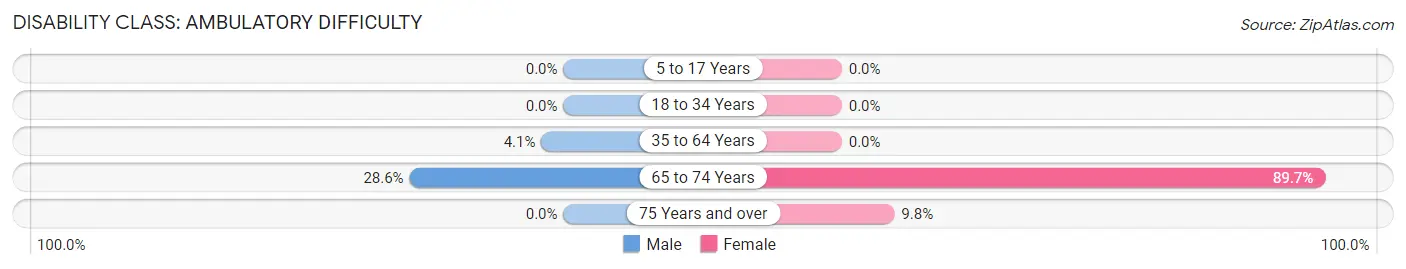
| Age Bracket | Male | Female |
| 5 to 17 Years | 0 (0.0%) | 0 (0.0%) |
| 18 to 34 Years | 0 (0.0%) | 0 (0.0%) |
| 35 to 64 Years | 8 (4.1%) | 0 (0.0%) |
| 65 to 74 Years | 10 (28.6%) | 61 (89.7%) |
| 75 Years and over | 0 (0.0%) | 13 (9.8%) |
Disability Class: Self-Care Difficulty
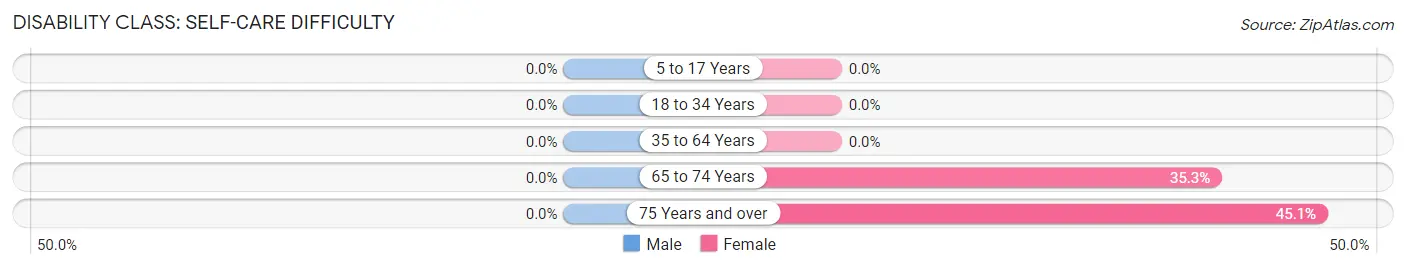
| Age Bracket | Male | Female |
| 5 to 17 Years | 0 (0.0%) | 0 (0.0%) |
| 18 to 34 Years | 0 (0.0%) | 0 (0.0%) |
| 35 to 64 Years | 0 (0.0%) | 0 (0.0%) |
| 65 to 74 Years | 0 (0.0%) | 24 (35.3%) |
| 75 Years and over | 0 (0.0%) | 60 (45.1%) |
Technology Access in Mikes
Computing Device Access in Mikes
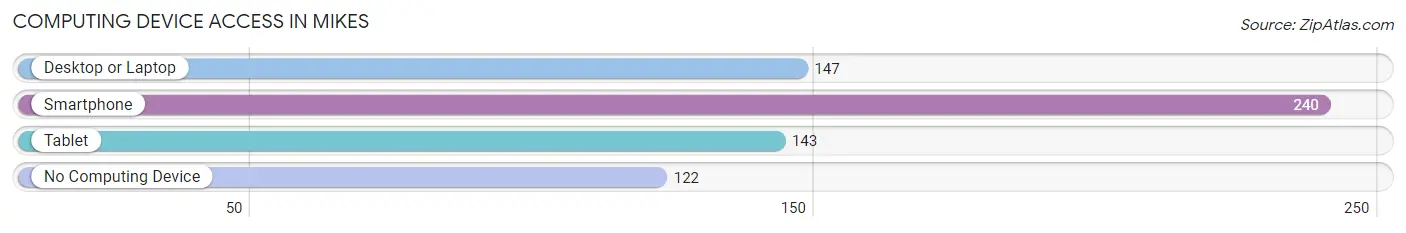
| Device Type | # Households | % Households |
| Desktop or Laptop | 147 | 40.6% |
| Smartphone | 240 | 66.3% |
| Tablet | 143 | 39.5% |
| No Computing Device | 122 | 33.7% |
| Total | 362 | 100.0% |
Internet Access in Mikes
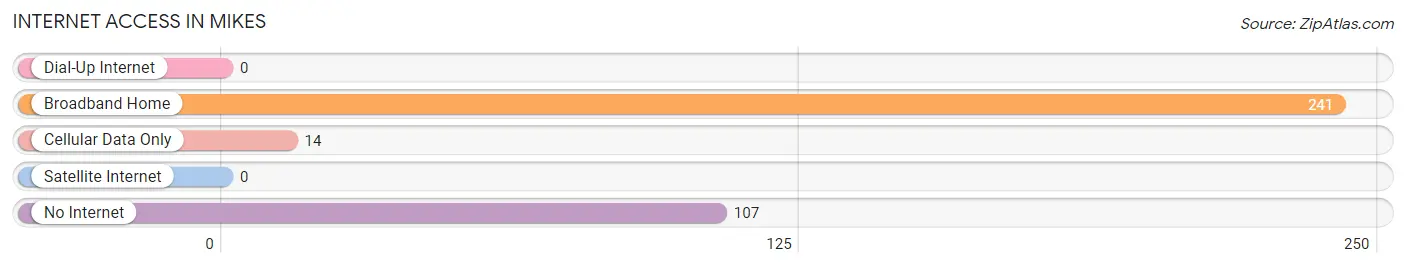
| Internet Type | # Households | % Households |
| Dial-Up Internet | 0 | 0.0% |
| Broadband Home | 241 | 66.6% |
| Cellular Data Only | 14 | 3.9% |
| Satellite Internet | 0 | 0.0% |
| No Internet | 107 | 29.6% |
| Total | 362 | 100.0% |
Mikes Summary
Texas is a state located in the south-central region of the United States. It is the second largest state in the country, both in terms of population and land area. Texas is known for its diverse geography, ranging from the piney woods of East Texas to the desert of West Texas, and from the rolling hills of the Hill Country to the Gulf Coast. It is also known for its rich history, which dates back to the early days of the Republic of Texas.
History
The history of Texas dates back to the early 1500s, when Spanish explorers first arrived in the region. The Spanish established several missions and presidios in the area, and eventually established the province of Tejas. In 1821, Mexico won its independence from Spain, and Texas became part of the newly formed Mexican Republic. In 1836, Texas declared its independence from Mexico and formed the Republic of Texas. The Republic of Texas was short-lived, however, as it was annexed by the United States in 1845.
Geography
Texas is located in the south-central region of the United States. It is bordered by Oklahoma to the north, Arkansas and Louisiana to the east, and Mexico to the south. The state is divided into four distinct geographic regions: the Piney Woods of East Texas, the Hill Country of Central Texas, the Plains of West Texas, and the Gulf Coast. Each region has its own unique geography, climate, and culture.
The Piney Woods of East Texas are characterized by dense forests of pine and hardwood trees. The Hill Country of Central Texas is characterized by rolling hills and limestone outcroppings. The Plains of West Texas are characterized by flat, dry land and desert vegetation. The Gulf Coast is characterized by sandy beaches and coastal wetlands.
Economy
The economy of Texas is one of the largest and most diverse in the United States. The state is a major producer of oil and natural gas, and is home to some of the largest oil and gas companies in the world. Texas is also a major producer of agricultural products, including cotton, cattle, and wheat. The state is also home to a large number of technology companies, including Dell, Texas Instruments, and Apple.
Demographics
As of 2020, the population of Texas was estimated to be 29.1 million. The state is one of the most diverse in the country, with a population that is roughly 44% Hispanic, 12% African American, and 38% White. The largest cities in the state are Houston, San Antonio, Dallas, and Austin.
Texas is a state with a rich history, diverse geography, and vibrant economy. It is home to a diverse population, and is one of the most populous states in the country. Texas is a great place to live, work, and visit, and its unique culture and history make it a great place to explore.
Common Questions
What is Per Capita Income in Mikes?
Per Capita income in Mikes is $16,571.
What is the Median Family Income in Mikes?
Median Family Income in Mikes is $53,487.
What is Inequality or Gini Index in Mikes?
Inequality or Gini Index in Mikes is 0.48.
What is the Total Population of Mikes?
Total Population of Mikes is 1,364.
What is the Total Male Population of Mikes?
Total Male Population of Mikes is 705.
What is the Total Female Population of Mikes?
Total Female Population of Mikes is 659.
What is the Ratio of Males per 100 Females in Mikes?
There are 106.98 Males per 100 Females in Mikes.
What is the Ratio of Females per 100 Males in Mikes?
There are 93.48 Females per 100 Males in Mikes.
What is the Median Population Age in Mikes?
Median Population Age in Mikes is 33.2 Years.
What is the Average Family Size in Mikes
Average Family Size in Mikes is 5.0 People.
What is the Average Household Size in Mikes
Average Household Size in Mikes is 3.8 People.
How Large is the Labor Force in Mikes?
There are 570 People in the Labor Forcein in Mikes.
What is the Percentage of People in the Labor Force in Mikes?
59.6% of People are in the Labor Force in Mikes.
What is the Unemployment Rate in Mikes?
Unemployment Rate in Mikes is 3.5%.