Primera, TX Map & Demographics
Primera Map
Primera Overview
$22,931
PER CAPITA INCOME
$61,439
AVG FAMILY INCOME
$61,108
AVG HOUSEHOLD INCOME
3.6%
WAGE / INCOME GAP [ % ]
96.4¢/ $1
WAGE / INCOME GAP [ $ ]
$5,807
FAMILY INCOME DEFICIT
0.41
INEQUALITY / GINI INDEX
5,219
TOTAL POPULATION
2,803
MALE POPULATION
2,416
FEMALE POPULATION
116.02
MALES / 100 FEMALES
86.19
FEMALES / 100 MALES
30.7
MEDIAN AGE
4.0
AVG FAMILY SIZE
3.4
AVG HOUSEHOLD SIZE
2,773
LABOR FORCE [ PEOPLE ]
75.9%
PERCENT IN LABOR FORCE
2.8%
UNEMPLOYMENT RATE
Income in Primera
Income Overview in Primera
Per Capita Income in Primera is $22,931, while median incomes of families and households are $61,439 and $61,108 respectively.
| Characteristic | Number | Measure |
| Per Capita Income | 5,219 | $22,931 |
| Median Family Income | 1,147 | $61,439 |
| Mean Family Income | 1,147 | $77,778 |
| Median Household Income | 1,523 | $61,108 |
| Mean Household Income | 1,523 | $74,876 |
| Income Deficit | 1,147 | $5,807 |
| Wage / Income Gap (%) | 5,219 | 3.60% |
| Wage / Income Gap ($) | 5,219 | 96.40¢ per $1 |
| Gini / Inequality Index | 5,219 | 0.41 |
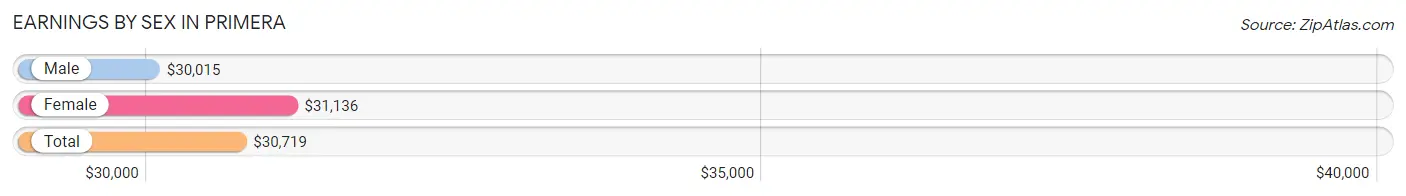
Earnings by Sex in Primera
Average Earnings in Primera are $30,719, $30,015 for men and $31,136 for women, a difference of 3.6%.
| Sex | Number | Average Earnings |
| Male | 1,559 (55.8%) | $30,015 |
| Female | 1,235 (44.2%) | $31,136 |
| Total | 2,794 (100.0%) | $30,719 |
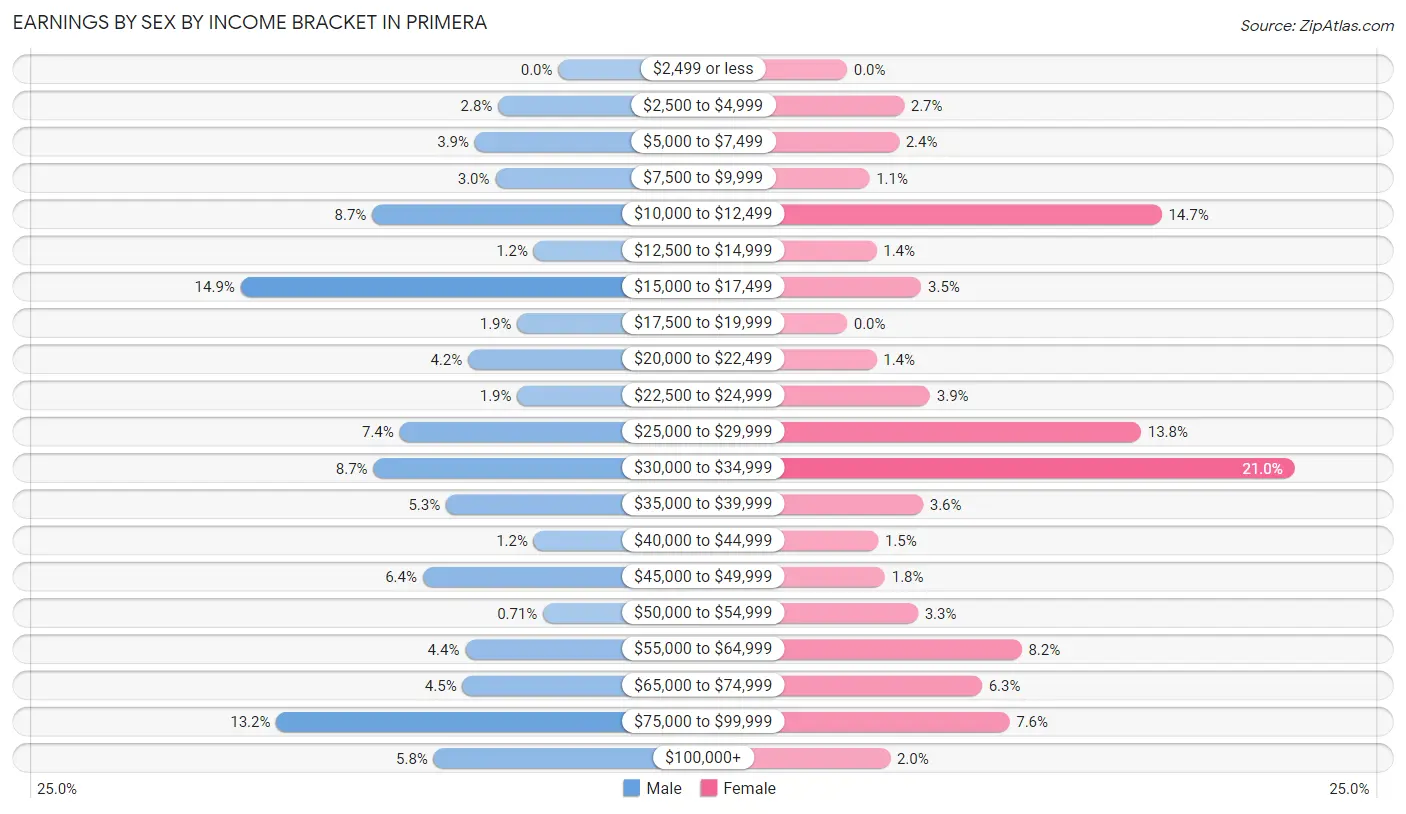
Earnings by Sex by Income Bracket in Primera
The most common earnings brackets in Primera are $15,000 to $17,499 for men (232 | 14.9%) and $30,000 to $34,999 for women (259 | 21.0%).
| Income | Male | Female |
| $2,499 or less | 0 (0.0%) | 0 (0.0%) |
| $2,500 to $4,999 | 44 (2.8%) | 33 (2.7%) |
| $5,000 to $7,499 | 61 (3.9%) | 30 (2.4%) |
| $7,500 to $9,999 | 46 (2.9%) | 13 (1.1%) |
| $10,000 to $12,499 | 136 (8.7%) | 182 (14.7%) |
| $12,500 to $14,999 | 18 (1.1%) | 17 (1.4%) |
| $15,000 to $17,499 | 232 (14.9%) | 43 (3.5%) |
| $17,500 to $19,999 | 30 (1.9%) | 0 (0.0%) |
| $20,000 to $22,499 | 66 (4.2%) | 17 (1.4%) |
| $22,500 to $24,999 | 30 (1.9%) | 48 (3.9%) |
| $25,000 to $29,999 | 116 (7.4%) | 170 (13.8%) |
| $30,000 to $34,999 | 135 (8.7%) | 259 (21.0%) |
| $35,000 to $39,999 | 82 (5.3%) | 44 (3.6%) |
| $40,000 to $44,999 | 18 (1.1%) | 18 (1.5%) |
| $45,000 to $49,999 | 99 (6.4%) | 22 (1.8%) |
| $50,000 to $54,999 | 11 (0.7%) | 41 (3.3%) |
| $55,000 to $64,999 | 68 (4.4%) | 101 (8.2%) |
| $65,000 to $74,999 | 70 (4.5%) | 78 (6.3%) |
| $75,000 to $99,999 | 206 (13.2%) | 94 (7.6%) |
| $100,000+ | 91 (5.8%) | 25 (2.0%) |
| Total | 1,559 (100.0%) | 1,235 (100.0%) |
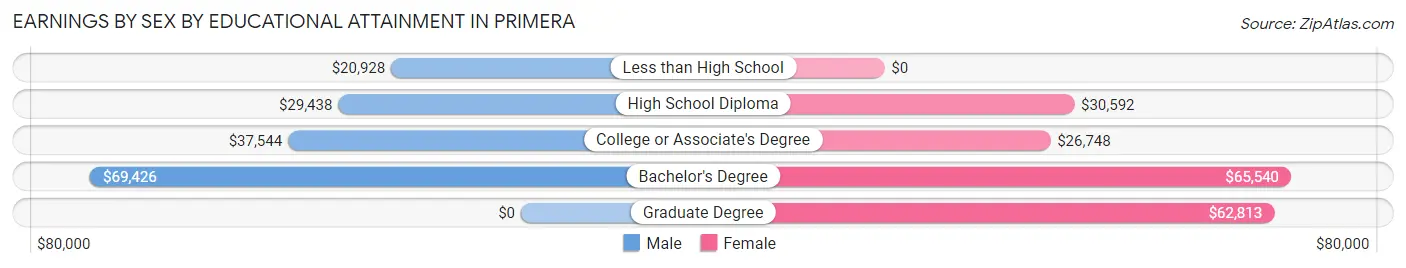
Earnings by Sex by Educational Attainment in Primera
Average earnings in Primera are $34,142 for men and $31,971 for women, a difference of 6.4%. Men with an educational attainment of bachelor's degree enjoy the highest average annual earnings of $69,426, while those with less than high school education earn the least with $20,928. Women with an educational attainment of bachelor's degree earn the most with the average annual earnings of $65,540, while those with college or associate's degree education have the smallest earnings of $26,748.
| Educational Attainment | Male Income | Female Income |
| Less than High School | $20,928 | $0 |
| High School Diploma | $29,438 | $30,592 |
| College or Associate's Degree | $37,544 | $26,748 |
| Bachelor's Degree | $69,426 | $65,540 |
| Graduate Degree | - | - |
| Total | $34,142 | $31,971 |
Family Income in Primera
Family Income Brackets in Primera
According to the Primera family income data, there are 211 families falling into the $75,000 to $99,999 income range, which is the most common income bracket and makes up 18.4% of all families.
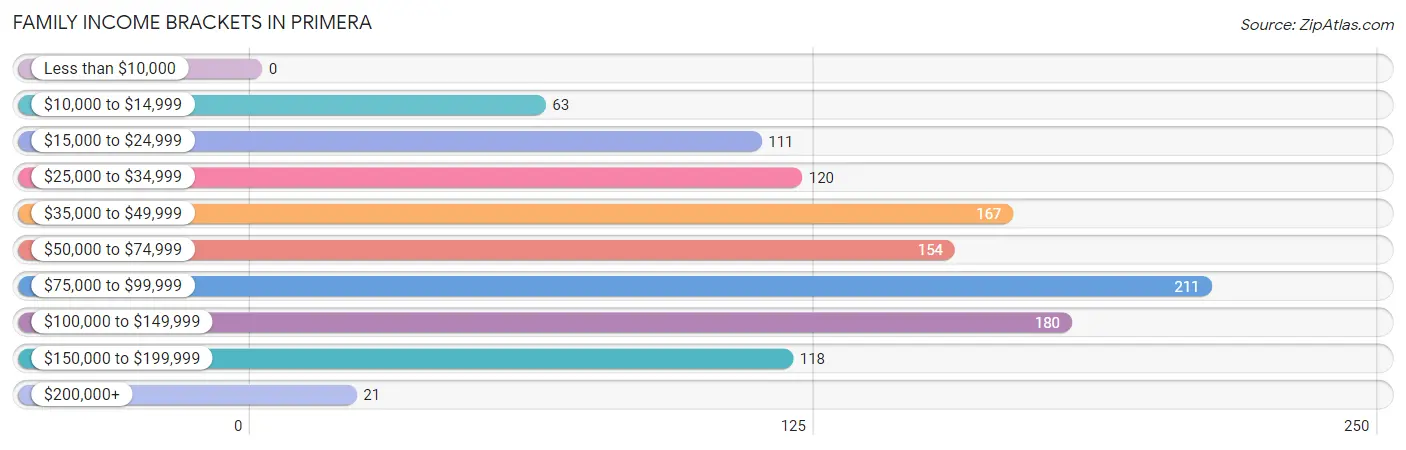
| Income Bracket | # Families | % Families |
| Less than $10,000 | 0 | 0.0% |
| $10,000 to $14,999 | 63 | 5.5% |
| $15,000 to $24,999 | 111 | 9.7% |
| $25,000 to $34,999 | 120 | 10.5% |
| $35,000 to $49,999 | 167 | 14.6% |
| $50,000 to $74,999 | 154 | 13.4% |
| $75,000 to $99,999 | 211 | 18.4% |
| $100,000 to $149,999 | 180 | 15.7% |
| $150,000 to $199,999 | 118 | 10.3% |
| $200,000+ | 21 | 1.8% |
Family Income by Famaliy Size in Primera
4-person families (206 | 18.0%) account for the highest median family income in Primera with $86,667 per family, while 2-person families (266 | 23.2%) have the highest median income of $30,754 per family member.
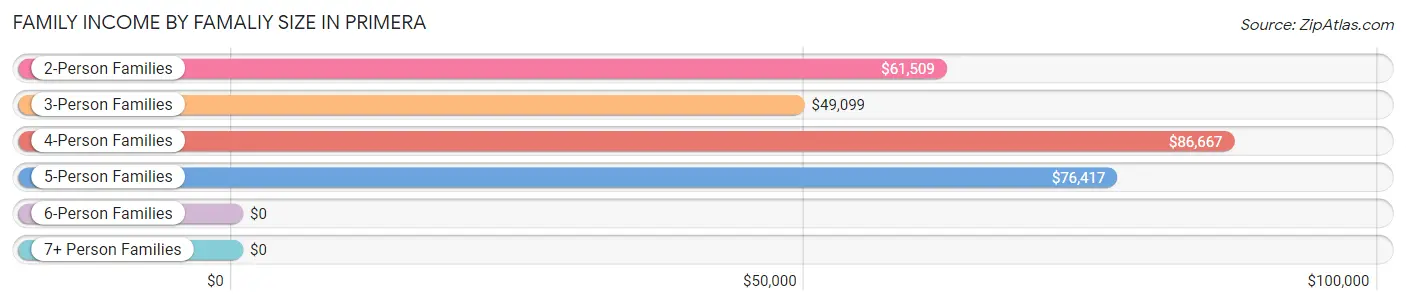
| Income Bracket | # Families | Median Income |
| 2-Person Families | 266 (23.2%) | $61,509 |
| 3-Person Families | 407 (35.5%) | $49,099 |
| 4-Person Families | 206 (18.0%) | $86,667 |
| 5-Person Families | 181 (15.8%) | $76,417 |
| 6-Person Families | 63 (5.5%) | $0 |
| 7+ Person Families | 24 (2.1%) | $0 |
| Total | 1,147 (100.0%) | $61,439 |
Family Income by Number of Earners in Primera
The median family income in Primera is $61,439, with families comprising 2 earners (552) having the highest median family income of $91,136, while families with no earners (64) have the lowest median family income of $23,281, accounting for 48.1% and 5.6% of families, respectively.
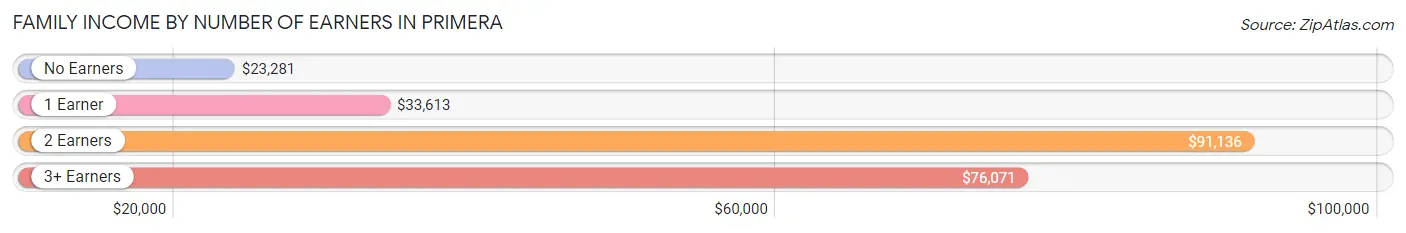
| Number of Earners | # Families | Median Income |
| No Earners | 64 (5.6%) | $23,281 |
| 1 Earner | 283 (24.7%) | $33,613 |
| 2 Earners | 552 (48.1%) | $91,136 |
| 3+ Earners | 248 (21.6%) | $76,071 |
| Total | 1,147 (100.0%) | $61,439 |
Household Income in Primera
Household Income Brackets in Primera
With 286 households falling in the category, the $75,000 to $99,999 income range is the most frequent in Primera, accounting for 18.8% of all households. In contrast, only 55 households (3.6%) fall into the less than $10,000 income bracket, making it the least populous group.
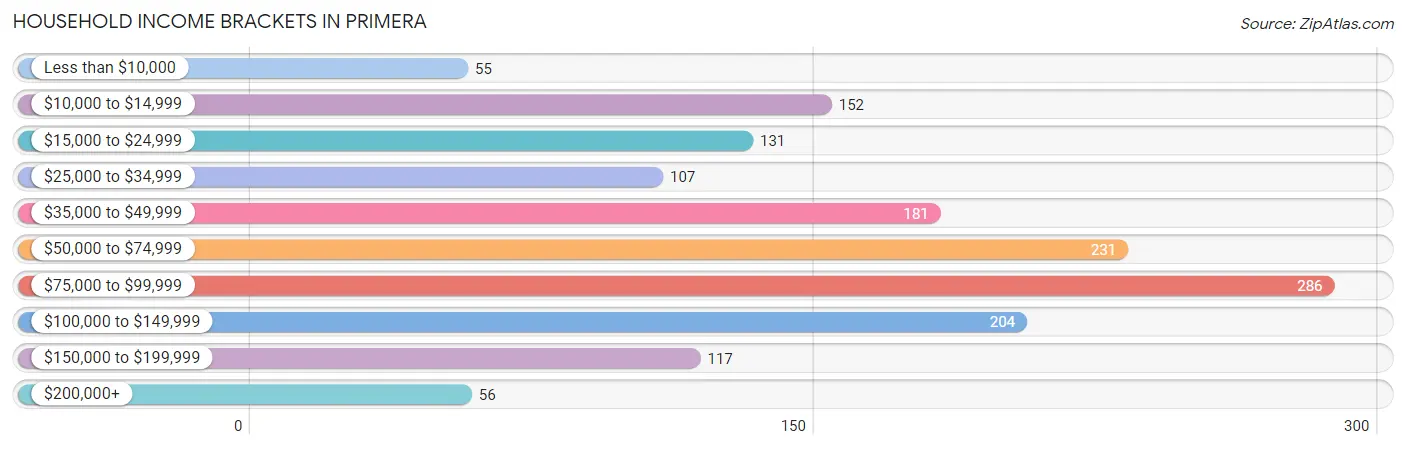
| Income Bracket | # Households | % Households |
| Less than $10,000 | 55 | 3.6% |
| $10,000 to $14,999 | 152 | 10.0% |
| $15,000 to $24,999 | 131 | 8.6% |
| $25,000 to $34,999 | 107 | 7.0% |
| $35,000 to $49,999 | 181 | 11.9% |
| $50,000 to $74,999 | 231 | 15.2% |
| $75,000 to $99,999 | 286 | 18.8% |
| $100,000 to $149,999 | 204 | 13.4% |
| $150,000 to $199,999 | 117 | 7.7% |
| $200,000+ | 56 | 3.7% |
Household Income by Householder Age in Primera
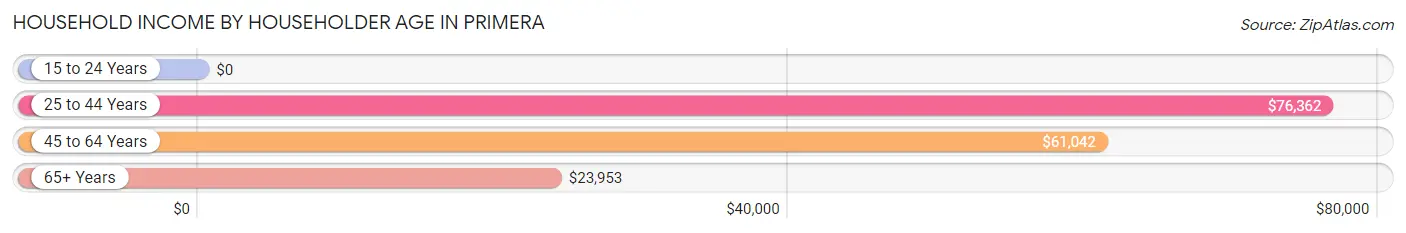
The median household income in Primera is $61,108, with the highest median household income of $76,362 found in the 25 to 44 years age bracket for the primary householder. A total of 774 households (50.8%) fall into this category. Meanwhile, the 15 to 24 years age bracket for the primary householder has the lowest median household income of $0, with 31 households (2.0%) in this group.
| Income Bracket | # Households | Median Income |
| 15 to 24 Years | 31 (2.0%) | $0 |
| 25 to 44 Years | 774 (50.8%) | $76,362 |
| 45 to 64 Years | 390 (25.6%) | $61,042 |
| 65+ Years | 328 (21.5%) | $23,953 |
| Total | 1,523 (100.0%) | $61,108 |
Poverty in Primera
Income Below Poverty by Sex and Age in Primera
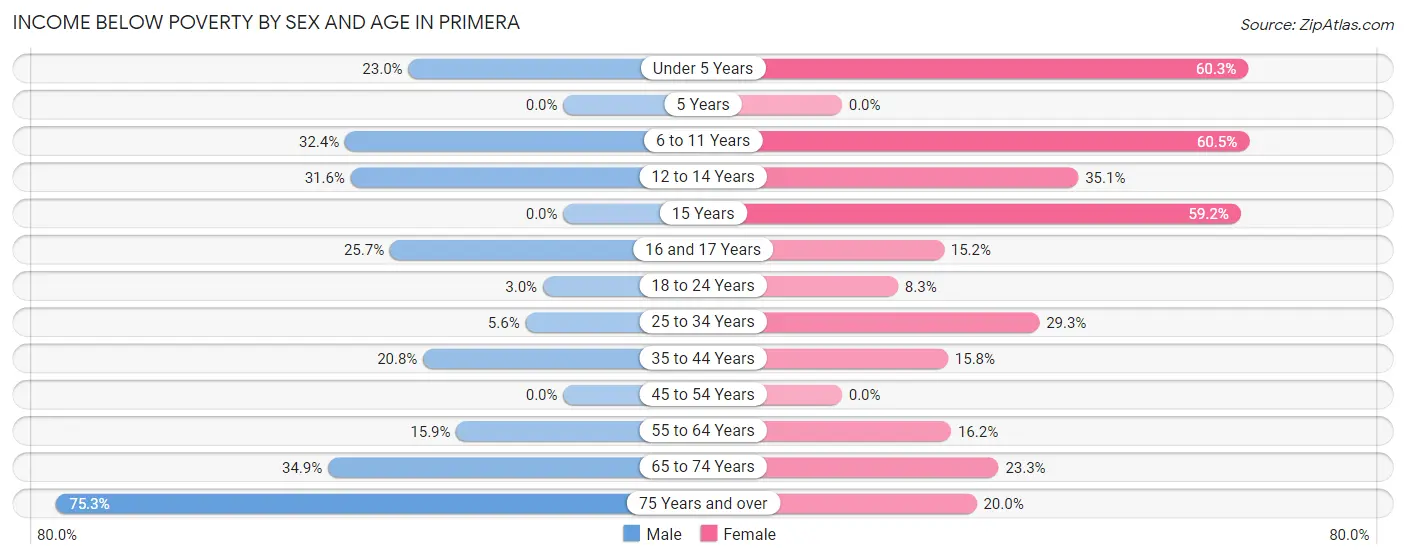
With 18.6% poverty level for males and 30.0% for females among the residents of Primera, 75 year old and over males and 6 to 11 year old females are the most vulnerable to poverty, with 64 males (75.3%) and 182 females (60.5%) in their respective age groups living below the poverty level.
| Age Bracket | Male | Female |
| Under 5 Years | 84 (23.0%) | 146 (60.3%) |
| 5 Years | 0 (0.0%) | 0 (0.0%) |
| 6 to 11 Years | 118 (32.4%) | 182 (60.5%) |
| 12 to 14 Years | 18 (31.6%) | 33 (35.1%) |
| 15 Years | 0 (0.0%) | 61 (59.2%) |
| 16 and 17 Years | 26 (25.7%) | 10 (15.1%) |
| 18 to 24 Years | 9 (3.0%) | 9 (8.3%) |
| 25 to 34 Years | 20 (5.6%) | 136 (29.3%) |
| 35 to 44 Years | 77 (20.8%) | 46 (15.8%) |
| 45 to 54 Years | 0 (0.0%) | 0 (0.0%) |
| 55 to 64 Years | 48 (15.9%) | 47 (16.2%) |
| 65 to 74 Years | 58 (34.9%) | 40 (23.3%) |
| 75 Years and over | 64 (75.3%) | 14 (20.0%) |
| Total | 522 (18.6%) | 724 (30.0%) |
Income Above Poverty by Sex and Age in Primera
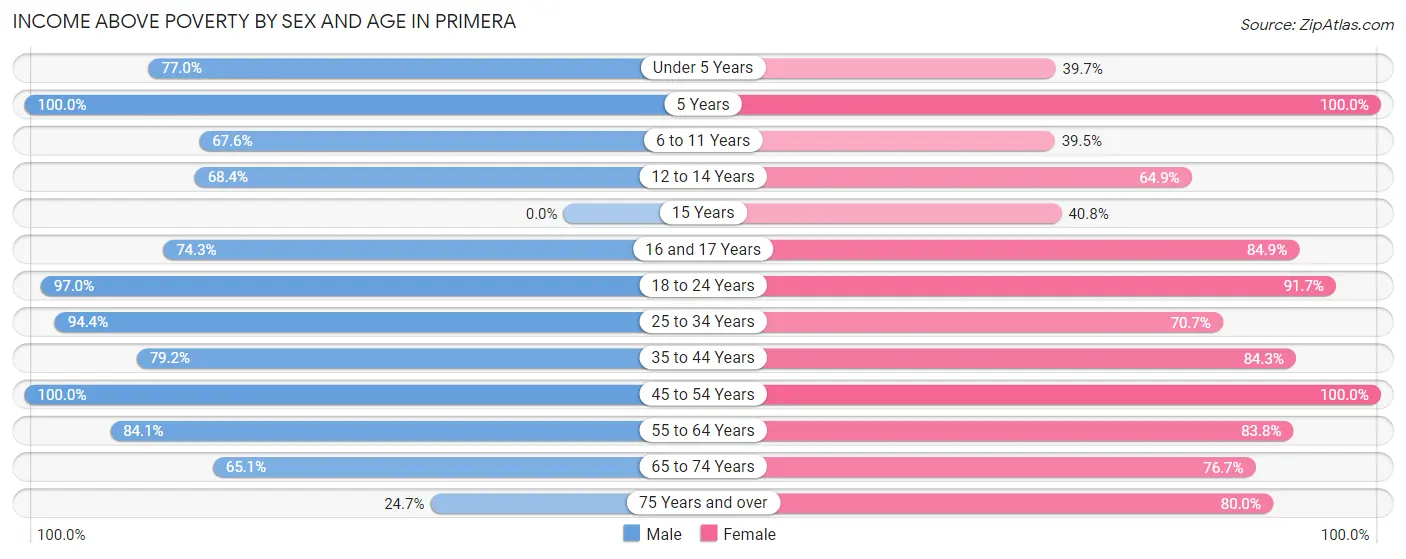
According to the poverty statistics in Primera, males aged 5 years and females aged 5 years are the age groups that are most secure financially, with 100.0% of males and 100.0% of females in these age groups living above the poverty line.
| Age Bracket | Male | Female |
| Under 5 Years | 281 (77.0%) | 96 (39.7%) |
| 5 Years | 26 (100.0%) | 13 (100.0%) |
| 6 to 11 Years | 246 (67.6%) | 119 (39.5%) |
| 12 to 14 Years | 39 (68.4%) | 61 (64.9%) |
| 15 Years | 0 (0.0%) | 42 (40.8%) |
| 16 and 17 Years | 75 (74.3%) | 56 (84.9%) |
| 18 to 24 Years | 288 (97.0%) | 99 (91.7%) |
| 25 to 34 Years | 336 (94.4%) | 328 (70.7%) |
| 35 to 44 Years | 293 (79.2%) | 246 (84.3%) |
| 45 to 54 Years | 314 (100.0%) | 201 (100.0%) |
| 55 to 64 Years | 254 (84.1%) | 243 (83.8%) |
| 65 to 74 Years | 108 (65.1%) | 132 (76.7%) |
| 75 Years and over | 21 (24.7%) | 56 (80.0%) |
| Total | 2,281 (81.4%) | 1,692 (70.0%) |
Income Below Poverty Among Married-Couple Families in Primera
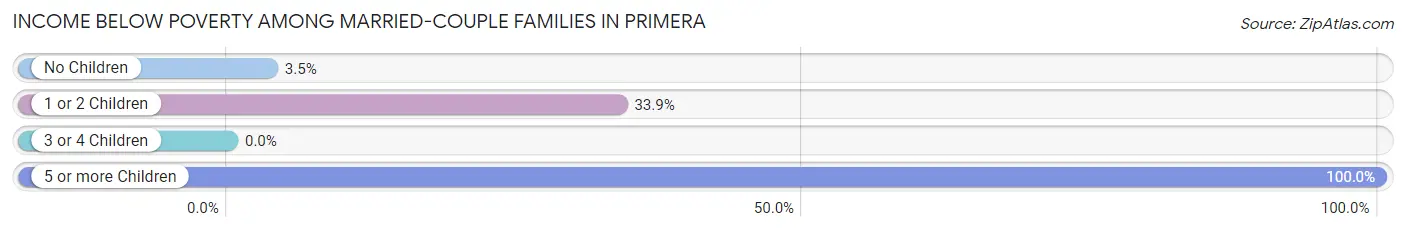
The poverty statistics for married-couple families in Primera show that 17.7% or 132 of the total 747 families live below the poverty line. Families with 5 or more children have the highest poverty rate of 100.0%, comprising of 19 families. On the other hand, families with 3 or 4 children have the lowest poverty rate of 0.0%, which includes 0 families.
| Children | Above Poverty | Below Poverty |
| No Children | 362 (96.5%) | 13 (3.5%) |
| 1 or 2 Children | 195 (66.1%) | 100 (33.9%) |
| 3 or 4 Children | 58 (100.0%) | 0 (0.0%) |
| 5 or more Children | 0 (0.0%) | 19 (100.0%) |
| Total | 615 (82.3%) | 132 (17.7%) |
Income Below Poverty Among Single-Parent Households in Primera
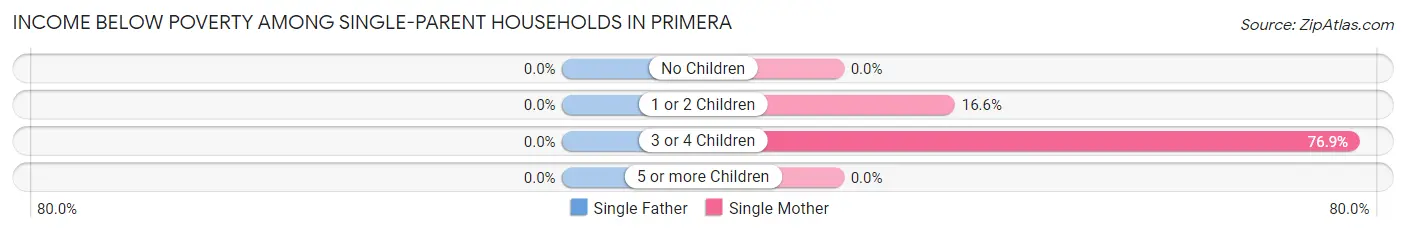
| Children | Single Father | Single Mother |
| No Children | 0 (0.0%) | 0 (0.0%) |
| 1 or 2 Children | 0 (0.0%) | 50 (16.6%) |
| 3 or 4 Children | 0 (0.0%) | 20 (76.9%) |
| 5 or more Children | 0 (0.0%) | 0 (0.0%) |
| Total | 0 (0.0%) | 70 (20.1%) |
Income Below Poverty Among Married-Couple vs Single-Parent Households in Primera
The poverty data for Primera shows that 132 of the married-couple family households (17.7%) and 70 of the single-parent households (17.5%) are living below the poverty level. Within the married-couple family households, those with 5 or more children have the highest poverty rate, with 19 households (100.0%) falling below the poverty line. Among the single-parent households, those with 3 or 4 children have the highest poverty rate, with 20 household (76.9%) living below poverty.
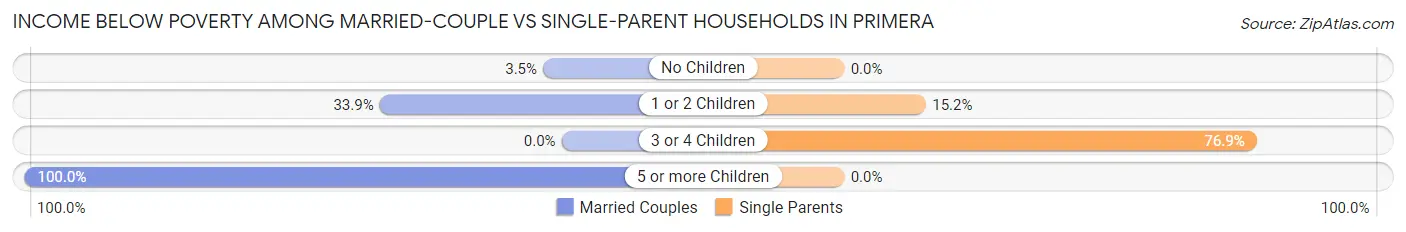
| Children | Married-Couple Families | Single-Parent Households |
| No Children | 13 (3.5%) | 0 (0.0%) |
| 1 or 2 Children | 100 (33.9%) | 50 (15.2%) |
| 3 or 4 Children | 0 (0.0%) | 20 (76.9%) |
| 5 or more Children | 19 (100.0%) | 0 (0.0%) |
| Total | 132 (17.7%) | 70 (17.5%) |
Race in Primera
The most populous races in Primera are Hispanic or Latino (4,282 | 82.1%), White / Caucasian (4,043 | 77.5%), and Two or more Races (754 | 14.4%).
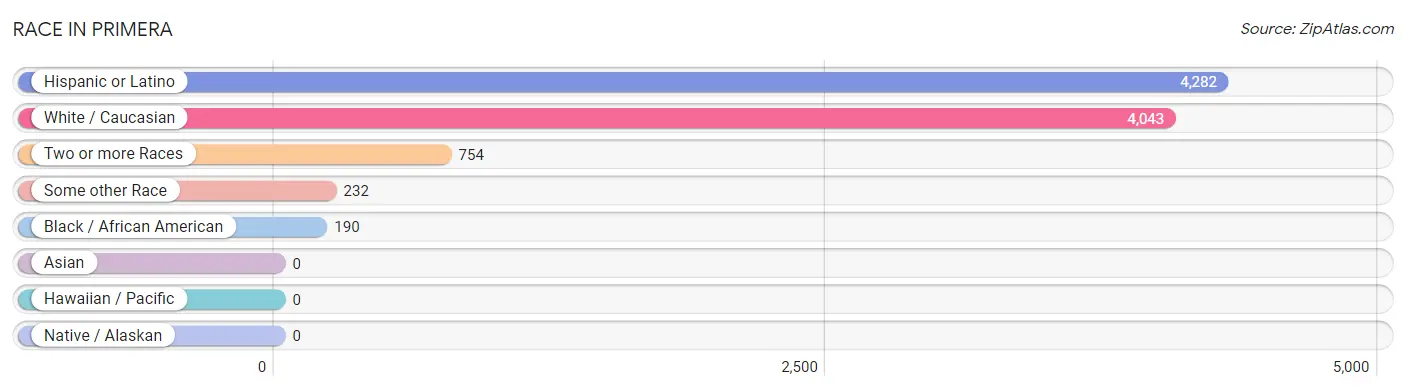
| Race | # Population | % Population |
| Asian | 0 | 0.0% |
| Black / African American | 190 | 3.6% |
| Hawaiian / Pacific | 0 | 0.0% |
| Hispanic or Latino | 4,282 | 82.1% |
| Native / Alaskan | 0 | 0.0% |
| White / Caucasian | 4,043 | 77.5% |
| Two or more Races | 754 | 14.4% |
| Some other Race | 232 | 4.4% |
| Total | 5,219 | 100.0% |
Ancestry in Primera
The most populous ancestries reported in Primera are Mexican (3,992 | 76.5%), German (227 | 4.3%), American (147 | 2.8%), South American (144 | 2.8%), and Venezuelan (121 | 2.3%), together accounting for 88.7% of all Primera residents.
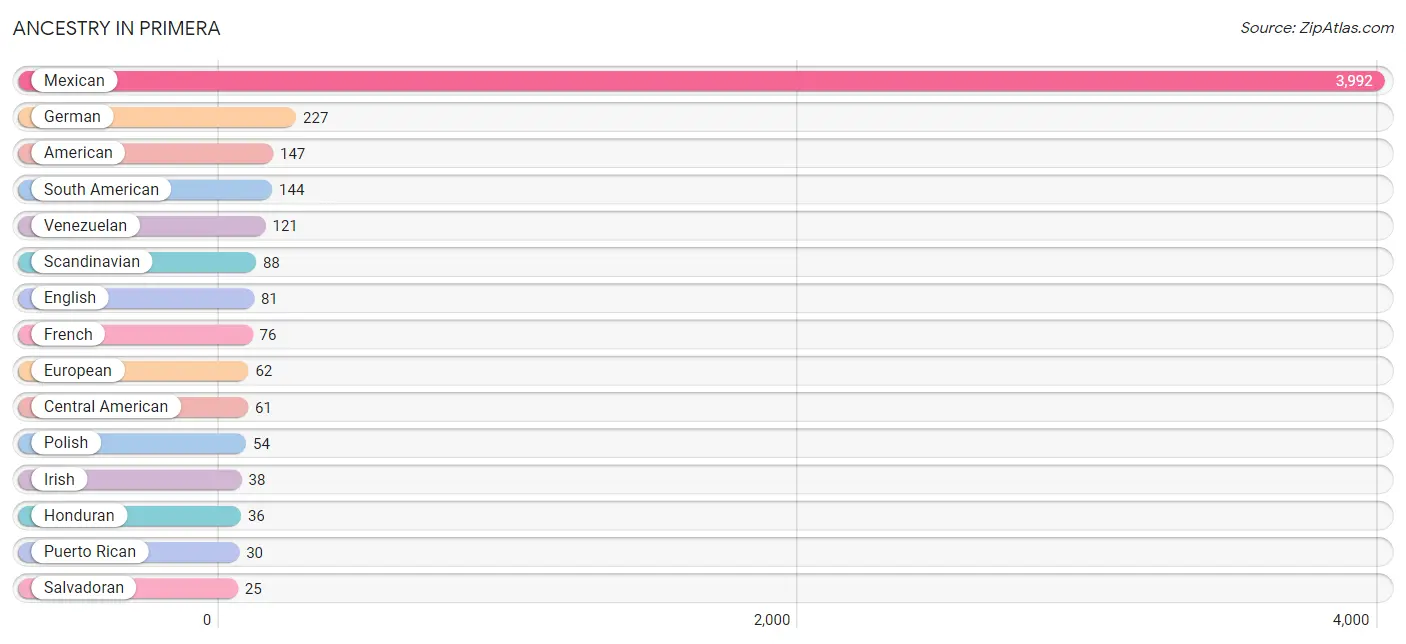
| Ancestry | # Population | % Population |
| American | 147 | 2.8% |
| Burmese | 6 | 0.1% |
| Central American | 61 | 1.2% |
| Ecuadorian | 23 | 0.4% |
| English | 81 | 1.5% |
| European | 62 | 1.2% |
| French | 76 | 1.5% |
| German | 227 | 4.3% |
| Honduran | 36 | 0.7% |
| Irish | 38 | 0.7% |
| Italian | 8 | 0.2% |
| Mexican | 3,992 | 76.5% |
| Polish | 54 | 1.0% |
| Puerto Rican | 30 | 0.6% |
| Salvadoran | 25 | 0.5% |
| Scandinavian | 88 | 1.7% |
| South American | 144 | 2.8% |
| Venezuelan | 121 | 2.3% | View All 18 Rows |
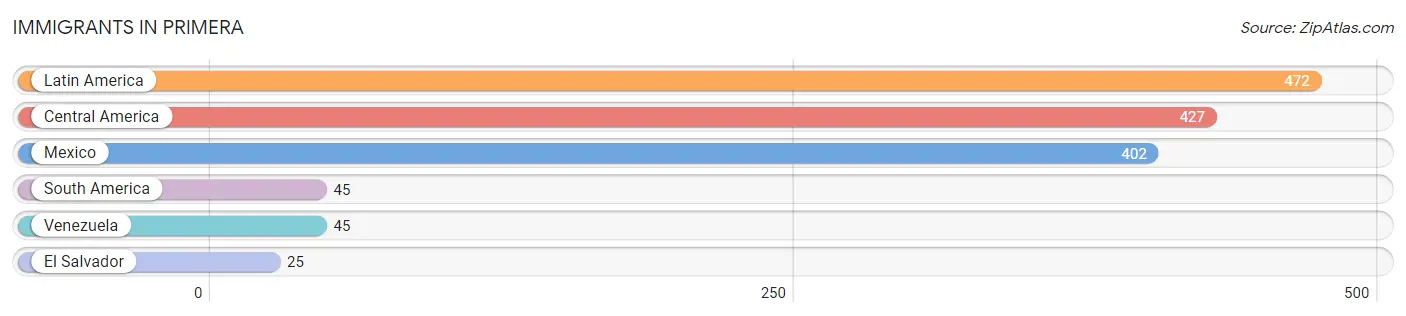
Immigrants in Primera
The most numerous immigrant groups reported in Primera came from Latin America (472 | 9.0%), Central America (427 | 8.2%), Mexico (402 | 7.7%), South America (45 | 0.9%), and Venezuela (45 | 0.9%), together accounting for 26.6% of all Primera residents.
| Immigration Origin | # Population | % Population |
| Central America | 427 | 8.2% |
| El Salvador | 25 | 0.5% |
| Latin America | 472 | 9.0% |
| Mexico | 402 | 7.7% |
| South America | 45 | 0.9% |
| Venezuela | 45 | 0.9% | View All 6 Rows |
Sex and Age in Primera
Sex and Age in Primera
The most populous age groups in Primera are Under 5 Years (365 | 13.0%) for men and 30 to 34 Years (244 | 10.1%) for women.
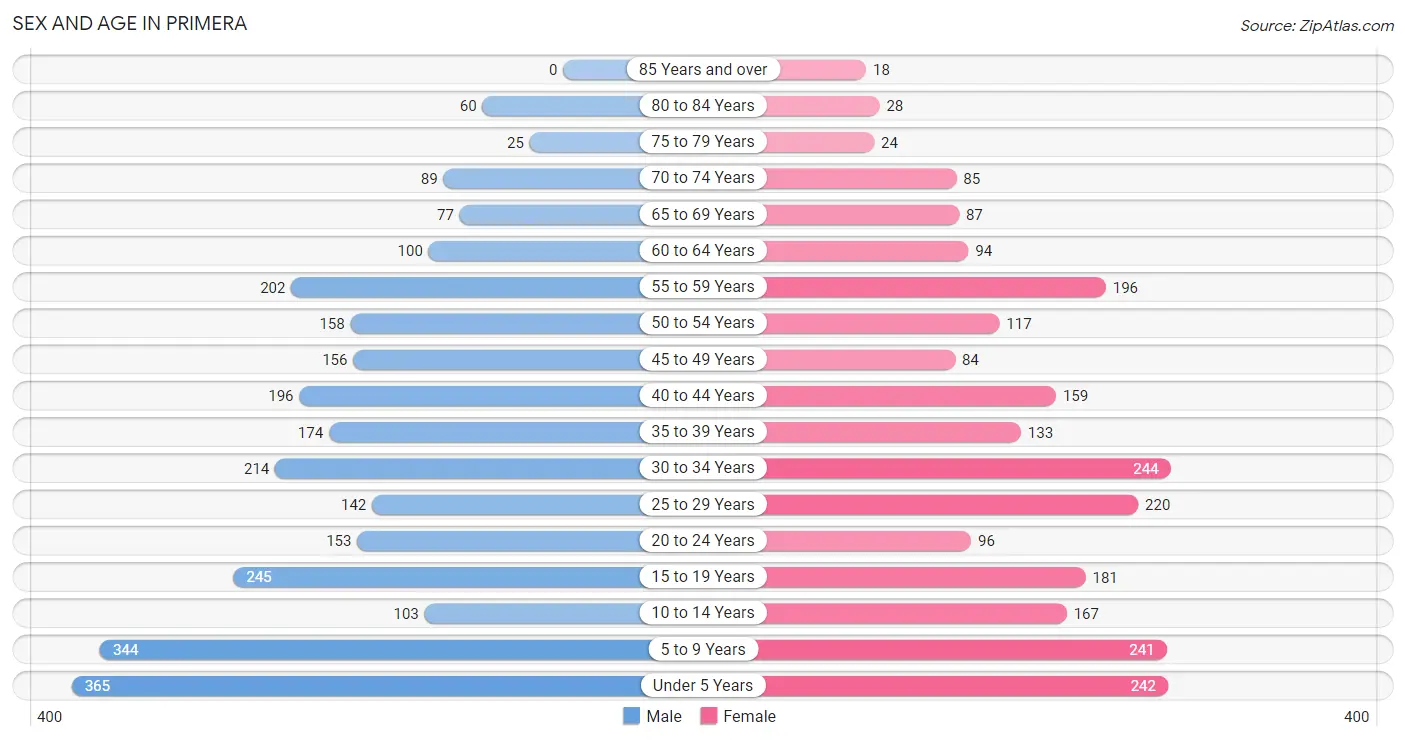
| Age Bracket | Male | Female |
| Under 5 Years | 365 (13.0%) | 242 (10.0%) |
| 5 to 9 Years | 344 (12.3%) | 241 (10.0%) |
| 10 to 14 Years | 103 (3.7%) | 167 (6.9%) |
| 15 to 19 Years | 245 (8.7%) | 181 (7.5%) |
| 20 to 24 Years | 153 (5.5%) | 96 (4.0%) |
| 25 to 29 Years | 142 (5.1%) | 220 (9.1%) |
| 30 to 34 Years | 214 (7.6%) | 244 (10.1%) |
| 35 to 39 Years | 174 (6.2%) | 133 (5.5%) |
| 40 to 44 Years | 196 (7.0%) | 159 (6.6%) |
| 45 to 49 Years | 156 (5.6%) | 84 (3.5%) |
| 50 to 54 Years | 158 (5.6%) | 117 (4.8%) |
| 55 to 59 Years | 202 (7.2%) | 196 (8.1%) |
| 60 to 64 Years | 100 (3.6%) | 94 (3.9%) |
| 65 to 69 Years | 77 (2.8%) | 87 (3.6%) |
| 70 to 74 Years | 89 (3.2%) | 85 (3.5%) |
| 75 to 79 Years | 25 (0.9%) | 24 (1.0%) |
| 80 to 84 Years | 60 (2.1%) | 28 (1.2%) |
| 85 Years and over | 0 (0.0%) | 18 (0.7%) |
| Total | 2,803 (100.0%) | 2,416 (100.0%) |
Families and Households in Primera
Median Family Size in Primera
The median family size in Primera is 4.01 persons per family, with single female/mother families (348 | 30.3%) accounting for the largest median family size of 5.03 persons per family. On the other hand, single male/father families (52 | 4.5%) represent the smallest median family size with 3.06 persons per family.
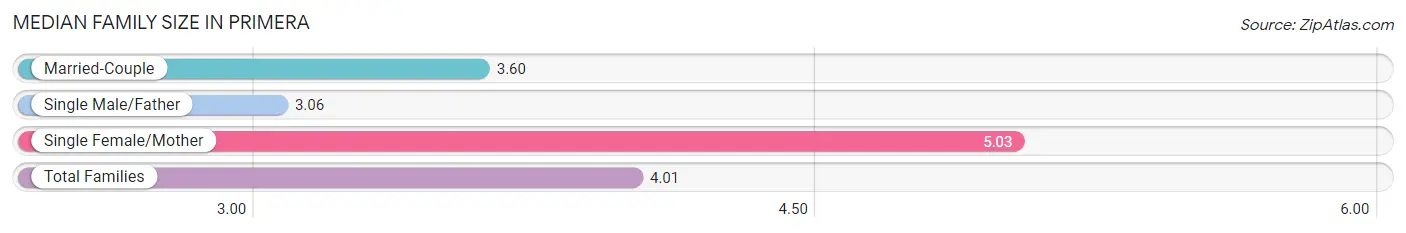
| Family Type | # Families | Family Size |
| Married-Couple | 747 (65.1%) | 3.60 |
| Single Male/Father | 52 (4.5%) | 3.06 |
| Single Female/Mother | 348 (30.3%) | 5.03 |
| Total Families | 1,147 (100.0%) | 4.01 |
Median Household Size in Primera
The median household size in Primera is 3.43 persons per household, with single female/mother households (348 | 22.9%) accounting for the largest median household size of 5.21 persons per household. non-family households (376 | 24.7%) represent the smallest median household size with 1.42 persons per household.
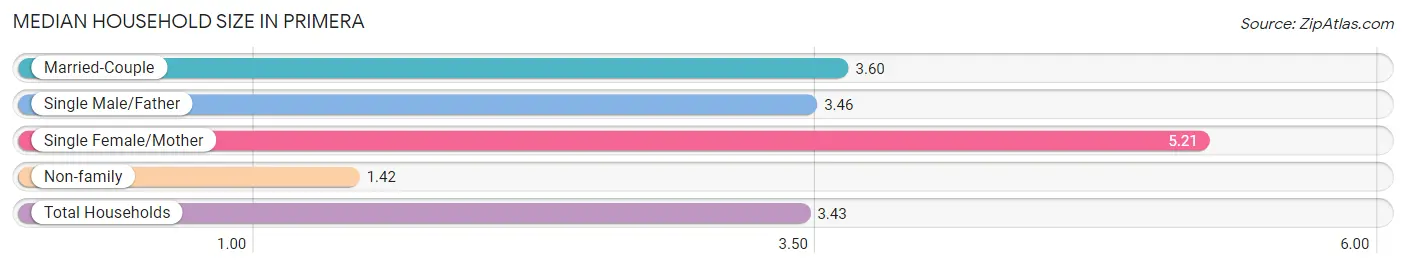
| Household Type | # Households | Household Size |
| Married-Couple | 747 (49.0%) | 3.60 |
| Single Male/Father | 52 (3.4%) | 3.46 |
| Single Female/Mother | 348 (22.9%) | 5.21 |
| Non-family | 376 (24.7%) | 1.42 |
| Total Households | 1,523 (100.0%) | 3.43 |
Household Size by Marriage Status in Primera
Out of a total of 1,523 households in Primera, 1,147 (75.3%) are family households, while 376 (24.7%) are nonfamily households. The most numerous type of family households are 3-person households, comprising 362, and the most common type of nonfamily households are 1-person households, comprising 284.
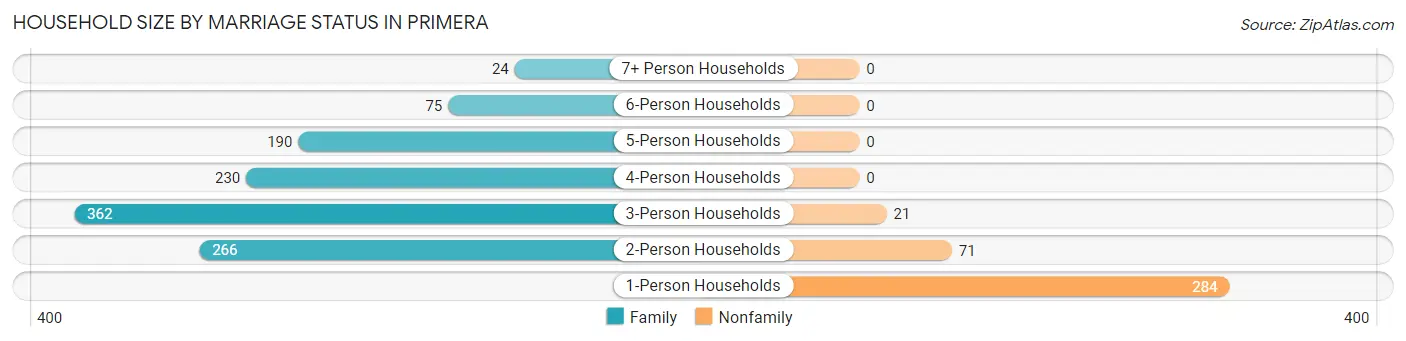
| Household Size | Family Households | Nonfamily Households |
| 1-Person Households | - | 284 (18.6%) |
| 2-Person Households | 266 (17.5%) | 71 (4.7%) |
| 3-Person Households | 362 (23.8%) | 21 (1.4%) |
| 4-Person Households | 230 (15.1%) | 0 (0.0%) |
| 5-Person Households | 190 (12.5%) | 0 (0.0%) |
| 6-Person Households | 75 (4.9%) | 0 (0.0%) |
| 7+ Person Households | 24 (1.6%) | 0 (0.0%) |
| Total | 1,147 (75.3%) | 376 (24.7%) |
Female Fertility in Primera
Fertility by Age in Primera
Average fertility rate in Primera is 110.0 births per 1,000 women. Women in the age bracket of 20 to 34 years have the highest fertility rate with 182.0 births per 1,000 women. Women in the age bracket of 20 to 34 years acount for 82.3% of all women with births.
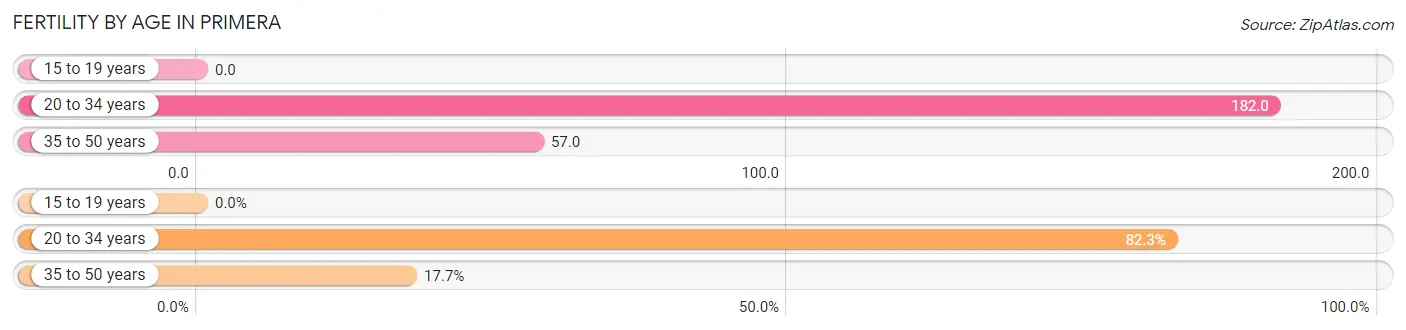
| Age Bracket | Women with Births | Births / 1,000 Women |
| 15 to 19 years | 0 (0.0%) | 0.0 |
| 20 to 34 years | 102 (82.3%) | 182.0 |
| 35 to 50 years | 22 (17.7%) | 57.0 |
| Total | 124 (100.0%) | 110.0 |
Fertility by Age by Marriage Status in Primera
80.6% of women with births (124) in Primera are married. The highest percentage of unmarried women with births falls into 20 to 34 years age bracket with 23.5% of them unmarried at the time of birth, while the lowest percentage of unmarried women with births belong to 35 to 50 years age bracket with 0.0% of them unmarried.
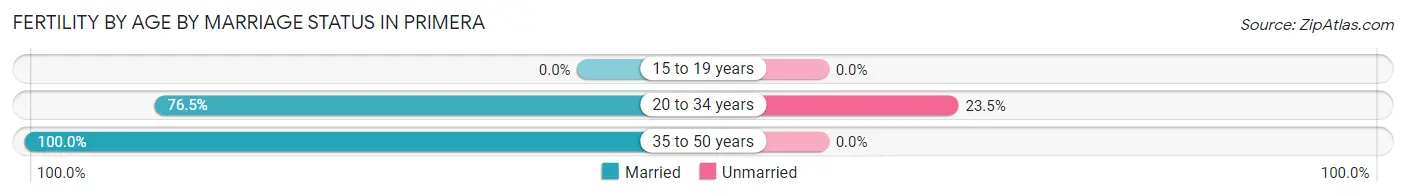
| Age Bracket | Married | Unmarried |
| 15 to 19 years | 0 (0.0%) | 0 (0.0%) |
| 20 to 34 years | 78 (76.5%) | 24 (23.5%) |
| 35 to 50 years | 22 (100.0%) | 0 (0.0%) |
| Total | 100 (80.6%) | 24 (19.4%) |
Fertility by Education in Primera
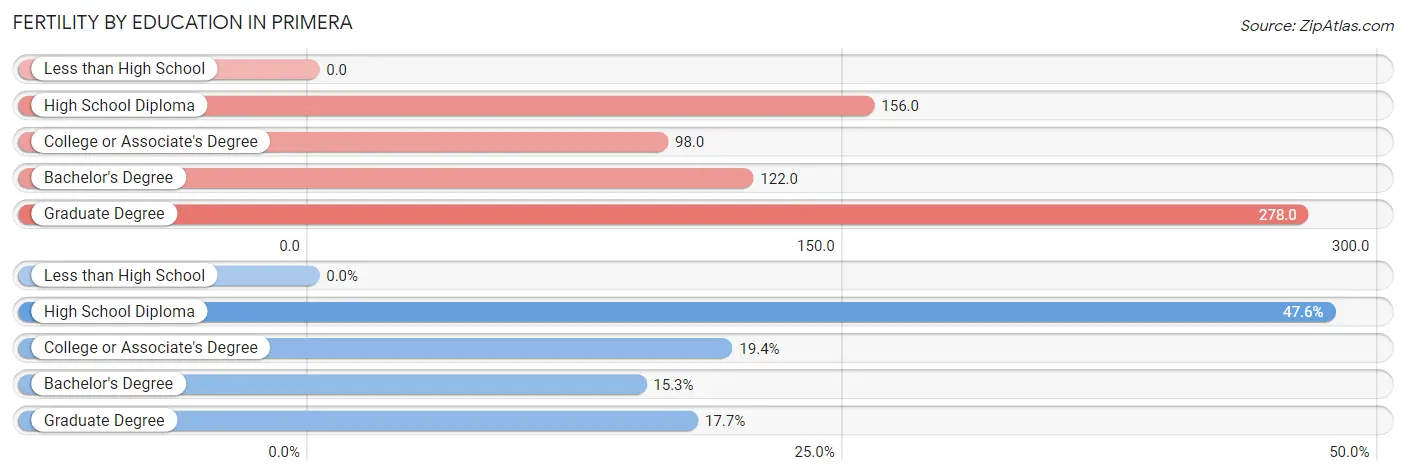
| Educational Attainment | Women with Births | Births / 1,000 Women |
| Less than High School | 0 (0.0%) | 0.0 |
| High School Diploma | 59 (47.6%) | 156.0 |
| College or Associate's Degree | 24 (19.4%) | 98.0 |
| Bachelor's Degree | 19 (15.3%) | 122.0 |
| Graduate Degree | 22 (17.7%) | 278.0 |
| Total | 124 (100.0%) | 110.0 |
Fertility by Education by Marriage Status in Primera
19.4% of women with births in Primera are unmarried. Women with the educational attainment of high school diploma are most likely to be married with 100.0% of them married at childbirth, while women with the educational attainment of college or associate's degree are least likely to be married with 100.0% of them unmarried at childbirth.
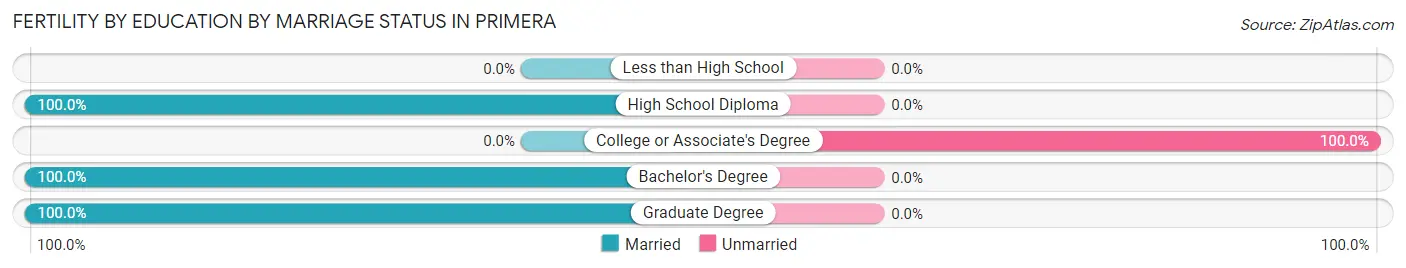
| Educational Attainment | Married | Unmarried |
| Less than High School | 0 (0.0%) | 0 (0.0%) |
| High School Diploma | 59 (100.0%) | 0 (0.0%) |
| College or Associate's Degree | 0 (0.0%) | 24 (100.0%) |
| Bachelor's Degree | 19 (100.0%) | 0 (0.0%) |
| Graduate Degree | 22 (100.0%) | 0 (0.0%) |
| Total | 100 (80.6%) | 24 (19.4%) |
Employment Characteristics in Primera
Employment by Class of Employer in Primera
Among the 2,635 employed individuals in Primera, private company employees (1,679 | 63.7%), local government employees (300 | 11.4%), and not-for-profit organizations (184 | 7.0%) make up the most common classes of employment.
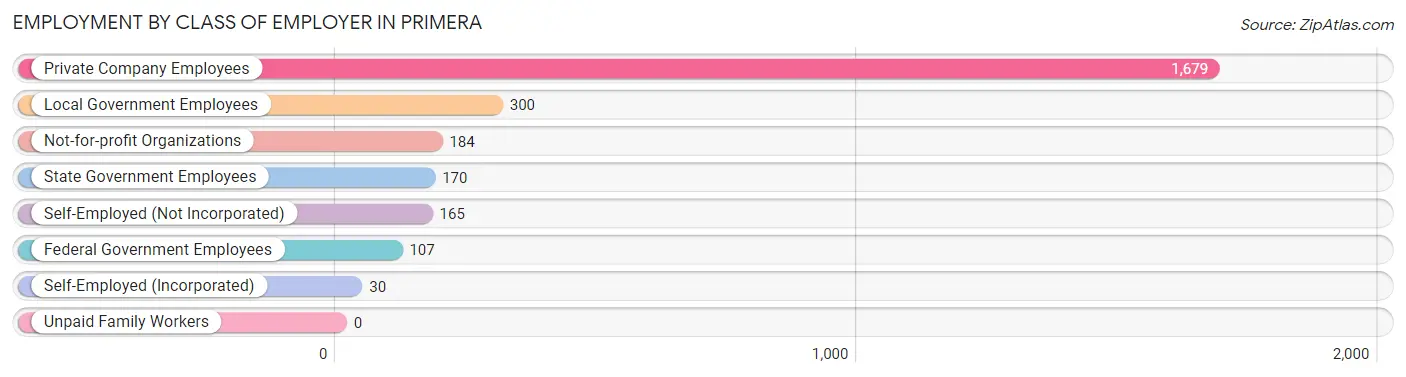
| Employer Class | # Employees | % Employees |
| Private Company Employees | 1,679 | 63.7% |
| Self-Employed (Incorporated) | 30 | 1.1% |
| Self-Employed (Not Incorporated) | 165 | 6.3% |
| Not-for-profit Organizations | 184 | 7.0% |
| Local Government Employees | 300 | 11.4% |
| State Government Employees | 170 | 6.5% |
| Federal Government Employees | 107 | 4.1% |
| Unpaid Family Workers | 0 | 0.0% |
| Total | 2,635 | 100.0% |
Employment Status by Age in Primera
According to the labor force statistics for Primera, out of the total population over 16 years of age (3,654), 75.9% or 2,773 individuals are in the labor force, with 2.8% or 78 of them unemployed. The age group with the highest labor force participation rate is 55 to 59 years, with 95.2% or 379 individuals in the labor force. Within the labor force, the 20 to 24 years age range has the highest percentage of unemployed individuals, with 15.1% or 35 of them being unemployed.
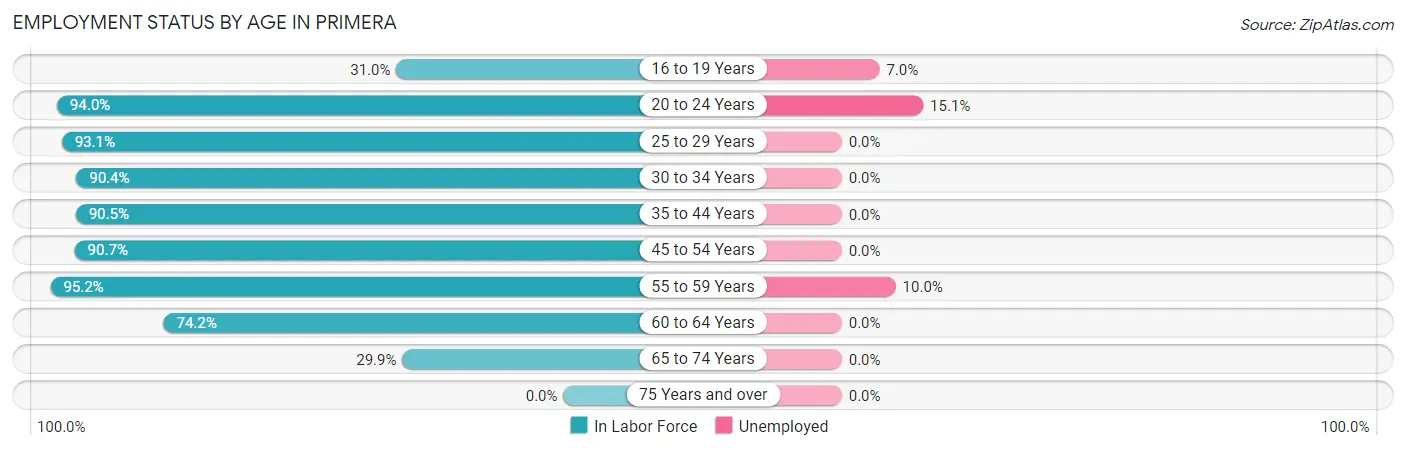
| Age Bracket | In Labor Force | Unemployed |
| 16 to 19 Years | 100 (31.0%) | 7 (7.0%) |
| 20 to 24 Years | 234 (94.0%) | 35 (15.1%) |
| 25 to 29 Years | 337 (93.1%) | 0 (0.0%) |
| 30 to 34 Years | 414 (90.4%) | 0 (0.0%) |
| 35 to 44 Years | 599 (90.5%) | 0 (0.0%) |
| 45 to 54 Years | 467 (90.7%) | 0 (0.0%) |
| 55 to 59 Years | 379 (95.2%) | 38 (10.0%) |
| 60 to 64 Years | 144 (74.2%) | 0 (0.0%) |
| 65 to 74 Years | 101 (29.9%) | 0 (0.0%) |
| 75 Years and over | 0 (0.0%) | 0 (0.0%) |
| Total | 2,773 (75.9%) | 78 (2.8%) |
Employment Status by Educational Attainment in Primera
According to labor force statistics for Primera, 90.4% of individuals (2,340) out of the total population between 25 and 64 years of age (2,589) are in the labor force, with 1.6% or 37 of them being unemployed. The group with the highest labor force participation rate are those with the educational attainment of college / associate degree, with 93.8% or 721 individuals in the labor force. Within the labor force, individuals with college / associate degree education have the highest percentage of unemployment, with 5.3% or 38 of them being unemployed.
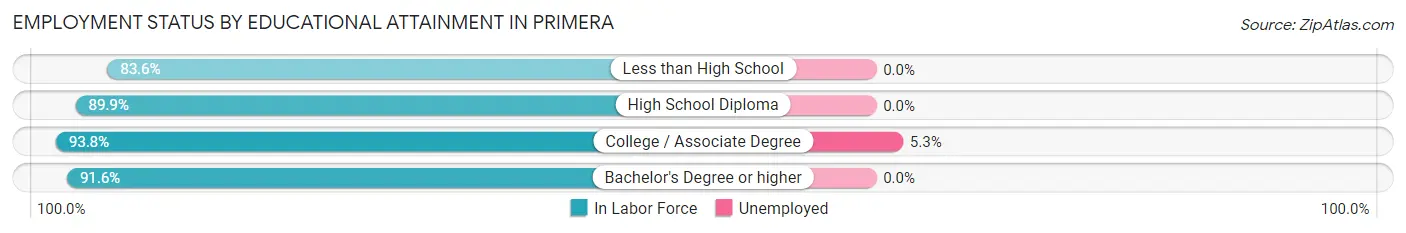
| Educational Attainment | In Labor Force | Unemployed |
| Less than High School | 363 (83.6%) | 0 (0.0%) |
| High School Diploma | 691 (89.9%) | 0 (0.0%) |
| College / Associate Degree | 721 (93.8%) | 41 (5.3%) |
| Bachelor's Degree or higher | 565 (91.6%) | 0 (0.0%) |
| Total | 2,340 (90.4%) | 41 (1.6%) |
Employment Occupations by Sex in Primera
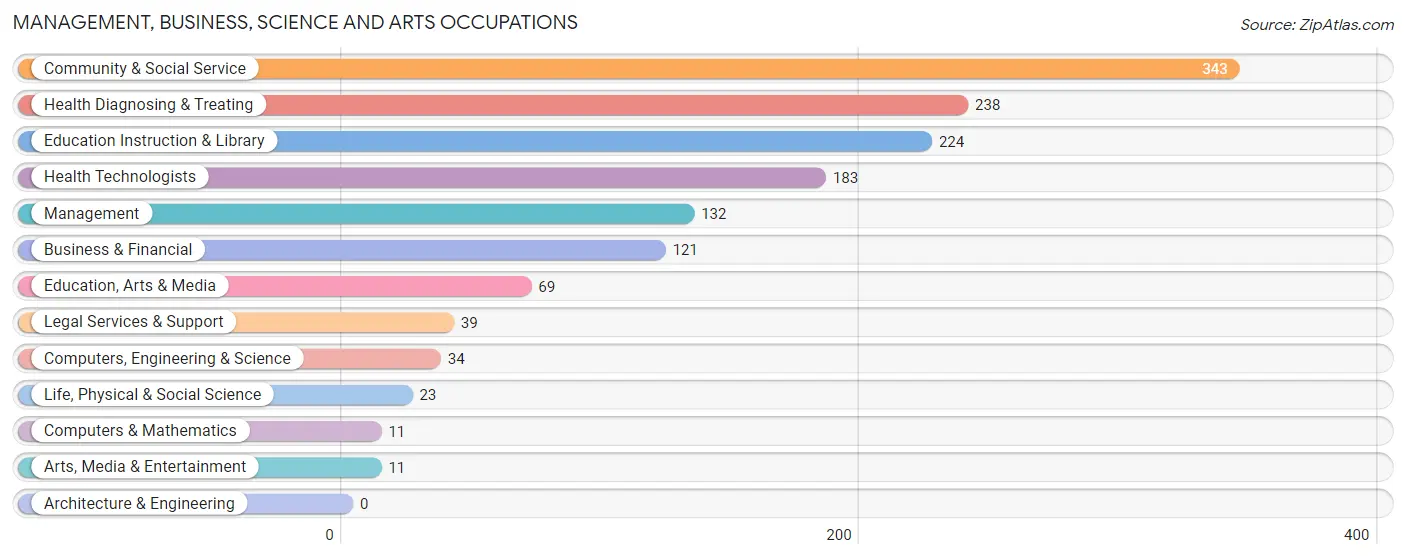
Management, Business, Science and Arts Occupations
The most common Management, Business, Science and Arts occupations in Primera are Community & Social Service (343 | 12.8%), Health Diagnosing & Treating (238 | 8.9%), Education Instruction & Library (224 | 8.4%), Health Technologists (183 | 6.8%), and Management (132 | 4.9%).
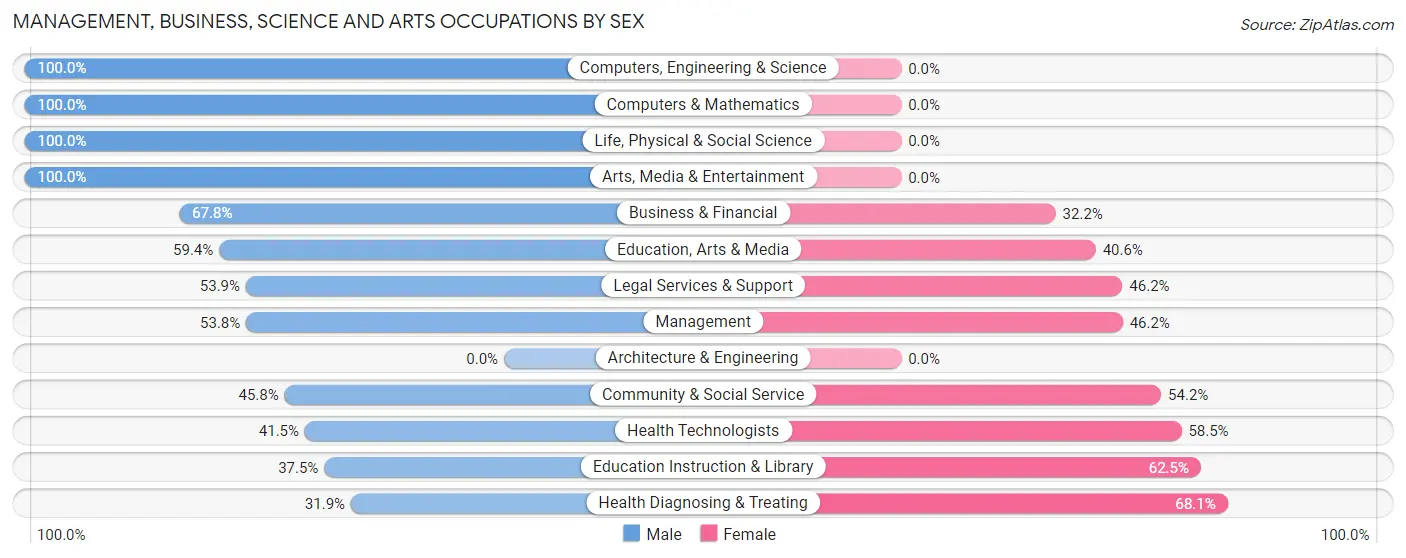
Management, Business, Science and Arts Occupations by Sex
Within the Management, Business, Science and Arts occupations in Primera, the most male-oriented occupations are Computers, Engineering & Science (100.0%), Computers & Mathematics (100.0%), and Life, Physical & Social Science (100.0%), while the most female-oriented occupations are Health Diagnosing & Treating (68.1%), Education Instruction & Library (62.5%), and Health Technologists (58.5%).
| Occupation | Male | Female |
| Management | 71 (53.8%) | 61 (46.2%) |
| Business & Financial | 82 (67.8%) | 39 (32.2%) |
| Computers, Engineering & Science | 34 (100.0%) | 0 (0.0%) |
| Computers & Mathematics | 11 (100.0%) | 0 (0.0%) |
| Architecture & Engineering | 0 (0.0%) | 0 (0.0%) |
| Life, Physical & Social Science | 23 (100.0%) | 0 (0.0%) |
| Community & Social Service | 157 (45.8%) | 186 (54.2%) |
| Education, Arts & Media | 41 (59.4%) | 28 (40.6%) |
| Legal Services & Support | 21 (53.8%) | 18 (46.2%) |
| Education Instruction & Library | 84 (37.5%) | 140 (62.5%) |
| Arts, Media & Entertainment | 11 (100.0%) | 0 (0.0%) |
| Health Diagnosing & Treating | 76 (31.9%) | 162 (68.1%) |
| Health Technologists | 76 (41.5%) | 107 (58.5%) |
| Total (Category) | 420 (48.4%) | 448 (51.6%) |
| Total (Overall) | 1,493 (55.7%) | 1,189 (44.3%) |
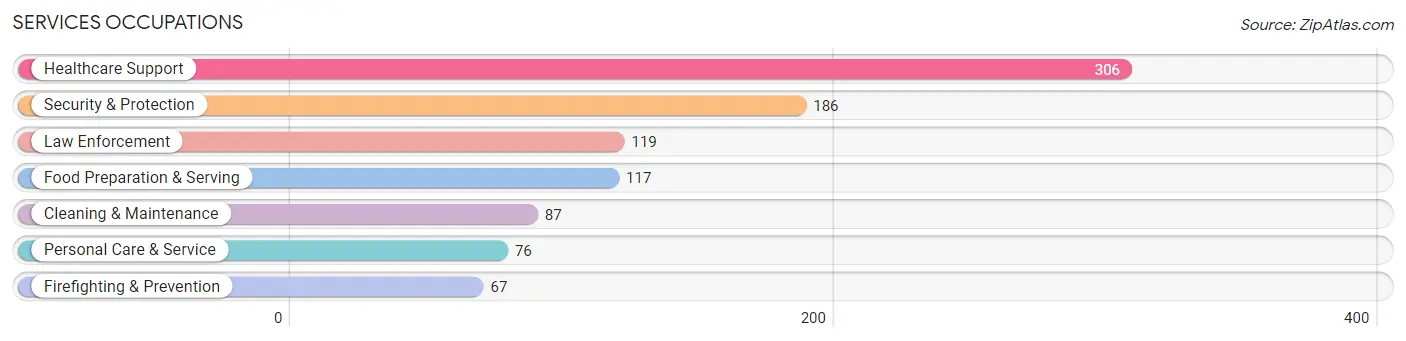
Services Occupations
The most common Services occupations in Primera are Healthcare Support (306 | 11.4%), Security & Protection (186 | 6.9%), Law Enforcement (119 | 4.4%), Food Preparation & Serving (117 | 4.4%), and Cleaning & Maintenance (87 | 3.2%).
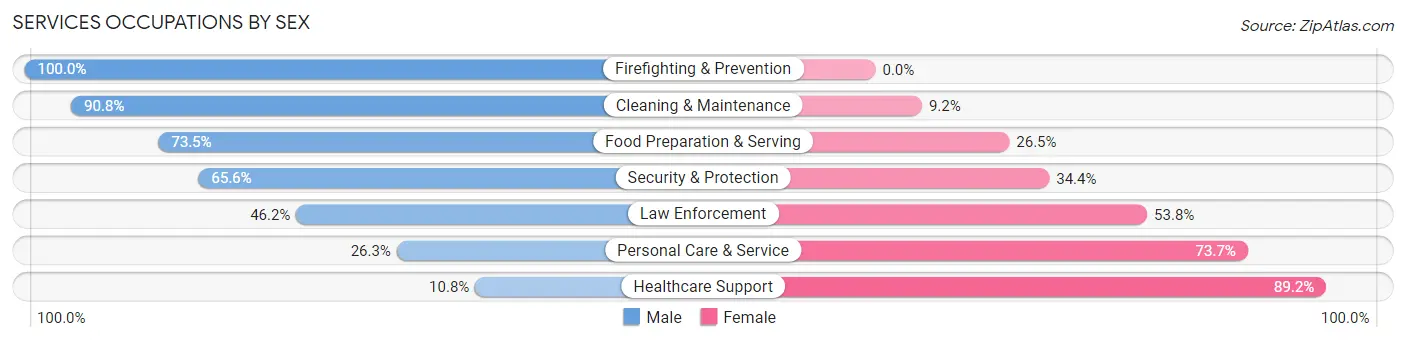
Services Occupations by Sex
Within the Services occupations in Primera, the most male-oriented occupations are Firefighting & Prevention (100.0%), Cleaning & Maintenance (90.8%), and Food Preparation & Serving (73.5%), while the most female-oriented occupations are Healthcare Support (89.2%), Personal Care & Service (73.7%), and Law Enforcement (53.8%).
| Occupation | Male | Female |
| Healthcare Support | 33 (10.8%) | 273 (89.2%) |
| Security & Protection | 122 (65.6%) | 64 (34.4%) |
| Firefighting & Prevention | 67 (100.0%) | 0 (0.0%) |
| Law Enforcement | 55 (46.2%) | 64 (53.8%) |
| Food Preparation & Serving | 86 (73.5%) | 31 (26.5%) |
| Cleaning & Maintenance | 79 (90.8%) | 8 (9.2%) |
| Personal Care & Service | 20 (26.3%) | 56 (73.7%) |
| Total (Category) | 340 (44.0%) | 432 (56.0%) |
| Total (Overall) | 1,493 (55.7%) | 1,189 (44.3%) |
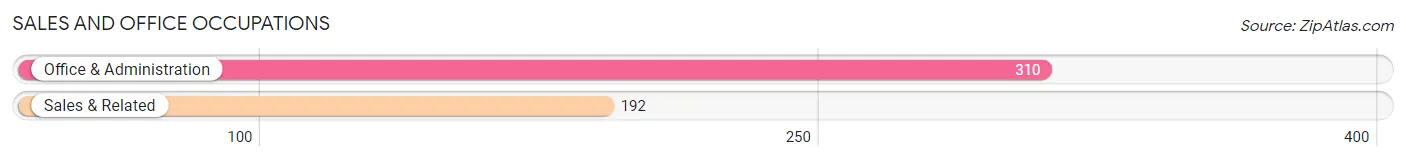
Sales and Office Occupations
The most common Sales and Office occupations in Primera are Office & Administration (310 | 11.6%), and Sales & Related (192 | 7.2%).
Sales and Office Occupations by Sex
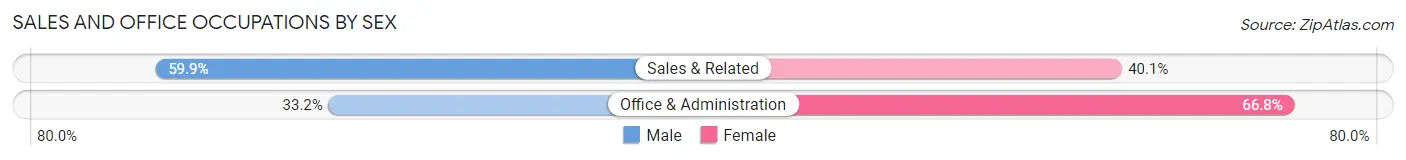
| Occupation | Male | Female |
| Sales & Related | 115 (59.9%) | 77 (40.1%) |
| Office & Administration | 103 (33.2%) | 207 (66.8%) |
| Total (Category) | 218 (43.4%) | 284 (56.6%) |
| Total (Overall) | 1,493 (55.7%) | 1,189 (44.3%) |
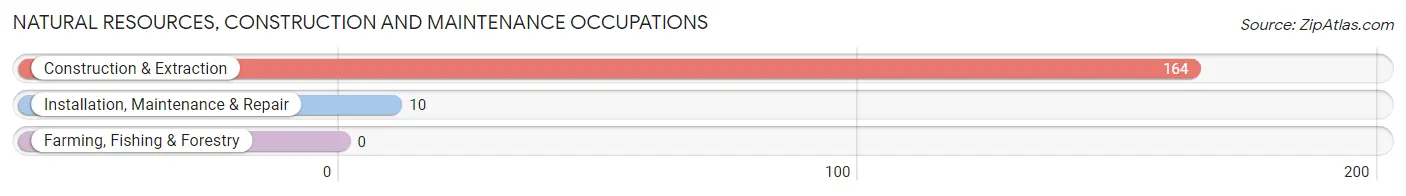
Natural Resources, Construction and Maintenance Occupations
The most common Natural Resources, Construction and Maintenance occupations in Primera are Construction & Extraction (164 | 6.1%), and Installation, Maintenance & Repair (10 | 0.4%).
Natural Resources, Construction and Maintenance Occupations by Sex
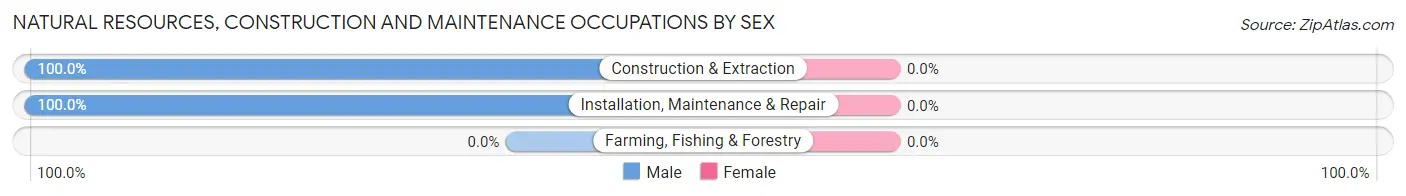
| Occupation | Male | Female |
| Farming, Fishing & Forestry | 0 (0.0%) | 0 (0.0%) |
| Construction & Extraction | 164 (100.0%) | 0 (0.0%) |
| Installation, Maintenance & Repair | 10 (100.0%) | 0 (0.0%) |
| Total (Category) | 174 (100.0%) | 0 (0.0%) |
| Total (Overall) | 1,493 (55.7%) | 1,189 (44.3%) |
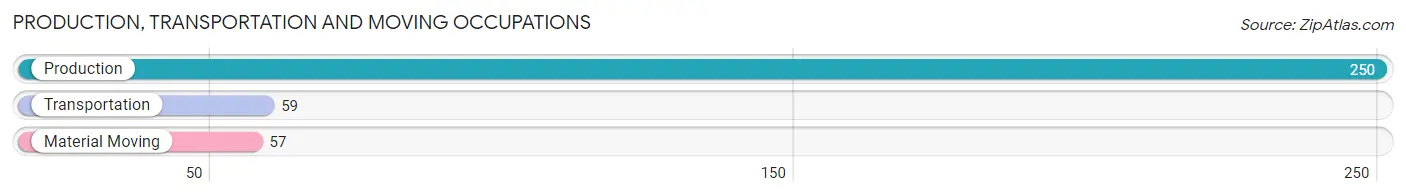
Production, Transportation and Moving Occupations
The most common Production, Transportation and Moving occupations in Primera are Production (250 | 9.3%), Transportation (59 | 2.2%), and Material Moving (57 | 2.1%).
Production, Transportation and Moving Occupations by Sex
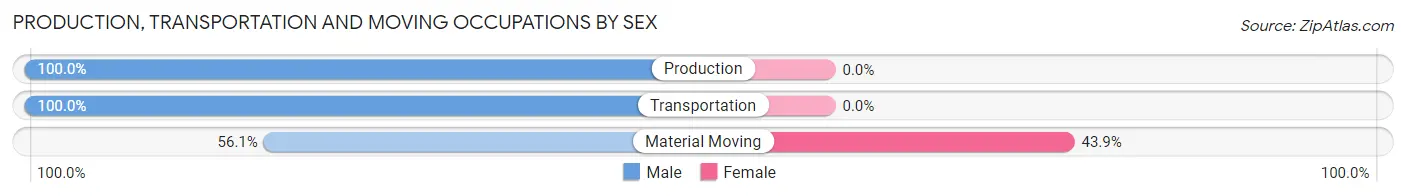
| Occupation | Male | Female |
| Production | 250 (100.0%) | 0 (0.0%) |
| Transportation | 59 (100.0%) | 0 (0.0%) |
| Material Moving | 32 (56.1%) | 25 (43.9%) |
| Total (Category) | 341 (93.2%) | 25 (6.8%) |
| Total (Overall) | 1,493 (55.7%) | 1,189 (44.3%) |
Employment Industries by Sex in Primera
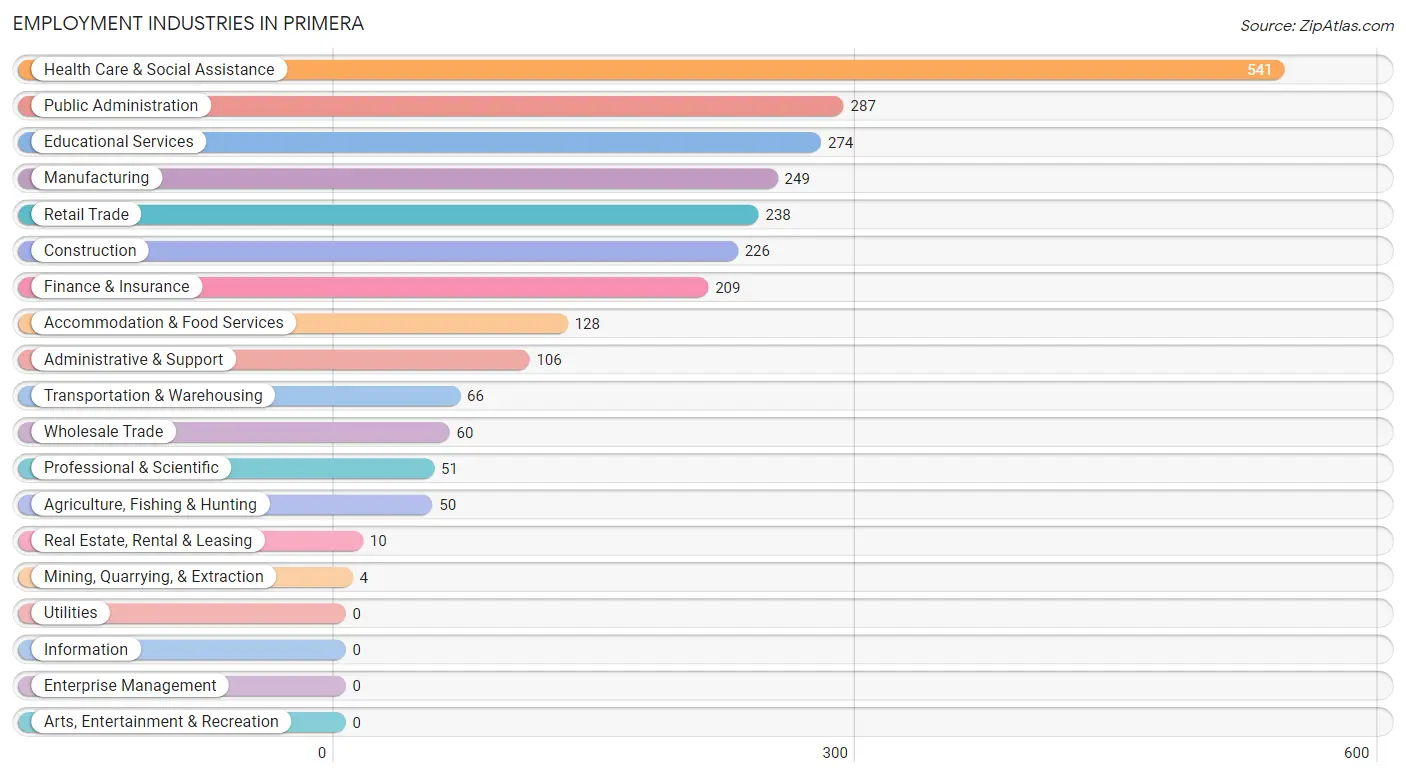
Employment Industries in Primera
The major employment industries in Primera include Health Care & Social Assistance (541 | 20.2%), Public Administration (287 | 10.7%), Educational Services (274 | 10.2%), Manufacturing (249 | 9.3%), and Retail Trade (238 | 8.9%).
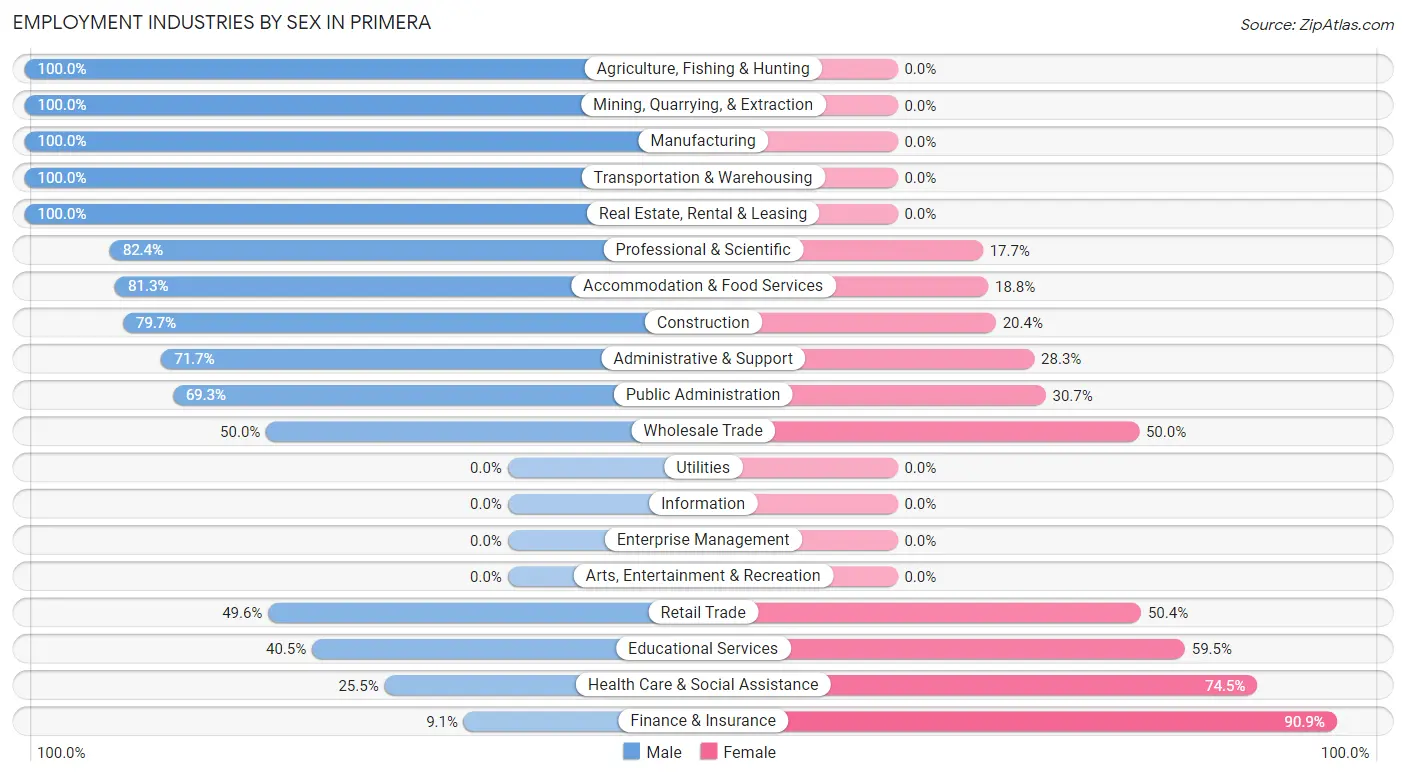
Employment Industries by Sex in Primera
The Primera industries that see more men than women are Agriculture, Fishing & Hunting (100.0%), Mining, Quarrying, & Extraction (100.0%), and Manufacturing (100.0%), whereas the industries that tend to have a higher number of women are Finance & Insurance (90.9%), Health Care & Social Assistance (74.5%), and Educational Services (59.5%).
| Industry | Male | Female |
| Agriculture, Fishing & Hunting | 50 (100.0%) | 0 (0.0%) |
| Mining, Quarrying, & Extraction | 4 (100.0%) | 0 (0.0%) |
| Construction | 180 (79.6%) | 46 (20.3%) |
| Manufacturing | 249 (100.0%) | 0 (0.0%) |
| Wholesale Trade | 30 (50.0%) | 30 (50.0%) |
| Retail Trade | 118 (49.6%) | 120 (50.4%) |
| Transportation & Warehousing | 66 (100.0%) | 0 (0.0%) |
| Utilities | 0 (0.0%) | 0 (0.0%) |
| Information | 0 (0.0%) | 0 (0.0%) |
| Finance & Insurance | 19 (9.1%) | 190 (90.9%) |
| Real Estate, Rental & Leasing | 10 (100.0%) | 0 (0.0%) |
| Professional & Scientific | 42 (82.4%) | 9 (17.6%) |
| Enterprise Management | 0 (0.0%) | 0 (0.0%) |
| Administrative & Support | 76 (71.7%) | 30 (28.3%) |
| Educational Services | 111 (40.5%) | 163 (59.5%) |
| Health Care & Social Assistance | 138 (25.5%) | 403 (74.5%) |
| Arts, Entertainment & Recreation | 0 (0.0%) | 0 (0.0%) |
| Accommodation & Food Services | 104 (81.2%) | 24 (18.8%) |
| Public Administration | 199 (69.3%) | 88 (30.7%) |
| Total | 1,493 (55.7%) | 1,189 (44.3%) |
Education in Primera
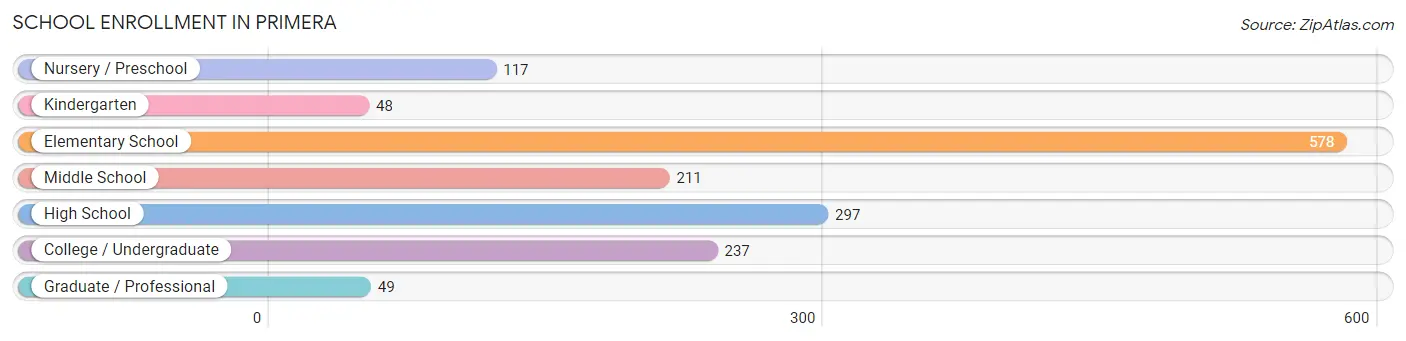
School Enrollment in Primera
The most common levels of schooling among the 1,537 students in Primera are elementary school (578 | 37.6%), high school (297 | 19.3%), and college / undergraduate (237 | 15.4%).
| School Level | # Students | % Students |
| Nursery / Preschool | 117 | 7.6% |
| Kindergarten | 48 | 3.1% |
| Elementary School | 578 | 37.6% |
| Middle School | 211 | 13.7% |
| High School | 297 | 19.3% |
| College / Undergraduate | 237 | 15.4% |
| Graduate / Professional | 49 | 3.2% |
| Total | 1,537 | 100.0% |
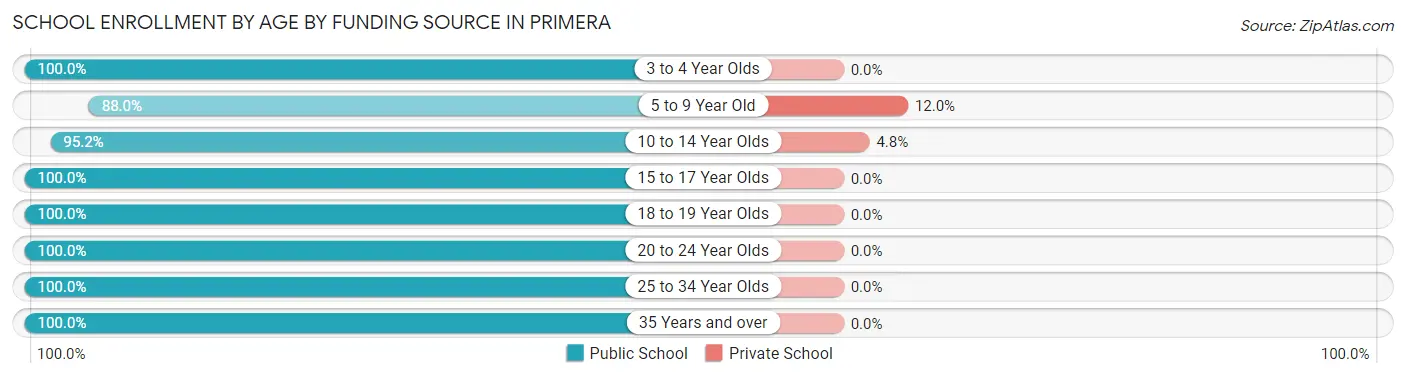
School Enrollment by Age by Funding Source in Primera
Out of a total of 1,537 students who are enrolled in schools in Primera, 83 (5.4%) attend a private institution, while the remaining 1,454 (94.6%) are enrolled in public schools. The age group of 5 to 9 year old has the highest likelihood of being enrolled in private schools, with 70 (12.0% in the age bracket) enrolled. Conversely, the age group of 3 to 4 year olds has the lowest likelihood of being enrolled in a private school, with 117 (100.0% in the age bracket) attending a public institution.
| Age Bracket | Public School | Private School |
| 3 to 4 Year Olds | 117 (100.0%) | 0 (0.0%) |
| 5 to 9 Year Old | 515 (88.0%) | 70 (12.0%) |
| 10 to 14 Year Olds | 257 (95.2%) | 13 (4.8%) |
| 15 to 17 Year Olds | 270 (100.0%) | 0 (0.0%) |
| 18 to 19 Year Olds | 80 (100.0%) | 0 (0.0%) |
| 20 to 24 Year Olds | 33 (100.0%) | 0 (0.0%) |
| 25 to 34 Year Olds | 55 (100.0%) | 0 (0.0%) |
| 35 Years and over | 127 (100.0%) | 0 (0.0%) |
| Total | 1,454 (94.6%) | 83 (5.4%) |
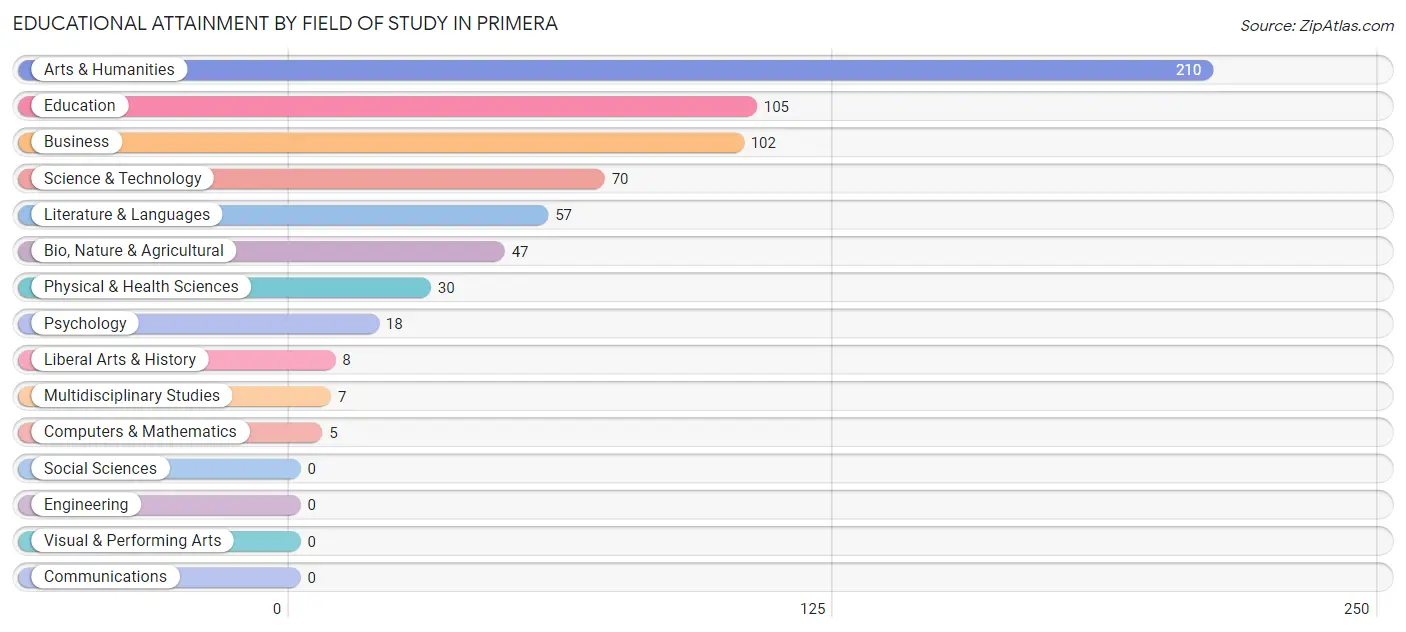
Educational Attainment by Field of Study in Primera
Arts & humanities (210 | 31.9%), education (105 | 15.9%), business (102 | 15.5%), science & technology (70 | 10.6%), and literature & languages (57 | 8.6%) are the most common fields of study among 659 individuals in Primera who have obtained a bachelor's degree or higher.
| Field of Study | # Graduates | % Graduates |
| Computers & Mathematics | 5 | 0.8% |
| Bio, Nature & Agricultural | 47 | 7.1% |
| Physical & Health Sciences | 30 | 4.5% |
| Psychology | 18 | 2.7% |
| Social Sciences | 0 | 0.0% |
| Engineering | 0 | 0.0% |
| Multidisciplinary Studies | 7 | 1.1% |
| Science & Technology | 70 | 10.6% |
| Business | 102 | 15.5% |
| Education | 105 | 15.9% |
| Literature & Languages | 57 | 8.6% |
| Liberal Arts & History | 8 | 1.2% |
| Visual & Performing Arts | 0 | 0.0% |
| Communications | 0 | 0.0% |
| Arts & Humanities | 210 | 31.9% |
| Total | 659 | 100.0% |
Transportation & Commute in Primera
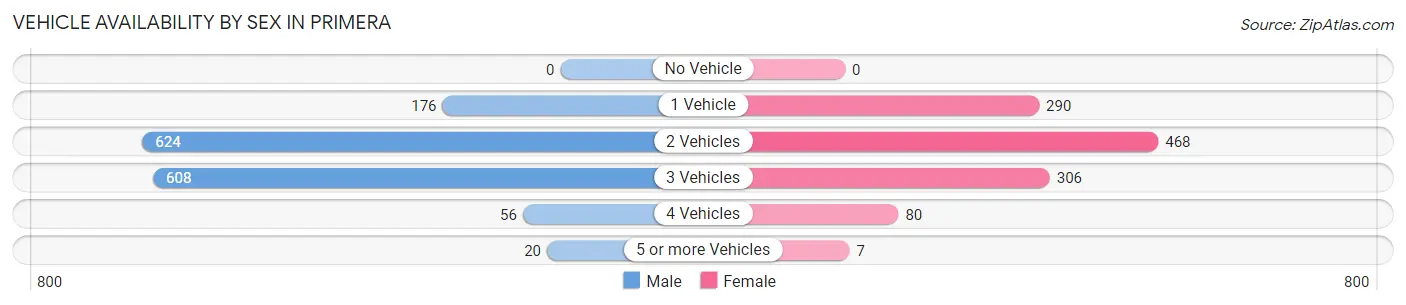
Vehicle Availability by Sex in Primera
The most prevalent vehicle ownership categories in Primera are males with 2 vehicles (624, accounting for 42.0%) and females with 2 vehicles (468, making up 54.2%).
| Vehicles Available | Male | Female |
| No Vehicle | 0 (0.0%) | 0 (0.0%) |
| 1 Vehicle | 176 (11.9%) | 290 (25.2%) |
| 2 Vehicles | 624 (42.0%) | 468 (40.7%) |
| 3 Vehicles | 608 (41.0%) | 306 (26.6%) |
| 4 Vehicles | 56 (3.8%) | 80 (7.0%) |
| 5 or more Vehicles | 20 (1.3%) | 7 (0.6%) |
| Total | 1,484 (100.0%) | 1,151 (100.0%) |
Commute Time in Primera
The most frequently occuring commute durations in Primera are 10 to 14 minutes (816 commuters, 34.7%), 15 to 19 minutes (421 commuters, 17.9%), and 5 to 9 minutes (267 commuters, 11.4%).
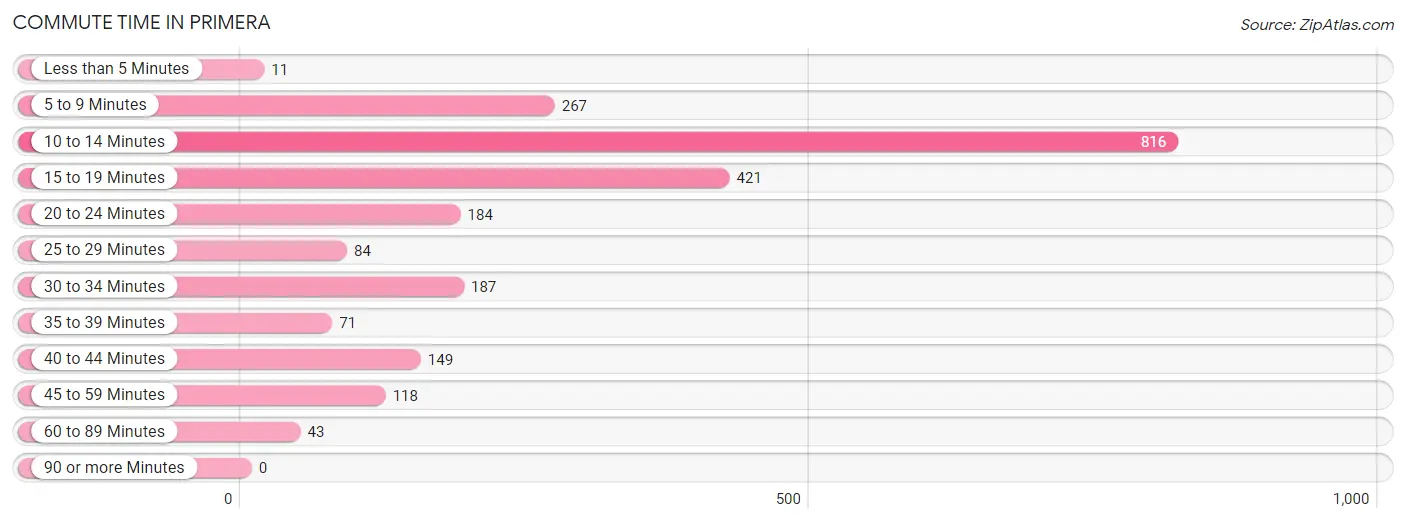
| Commute Time | # Commuters | % Commuters |
| Less than 5 Minutes | 11 | 0.5% |
| 5 to 9 Minutes | 267 | 11.4% |
| 10 to 14 Minutes | 816 | 34.7% |
| 15 to 19 Minutes | 421 | 17.9% |
| 20 to 24 Minutes | 184 | 7.8% |
| 25 to 29 Minutes | 84 | 3.6% |
| 30 to 34 Minutes | 187 | 8.0% |
| 35 to 39 Minutes | 71 | 3.0% |
| 40 to 44 Minutes | 149 | 6.3% |
| 45 to 59 Minutes | 118 | 5.0% |
| 60 to 89 Minutes | 43 | 1.8% |
| 90 or more Minutes | 0 | 0.0% |
Commute Time by Sex in Primera
The most common commute times in Primera are 10 to 14 minutes (451 commuters, 33.3%) for males and 10 to 14 minutes (365 commuters, 36.6%) for females.
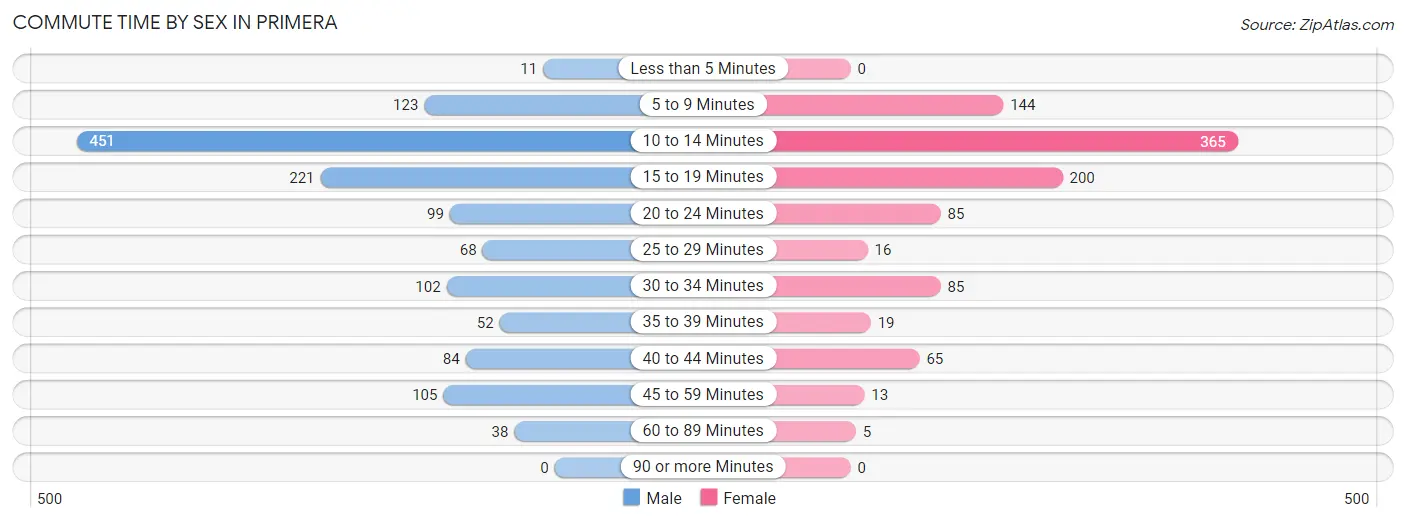
| Commute Time | Male | Female |
| Less than 5 Minutes | 11 (0.8%) | 0 (0.0%) |
| 5 to 9 Minutes | 123 (9.1%) | 144 (14.4%) |
| 10 to 14 Minutes | 451 (33.3%) | 365 (36.6%) |
| 15 to 19 Minutes | 221 (16.3%) | 200 (20.1%) |
| 20 to 24 Minutes | 99 (7.3%) | 85 (8.5%) |
| 25 to 29 Minutes | 68 (5.0%) | 16 (1.6%) |
| 30 to 34 Minutes | 102 (7.5%) | 85 (8.5%) |
| 35 to 39 Minutes | 52 (3.8%) | 19 (1.9%) |
| 40 to 44 Minutes | 84 (6.2%) | 65 (6.5%) |
| 45 to 59 Minutes | 105 (7.7%) | 13 (1.3%) |
| 60 to 89 Minutes | 38 (2.8%) | 5 (0.5%) |
| 90 or more Minutes | 0 (0.0%) | 0 (0.0%) |
Time of Departure to Work by Sex in Primera
The most frequent times of departure to work in Primera are 6:30 AM to 6:59 AM (221, 16.3%) for males and 8:00 AM to 8:29 AM (334, 33.5%) for females.
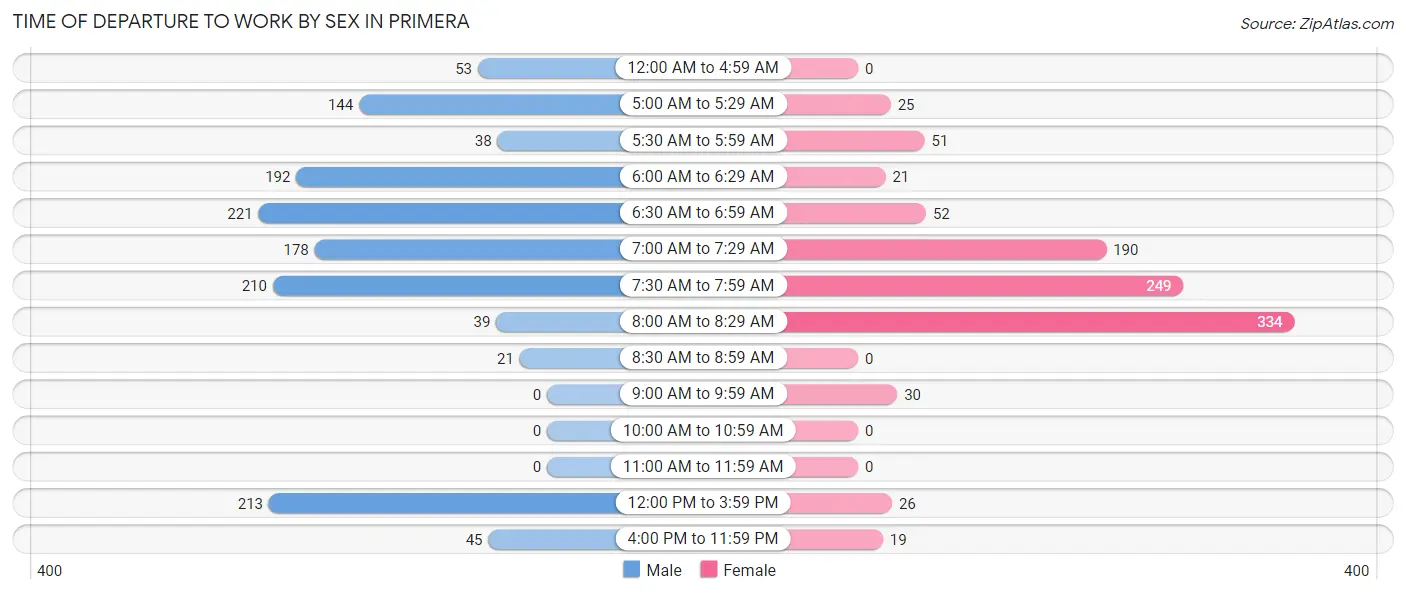
| Time of Departure | Male | Female |
| 12:00 AM to 4:59 AM | 53 (3.9%) | 0 (0.0%) |
| 5:00 AM to 5:29 AM | 144 (10.6%) | 25 (2.5%) |
| 5:30 AM to 5:59 AM | 38 (2.8%) | 51 (5.1%) |
| 6:00 AM to 6:29 AM | 192 (14.2%) | 21 (2.1%) |
| 6:30 AM to 6:59 AM | 221 (16.3%) | 52 (5.2%) |
| 7:00 AM to 7:29 AM | 178 (13.2%) | 190 (19.1%) |
| 7:30 AM to 7:59 AM | 210 (15.5%) | 249 (25.0%) |
| 8:00 AM to 8:29 AM | 39 (2.9%) | 334 (33.5%) |
| 8:30 AM to 8:59 AM | 21 (1.5%) | 0 (0.0%) |
| 9:00 AM to 9:59 AM | 0 (0.0%) | 30 (3.0%) |
| 10:00 AM to 10:59 AM | 0 (0.0%) | 0 (0.0%) |
| 11:00 AM to 11:59 AM | 0 (0.0%) | 0 (0.0%) |
| 12:00 PM to 3:59 PM | 213 (15.7%) | 26 (2.6%) |
| 4:00 PM to 11:59 PM | 45 (3.3%) | 19 (1.9%) |
| Total | 1,354 (100.0%) | 997 (100.0%) |
Housing Occupancy in Primera
Occupancy by Ownership in Primera
Of the total 1,523 dwellings in Primera, owner-occupied units account for 1,193 (78.3%), while renter-occupied units make up 330 (21.7%).
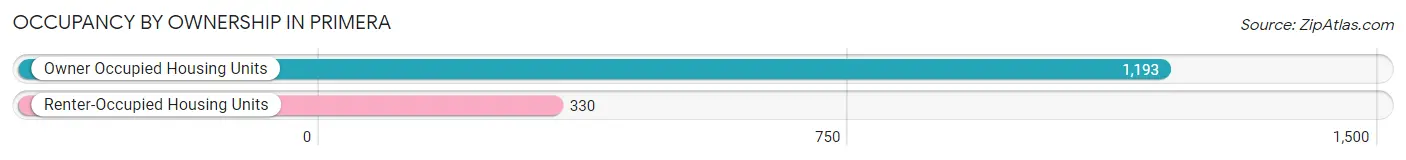
| Occupancy | # Housing Units | % Housing Units |
| Owner Occupied Housing Units | 1,193 | 78.3% |
| Renter-Occupied Housing Units | 330 | 21.7% |
| Total Occupied Housing Units | 1,523 | 100.0% |
Occupancy by Household Size in Primera
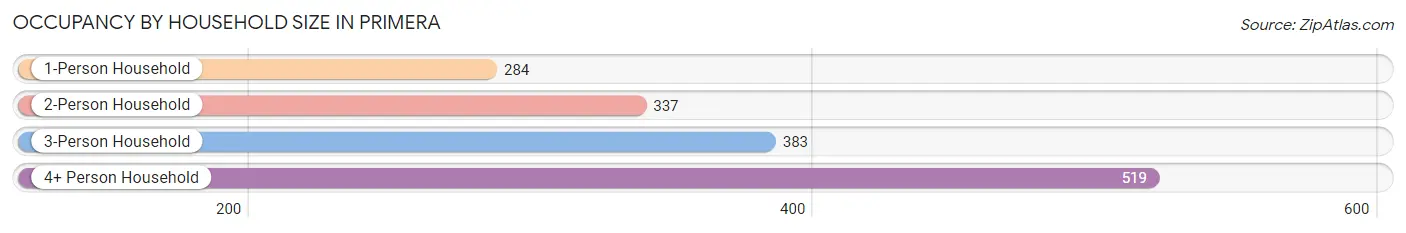
| Household Size | # Housing Units | % Housing Units |
| 1-Person Household | 284 | 18.6% |
| 2-Person Household | 337 | 22.1% |
| 3-Person Household | 383 | 25.2% |
| 4+ Person Household | 519 | 34.1% |
| Total Housing Units | 1,523 | 100.0% |
Occupancy by Ownership by Household Size in Primera
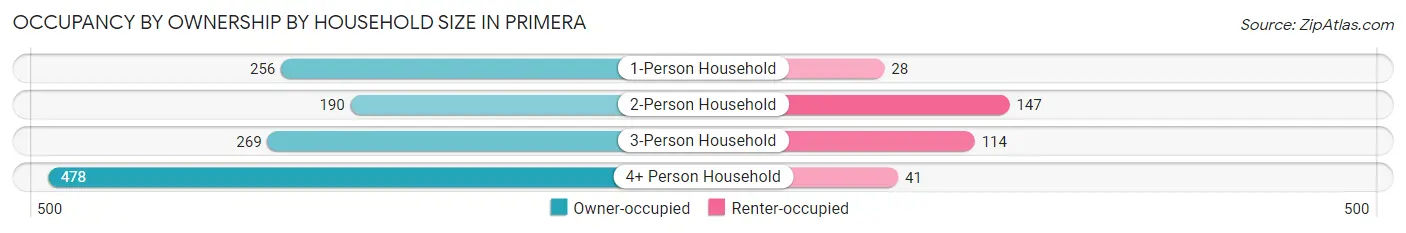
| Household Size | Owner-occupied | Renter-occupied |
| 1-Person Household | 256 (90.1%) | 28 (9.9%) |
| 2-Person Household | 190 (56.4%) | 147 (43.6%) |
| 3-Person Household | 269 (70.2%) | 114 (29.8%) |
| 4+ Person Household | 478 (92.1%) | 41 (7.9%) |
| Total Housing Units | 1,193 (78.3%) | 330 (21.7%) |
Occupancy by Educational Attainment in Primera
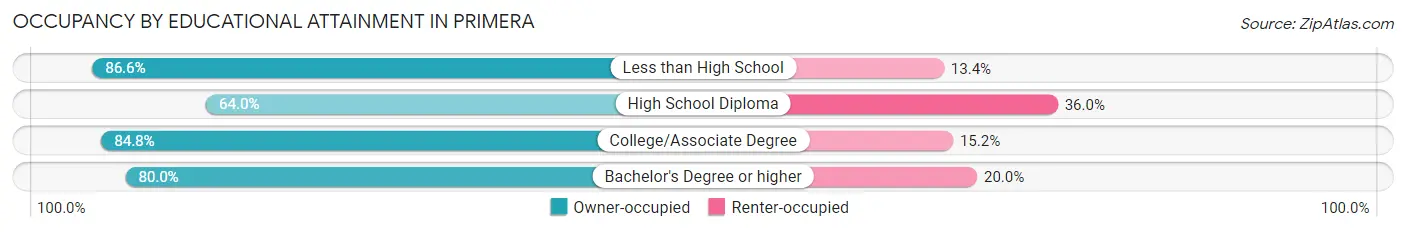
| Household Size | Owner-occupied | Renter-occupied |
| Less than High School | 232 (86.6%) | 36 (13.4%) |
| High School Diploma | 256 (64.0%) | 144 (36.0%) |
| College/Associate Degree | 373 (84.8%) | 67 (15.2%) |
| Bachelor's Degree or higher | 332 (80.0%) | 83 (20.0%) |
Occupancy by Age of Householder in Primera
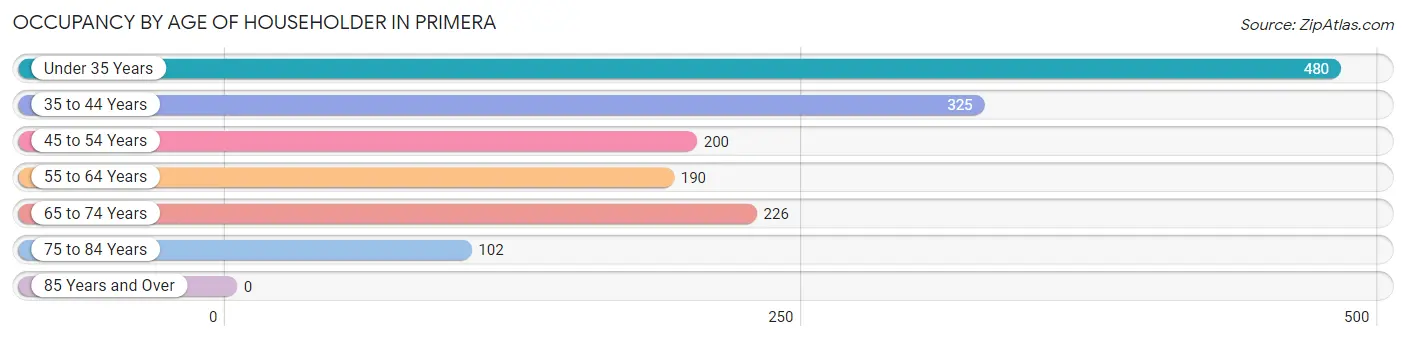
| Age Bracket | # Households | % Households |
| Under 35 Years | 480 | 31.5% |
| 35 to 44 Years | 325 | 21.3% |
| 45 to 54 Years | 200 | 13.1% |
| 55 to 64 Years | 190 | 12.5% |
| 65 to 74 Years | 226 | 14.8% |
| 75 to 84 Years | 102 | 6.7% |
| 85 Years and Over | 0 | 0.0% |
| Total | 1,523 | 100.0% |
Housing Finances in Primera
Median Income by Occupancy in Primera
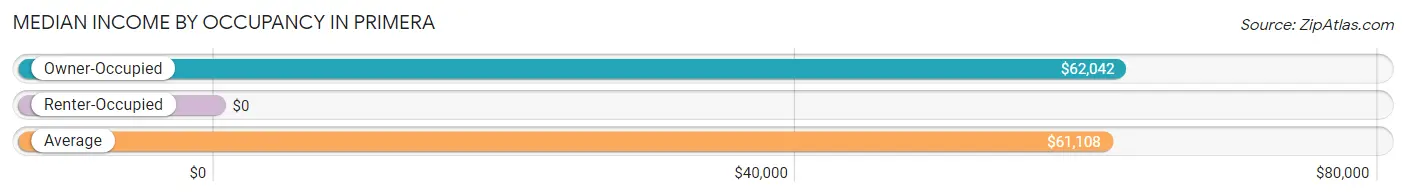
| Occupancy Type | # Households | Median Income |
| Owner-Occupied | 1,193 (78.3%) | $62,042 |
| Renter-Occupied | 330 (21.7%) | $0 |
| Average | 1,523 (100.0%) | $61,108 |
Occupancy by Householder Income Bracket in Primera
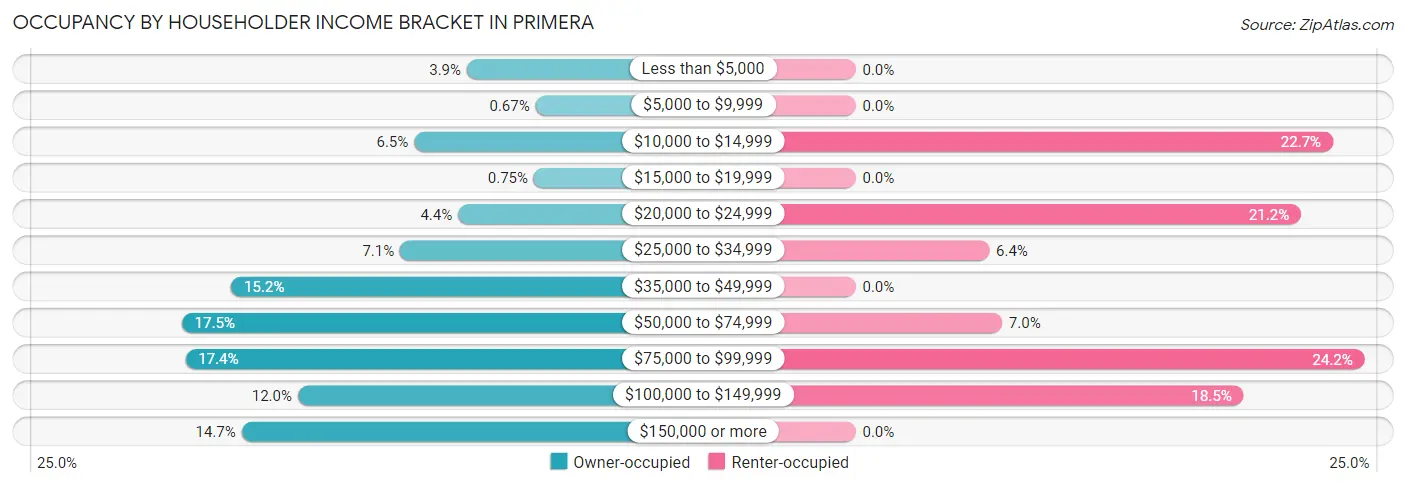
| Income Bracket | Owner-occupied | Renter-occupied |
| Less than $5,000 | 47 (3.9%) | 0 (0.0%) |
| $5,000 to $9,999 | 8 (0.7%) | 0 (0.0%) |
| $10,000 to $14,999 | 77 (6.5%) | 75 (22.7%) |
| $15,000 to $19,999 | 9 (0.7%) | 0 (0.0%) |
| $20,000 to $24,999 | 52 (4.4%) | 70 (21.2%) |
| $25,000 to $34,999 | 85 (7.1%) | 21 (6.4%) |
| $35,000 to $49,999 | 181 (15.2%) | 0 (0.0%) |
| $50,000 to $74,999 | 209 (17.5%) | 23 (7.0%) |
| $75,000 to $99,999 | 207 (17.3%) | 80 (24.2%) |
| $100,000 to $149,999 | 143 (12.0%) | 61 (18.5%) |
| $150,000 or more | 175 (14.7%) | 0 (0.0%) |
| Total | 1,193 (100.0%) | 330 (100.0%) |
Monthly Housing Cost Tiers in Primera
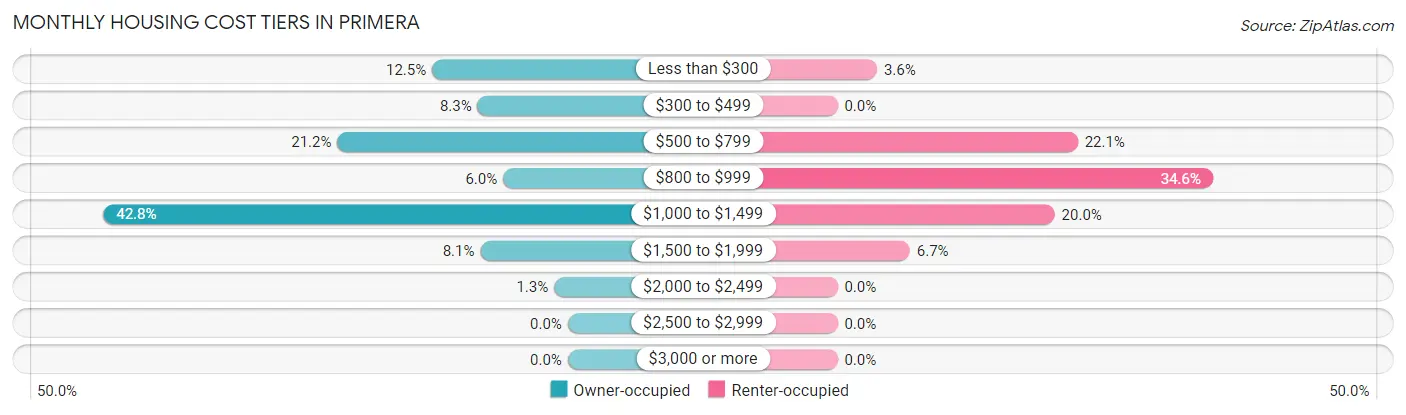
| Monthly Cost | Owner-occupied | Renter-occupied |
| Less than $300 | 149 (12.5%) | 12 (3.6%) |
| $300 to $499 | 99 (8.3%) | 0 (0.0%) |
| $500 to $799 | 253 (21.2%) | 73 (22.1%) |
| $800 to $999 | 71 (5.9%) | 114 (34.5%) |
| $1,000 to $1,499 | 510 (42.7%) | 66 (20.0%) |
| $1,500 to $1,999 | 96 (8.1%) | 22 (6.7%) |
| $2,000 to $2,499 | 15 (1.3%) | 0 (0.0%) |
| $2,500 to $2,999 | 0 (0.0%) | 0 (0.0%) |
| $3,000 or more | 0 (0.0%) | 0 (0.0%) |
| Total | 1,193 (100.0%) | 330 (100.0%) |
Physical Housing Characteristics in Primera
Housing Structures in Primera
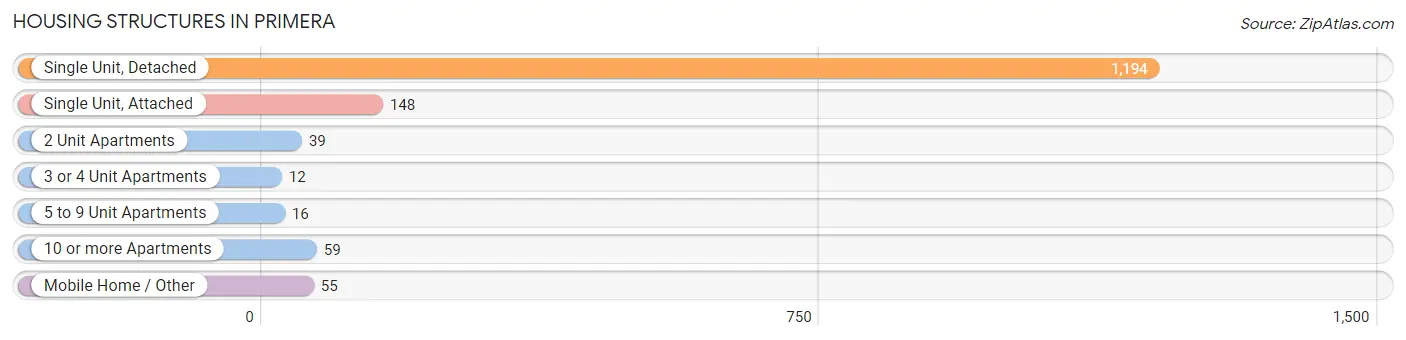
| Structure Type | # Housing Units | % Housing Units |
| Single Unit, Detached | 1,194 | 78.4% |
| Single Unit, Attached | 148 | 9.7% |
| 2 Unit Apartments | 39 | 2.6% |
| 3 or 4 Unit Apartments | 12 | 0.8% |
| 5 to 9 Unit Apartments | 16 | 1.1% |
| 10 or more Apartments | 59 | 3.9% |
| Mobile Home / Other | 55 | 3.6% |
| Total | 1,523 | 100.0% |
Housing Structures by Occupancy in Primera
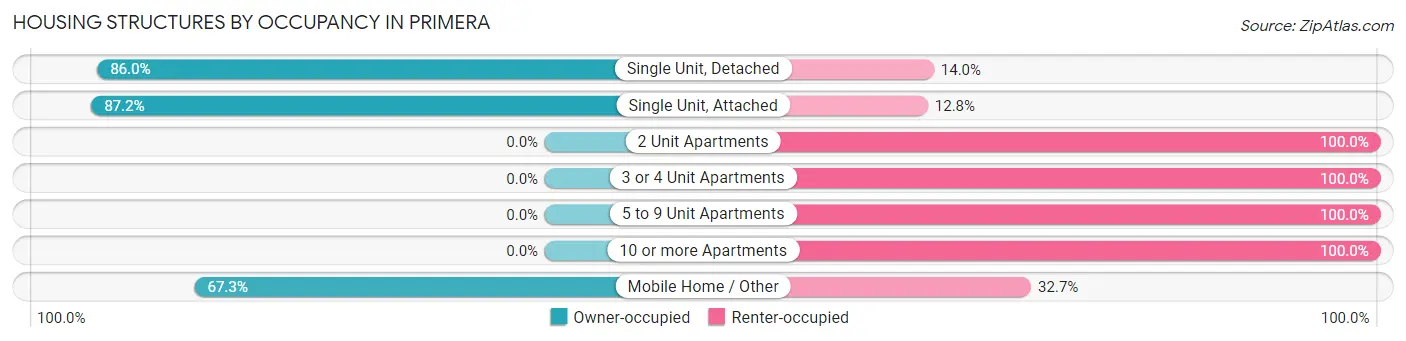
| Structure Type | Owner-occupied | Renter-occupied |
| Single Unit, Detached | 1,027 (86.0%) | 167 (14.0%) |
| Single Unit, Attached | 129 (87.2%) | 19 (12.8%) |
| 2 Unit Apartments | 0 (0.0%) | 39 (100.0%) |
| 3 or 4 Unit Apartments | 0 (0.0%) | 12 (100.0%) |
| 5 to 9 Unit Apartments | 0 (0.0%) | 16 (100.0%) |
| 10 or more Apartments | 0 (0.0%) | 59 (100.0%) |
| Mobile Home / Other | 37 (67.3%) | 18 (32.7%) |
| Total | 1,193 (78.3%) | 330 (21.7%) |
Housing Structures by Number of Rooms in Primera
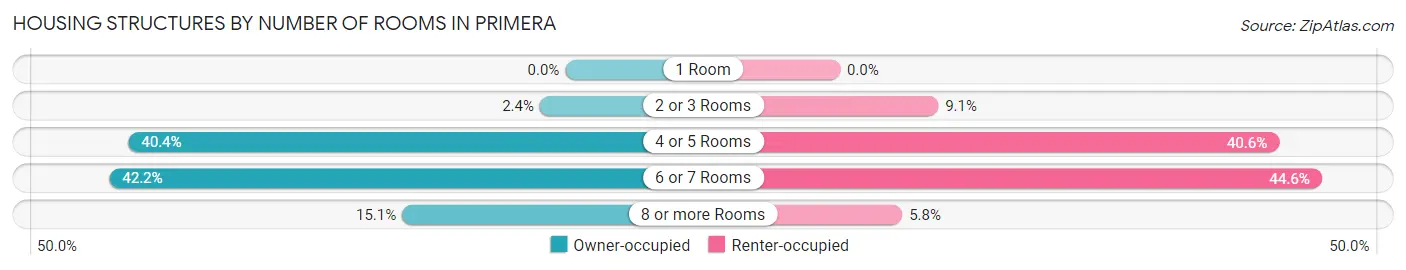
| Number of Rooms | Owner-occupied | Renter-occupied |
| 1 Room | 0 (0.0%) | 0 (0.0%) |
| 2 or 3 Rooms | 28 (2.4%) | 30 (9.1%) |
| 4 or 5 Rooms | 482 (40.4%) | 134 (40.6%) |
| 6 or 7 Rooms | 503 (42.2%) | 147 (44.6%) |
| 8 or more Rooms | 180 (15.1%) | 19 (5.8%) |
| Total | 1,193 (100.0%) | 330 (100.0%) |
Housing Structure by Heating Type in Primera
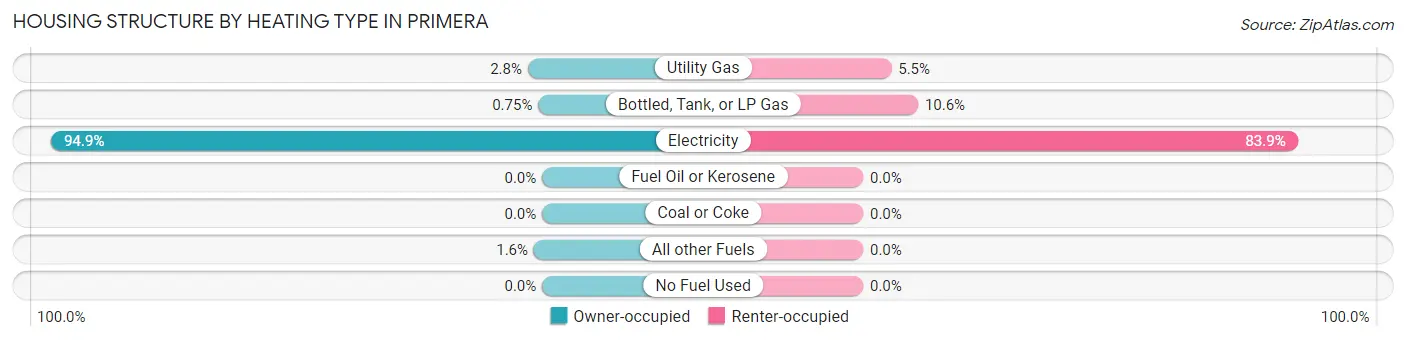
| Heating Type | Owner-occupied | Renter-occupied |
| Utility Gas | 33 (2.8%) | 18 (5.4%) |
| Bottled, Tank, or LP Gas | 9 (0.7%) | 35 (10.6%) |
| Electricity | 1,132 (94.9%) | 277 (83.9%) |
| Fuel Oil or Kerosene | 0 (0.0%) | 0 (0.0%) |
| Coal or Coke | 0 (0.0%) | 0 (0.0%) |
| All other Fuels | 19 (1.6%) | 0 (0.0%) |
| No Fuel Used | 0 (0.0%) | 0 (0.0%) |
| Total | 1,193 (100.0%) | 330 (100.0%) |
Household Vehicle Usage in Primera
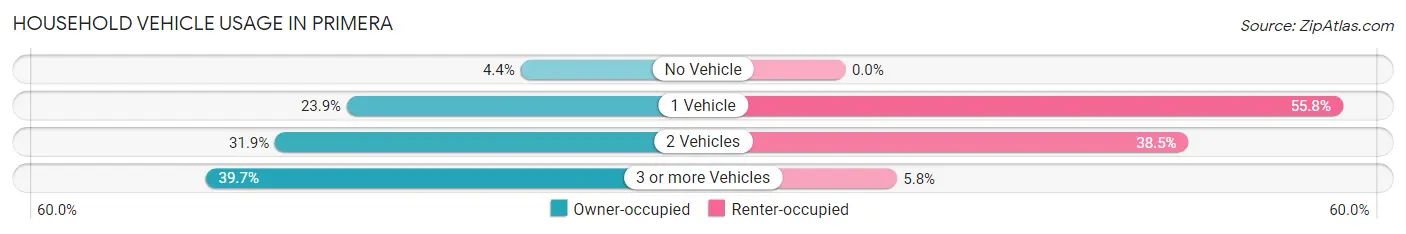
| Vehicles per Household | Owner-occupied | Renter-occupied |
| No Vehicle | 53 (4.4%) | 0 (0.0%) |
| 1 Vehicle | 285 (23.9%) | 184 (55.8%) |
| 2 Vehicles | 381 (31.9%) | 127 (38.5%) |
| 3 or more Vehicles | 474 (39.7%) | 19 (5.8%) |
| Total | 1,193 (100.0%) | 330 (100.0%) |
Real Estate & Mortgages in Primera
Real Estate and Mortgage Overview in Primera
| Characteristic | Without Mortgage | With Mortgage |
| Housing Units | 499 | 694 |
| Median Property Value | $95,100 | $152,800 |
| Median Household Income | $48,393 | $152 |
| Monthly Housing Costs | $501 | $0 |
| Real Estate Taxes | $1,584 | $33 |
Property Value by Mortgage Status in Primera
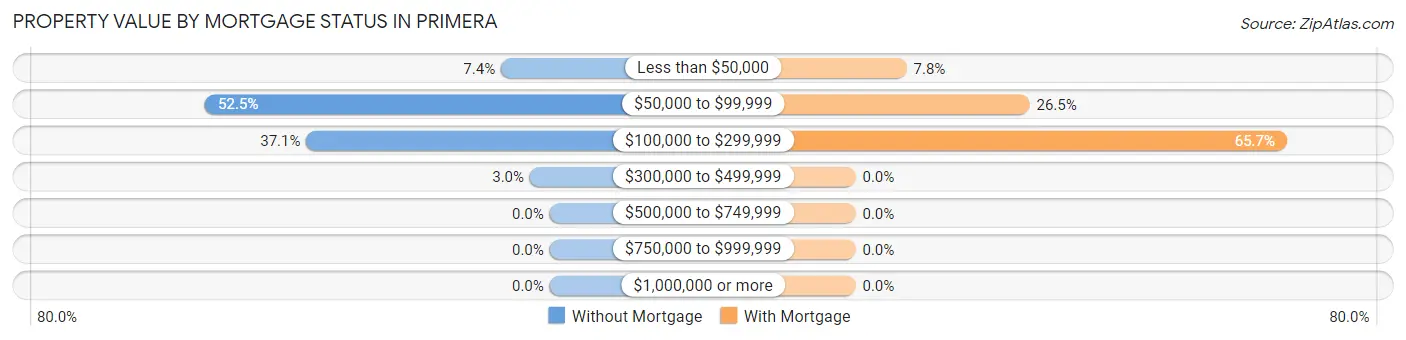
| Property Value | Without Mortgage | With Mortgage |
| Less than $50,000 | 37 (7.4%) | 54 (7.8%) |
| $50,000 to $99,999 | 262 (52.5%) | 184 (26.5%) |
| $100,000 to $299,999 | 185 (37.1%) | 456 (65.7%) |
| $300,000 to $499,999 | 15 (3.0%) | 0 (0.0%) |
| $500,000 to $749,999 | 0 (0.0%) | 0 (0.0%) |
| $750,000 to $999,999 | 0 (0.0%) | 0 (0.0%) |
| $1,000,000 or more | 0 (0.0%) | 0 (0.0%) |
| Total | 499 (100.0%) | 694 (100.0%) |
Household Income by Mortgage Status in Primera
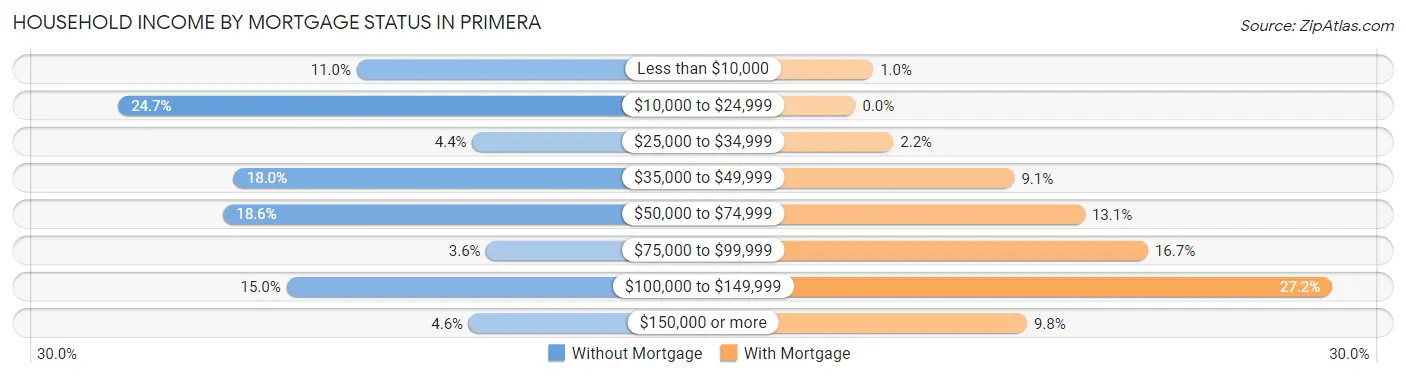
| Household Income | Without Mortgage | With Mortgage |
| Less than $10,000 | 55 (11.0%) | 7 (1.0%) |
| $10,000 to $24,999 | 123 (24.6%) | 0 (0.0%) |
| $25,000 to $34,999 | 22 (4.4%) | 15 (2.2%) |
| $35,000 to $49,999 | 90 (18.0%) | 63 (9.1%) |
| $50,000 to $74,999 | 93 (18.6%) | 91 (13.1%) |
| $75,000 to $99,999 | 18 (3.6%) | 116 (16.7%) |
| $100,000 to $149,999 | 75 (15.0%) | 189 (27.2%) |
| $150,000 or more | 23 (4.6%) | 68 (9.8%) |
| Total | 499 (100.0%) | 694 (100.0%) |
Property Value to Household Income Ratio in Primera
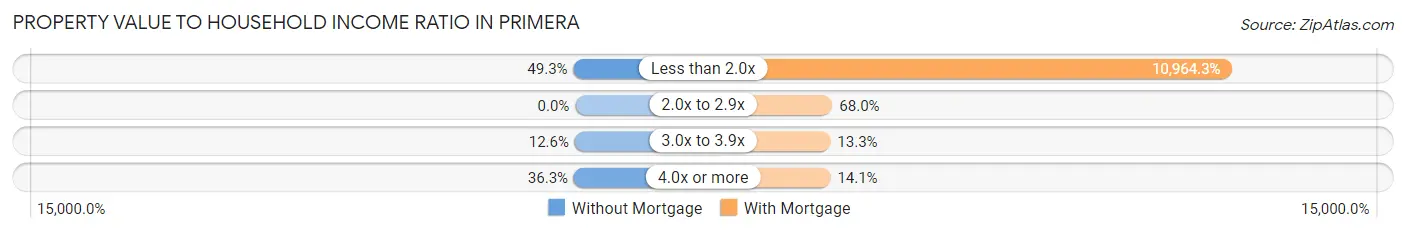
| Value-to-Income Ratio | Without Mortgage | With Mortgage |
| Less than 2.0x | 246 (49.3%) | 76,092 (10,964.3%) |
| 2.0x to 2.9x | 0 (0.0%) | 472 (68.0%) |
| 3.0x to 3.9x | 63 (12.6%) | 92 (13.3%) |
| 4.0x or more | 181 (36.3%) | 98 (14.1%) |
| Total | 499 (100.0%) | 694 (100.0%) |
Real Estate Taxes by Mortgage Status in Primera
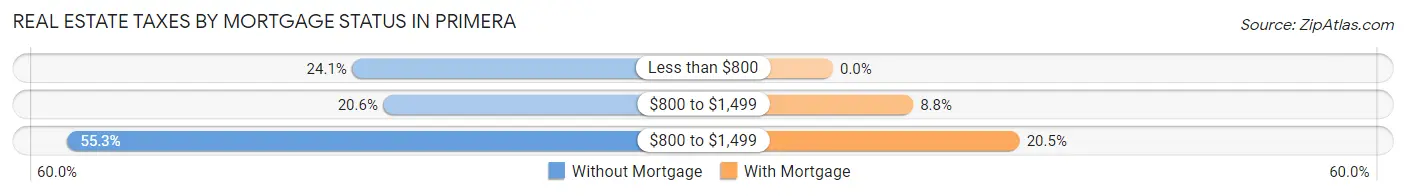
| Property Taxes | Without Mortgage | With Mortgage |
| Less than $800 | 120 (24.0%) | 0 (0.0%) |
| $800 to $1,499 | 103 (20.6%) | 61 (8.8%) |
| $800 to $1,499 | 276 (55.3%) | 142 (20.5%) |
| Total | 499 (100.0%) | 694 (100.0%) |
Health & Disability in Primera
Health Insurance Coverage by Age in Primera
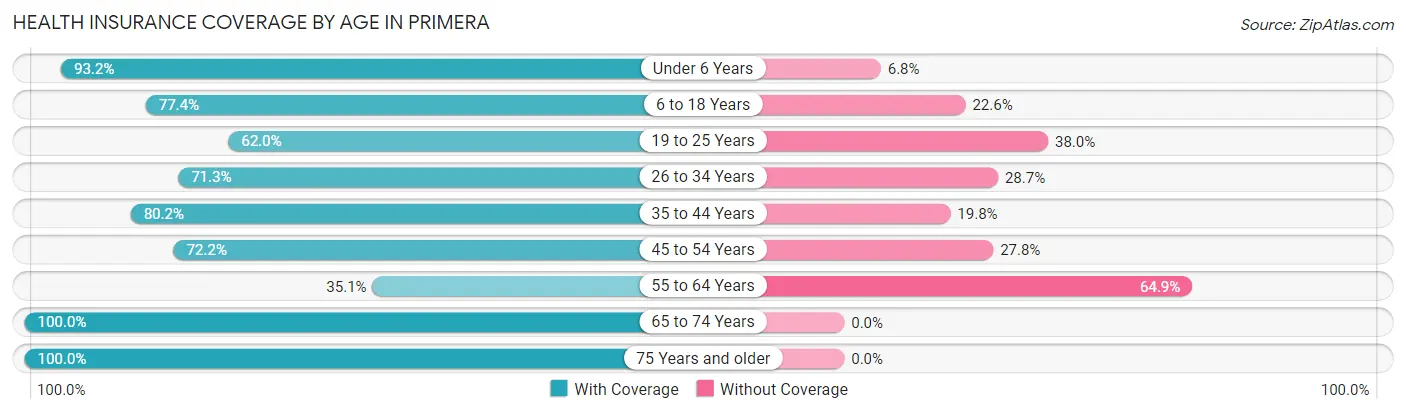
| Age Bracket | With Coverage | Without Coverage |
| Under 6 Years | 602 (93.2%) | 44 (6.8%) |
| 6 to 18 Years | 904 (77.4%) | 264 (22.6%) |
| 19 to 25 Years | 204 (62.0%) | 125 (38.0%) |
| 26 to 34 Years | 570 (71.3%) | 229 (28.7%) |
| 35 to 44 Years | 531 (80.2%) | 131 (19.8%) |
| 45 to 54 Years | 372 (72.2%) | 143 (27.8%) |
| 55 to 64 Years | 208 (35.1%) | 384 (64.9%) |
| 65 to 74 Years | 338 (100.0%) | 0 (0.0%) |
| 75 Years and older | 155 (100.0%) | 0 (0.0%) |
| Total | 3,884 (74.6%) | 1,320 (25.4%) |
Health Insurance Coverage by Citizenship Status in Primera
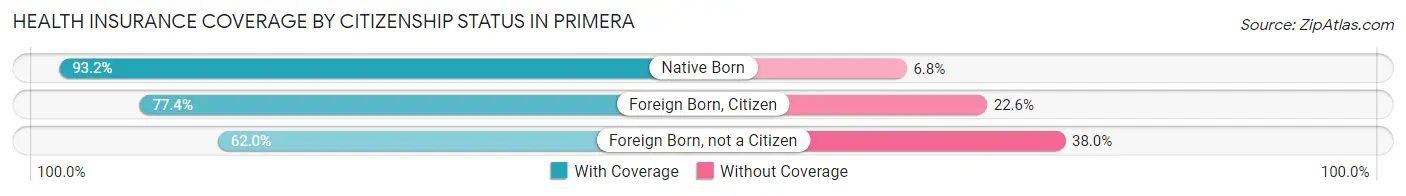
| Citizenship Status | With Coverage | Without Coverage |
| Native Born | 602 (93.2%) | 44 (6.8%) |
| Foreign Born, Citizen | 904 (77.4%) | 264 (22.6%) |
| Foreign Born, not a Citizen | 204 (62.0%) | 125 (38.0%) |
Health Insurance Coverage by Household Income in Primera
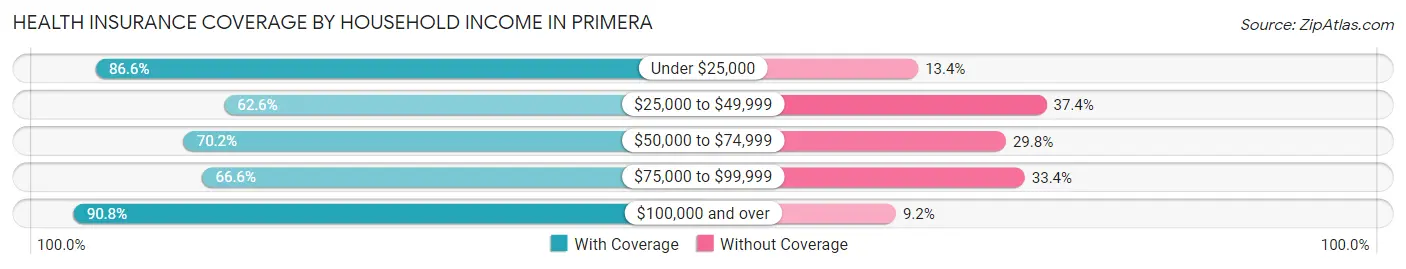
| Household Income | With Coverage | Without Coverage |
| Under $25,000 | 628 (86.6%) | 97 (13.4%) |
| $25,000 to $49,999 | 769 (62.6%) | 460 (37.4%) |
| $50,000 to $74,999 | 508 (70.2%) | 216 (29.8%) |
| $75,000 to $99,999 | 867 (66.6%) | 434 (33.4%) |
| $100,000 and over | 1,112 (90.8%) | 113 (9.2%) |
Public vs Private Health Insurance Coverage by Age in Primera
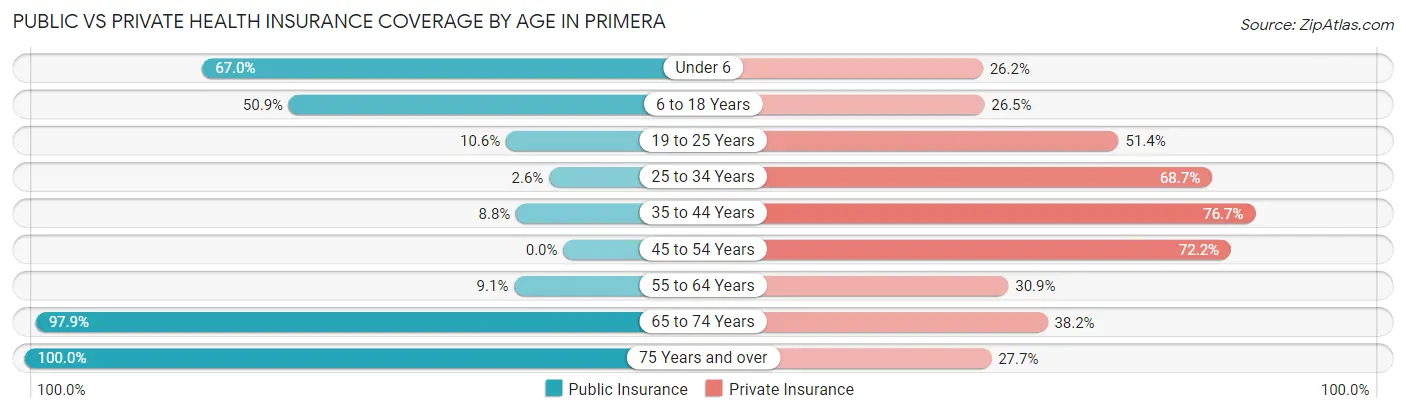
| Age Bracket | Public Insurance | Private Insurance |
| Under 6 | 433 (67.0%) | 169 (26.2%) |
| 6 to 18 Years | 595 (50.9%) | 309 (26.5%) |
| 19 to 25 Years | 35 (10.6%) | 169 (51.4%) |
| 25 to 34 Years | 21 (2.6%) | 549 (68.7%) |
| 35 to 44 Years | 58 (8.8%) | 508 (76.7%) |
| 45 to 54 Years | 0 (0.0%) | 372 (72.2%) |
| 55 to 64 Years | 54 (9.1%) | 183 (30.9%) |
| 65 to 74 Years | 331 (97.9%) | 129 (38.2%) |
| 75 Years and over | 155 (100.0%) | 43 (27.7%) |
| Total | 1,682 (32.3%) | 2,431 (46.7%) |
Disability Status by Sex by Age in Primera
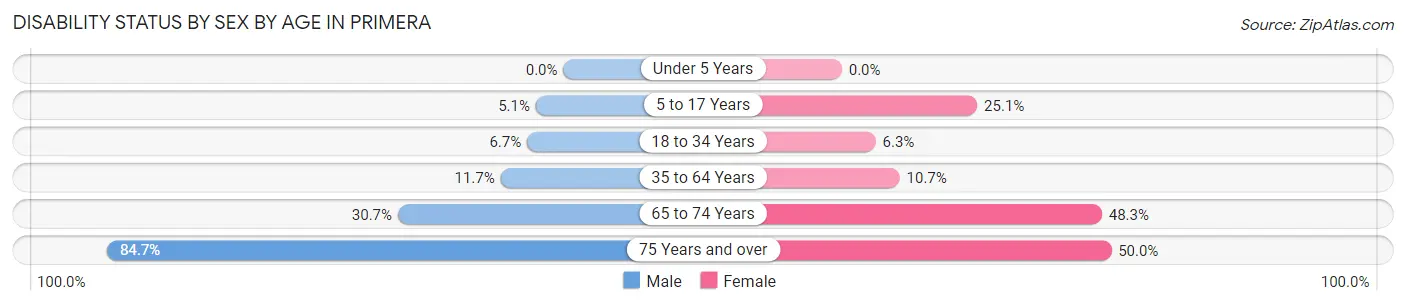
| Age Bracket | Male | Female |
| Under 5 Years | 0 (0.0%) | 0 (0.0%) |
| 5 to 17 Years | 28 (5.1%) | 145 (25.1%) |
| 18 to 34 Years | 44 (6.7%) | 35 (6.3%) |
| 35 to 64 Years | 115 (11.7%) | 84 (10.7%) |
| 65 to 74 Years | 51 (30.7%) | 83 (48.3%) |
| 75 Years and over | 72 (84.7%) | 35 (50.0%) |
Disability Class by Sex by Age in Primera
Disability Class: Hearing Difficulty
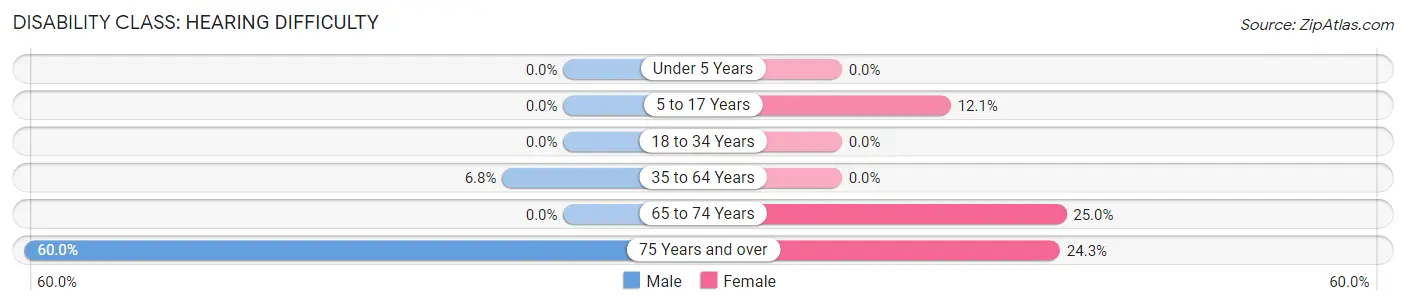
| Age Bracket | Male | Female |
| Under 5 Years | 0 (0.0%) | 0 (0.0%) |
| 5 to 17 Years | 0 (0.0%) | 70 (12.1%) |
| 18 to 34 Years | 0 (0.0%) | 0 (0.0%) |
| 35 to 64 Years | 67 (6.8%) | 0 (0.0%) |
| 65 to 74 Years | 0 (0.0%) | 43 (25.0%) |
| 75 Years and over | 51 (60.0%) | 17 (24.3%) |
Disability Class: Vision Difficulty
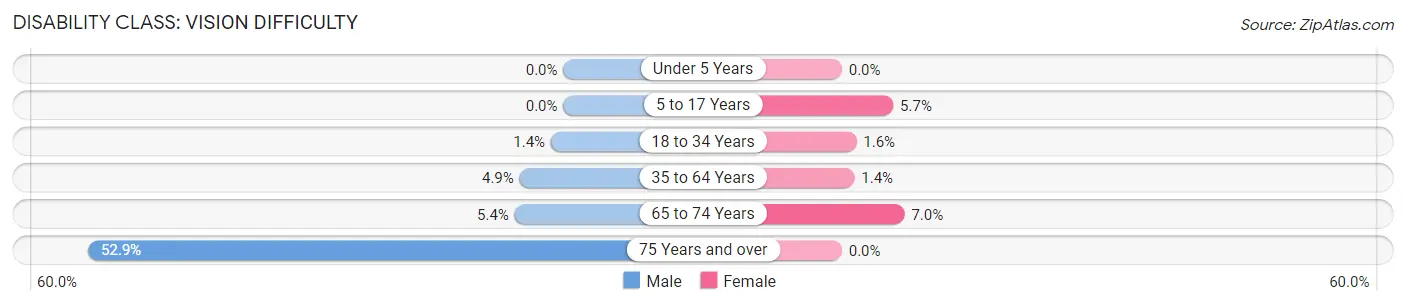
| Age Bracket | Male | Female |
| Under 5 Years | 0 (0.0%) | 0 (0.0%) |
| 5 to 17 Years | 0 (0.0%) | 33 (5.7%) |
| 18 to 34 Years | 9 (1.4%) | 9 (1.6%) |
| 35 to 64 Years | 48 (4.9%) | 11 (1.4%) |
| 65 to 74 Years | 9 (5.4%) | 12 (7.0%) |
| 75 Years and over | 45 (52.9%) | 0 (0.0%) |
Disability Class: Cognitive Difficulty
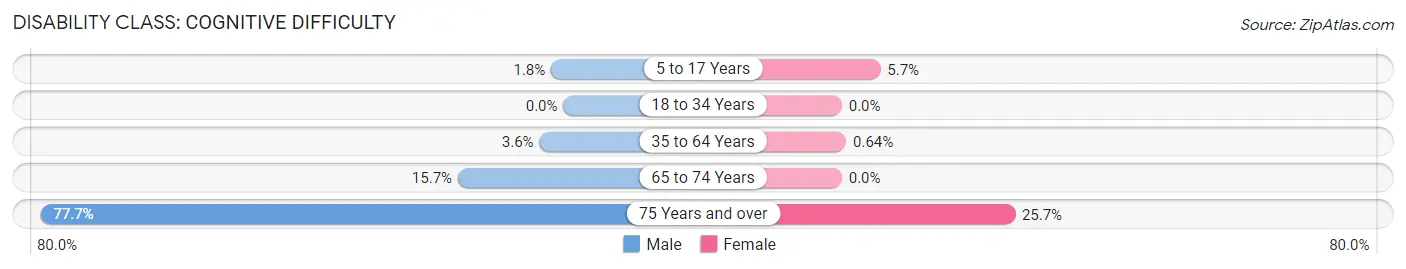
| Age Bracket | Male | Female |
| 5 to 17 Years | 10 (1.8%) | 33 (5.7%) |
| 18 to 34 Years | 0 (0.0%) | 0 (0.0%) |
| 35 to 64 Years | 35 (3.5%) | 5 (0.6%) |
| 65 to 74 Years | 26 (15.7%) | 0 (0.0%) |
| 75 Years and over | 66 (77.6%) | 18 (25.7%) |
Disability Class: Ambulatory Difficulty
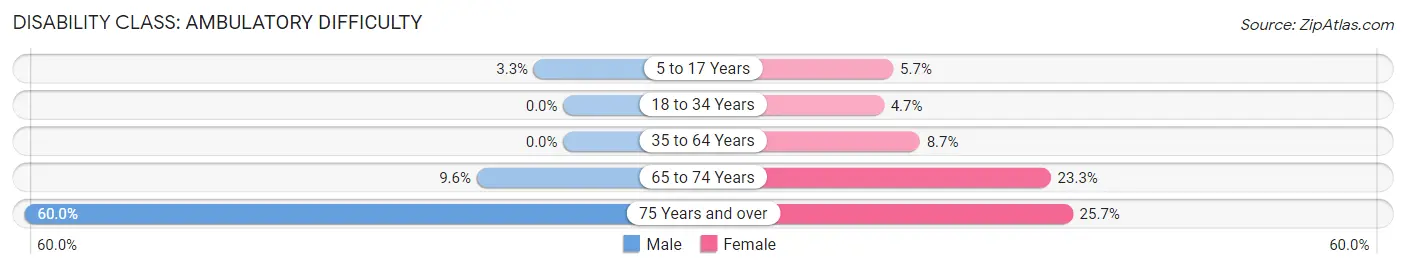
| Age Bracket | Male | Female |
| 5 to 17 Years | 18 (3.3%) | 33 (5.7%) |
| 18 to 34 Years | 0 (0.0%) | 26 (4.7%) |
| 35 to 64 Years | 0 (0.0%) | 68 (8.7%) |
| 65 to 74 Years | 16 (9.6%) | 40 (23.3%) |
| 75 Years and over | 51 (60.0%) | 18 (25.7%) |
Disability Class: Self-Care Difficulty
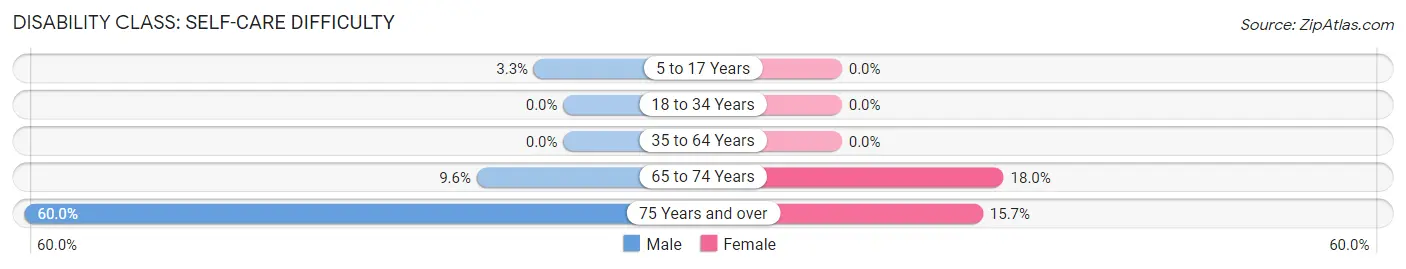
| Age Bracket | Male | Female |
| 5 to 17 Years | 18 (3.3%) | 0 (0.0%) |
| 18 to 34 Years | 0 (0.0%) | 0 (0.0%) |
| 35 to 64 Years | 0 (0.0%) | 0 (0.0%) |
| 65 to 74 Years | 16 (9.6%) | 31 (18.0%) |
| 75 Years and over | 51 (60.0%) | 11 (15.7%) |
Technology Access in Primera
Computing Device Access in Primera
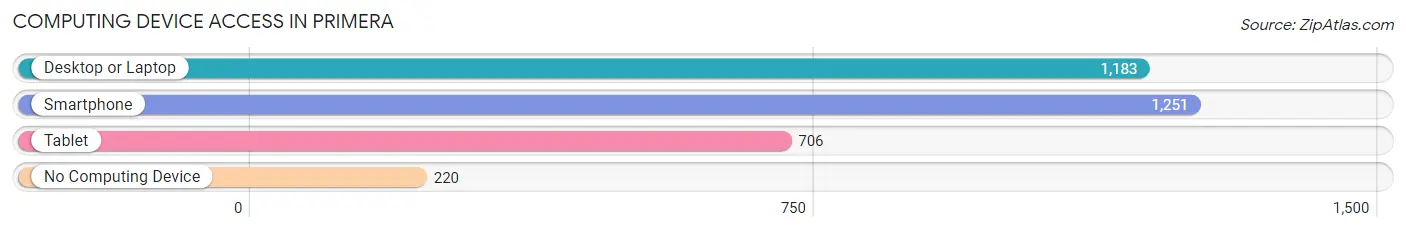
| Device Type | # Households | % Households |
| Desktop or Laptop | 1,183 | 77.7% |
| Smartphone | 1,251 | 82.1% |
| Tablet | 706 | 46.4% |
| No Computing Device | 220 | 14.4% |
| Total | 1,523 | 100.0% |
Internet Access in Primera
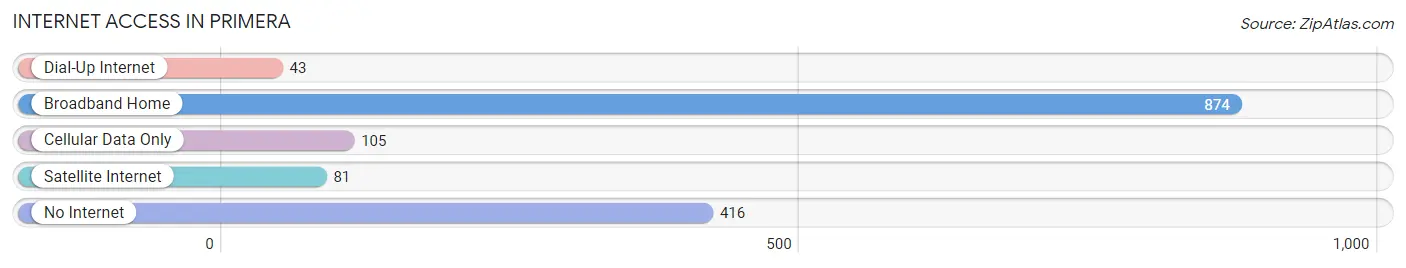
| Internet Type | # Households | % Households |
| Dial-Up Internet | 43 | 2.8% |
| Broadband Home | 874 | 57.4% |
| Cellular Data Only | 105 | 6.9% |
| Satellite Internet | 81 | 5.3% |
| No Internet | 416 | 27.3% |
| Total | 1,523 | 100.0% |
Primera Summary
Primera, Texas is a small town located in Cameron County, Texas, United States. It is situated on the Rio Grande, just south of the city of Harlingen. The population of Primera was 1,845 at the 2010 census.
Geography
Primera is located at 26°14'25" North, 97°31'17" West (26.240278, -97.521389). It is situated on the Rio Grande, just south of the city of Harlingen. The town is located in the Rio Grande Valley, a region of Texas known for its fertile soil and warm climate.
The terrain of Primera is mostly flat, with some rolling hills. The town is surrounded by farmland, and is located near the Laguna Madre, a shallow bay of the Gulf of Mexico.
History
Primera was founded in 1891 by a group of settlers from Mexico. The town was named after the first settler, Primo de la Garza. The settlers were attracted to the area by its fertile soil and warm climate.
The town grew slowly, but by the early 20th century, it had become a thriving agricultural center. Primera was incorporated in 1911, and by the 1920s, it had become a major cotton-producing center.
In the 1950s, the town began to experience a decline in population as many of its residents moved to larger cities in search of better job opportunities. However, in recent years, the town has seen a resurgence in population as people have moved back to the area in search of a more rural lifestyle.
Economy
Primera’s economy is largely based on agriculture. The town is home to several large farms, which produce a variety of crops, including cotton, corn, sorghum, and vegetables. The town also has a number of small businesses, including restaurants, grocery stores, and auto repair shops.
The town is also home to a number of manufacturing companies, which produce a variety of products, including furniture, clothing, and electronics.
Demographics
As of the 2010 census, the population of Primera was 1,845. The racial makeup of the town was 79.3% White, 0.7% African American, 0.2% Native American, 0.2% Asian, 0.1% Pacific Islander, 17.7% from other races, and 2.0% from two or more races. Hispanic or Latino of any race were 97.2% of the population.
The median household income in Primera was $25,938, and the median family income was $30,938. The per capita income for the town was $12,845. About 24.3% of families and 28.2% of the population were below the poverty line, including 37.3% of those under age 18 and 16.2% of those age 65 or over.
Conclusion
Primera, Texas is a small town located in Cameron County, Texas, United States. It is situated on the Rio Grande, just south of the city of Harlingen. The town was founded in 1891 by a group of settlers from Mexico, and has since become a thriving agricultural center. The town’s economy is largely based on agriculture, and it is also home to a number of manufacturing companies. The population of Primera was 1,845 at the 2010 census, and the racial makeup of the town was 79.3% White, 0.7% African American, 0.2% Native American, 0.2% Asian, 0.1% Pacific Islander, 17.7% from other races, and 2.0% from two or more races. Hispanic or Latino of any race were 97.2% of the population. Primera is a small town with a rich history and a bright future.
Common Questions
What is Per Capita Income in Primera?
Per Capita income in Primera is $22,931.
What is the Median Family Income in Primera?
Median Family Income in Primera is $61,439.
What is the Median Household income in Primera?
Median Household Income in Primera is $61,108.
What is Income or Wage Gap in Primera?
Income or Wage Gap in Primera is 3.6%.
Women in Primera earn 96.4 cents for every dollar earned by a man.
What is Family Income Deficit in Primera?
Family Income Deficit in Primera is $5,807.
Families that are below poverty line in Primera earn $5,807 less on average than the poverty threshold level.
What is Inequality or Gini Index in Primera?
Inequality or Gini Index in Primera is 0.41.
What is the Total Population of Primera?
Total Population of Primera is 5,219.
What is the Total Male Population of Primera?
Total Male Population of Primera is 2,803.
What is the Total Female Population of Primera?
Total Female Population of Primera is 2,416.
What is the Ratio of Males per 100 Females in Primera?
There are 116.02 Males per 100 Females in Primera.
What is the Ratio of Females per 100 Males in Primera?
There are 86.19 Females per 100 Males in Primera.
What is the Median Population Age in Primera?
Median Population Age in Primera is 30.7 Years.
What is the Average Family Size in Primera
Average Family Size in Primera is 4.0 People.
What is the Average Household Size in Primera
Average Household Size in Primera is 3.4 People.
How Large is the Labor Force in Primera?
There are 2,773 People in the Labor Forcein in Primera.
What is the Percentage of People in the Labor Force in Primera?
75.9% of People are in the Labor Force in Primera.
What is the Unemployment Rate in Primera?
Unemployment Rate in Primera is 2.8%.