La Paloma, TX Map & Demographics
La Paloma Map
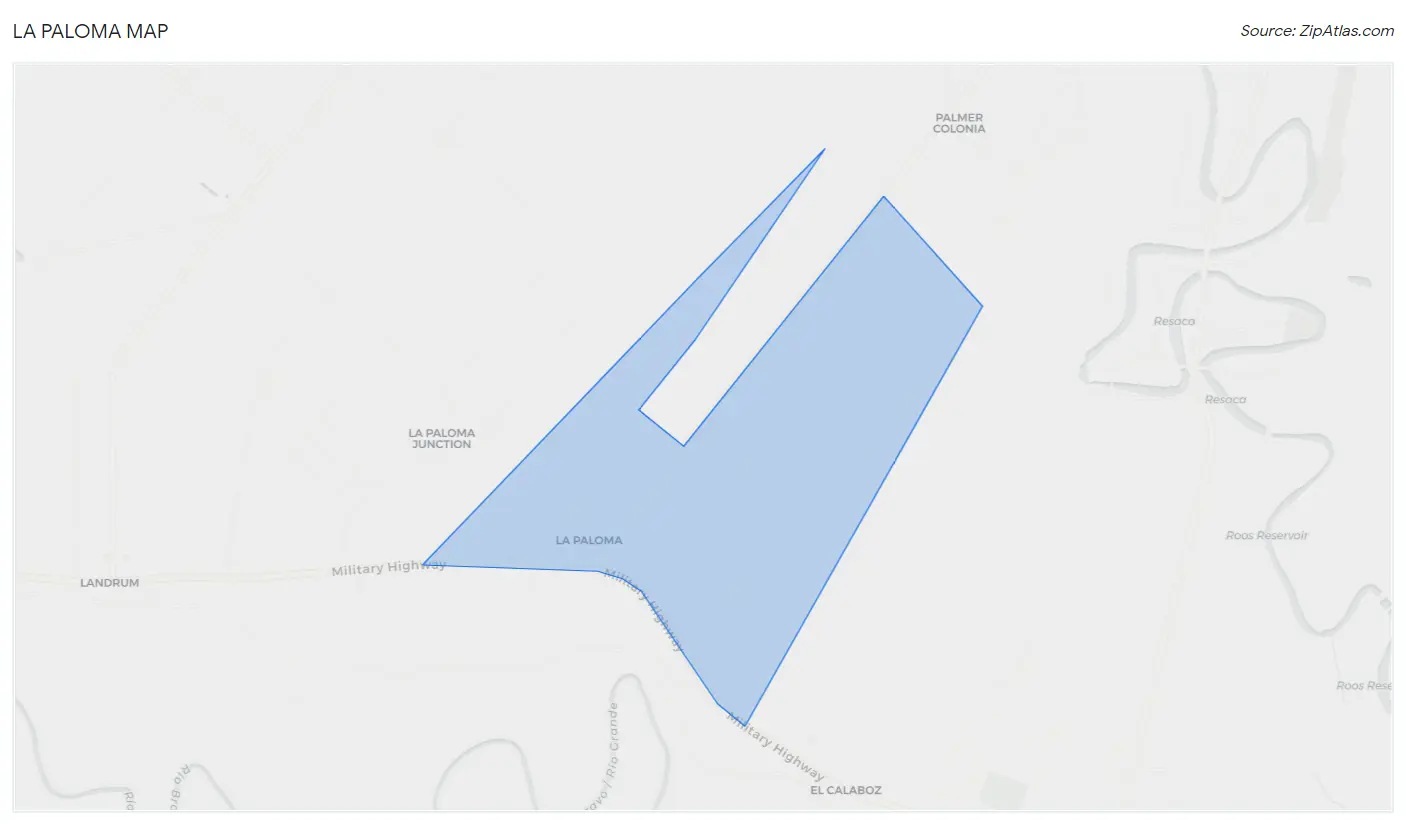
La Paloma Overview
$22,445
PER CAPITA INCOME
$56,893
AVG HOUSEHOLD INCOME
0.45
INEQUALITY / GINI INDEX
2,806
TOTAL POPULATION
1,428
MALE POPULATION
1,378
FEMALE POPULATION
103.63
MALES / 100 FEMALES
96.50
FEMALES / 100 MALES
29.4
MEDIAN AGE
3.9
AVG FAMILY SIZE
3.5
AVG HOUSEHOLD SIZE
1,185
LABOR FORCE [ PEOPLE ]
62.3%
PERCENT IN LABOR FORCE
2.6%
UNEMPLOYMENT RATE
Income in La Paloma
Income Overview in La Paloma
| Characteristic | Number | Measure |
| Per Capita Income | 2,806 | $22,445 |
| Median Family Income | 699 | $0 |
| Mean Family Income | 699 | $88,652 |
| Median Household Income | 793 | $56,893 |
| Mean Household Income | 793 | $80,906 |
| Income Deficit | 699 | $0 |
| Wage / Income Gap (%) | 2,806 | 0.00% |
| Wage / Income Gap ($) | 2,806 | 100.00¢ per $1 |
| Gini / Inequality Index | 2,806 | 0.45 |
Earnings by Sex in La Paloma
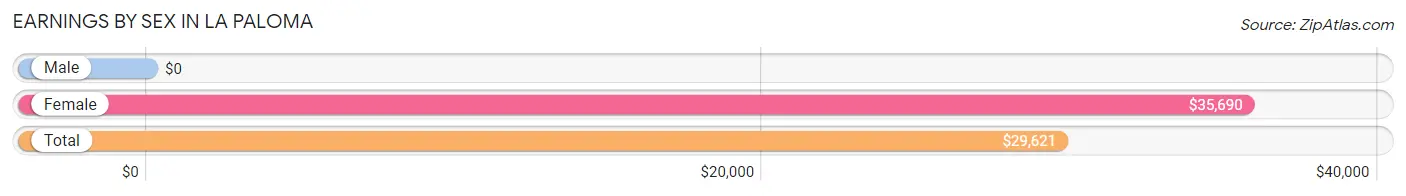
| Sex | Number | Average Earnings |
| Male | 686 (57.7%) | $0 |
| Female | 504 (42.3%) | $35,690 |
| Total | 1,190 (100.0%) | $29,621 |
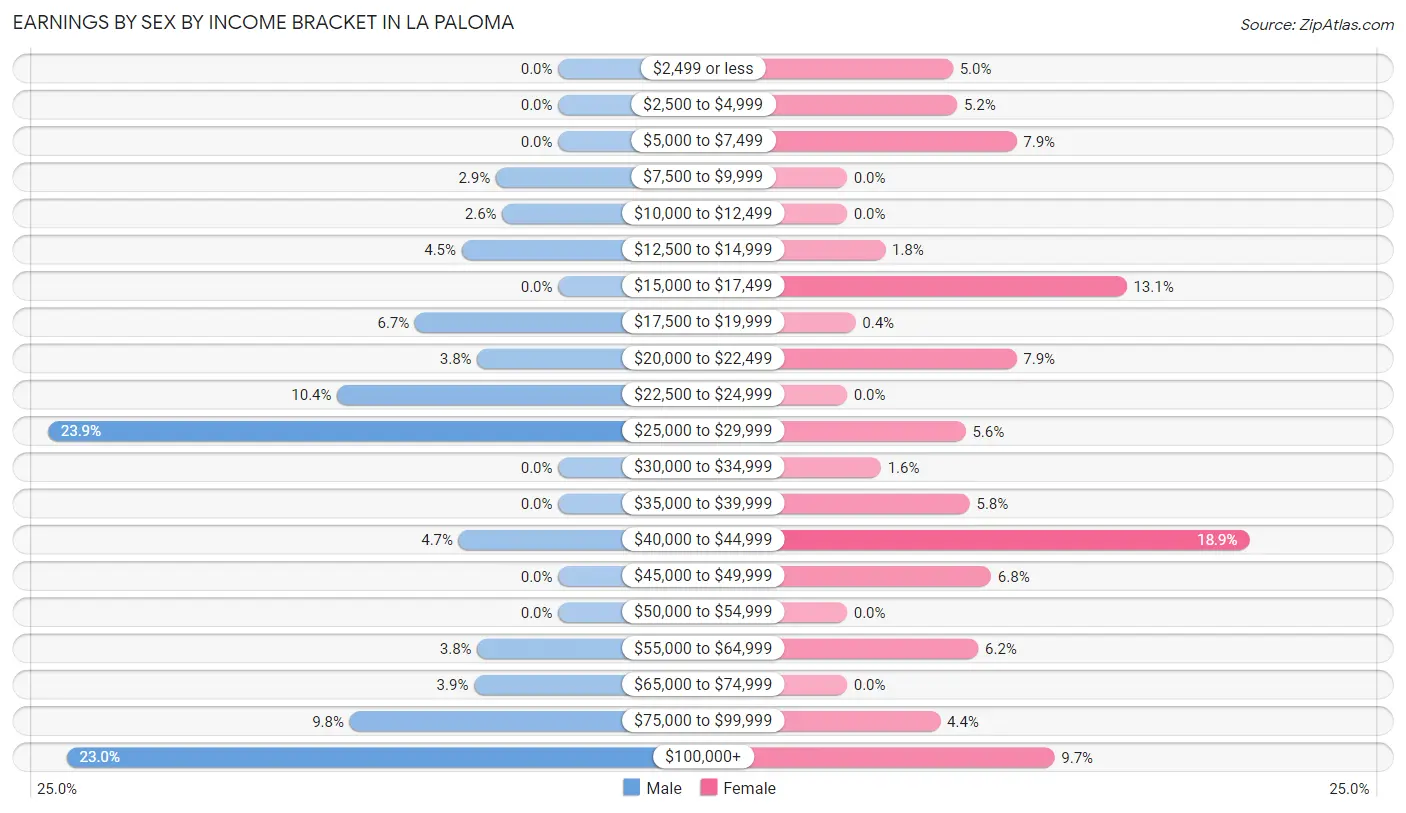
Earnings by Sex by Income Bracket in La Paloma
The most common earnings brackets in La Paloma are $25,000 to $29,999 for men (164 | 23.9%) and $40,000 to $44,999 for women (95 | 18.9%).
| Income | Male | Female |
| $2,499 or less | 0 (0.0%) | 25 (5.0%) |
| $2,500 to $4,999 | 0 (0.0%) | 26 (5.2%) |
| $5,000 to $7,499 | 0 (0.0%) | 40 (7.9%) |
| $7,500 to $9,999 | 20 (2.9%) | 0 (0.0%) |
| $10,000 to $12,499 | 18 (2.6%) | 0 (0.0%) |
| $12,500 to $14,999 | 31 (4.5%) | 9 (1.8%) |
| $15,000 to $17,499 | 0 (0.0%) | 66 (13.1%) |
| $17,500 to $19,999 | 46 (6.7%) | 2 (0.4%) |
| $20,000 to $22,499 | 26 (3.8%) | 40 (7.9%) |
| $22,500 to $24,999 | 71 (10.3%) | 0 (0.0%) |
| $25,000 to $29,999 | 164 (23.9%) | 28 (5.6%) |
| $30,000 to $34,999 | 0 (0.0%) | 8 (1.6%) |
| $35,000 to $39,999 | 0 (0.0%) | 29 (5.8%) |
| $40,000 to $44,999 | 32 (4.7%) | 95 (18.9%) |
| $45,000 to $49,999 | 0 (0.0%) | 34 (6.8%) |
| $50,000 to $54,999 | 0 (0.0%) | 0 (0.0%) |
| $55,000 to $64,999 | 26 (3.8%) | 31 (6.1%) |
| $65,000 to $74,999 | 27 (3.9%) | 0 (0.0%) |
| $75,000 to $99,999 | 67 (9.8%) | 22 (4.4%) |
| $100,000+ | 158 (23.0%) | 49 (9.7%) |
| Total | 686 (100.0%) | 504 (100.0%) |
Earnings by Sex by Educational Attainment in La Paloma
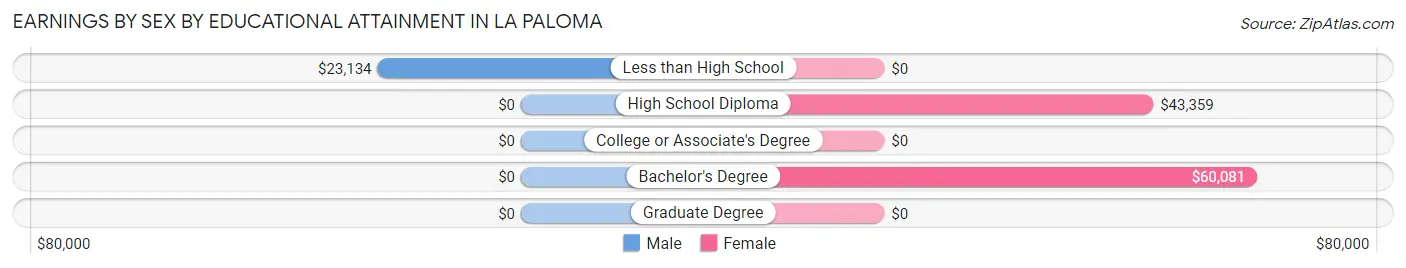
| Educational Attainment | Male Income | Female Income |
| Less than High School | $23,134 | $0 |
| High School Diploma | - | - |
| College or Associate's Degree | - | - |
| Bachelor's Degree | - | - |
| Graduate Degree | - | - |
| Total | - | - |
Family Income in La Paloma
Family Income Brackets in La Paloma
According to the La Paloma family income data, there are 253 families falling into the $100,000 to $149,999 income range, which is the most common income bracket and makes up 36.2% of all families.
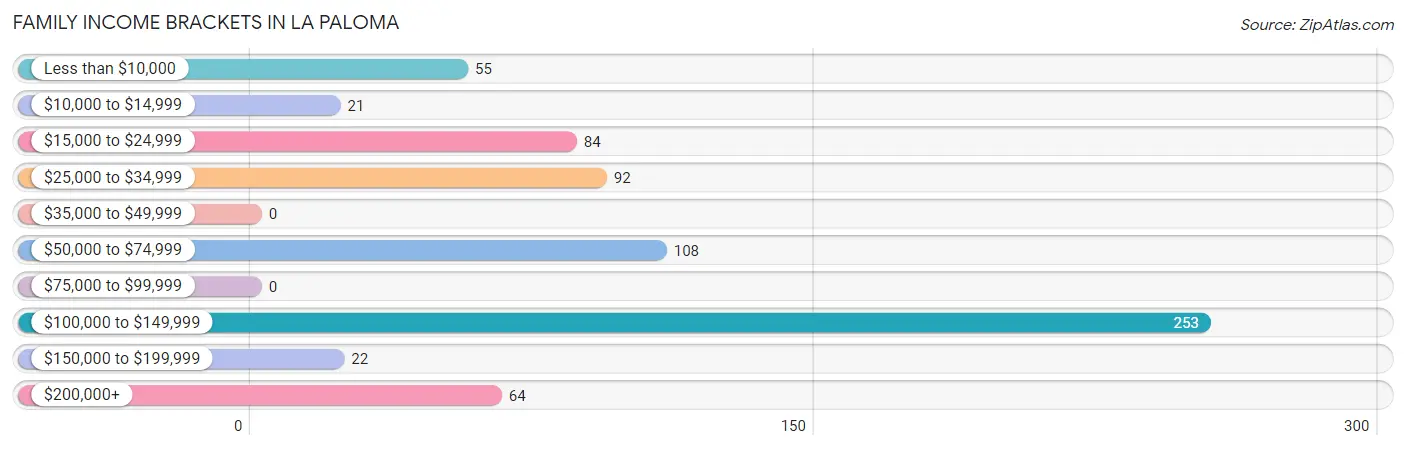
| Income Bracket | # Families | % Families |
| Less than $10,000 | 55 | 7.9% |
| $10,000 to $14,999 | 21 | 3.0% |
| $15,000 to $24,999 | 84 | 12.0% |
| $25,000 to $34,999 | 92 | 13.2% |
| $35,000 to $49,999 | 0 | 0.0% |
| $50,000 to $74,999 | 108 | 15.5% |
| $75,000 to $99,999 | 0 | 0.0% |
| $100,000 to $149,999 | 253 | 36.2% |
| $150,000 to $199,999 | 22 | 3.1% |
| $200,000+ | 64 | 9.2% |
Family Income by Famaliy Size in La Paloma
4-person families (278 | 39.8%) account for the highest median family income in La Paloma with $124,657 per family, while 4-person families (278 | 39.8%) have the highest median income of $31,164 per family member.
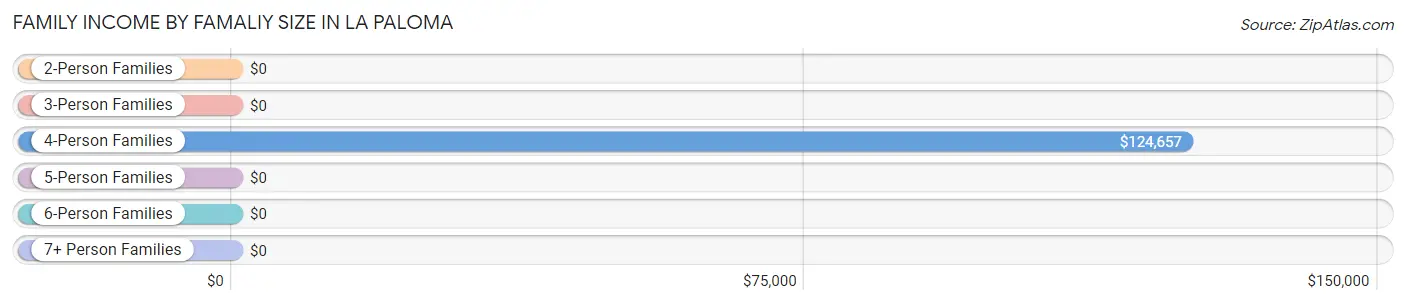
| Income Bracket | # Families | Median Income |
| 2-Person Families | 231 (33.1%) | $0 |
| 3-Person Families | 67 (9.6%) | $0 |
| 4-Person Families | 278 (39.8%) | $124,657 |
| 5-Person Families | 55 (7.9%) | $0 |
| 6-Person Families | 0 (0.0%) | $0 |
| 7+ Person Families | 68 (9.7%) | $0 |
| Total | 699 (100.0%) | $0 |
Family Income by Number of Earners in La Paloma
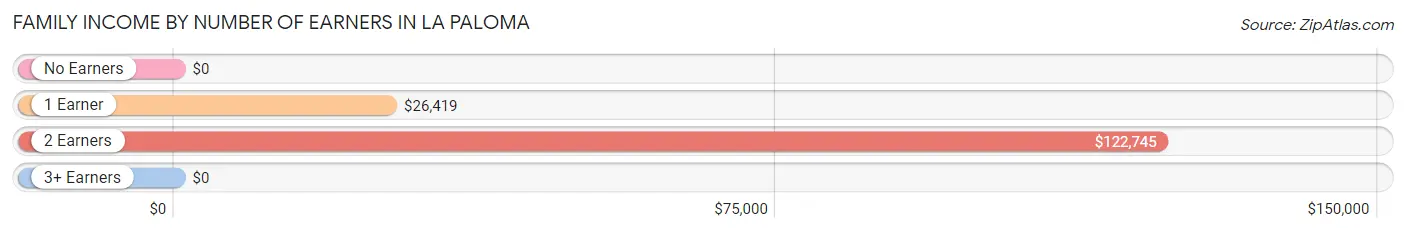
| Number of Earners | # Families | Median Income |
| No Earners | 30 (4.3%) | $0 |
| 1 Earner | 327 (46.8%) | $26,419 |
| 2 Earners | 276 (39.5%) | $122,745 |
| 3+ Earners | 66 (9.4%) | $0 |
| Total | 699 (100.0%) | $0 |
Household Income in La Paloma
Household Income Brackets in La Paloma
With 253 households falling in the category, the $100,000 to $149,999 income range is the most frequent in La Paloma, accounting for 31.9% of all households.
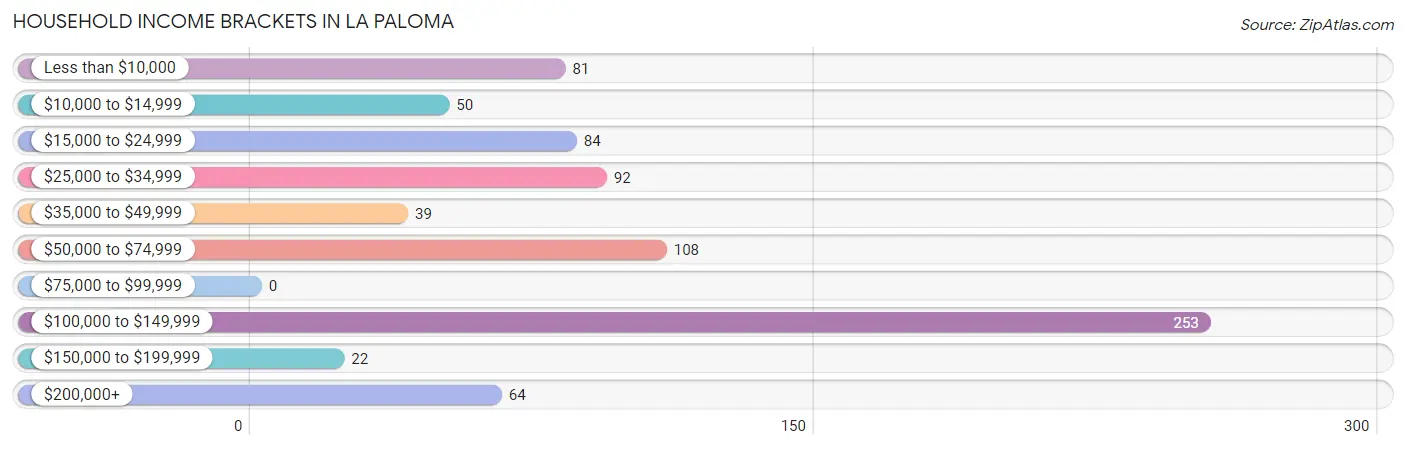
| Income Bracket | # Households | % Households |
| Less than $10,000 | 81 | 10.2% |
| $10,000 to $14,999 | 50 | 6.3% |
| $15,000 to $24,999 | 84 | 10.6% |
| $25,000 to $34,999 | 92 | 11.6% |
| $35,000 to $49,999 | 39 | 4.9% |
| $50,000 to $74,999 | 108 | 13.6% |
| $75,000 to $99,999 | 0 | 0.0% |
| $100,000 to $149,999 | 253 | 31.9% |
| $150,000 to $199,999 | 22 | 2.8% |
| $200,000+ | 64 | 8.1% |
Household Income by Householder Age in La Paloma
The median household income in La Paloma is $56,893, with the highest median household income of $103,555 found in the 25 to 44 years age bracket for the primary householder. A total of 359 households (45.3%) fall into this category.
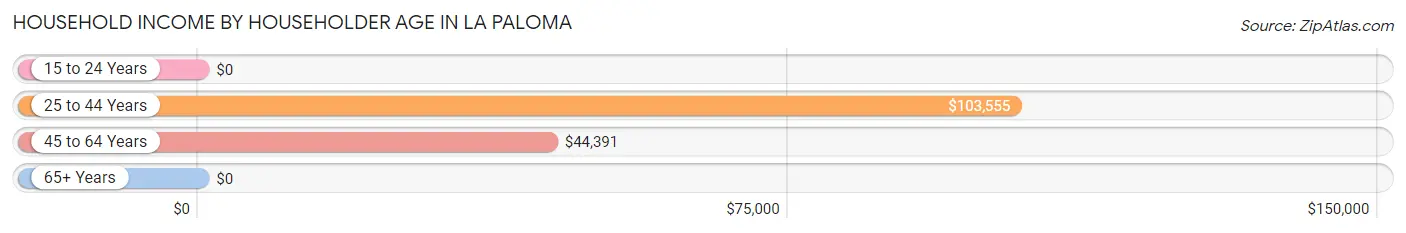
| Income Bracket | # Households | Median Income |
| 15 to 24 Years | 0 (0.0%) | $0 |
| 25 to 44 Years | 359 (45.3%) | $103,555 |
| 45 to 64 Years | 281 (35.4%) | $44,391 |
| 65+ Years | 153 (19.3%) | $0 |
| Total | 793 (100.0%) | $56,893 |
Poverty in La Paloma
Income Below Poverty by Sex and Age in La Paloma
With 34.9% poverty level for males and 31.5% for females among the residents of La Paloma, 12 to 14 year old males and 6 to 11 year old females are the most vulnerable to poverty, with 101 males (100.0%) and 77 females (100.0%) in their respective age groups living below the poverty level.
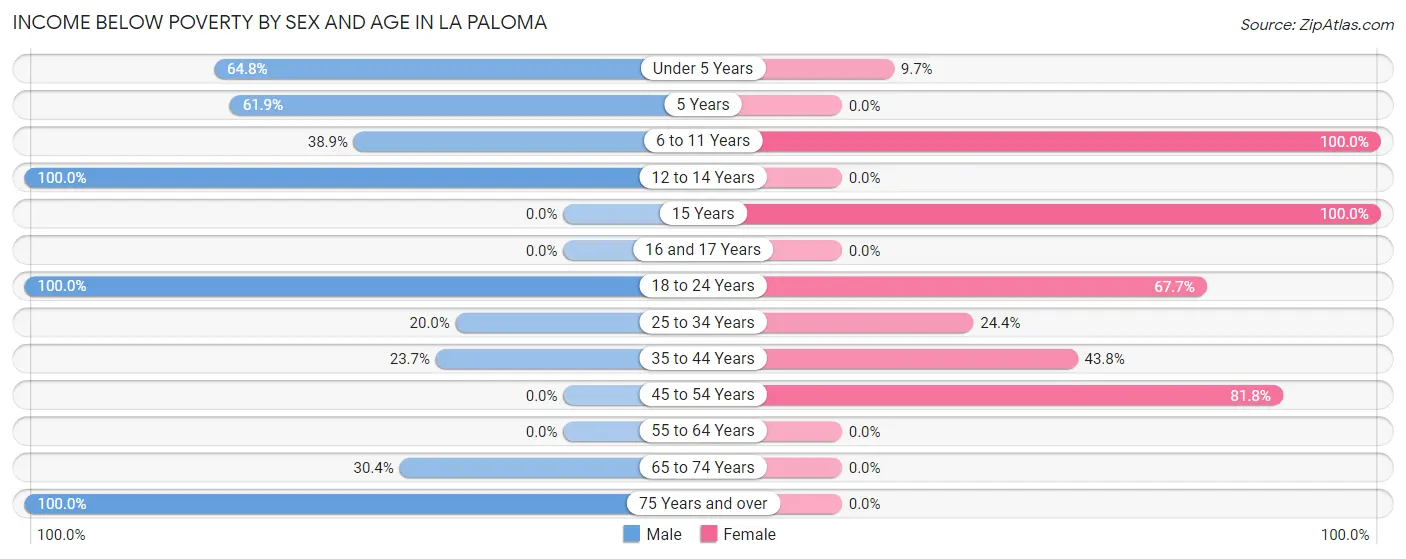
| Age Bracket | Male | Female |
| Under 5 Years | 105 (64.8%) | 20 (9.7%) |
| 5 Years | 26 (61.9%) | 0 (0.0%) |
| 6 to 11 Years | 35 (38.9%) | 77 (100.0%) |
| 12 to 14 Years | 101 (100.0%) | 0 (0.0%) |
| 15 Years | 0 (0.0%) | 26 (100.0%) |
| 16 and 17 Years | 0 (0.0%) | 0 (0.0%) |
| 18 to 24 Years | 69 (100.0%) | 88 (67.7%) |
| 25 to 34 Years | 21 (20.0%) | 62 (24.4%) |
| 35 to 44 Years | 81 (23.7%) | 77 (43.8%) |
| 45 to 54 Years | 0 (0.0%) | 81 (81.8%) |
| 55 to 64 Years | 0 (0.0%) | 0 (0.0%) |
| 65 to 74 Years | 31 (30.4%) | 0 (0.0%) |
| 75 Years and over | 29 (100.0%) | 0 (0.0%) |
| Total | 498 (34.9%) | 431 (31.5%) |
Income Above Poverty by Sex and Age in La Paloma
According to the poverty statistics in La Paloma, males aged 15 years and females aged 5 years are the age groups that are most secure financially, with 100.0% of males and 100.0% of females in these age groups living above the poverty line.
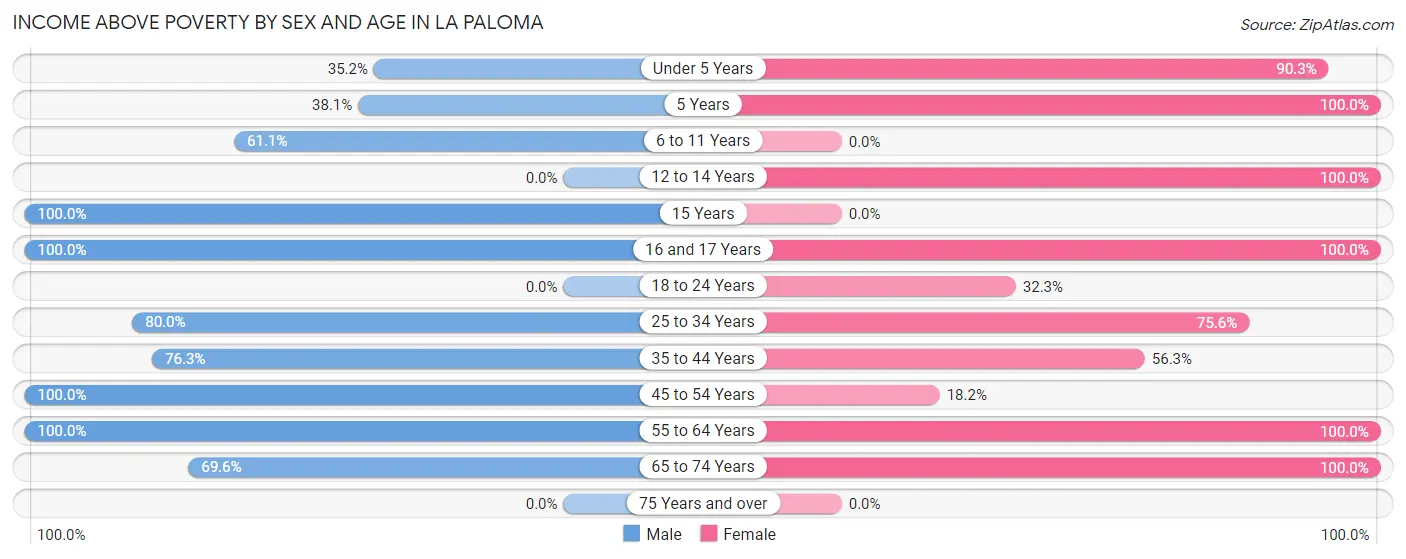
| Age Bracket | Male | Female |
| Under 5 Years | 57 (35.2%) | 187 (90.3%) |
| 5 Years | 16 (38.1%) | 17 (100.0%) |
| 6 to 11 Years | 55 (61.1%) | 0 (0.0%) |
| 12 to 14 Years | 0 (0.0%) | 150 (100.0%) |
| 15 Years | 22 (100.0%) | 0 (0.0%) |
| 16 and 17 Years | 78 (100.0%) | 39 (100.0%) |
| 18 to 24 Years | 0 (0.0%) | 42 (32.3%) |
| 25 to 34 Years | 84 (80.0%) | 192 (75.6%) |
| 35 to 44 Years | 261 (76.3%) | 99 (56.2%) |
| 45 to 54 Years | 80 (100.0%) | 18 (18.2%) |
| 55 to 64 Years | 206 (100.0%) | 136 (100.0%) |
| 65 to 74 Years | 71 (69.6%) | 57 (100.0%) |
| 75 Years and over | 0 (0.0%) | 0 (0.0%) |
| Total | 930 (65.1%) | 937 (68.5%) |
Income Below Poverty Among Married-Couple Families in La Paloma
The poverty statistics for married-couple families in La Paloma show that 25.2% or 118 of the total 469 families live below the poverty line. Families with 3 or 4 children have the highest poverty rate of 79.5%, comprising of 31 families. On the other hand, families with 5 or more children have the lowest poverty rate of 0.0%, which includes 0 families.
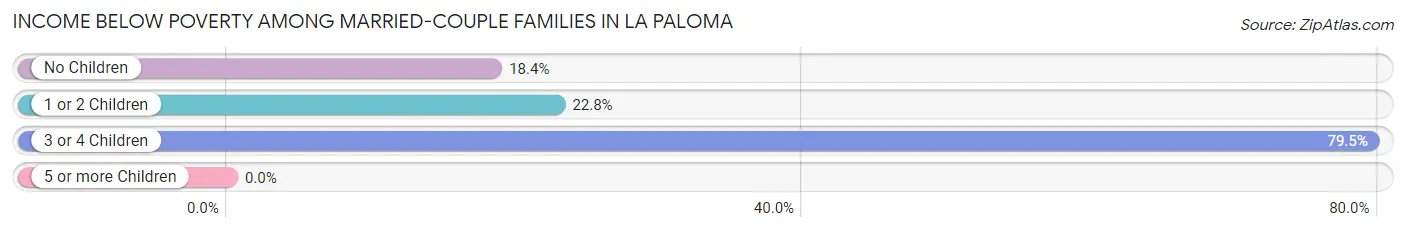
| Children | Above Poverty | Below Poverty |
| No Children | 133 (81.6%) | 30 (18.4%) |
| 1 or 2 Children | 193 (77.2%) | 57 (22.8%) |
| 3 or 4 Children | 8 (20.5%) | 31 (79.5%) |
| 5 or more Children | 17 (100.0%) | 0 (0.0%) |
| Total | 351 (74.8%) | 118 (25.2%) |
Income Below Poverty Among Single-Parent Households in La Paloma
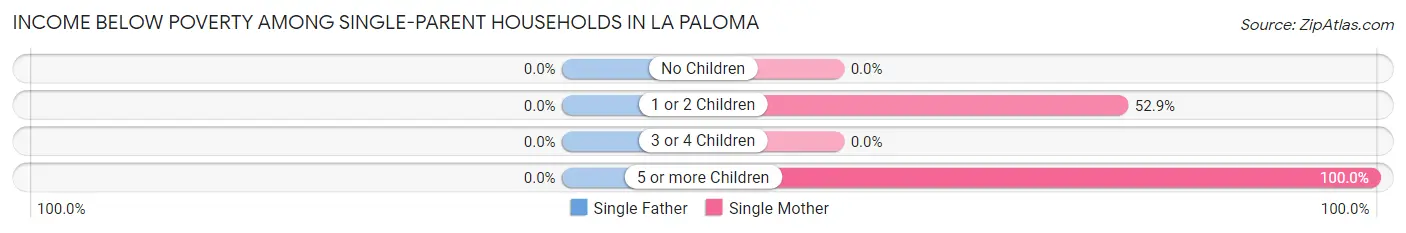
| Children | Single Father | Single Mother |
| No Children | 0 (0.0%) | 0 (0.0%) |
| 1 or 2 Children | 0 (0.0%) | 27 (52.9%) |
| 3 or 4 Children | 0 (0.0%) | 0 (0.0%) |
| 5 or more Children | 0 (0.0%) | 25 (100.0%) |
| Total | 0 (0.0%) | 52 (68.4%) |
Income Below Poverty Among Married-Couple vs Single-Parent Households in La Paloma
The poverty data for La Paloma shows that 118 of the married-couple family households (25.2%) and 52 of the single-parent households (22.6%) are living below the poverty level. Within the married-couple family households, those with 3 or 4 children have the highest poverty rate, with 31 households (79.5%) falling below the poverty line. Among the single-parent households, those with 5 or more children have the highest poverty rate, with 25 household (100.0%) living below poverty.
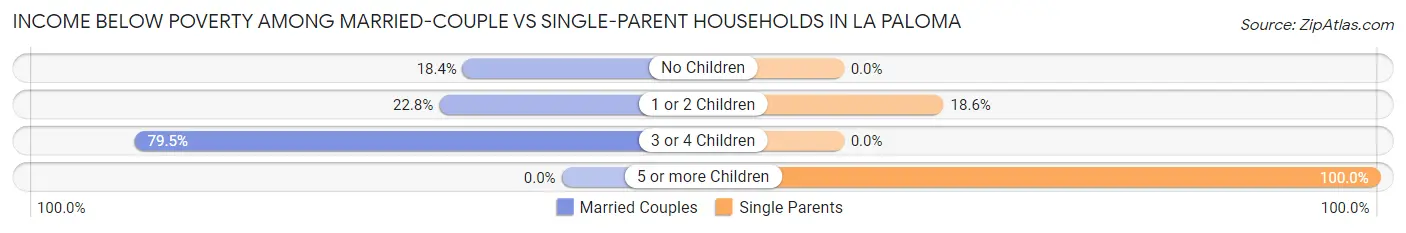
| Children | Married-Couple Families | Single-Parent Households |
| No Children | 30 (18.4%) | 0 (0.0%) |
| 1 or 2 Children | 57 (22.8%) | 27 (18.6%) |
| 3 or 4 Children | 31 (79.5%) | 0 (0.0%) |
| 5 or more Children | 0 (0.0%) | 25 (100.0%) |
| Total | 118 (25.2%) | 52 (22.6%) |
Race in La Paloma
The most populous races in La Paloma are Hispanic or Latino (2,713 | 96.7%), White / Caucasian (1,463 | 52.1%), and Two or more Races (1,040 | 37.1%).
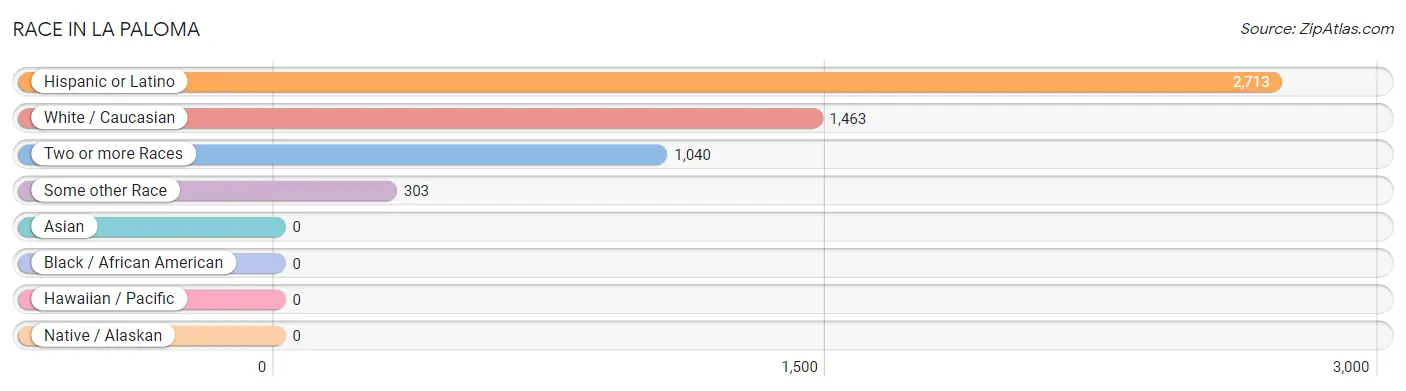
| Race | # Population | % Population |
| Asian | 0 | 0.0% |
| Black / African American | 0 | 0.0% |
| Hawaiian / Pacific | 0 | 0.0% |
| Hispanic or Latino | 2,713 | 96.7% |
| Native / Alaskan | 0 | 0.0% |
| White / Caucasian | 1,463 | 52.1% |
| Two or more Races | 1,040 | 37.1% |
| Some other Race | 303 | 10.8% |
| Total | 2,806 | 100.0% |
Ancestry in La Paloma
The most populous ancestries reported in La Paloma are Mexican (2,645 | 94.3%), and American (27 | 1.0%), together accounting for 95.2% of all La Paloma residents.
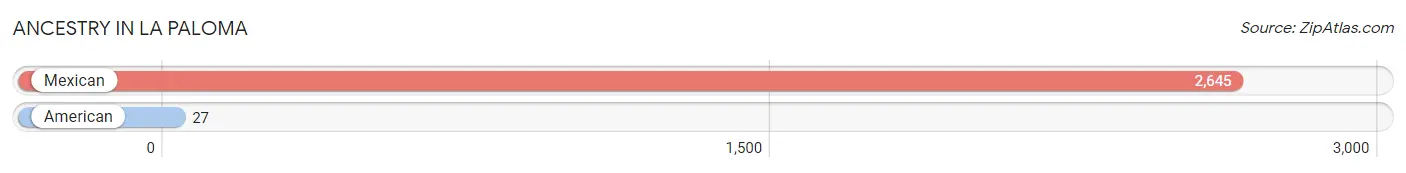
| Ancestry | # Population | % Population |
| American | 27 | 1.0% |
| Mexican | 2,645 | 94.3% | View All 2 Rows |
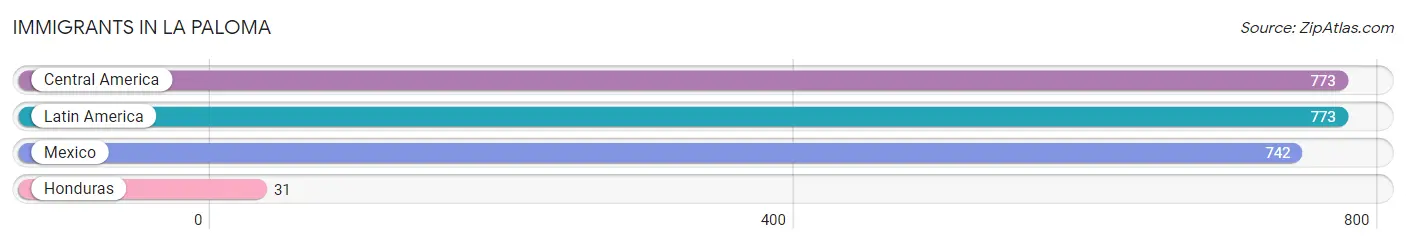
Immigrants in La Paloma
The most numerous immigrant groups reported in La Paloma came from Central America (773 | 27.6%), Latin America (773 | 27.6%), Mexico (742 | 26.4%), and Honduras (31 | 1.1%), together accounting for 82.6% of all La Paloma residents.
| Immigration Origin | # Population | % Population |
| Central America | 773 | 27.6% |
| Honduras | 31 | 1.1% |
| Latin America | 773 | 27.6% |
| Mexico | 742 | 26.4% | View All 4 Rows |
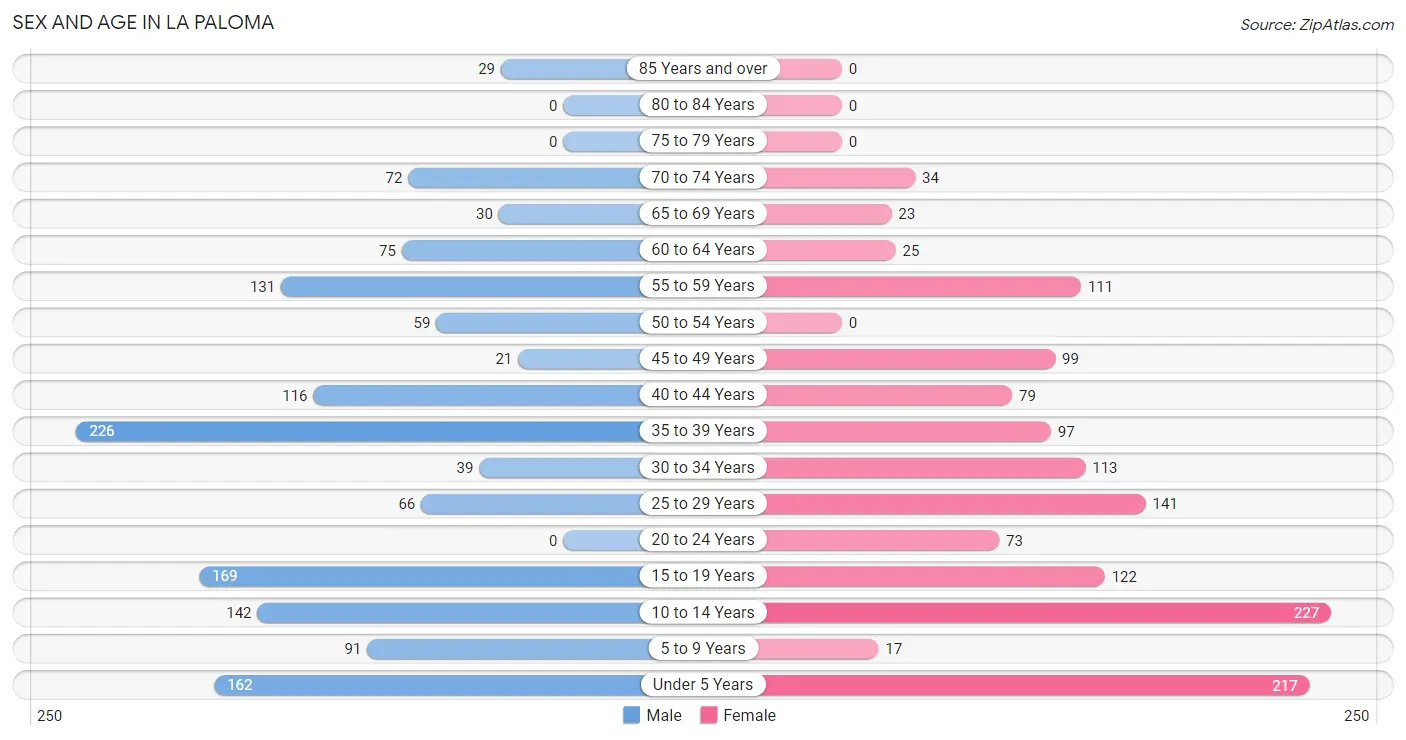
Sex and Age in La Paloma
Sex and Age in La Paloma
The most populous age groups in La Paloma are 35 to 39 Years (226 | 15.8%) for men and 10 to 14 Years (227 | 16.5%) for women.
| Age Bracket | Male | Female |
| Under 5 Years | 162 (11.3%) | 217 (15.8%) |
| 5 to 9 Years | 91 (6.4%) | 17 (1.2%) |
| 10 to 14 Years | 142 (9.9%) | 227 (16.5%) |
| 15 to 19 Years | 169 (11.8%) | 122 (8.8%) |
| 20 to 24 Years | 0 (0.0%) | 73 (5.3%) |
| 25 to 29 Years | 66 (4.6%) | 141 (10.2%) |
| 30 to 34 Years | 39 (2.7%) | 113 (8.2%) |
| 35 to 39 Years | 226 (15.8%) | 97 (7.0%) |
| 40 to 44 Years | 116 (8.1%) | 79 (5.7%) |
| 45 to 49 Years | 21 (1.5%) | 99 (7.2%) |
| 50 to 54 Years | 59 (4.1%) | 0 (0.0%) |
| 55 to 59 Years | 131 (9.2%) | 111 (8.1%) |
| 60 to 64 Years | 75 (5.2%) | 25 (1.8%) |
| 65 to 69 Years | 30 (2.1%) | 23 (1.7%) |
| 70 to 74 Years | 72 (5.0%) | 34 (2.5%) |
| 75 to 79 Years | 0 (0.0%) | 0 (0.0%) |
| 80 to 84 Years | 0 (0.0%) | 0 (0.0%) |
| 85 Years and over | 29 (2.0%) | 0 (0.0%) |
| Total | 1,428 (100.0%) | 1,378 (100.0%) |
Families and Households in La Paloma
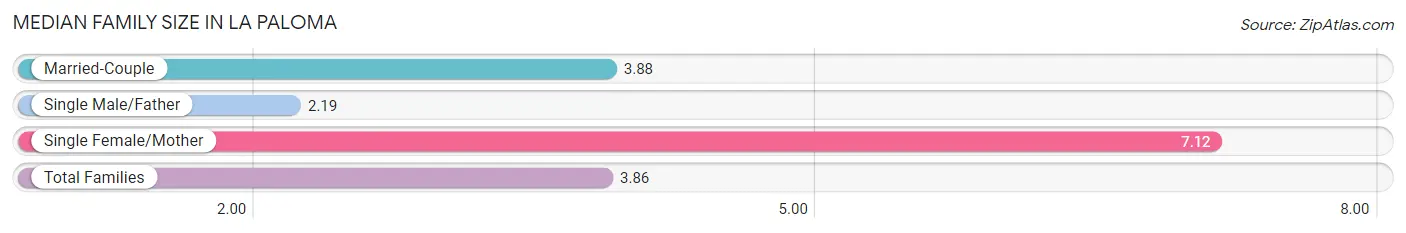
Median Family Size in La Paloma
The median family size in La Paloma is 3.86 persons per family, with single female/mother families (76 | 10.9%) accounting for the largest median family size of 7.12 persons per family. On the other hand, single male/father families (154 | 22.0%) represent the smallest median family size with 2.19 persons per family.
| Family Type | # Families | Family Size |
| Married-Couple | 469 (67.1%) | 3.88 |
| Single Male/Father | 154 (22.0%) | 2.19 |
| Single Female/Mother | 76 (10.9%) | 7.12 |
| Total Families | 699 (100.0%) | 3.86 |
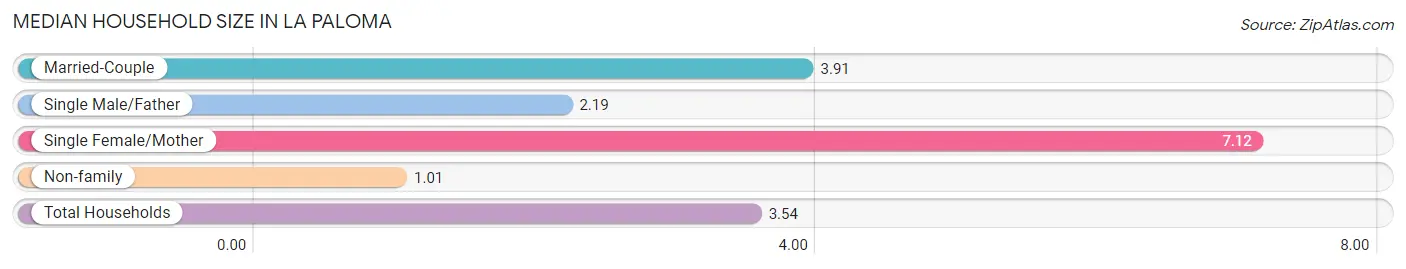
Median Household Size in La Paloma
The median household size in La Paloma is 3.54 persons per household, with single female/mother households (76 | 9.6%) accounting for the largest median household size of 7.12 persons per household. non-family households (94 | 11.8%) represent the smallest median household size with 1.01 persons per household.
| Household Type | # Households | Household Size |
| Married-Couple | 469 (59.1%) | 3.91 |
| Single Male/Father | 154 (19.4%) | 2.19 |
| Single Female/Mother | 76 (9.6%) | 7.12 |
| Non-family | 94 (11.8%) | 1.01 |
| Total Households | 793 (100.0%) | 3.54 |
Household Size by Marriage Status in La Paloma
Out of a total of 793 households in La Paloma, 699 (88.1%) are family households, while 94 (11.8%) are nonfamily households. The most numerous type of family households are 4-person households, comprising 278, and the most common type of nonfamily households are 1-person households, comprising 92.
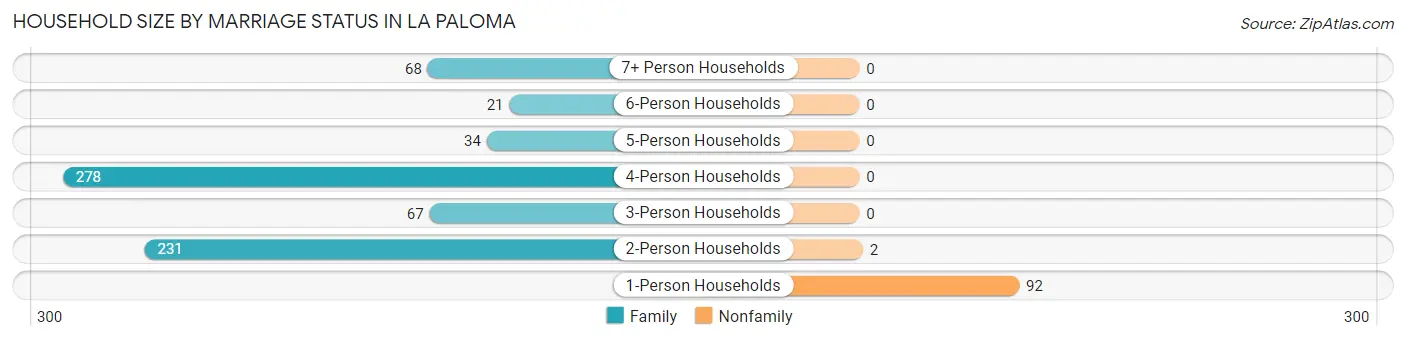
| Household Size | Family Households | Nonfamily Households |
| 1-Person Households | - | 92 (11.6%) |
| 2-Person Households | 231 (29.1%) | 2 (0.3%) |
| 3-Person Households | 67 (8.5%) | 0 (0.0%) |
| 4-Person Households | 278 (35.1%) | 0 (0.0%) |
| 5-Person Households | 34 (4.3%) | 0 (0.0%) |
| 6-Person Households | 21 (2.6%) | 0 (0.0%) |
| 7+ Person Households | 68 (8.6%) | 0 (0.0%) |
| Total | 699 (88.1%) | 94 (11.8%) |
Female Fertility in La Paloma
Fertility by Age in La Paloma
Average fertility rate in La Paloma is 11.0 births per 1,000 women. Women in the age bracket of 35 to 50 years have the highest fertility rate with 29.0 births per 1,000 women. Women in the age bracket of 35 to 50 years acount for 100.0% of all women with births.
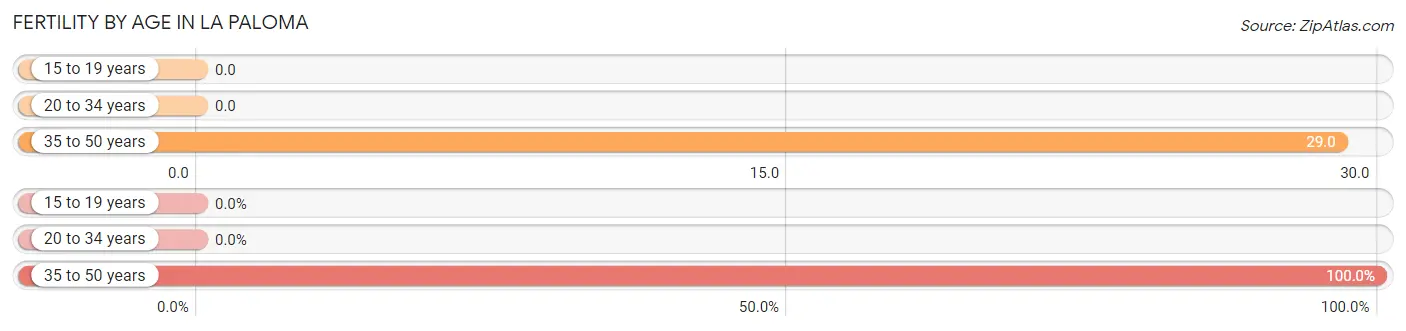
| Age Bracket | Women with Births | Births / 1,000 Women |
| 15 to 19 years | 0 (0.0%) | 0.0 |
| 20 to 34 years | 0 (0.0%) | 0.0 |
| 35 to 50 years | 8 (100.0%) | 29.0 |
| Total | 8 (100.0%) | 11.0 |
Fertility by Age by Marriage Status in La Paloma
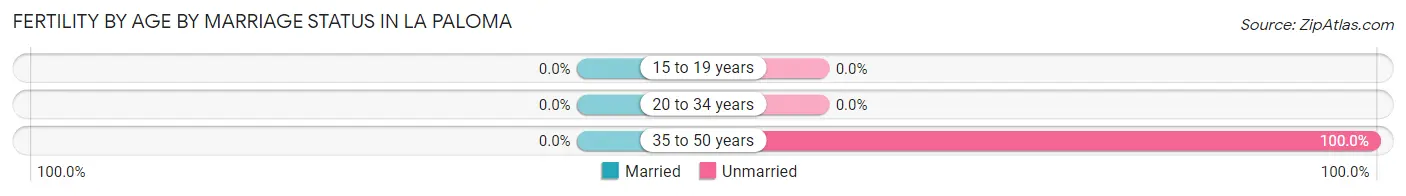
| Age Bracket | Married | Unmarried |
| 15 to 19 years | 0 (0.0%) | 0 (0.0%) |
| 20 to 34 years | 0 (0.0%) | 0 (0.0%) |
| 35 to 50 years | 0 (0.0%) | 8 (100.0%) |
| Total | 0 (0.0%) | 8 (100.0%) |
Fertility by Education in La Paloma
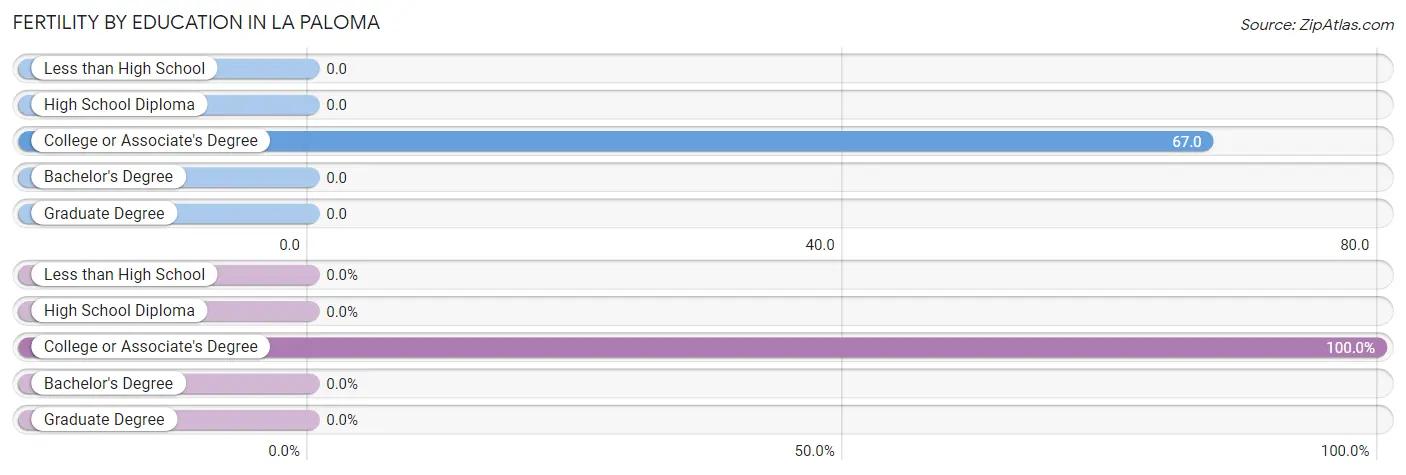
| Educational Attainment | Women with Births | Births / 1,000 Women |
| Less than High School | 0 (0.0%) | 0.0 |
| High School Diploma | 0 (0.0%) | 0.0 |
| College or Associate's Degree | 8 (100.0%) | 67.0 |
| Bachelor's Degree | 0 (0.0%) | 0.0 |
| Graduate Degree | 0 (0.0%) | 0.0 |
| Total | 8 (100.0%) | 11.0 |
Fertility by Education by Marriage Status in La Paloma
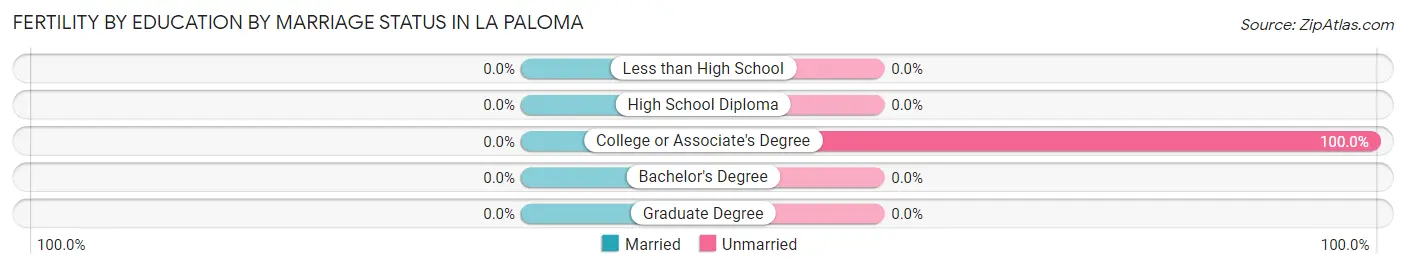
| Educational Attainment | Married | Unmarried |
| Less than High School | 0 (0.0%) | 0 (0.0%) |
| High School Diploma | 0 (0.0%) | 0 (0.0%) |
| College or Associate's Degree | 0 (0.0%) | 8 (100.0%) |
| Bachelor's Degree | 0 (0.0%) | 0 (0.0%) |
| Graduate Degree | 0 (0.0%) | 0 (0.0%) |
| Total | 0 (0.0%) | 8 (100.0%) |
Employment Characteristics in La Paloma
Employment by Class of Employer in La Paloma
Among the 1,154 employed individuals in La Paloma, private company employees (894 | 77.5%), self-employed (not incorporated) (155 | 13.4%), and local government employees (49 | 4.3%) make up the most common classes of employment.
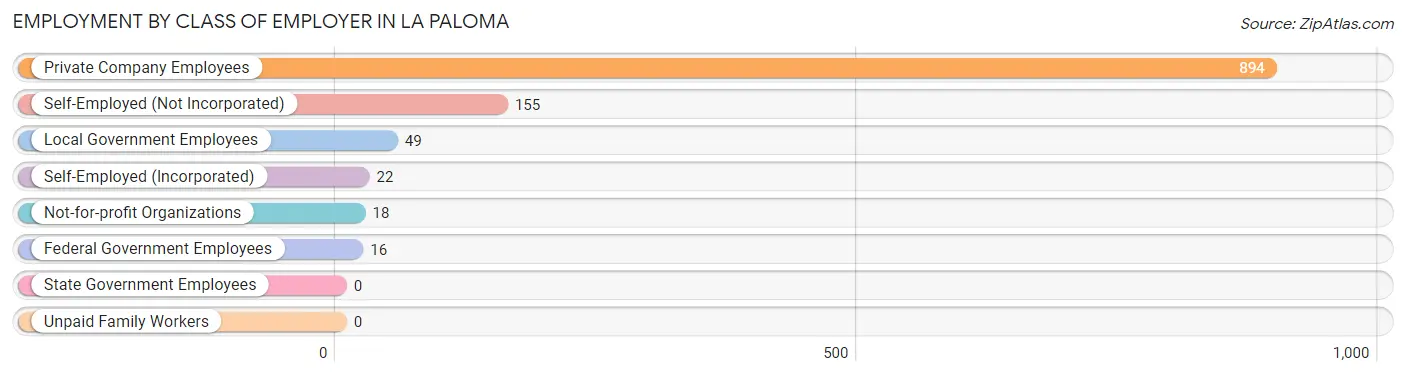
| Employer Class | # Employees | % Employees |
| Private Company Employees | 894 | 77.5% |
| Self-Employed (Incorporated) | 22 | 1.9% |
| Self-Employed (Not Incorporated) | 155 | 13.4% |
| Not-for-profit Organizations | 18 | 1.6% |
| Local Government Employees | 49 | 4.3% |
| State Government Employees | 0 | 0.0% |
| Federal Government Employees | 16 | 1.4% |
| Unpaid Family Workers | 0 | 0.0% |
| Total | 1,154 | 100.0% |
Employment Status by Age in La Paloma
According to the labor force statistics for La Paloma, out of the total population over 16 years of age (1,902), 62.3% or 1,185 individuals are in the labor force, with 2.6% or 31 of them unemployed. The age group with the highest labor force participation rate is 35 to 44 years, with 89.0% or 461 individuals in the labor force. Within the labor force, the 65 to 74 years age range has the highest percentage of unemployed individuals, with 15.5% or 11 of them being unemployed.
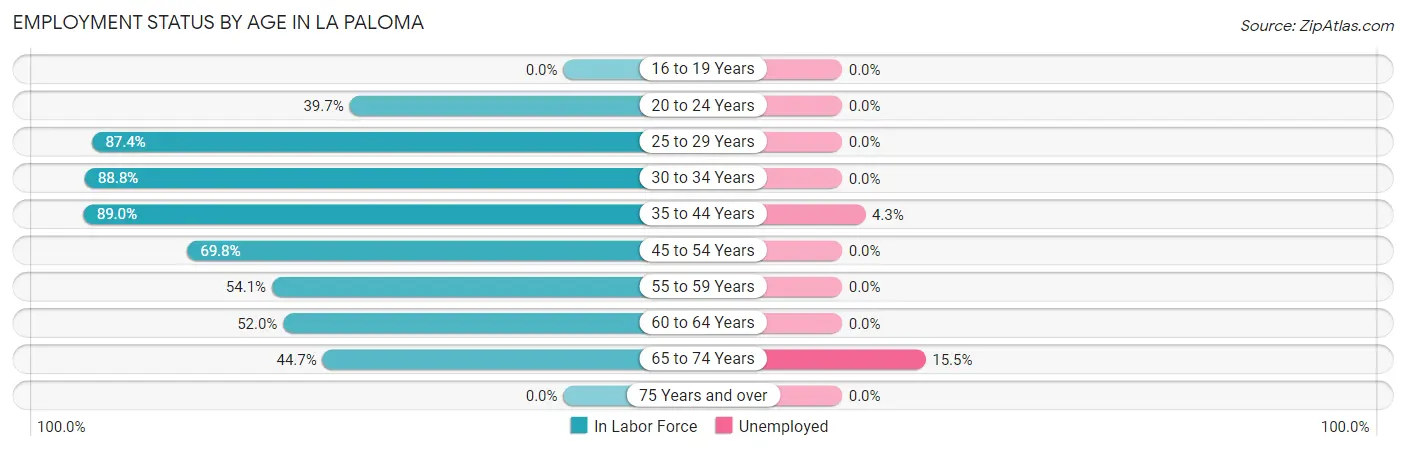
| Age Bracket | In Labor Force | Unemployed |
| 16 to 19 Years | 0 (0.0%) | 0 (0.0%) |
| 20 to 24 Years | 29 (39.7%) | 0 (0.0%) |
| 25 to 29 Years | 181 (87.4%) | 0 (0.0%) |
| 30 to 34 Years | 135 (88.8%) | 0 (0.0%) |
| 35 to 44 Years | 461 (89.0%) | 20 (4.3%) |
| 45 to 54 Years | 125 (69.8%) | 0 (0.0%) |
| 55 to 59 Years | 131 (54.1%) | 0 (0.0%) |
| 60 to 64 Years | 52 (52.0%) | 0 (0.0%) |
| 65 to 74 Years | 71 (44.7%) | 11 (15.5%) |
| 75 Years and over | 0 (0.0%) | 0 (0.0%) |
| Total | 1,185 (62.3%) | 31 (2.6%) |
Employment Status by Educational Attainment in La Paloma
According to labor force statistics for La Paloma, 77.6% of individuals (1,085) out of the total population between 25 and 64 years of age (1,398) are in the labor force, with 1.8% or 20 of them being unemployed. The group with the highest labor force participation rate are those with the educational attainment of bachelor's degree or higher, with 100.0% or 233 individuals in the labor force. Within the labor force, individuals with less than high school education have the highest percentage of unemployment, with 5.2% or 20 of them being unemployed.
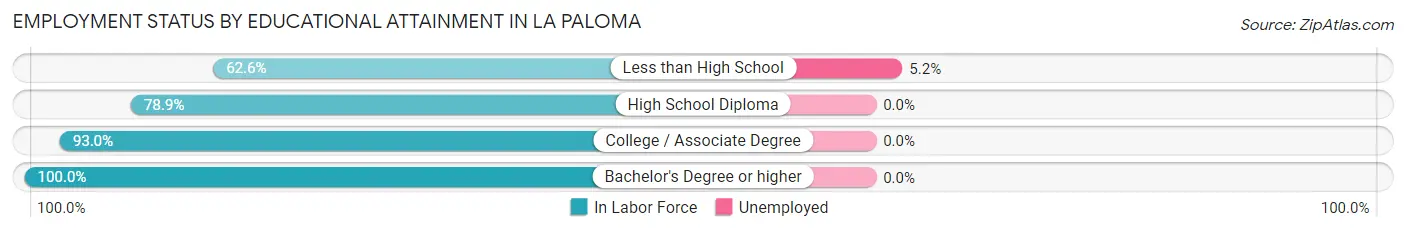
| Educational Attainment | In Labor Force | Unemployed |
| Less than High School | 388 (62.6%) | 32 (5.2%) |
| High School Diploma | 239 (78.9%) | 0 (0.0%) |
| College / Associate Degree | 225 (93.0%) | 0 (0.0%) |
| Bachelor's Degree or higher | 233 (100.0%) | 0 (0.0%) |
| Total | 1,085 (77.6%) | 25 (1.8%) |
Employment Occupations by Sex in La Paloma
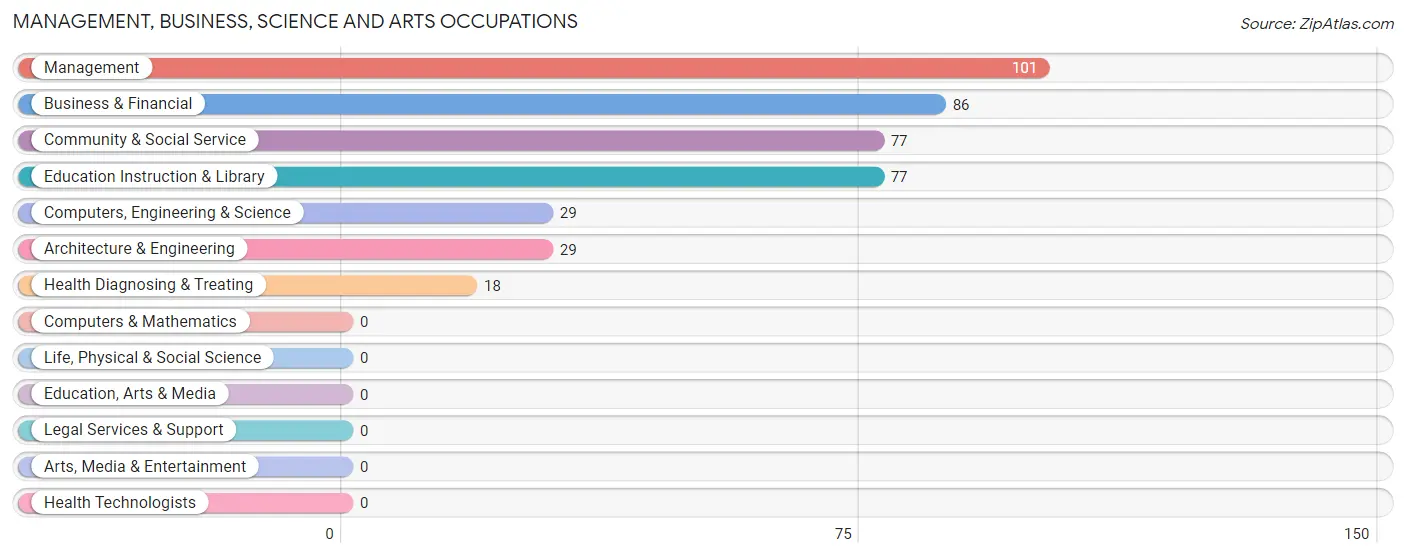
Management, Business, Science and Arts Occupations
The most common Management, Business, Science and Arts occupations in La Paloma are Management (101 | 8.7%), Business & Financial (86 | 7.4%), Community & Social Service (77 | 6.7%), Education Instruction & Library (77 | 6.7%), and Computers, Engineering & Science (29 | 2.5%).
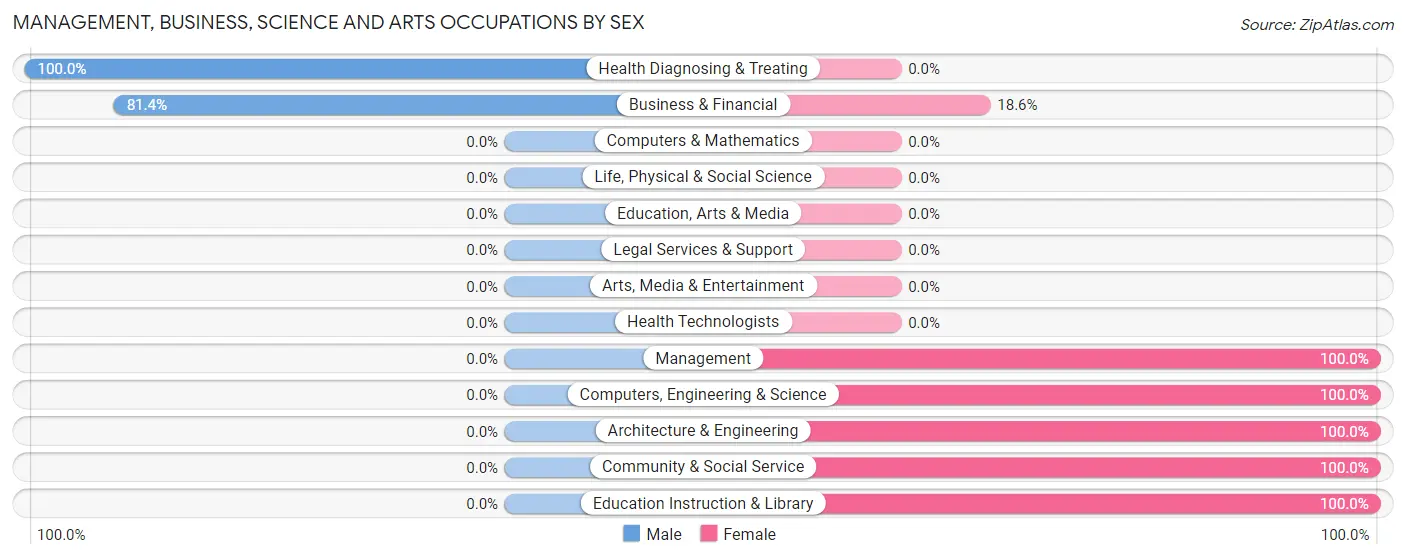
Management, Business, Science and Arts Occupations by Sex
Within the Management, Business, Science and Arts occupations in La Paloma, the most male-oriented occupations are Health Diagnosing & Treating (100.0%), and Business & Financial (81.4%), while the most female-oriented occupations are Management (100.0%), Computers, Engineering & Science (100.0%), and Architecture & Engineering (100.0%).
| Occupation | Male | Female |
| Management | 0 (0.0%) | 101 (100.0%) |
| Business & Financial | 70 (81.4%) | 16 (18.6%) |
| Computers, Engineering & Science | 0 (0.0%) | 29 (100.0%) |
| Computers & Mathematics | 0 (0.0%) | 0 (0.0%) |
| Architecture & Engineering | 0 (0.0%) | 29 (100.0%) |
| Life, Physical & Social Science | 0 (0.0%) | 0 (0.0%) |
| Community & Social Service | 0 (0.0%) | 77 (100.0%) |
| Education, Arts & Media | 0 (0.0%) | 0 (0.0%) |
| Legal Services & Support | 0 (0.0%) | 0 (0.0%) |
| Education Instruction & Library | 0 (0.0%) | 77 (100.0%) |
| Arts, Media & Entertainment | 0 (0.0%) | 0 (0.0%) |
| Health Diagnosing & Treating | 18 (100.0%) | 0 (0.0%) |
| Health Technologists | 0 (0.0%) | 0 (0.0%) |
| Total (Category) | 88 (28.3%) | 223 (71.7%) |
| Total (Overall) | 675 (58.5%) | 479 (41.5%) |
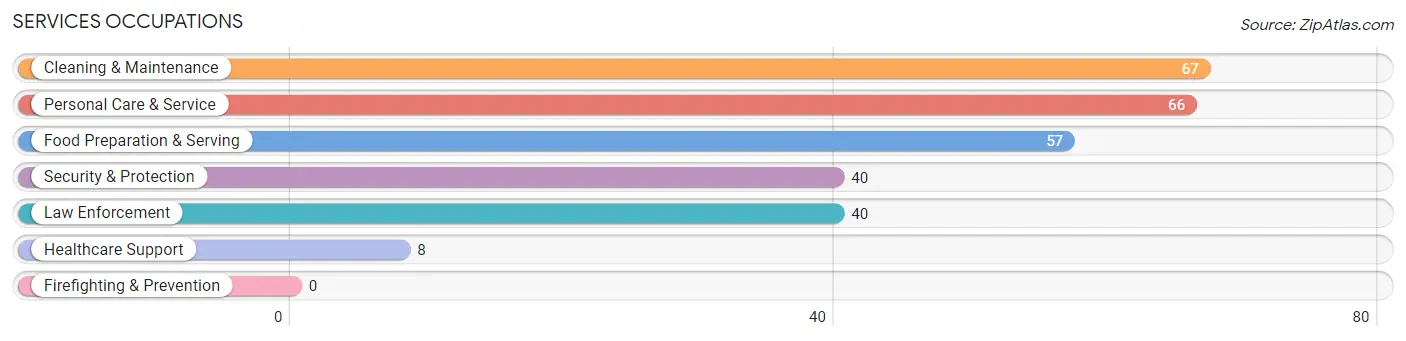
Services Occupations
The most common Services occupations in La Paloma are Cleaning & Maintenance (67 | 5.8%), Personal Care & Service (66 | 5.7%), Food Preparation & Serving (57 | 4.9%), Security & Protection (40 | 3.5%), and Law Enforcement (40 | 3.5%).
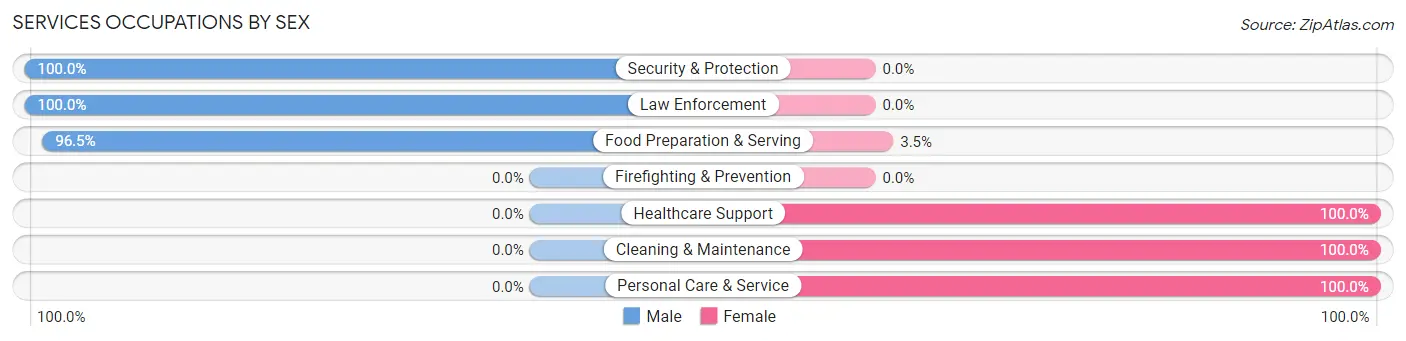
Services Occupations by Sex
Within the Services occupations in La Paloma, the most male-oriented occupations are Security & Protection (100.0%), Law Enforcement (100.0%), and Food Preparation & Serving (96.5%), while the most female-oriented occupations are Healthcare Support (100.0%), Cleaning & Maintenance (100.0%), and Personal Care & Service (100.0%).
| Occupation | Male | Female |
| Healthcare Support | 0 (0.0%) | 8 (100.0%) |
| Security & Protection | 40 (100.0%) | 0 (0.0%) |
| Firefighting & Prevention | 0 (0.0%) | 0 (0.0%) |
| Law Enforcement | 40 (100.0%) | 0 (0.0%) |
| Food Preparation & Serving | 55 (96.5%) | 2 (3.5%) |
| Cleaning & Maintenance | 0 (0.0%) | 67 (100.0%) |
| Personal Care & Service | 0 (0.0%) | 66 (100.0%) |
| Total (Category) | 95 (39.9%) | 143 (60.1%) |
| Total (Overall) | 675 (58.5%) | 479 (41.5%) |
Sales and Office Occupations
The most common Sales and Office occupations in La Paloma are Office & Administration (81 | 7.0%), and Sales & Related (43 | 3.7%).
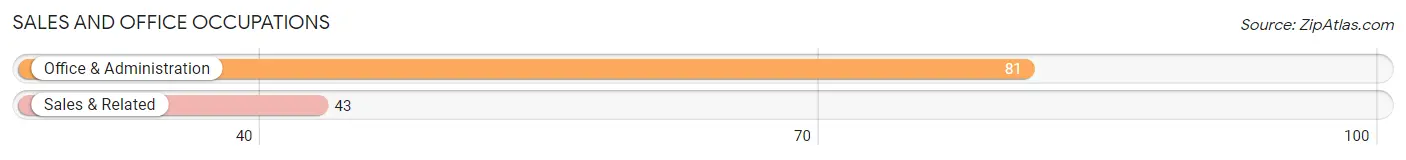
Sales and Office Occupations by Sex
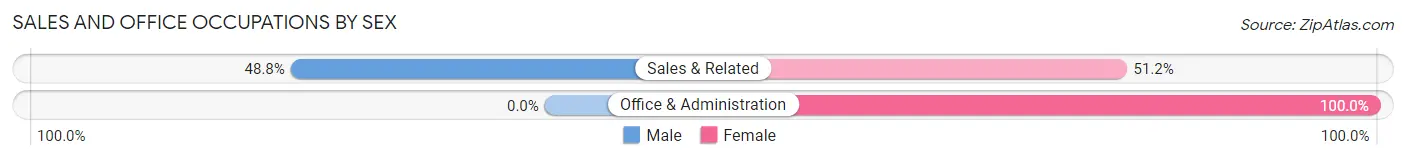
| Occupation | Male | Female |
| Sales & Related | 21 (48.8%) | 22 (51.2%) |
| Office & Administration | 0 (0.0%) | 81 (100.0%) |
| Total (Category) | 21 (16.9%) | 103 (83.1%) |
| Total (Overall) | 675 (58.5%) | 479 (41.5%) |
Natural Resources, Construction and Maintenance Occupations
The most common Natural Resources, Construction and Maintenance occupations in La Paloma are Construction & Extraction (177 | 15.3%), and Installation, Maintenance & Repair (119 | 10.3%).
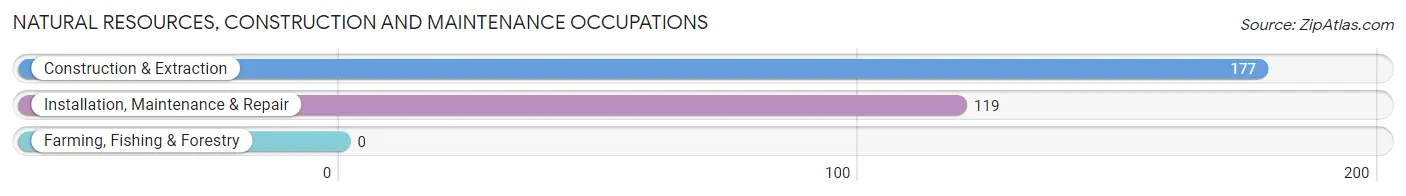
Natural Resources, Construction and Maintenance Occupations by Sex
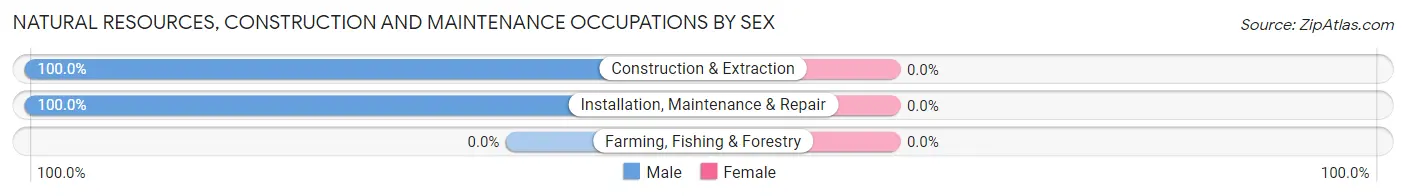
| Occupation | Male | Female |
| Farming, Fishing & Forestry | 0 (0.0%) | 0 (0.0%) |
| Construction & Extraction | 177 (100.0%) | 0 (0.0%) |
| Installation, Maintenance & Repair | 119 (100.0%) | 0 (0.0%) |
| Total (Category) | 296 (100.0%) | 0 (0.0%) |
| Total (Overall) | 675 (58.5%) | 479 (41.5%) |
Production, Transportation and Moving Occupations
The most common Production, Transportation and Moving occupations in La Paloma are Material Moving (132 | 11.4%), and Production (53 | 4.6%).
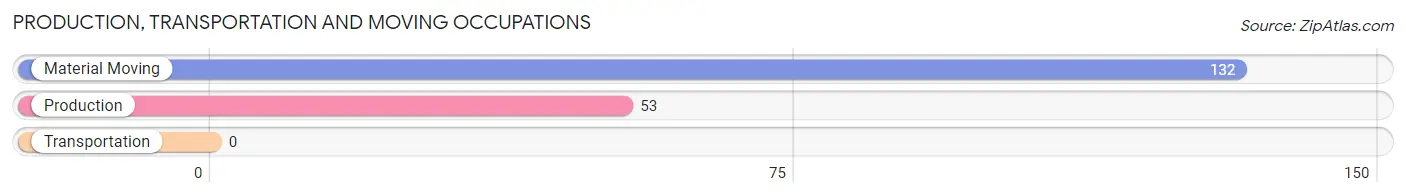
Production, Transportation and Moving Occupations by Sex
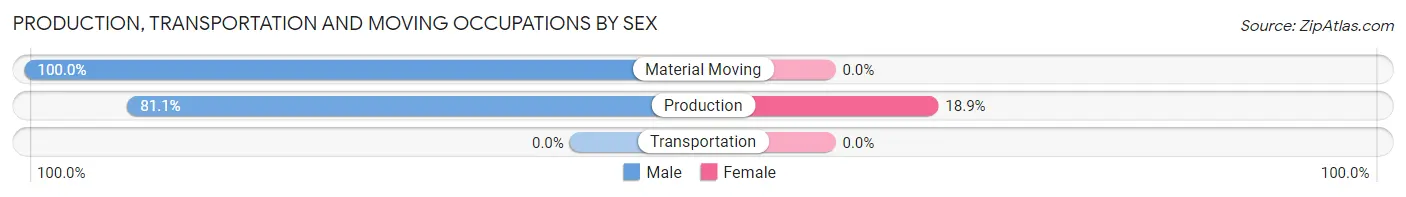
| Occupation | Male | Female |
| Production | 43 (81.1%) | 10 (18.9%) |
| Transportation | 0 (0.0%) | 0 (0.0%) |
| Material Moving | 132 (100.0%) | 0 (0.0%) |
| Total (Category) | 175 (94.6%) | 10 (5.4%) |
| Total (Overall) | 675 (58.5%) | 479 (41.5%) |
Employment Industries by Sex in La Paloma
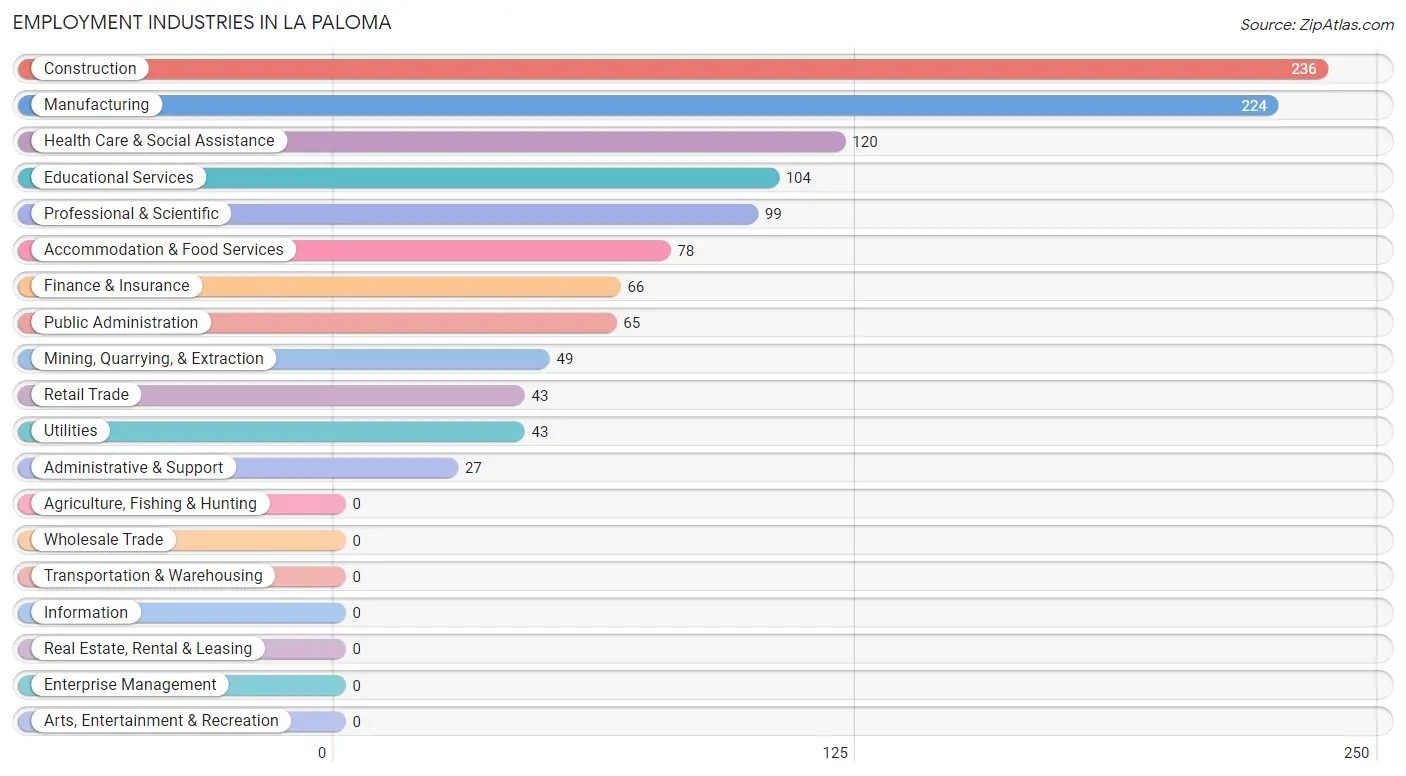
Employment Industries in La Paloma
The major employment industries in La Paloma include Construction (236 | 20.4%), Manufacturing (224 | 19.4%), Health Care & Social Assistance (120 | 10.4%), Educational Services (104 | 9.0%), and Professional & Scientific (99 | 8.6%).
Employment Industries by Sex in La Paloma
The La Paloma industries that see more men than women are Construction (100.0%), Accommodation & Food Services (97.4%), and Manufacturing (95.5%), whereas the industries that tend to have a higher number of women are Mining, Quarrying, & Extraction (100.0%), Utilities (100.0%), and Finance & Insurance (100.0%).
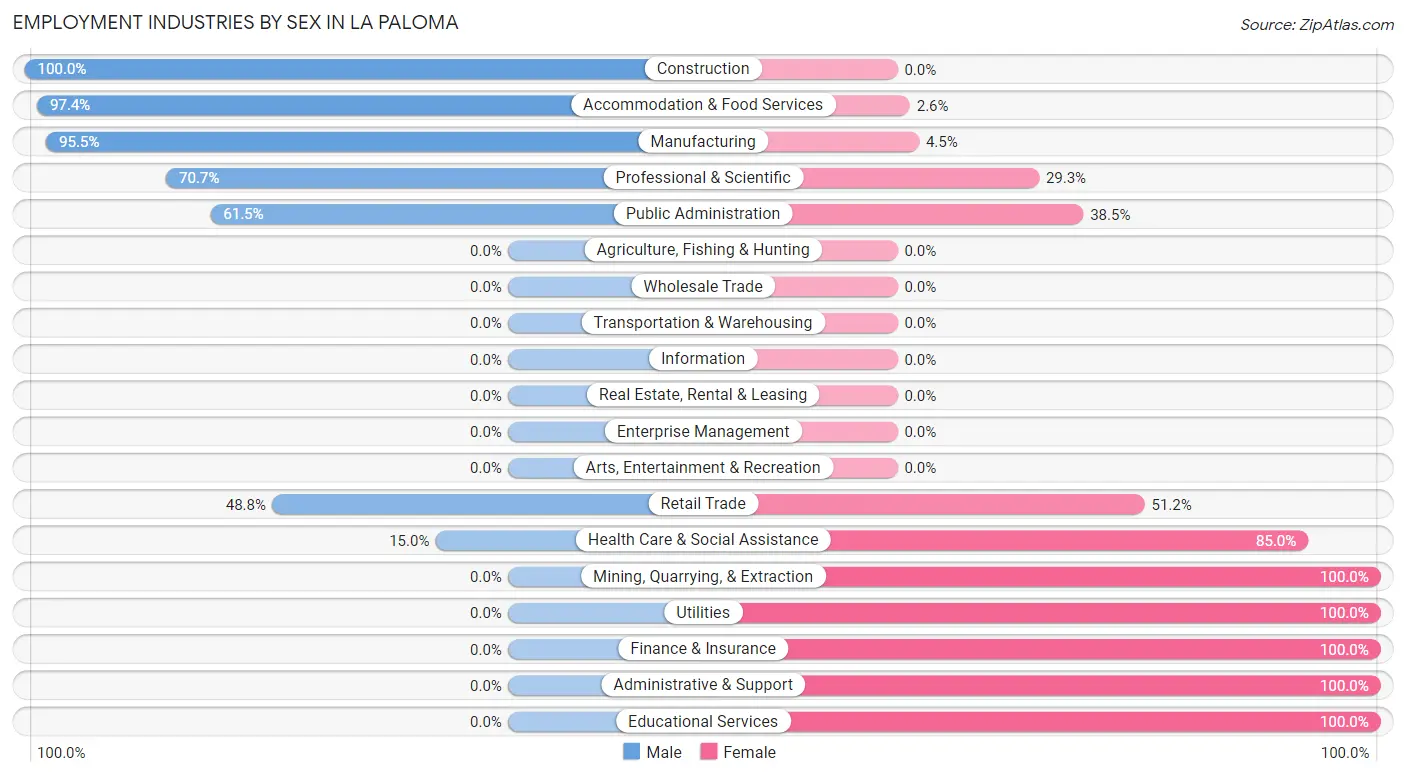
| Industry | Male | Female |
| Agriculture, Fishing & Hunting | 0 (0.0%) | 0 (0.0%) |
| Mining, Quarrying, & Extraction | 0 (0.0%) | 49 (100.0%) |
| Construction | 236 (100.0%) | 0 (0.0%) |
| Manufacturing | 214 (95.5%) | 10 (4.5%) |
| Wholesale Trade | 0 (0.0%) | 0 (0.0%) |
| Retail Trade | 21 (48.8%) | 22 (51.2%) |
| Transportation & Warehousing | 0 (0.0%) | 0 (0.0%) |
| Utilities | 0 (0.0%) | 43 (100.0%) |
| Information | 0 (0.0%) | 0 (0.0%) |
| Finance & Insurance | 0 (0.0%) | 66 (100.0%) |
| Real Estate, Rental & Leasing | 0 (0.0%) | 0 (0.0%) |
| Professional & Scientific | 70 (70.7%) | 29 (29.3%) |
| Enterprise Management | 0 (0.0%) | 0 (0.0%) |
| Administrative & Support | 0 (0.0%) | 27 (100.0%) |
| Educational Services | 0 (0.0%) | 104 (100.0%) |
| Health Care & Social Assistance | 18 (15.0%) | 102 (85.0%) |
| Arts, Entertainment & Recreation | 0 (0.0%) | 0 (0.0%) |
| Accommodation & Food Services | 76 (97.4%) | 2 (2.6%) |
| Public Administration | 40 (61.5%) | 25 (38.5%) |
| Total | 675 (58.5%) | 479 (41.5%) |
Education in La Paloma
School Enrollment in La Paloma
The most common levels of schooling among the 633 students in La Paloma are high school (244 | 38.6%), middle school (171 | 27.0%), and kindergarten (94 | 14.8%).
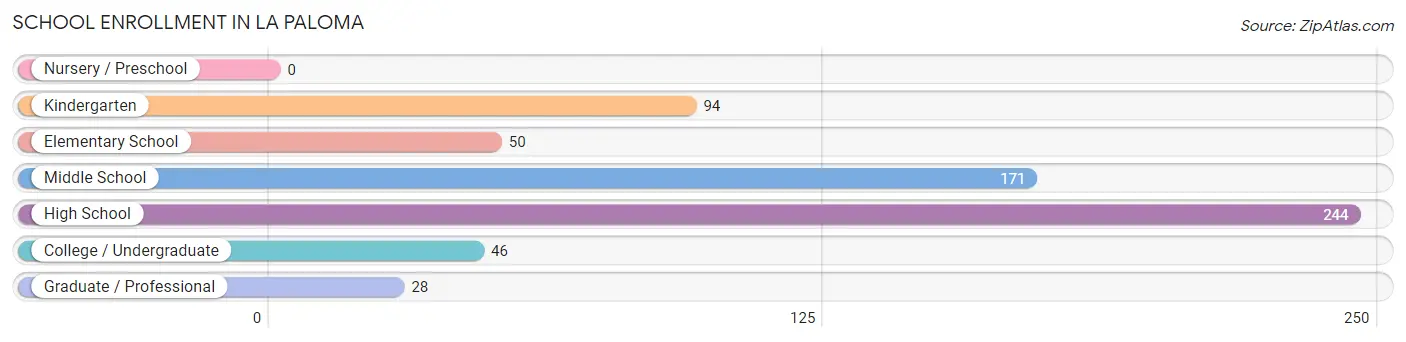
| School Level | # Students | % Students |
| Nursery / Preschool | 0 | 0.0% |
| Kindergarten | 94 | 14.8% |
| Elementary School | 50 | 7.9% |
| Middle School | 171 | 27.0% |
| High School | 244 | 38.6% |
| College / Undergraduate | 46 | 7.3% |
| Graduate / Professional | 28 | 4.4% |
| Total | 633 | 100.0% |
School Enrollment by Age by Funding Source in La Paloma
Out of a total of 633 students who are enrolled in schools in La Paloma, 141 (22.3%) attend a private institution, while the remaining 492 (77.7%) are enrolled in public schools. The age group of 20 to 24 year olds has the highest likelihood of being enrolled in private schools, with 29 (100.0% in the age bracket) enrolled. Conversely, the age group of 3 to 4 year olds has the lowest likelihood of being enrolled in a private school, with 10 (100.0% in the age bracket) attending a public institution.
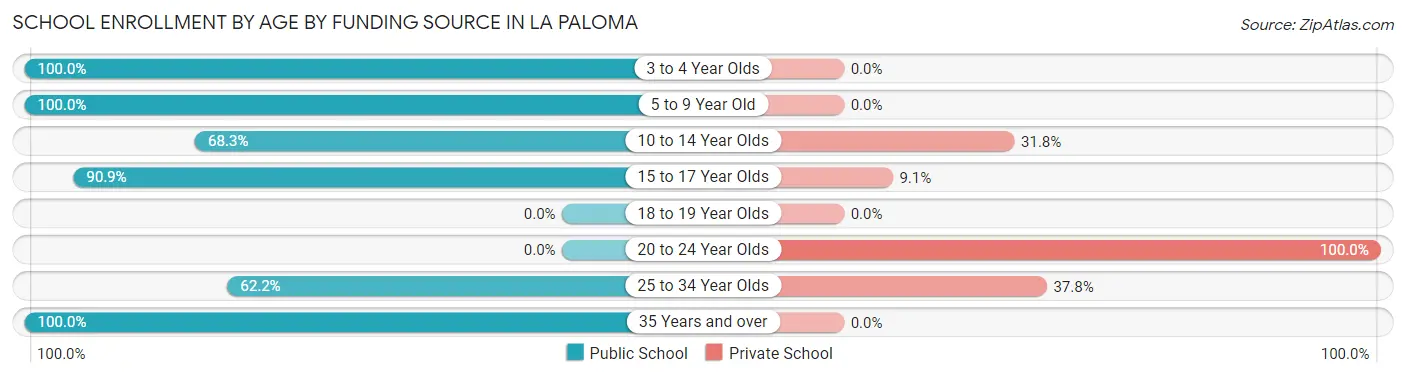
| Age Bracket | Public School | Private School |
| 3 to 4 Year Olds | 10 (100.0%) | 0 (0.0%) |
| 5 to 9 Year Old | 108 (100.0%) | 0 (0.0%) |
| 10 to 14 Year Olds | 172 (68.2%) | 80 (31.8%) |
| 15 to 17 Year Olds | 150 (90.9%) | 15 (9.1%) |
| 18 to 19 Year Olds | 0 (0.0%) | 0 (0.0%) |
| 20 to 24 Year Olds | 0 (0.0%) | 29 (100.0%) |
| 25 to 34 Year Olds | 28 (62.2%) | 17 (37.8%) |
| 35 Years and over | 24 (100.0%) | 0 (0.0%) |
| Total | 492 (77.7%) | 141 (22.3%) |
Educational Attainment by Field of Study in La Paloma
Arts & humanities (81 | 34.8%), business (72 | 30.9%), education (31 | 13.3%), physical & health sciences (22 | 9.4%), and literature & languages (18 | 7.7%) are the most common fields of study among 233 individuals in La Paloma who have obtained a bachelor's degree or higher.
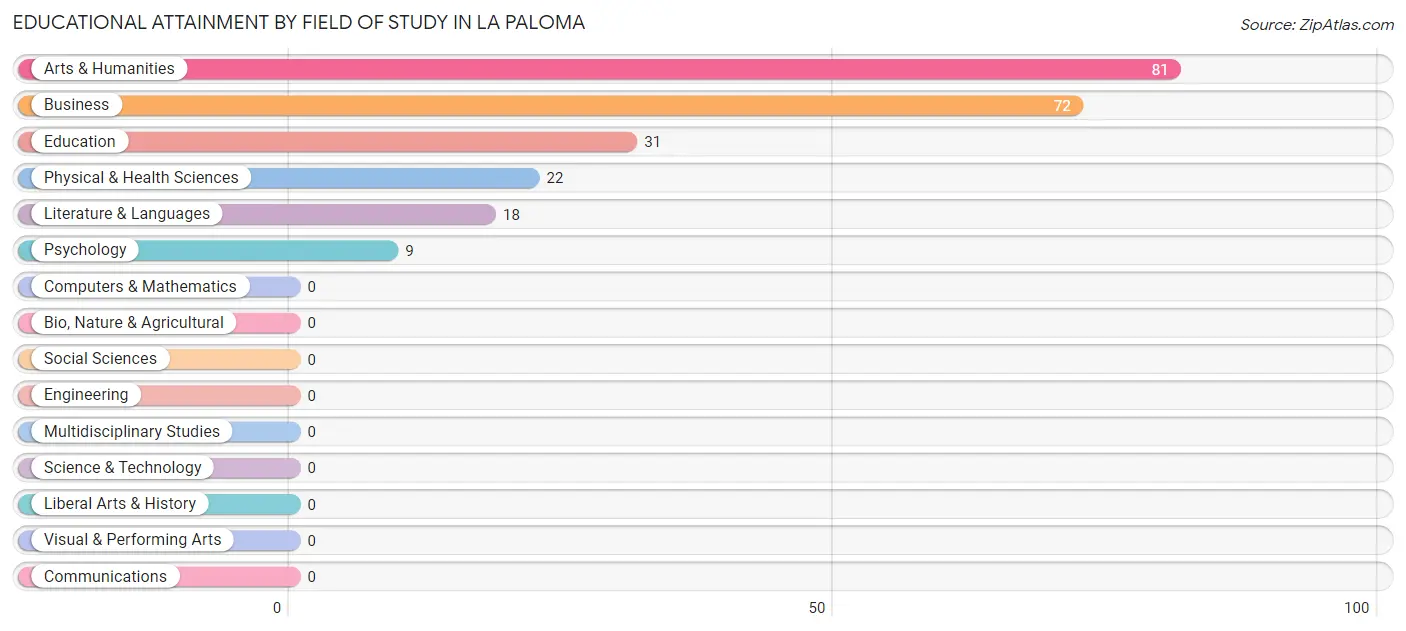
| Field of Study | # Graduates | % Graduates |
| Computers & Mathematics | 0 | 0.0% |
| Bio, Nature & Agricultural | 0 | 0.0% |
| Physical & Health Sciences | 22 | 9.4% |
| Psychology | 9 | 3.9% |
| Social Sciences | 0 | 0.0% |
| Engineering | 0 | 0.0% |
| Multidisciplinary Studies | 0 | 0.0% |
| Science & Technology | 0 | 0.0% |
| Business | 72 | 30.9% |
| Education | 31 | 13.3% |
| Literature & Languages | 18 | 7.7% |
| Liberal Arts & History | 0 | 0.0% |
| Visual & Performing Arts | 0 | 0.0% |
| Communications | 0 | 0.0% |
| Arts & Humanities | 81 | 34.8% |
| Total | 233 | 100.0% |
Transportation & Commute in La Paloma
Vehicle Availability by Sex in La Paloma
The most prevalent vehicle ownership categories in La Paloma are males with 2 vehicles (218, accounting for 32.3%) and females with 2 vehicles (192, making up 45.5%).
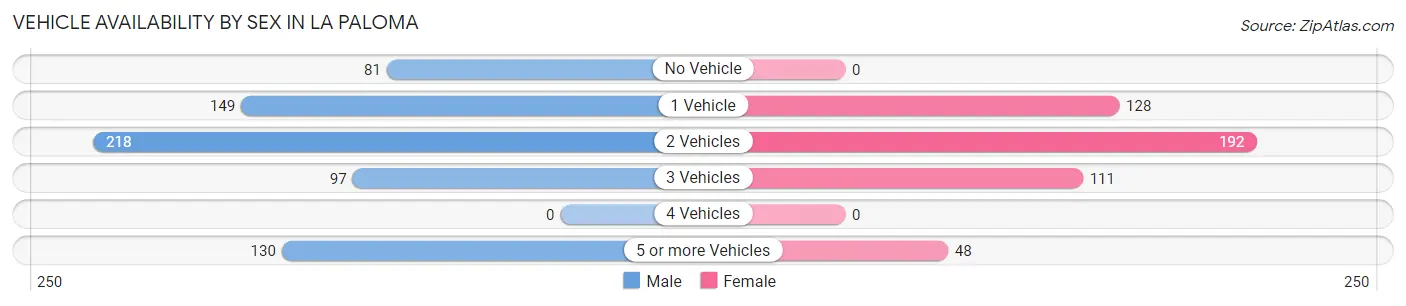
| Vehicles Available | Male | Female |
| No Vehicle | 81 (12.0%) | 0 (0.0%) |
| 1 Vehicle | 149 (22.1%) | 128 (26.7%) |
| 2 Vehicles | 218 (32.3%) | 192 (40.1%) |
| 3 Vehicles | 97 (14.4%) | 111 (23.2%) |
| 4 Vehicles | 0 (0.0%) | 0 (0.0%) |
| 5 or more Vehicles | 130 (19.3%) | 48 (10.0%) |
| Total | 675 (100.0%) | 479 (100.0%) |
Commute Time in La Paloma
The most frequently occuring commute durations in La Paloma are 30 to 34 minutes (394 commuters, 43.3%), 20 to 24 minutes (175 commuters, 19.2%), and 15 to 19 minutes (163 commuters, 17.9%).
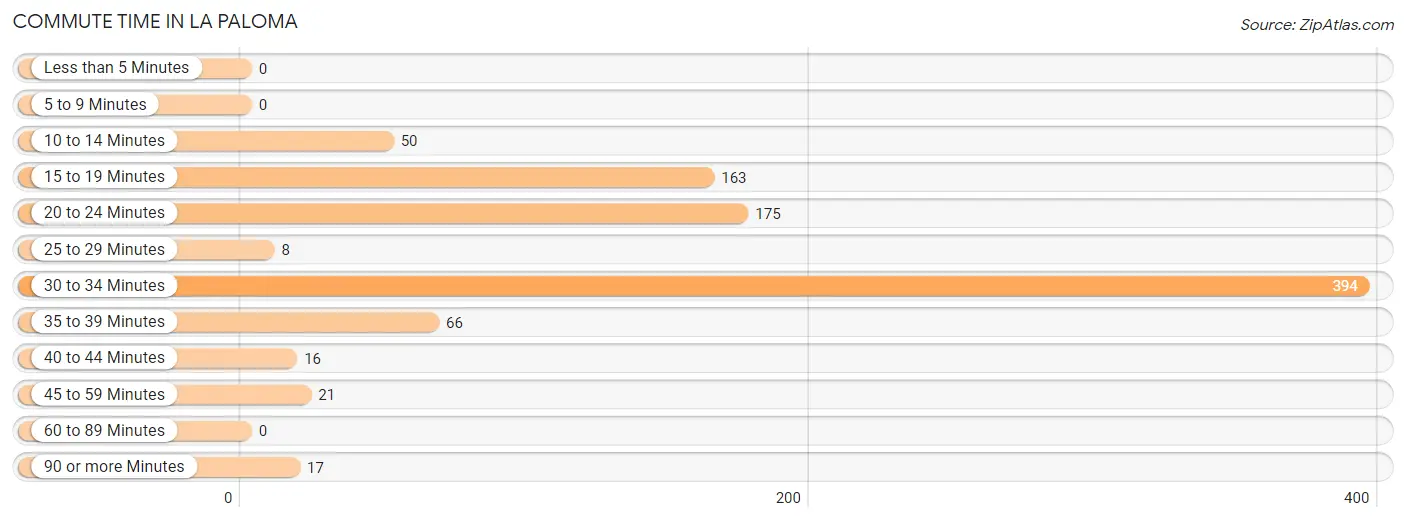
| Commute Time | # Commuters | % Commuters |
| Less than 5 Minutes | 0 | 0.0% |
| 5 to 9 Minutes | 0 | 0.0% |
| 10 to 14 Minutes | 50 | 5.5% |
| 15 to 19 Minutes | 163 | 17.9% |
| 20 to 24 Minutes | 175 | 19.2% |
| 25 to 29 Minutes | 8 | 0.9% |
| 30 to 34 Minutes | 394 | 43.3% |
| 35 to 39 Minutes | 66 | 7.2% |
| 40 to 44 Minutes | 16 | 1.8% |
| 45 to 59 Minutes | 21 | 2.3% |
| 60 to 89 Minutes | 0 | 0.0% |
| 90 or more Minutes | 17 | 1.9% |
Commute Time by Sex in La Paloma
The most common commute times in La Paloma are 30 to 34 minutes (275 commuters, 50.4%) for males and 30 to 34 minutes (119 commuters, 32.7%) for females.
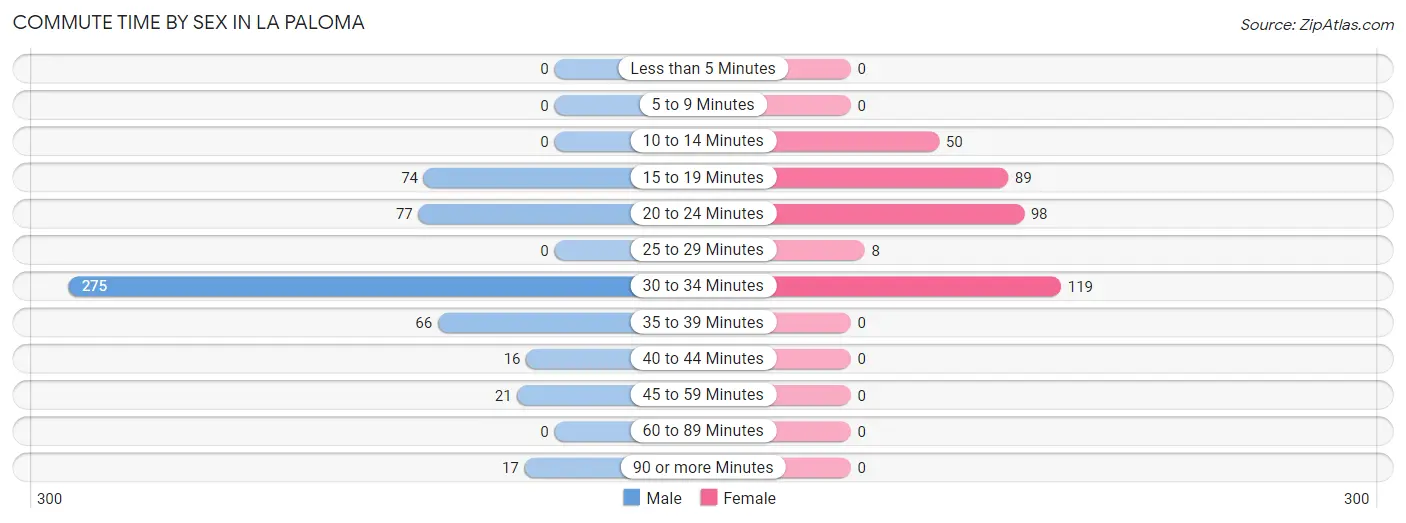
| Commute Time | Male | Female |
| Less than 5 Minutes | 0 (0.0%) | 0 (0.0%) |
| 5 to 9 Minutes | 0 (0.0%) | 0 (0.0%) |
| 10 to 14 Minutes | 0 (0.0%) | 50 (13.7%) |
| 15 to 19 Minutes | 74 (13.6%) | 89 (24.4%) |
| 20 to 24 Minutes | 77 (14.1%) | 98 (26.9%) |
| 25 to 29 Minutes | 0 (0.0%) | 8 (2.2%) |
| 30 to 34 Minutes | 275 (50.4%) | 119 (32.7%) |
| 35 to 39 Minutes | 66 (12.1%) | 0 (0.0%) |
| 40 to 44 Minutes | 16 (2.9%) | 0 (0.0%) |
| 45 to 59 Minutes | 21 (3.8%) | 0 (0.0%) |
| 60 to 89 Minutes | 0 (0.0%) | 0 (0.0%) |
| 90 or more Minutes | 17 (3.1%) | 0 (0.0%) |
Time of Departure to Work by Sex in La Paloma
The most frequent times of departure to work in La Paloma are 8:00 AM to 8:29 AM (122, 22.3%) for males and 7:30 AM to 7:59 AM (88, 24.2%) for females.
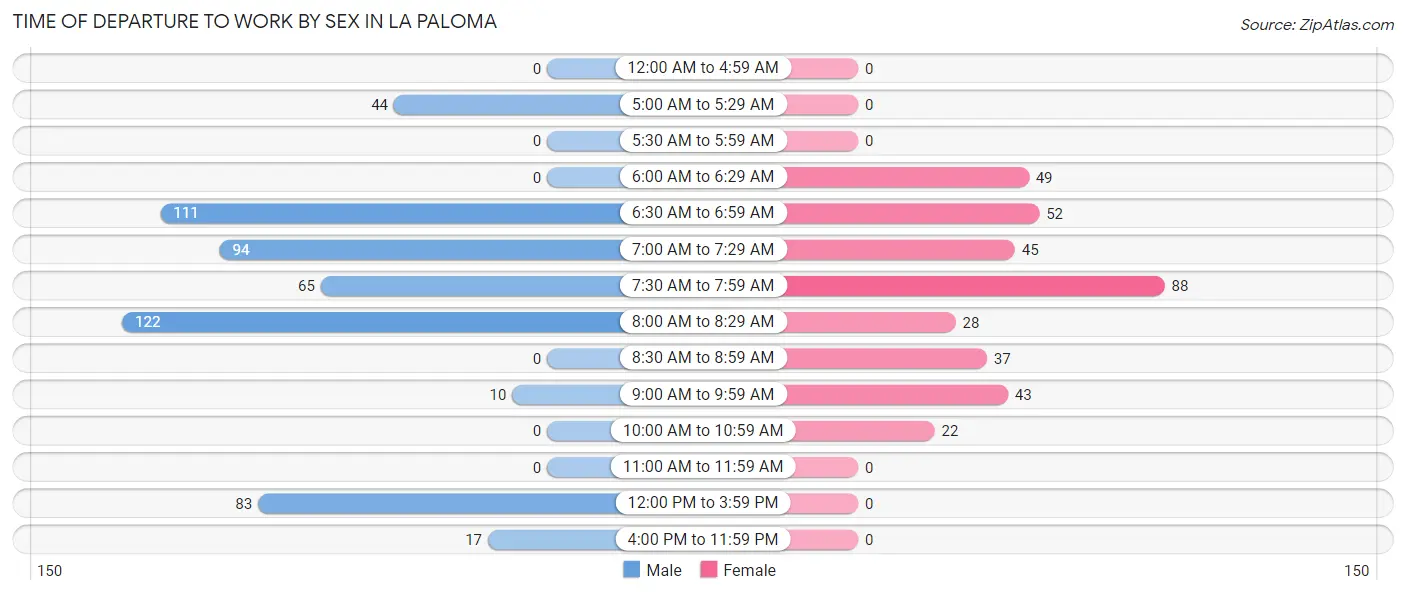
| Time of Departure | Male | Female |
| 12:00 AM to 4:59 AM | 0 (0.0%) | 0 (0.0%) |
| 5:00 AM to 5:29 AM | 44 (8.1%) | 0 (0.0%) |
| 5:30 AM to 5:59 AM | 0 (0.0%) | 0 (0.0%) |
| 6:00 AM to 6:29 AM | 0 (0.0%) | 49 (13.5%) |
| 6:30 AM to 6:59 AM | 111 (20.3%) | 52 (14.3%) |
| 7:00 AM to 7:29 AM | 94 (17.2%) | 45 (12.4%) |
| 7:30 AM to 7:59 AM | 65 (11.9%) | 88 (24.2%) |
| 8:00 AM to 8:29 AM | 122 (22.3%) | 28 (7.7%) |
| 8:30 AM to 8:59 AM | 0 (0.0%) | 37 (10.2%) |
| 9:00 AM to 9:59 AM | 10 (1.8%) | 43 (11.8%) |
| 10:00 AM to 10:59 AM | 0 (0.0%) | 22 (6.0%) |
| 11:00 AM to 11:59 AM | 0 (0.0%) | 0 (0.0%) |
| 12:00 PM to 3:59 PM | 83 (15.2%) | 0 (0.0%) |
| 4:00 PM to 11:59 PM | 17 (3.1%) | 0 (0.0%) |
| Total | 546 (100.0%) | 364 (100.0%) |
Housing Occupancy in La Paloma
Occupancy by Ownership in La Paloma
Of the total 793 dwellings in La Paloma, owner-occupied units account for 662 (83.5%), while renter-occupied units make up 131 (16.5%).
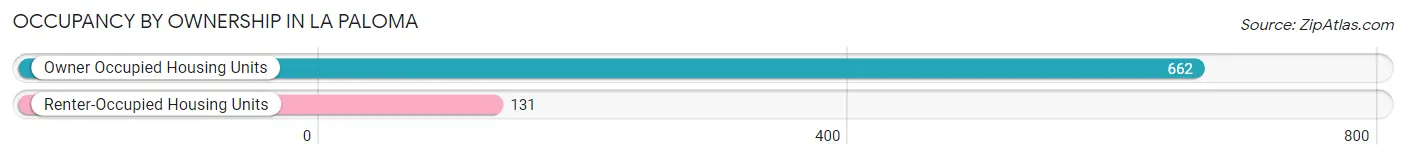
| Occupancy | # Housing Units | % Housing Units |
| Owner Occupied Housing Units | 662 | 83.5% |
| Renter-Occupied Housing Units | 131 | 16.5% |
| Total Occupied Housing Units | 793 | 100.0% |
Occupancy by Household Size in La Paloma
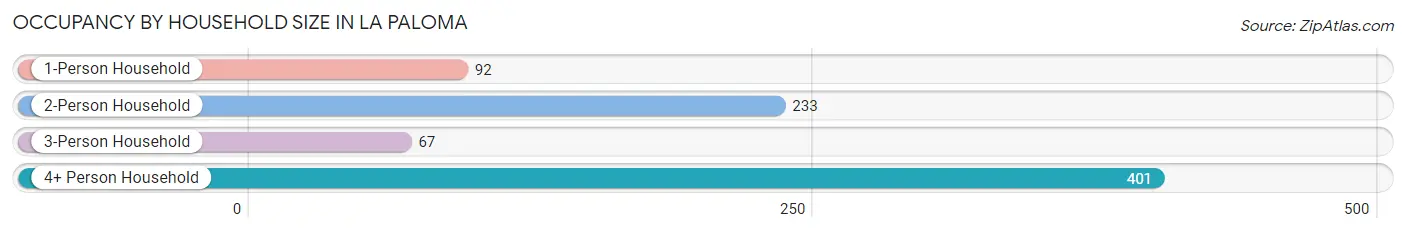
| Household Size | # Housing Units | % Housing Units |
| 1-Person Household | 92 | 11.6% |
| 2-Person Household | 233 | 29.4% |
| 3-Person Household | 67 | 8.5% |
| 4+ Person Household | 401 | 50.6% |
| Total Housing Units | 793 | 100.0% |
Occupancy by Ownership by Household Size in La Paloma
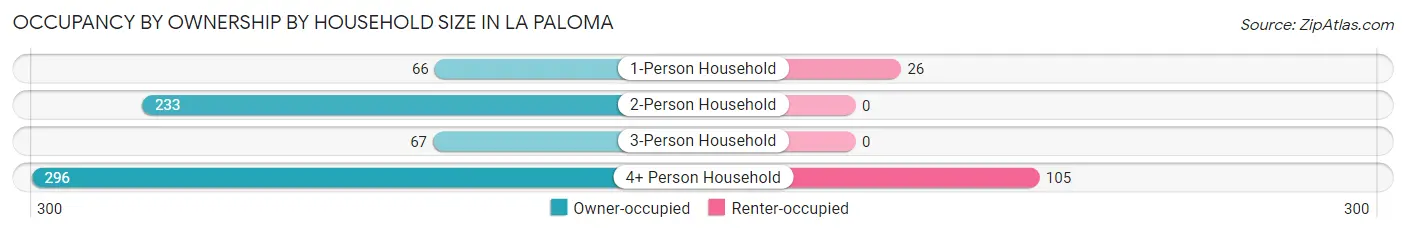
| Household Size | Owner-occupied | Renter-occupied |
| 1-Person Household | 66 (71.7%) | 26 (28.3%) |
| 2-Person Household | 233 (100.0%) | 0 (0.0%) |
| 3-Person Household | 67 (100.0%) | 0 (0.0%) |
| 4+ Person Household | 296 (73.8%) | 105 (26.2%) |
| Total Housing Units | 662 (83.5%) | 131 (16.5%) |
Occupancy by Educational Attainment in La Paloma
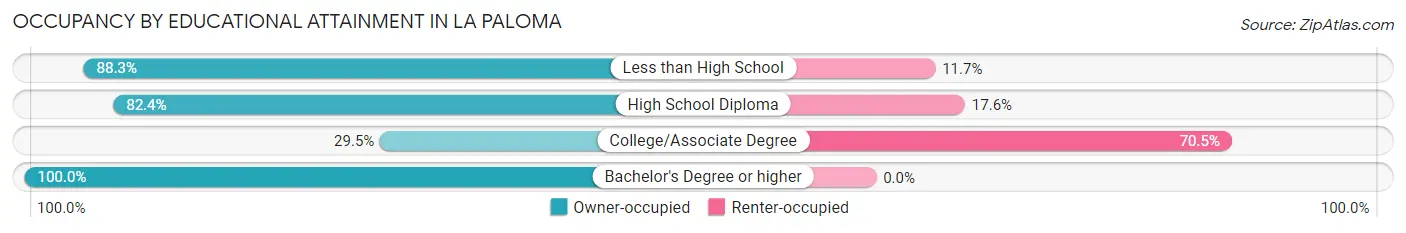
| Household Size | Owner-occupied | Renter-occupied |
| Less than High School | 279 (88.3%) | 37 (11.7%) |
| High School Diploma | 239 (82.4%) | 51 (17.6%) |
| College/Associate Degree | 18 (29.5%) | 43 (70.5%) |
| Bachelor's Degree or higher | 126 (100.0%) | 0 (0.0%) |
Occupancy by Age of Householder in La Paloma
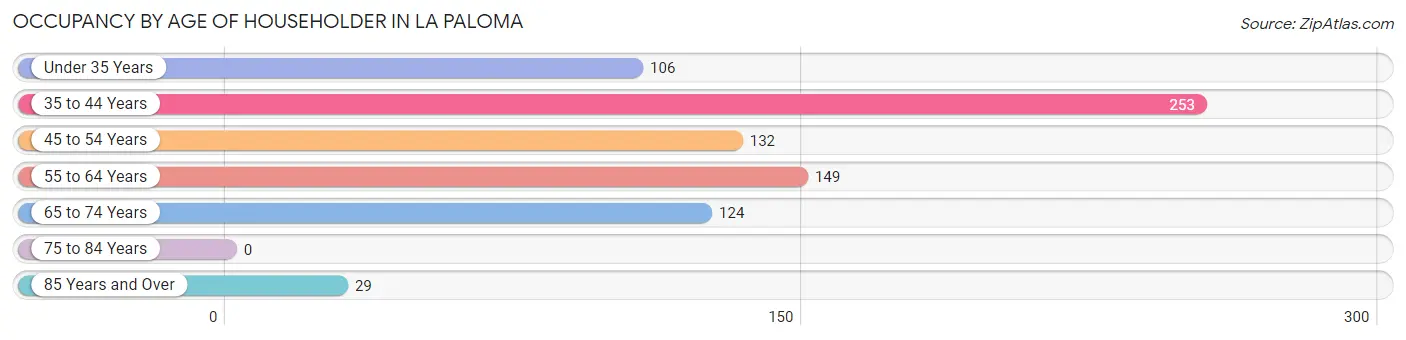
| Age Bracket | # Households | % Households |
| Under 35 Years | 106 | 13.4% |
| 35 to 44 Years | 253 | 31.9% |
| 45 to 54 Years | 132 | 16.7% |
| 55 to 64 Years | 149 | 18.8% |
| 65 to 74 Years | 124 | 15.6% |
| 75 to 84 Years | 0 | 0.0% |
| 85 Years and Over | 29 | 3.7% |
| Total | 793 | 100.0% |
Housing Finances in La Paloma
Median Income by Occupancy in La Paloma
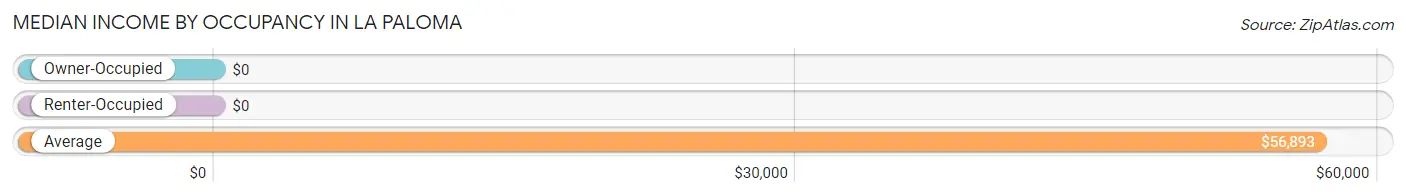
| Occupancy Type | # Households | Median Income |
| Owner-Occupied | 662 (83.5%) | $0 |
| Renter-Occupied | 131 (16.5%) | $0 |
| Average | 793 (100.0%) | $56,893 |
Occupancy by Householder Income Bracket in La Paloma
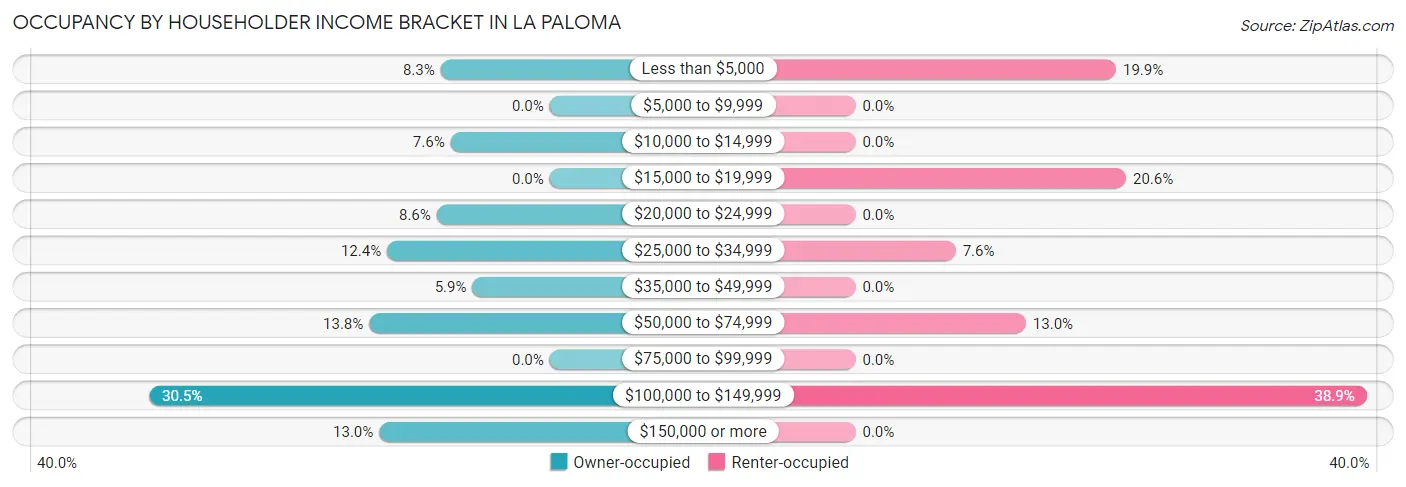
| Income Bracket | Owner-occupied | Renter-occupied |
| Less than $5,000 | 55 (8.3%) | 26 (19.9%) |
| $5,000 to $9,999 | 0 (0.0%) | 0 (0.0%) |
| $10,000 to $14,999 | 50 (7.5%) | 0 (0.0%) |
| $15,000 to $19,999 | 0 (0.0%) | 27 (20.6%) |
| $20,000 to $24,999 | 57 (8.6%) | 0 (0.0%) |
| $25,000 to $34,999 | 82 (12.4%) | 10 (7.6%) |
| $35,000 to $49,999 | 39 (5.9%) | 0 (0.0%) |
| $50,000 to $74,999 | 91 (13.8%) | 17 (13.0%) |
| $75,000 to $99,999 | 0 (0.0%) | 0 (0.0%) |
| $100,000 to $149,999 | 202 (30.5%) | 51 (38.9%) |
| $150,000 or more | 86 (13.0%) | 0 (0.0%) |
| Total | 662 (100.0%) | 131 (100.0%) |
Monthly Housing Cost Tiers in La Paloma
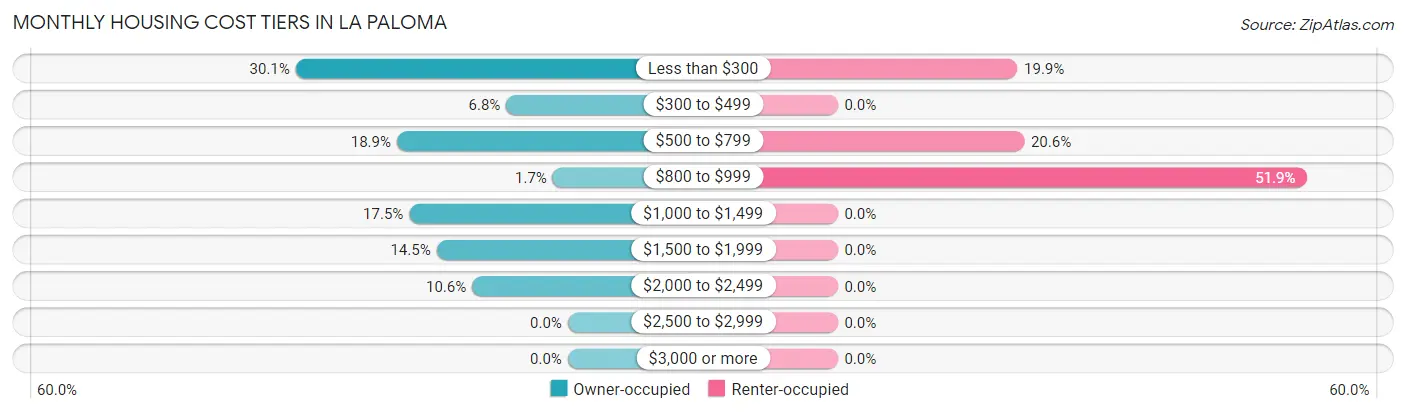
| Monthly Cost | Owner-occupied | Renter-occupied |
| Less than $300 | 199 (30.1%) | 26 (19.9%) |
| $300 to $499 | 45 (6.8%) | 0 (0.0%) |
| $500 to $799 | 125 (18.9%) | 27 (20.6%) |
| $800 to $999 | 11 (1.7%) | 68 (51.9%) |
| $1,000 to $1,499 | 116 (17.5%) | 0 (0.0%) |
| $1,500 to $1,999 | 96 (14.5%) | 0 (0.0%) |
| $2,000 to $2,499 | 70 (10.6%) | 0 (0.0%) |
| $2,500 to $2,999 | 0 (0.0%) | 0 (0.0%) |
| $3,000 or more | 0 (0.0%) | 0 (0.0%) |
| Total | 662 (100.0%) | 131 (100.0%) |
Physical Housing Characteristics in La Paloma
Housing Structures in La Paloma
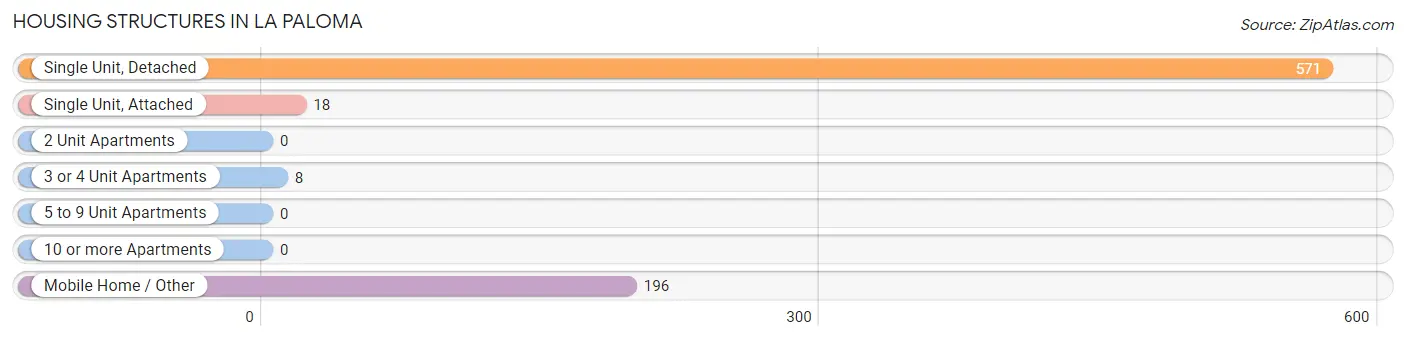
| Structure Type | # Housing Units | % Housing Units |
| Single Unit, Detached | 571 | 72.0% |
| Single Unit, Attached | 18 | 2.3% |
| 2 Unit Apartments | 0 | 0.0% |
| 3 or 4 Unit Apartments | 8 | 1.0% |
| 5 to 9 Unit Apartments | 0 | 0.0% |
| 10 or more Apartments | 0 | 0.0% |
| Mobile Home / Other | 196 | 24.7% |
| Total | 793 | 100.0% |
Housing Structures by Occupancy in La Paloma
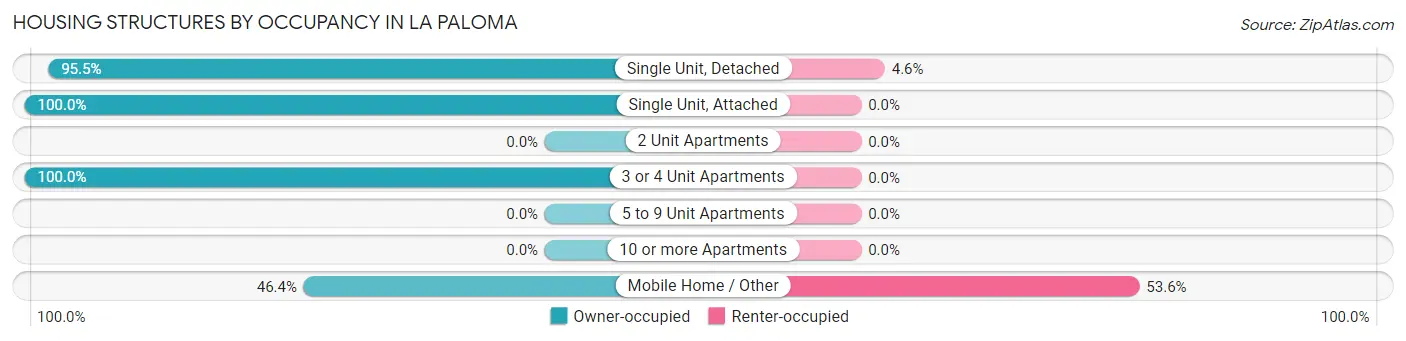
| Structure Type | Owner-occupied | Renter-occupied |
| Single Unit, Detached | 545 (95.5%) | 26 (4.5%) |
| Single Unit, Attached | 18 (100.0%) | 0 (0.0%) |
| 2 Unit Apartments | 0 (0.0%) | 0 (0.0%) |
| 3 or 4 Unit Apartments | 8 (100.0%) | 0 (0.0%) |
| 5 to 9 Unit Apartments | 0 (0.0%) | 0 (0.0%) |
| 10 or more Apartments | 0 (0.0%) | 0 (0.0%) |
| Mobile Home / Other | 91 (46.4%) | 105 (53.6%) |
| Total | 662 (83.5%) | 131 (16.5%) |
Housing Structures by Number of Rooms in La Paloma
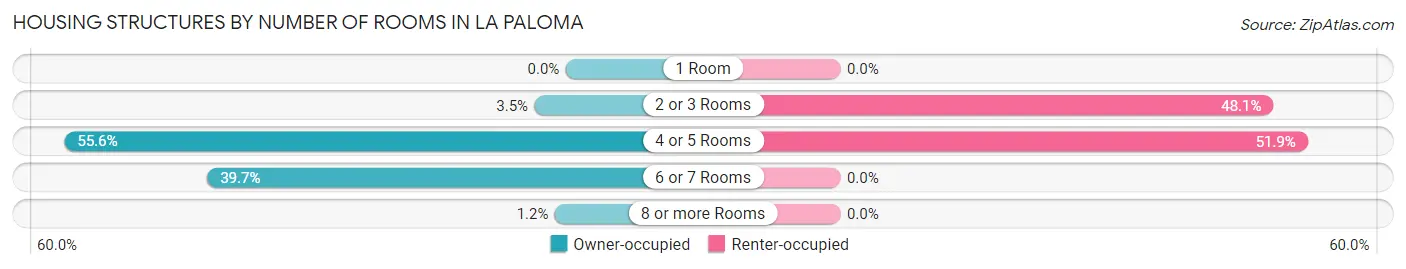
| Number of Rooms | Owner-occupied | Renter-occupied |
| 1 Room | 0 (0.0%) | 0 (0.0%) |
| 2 or 3 Rooms | 23 (3.5%) | 63 (48.1%) |
| 4 or 5 Rooms | 368 (55.6%) | 68 (51.9%) |
| 6 or 7 Rooms | 263 (39.7%) | 0 (0.0%) |
| 8 or more Rooms | 8 (1.2%) | 0 (0.0%) |
| Total | 662 (100.0%) | 131 (100.0%) |
Housing Structure by Heating Type in La Paloma
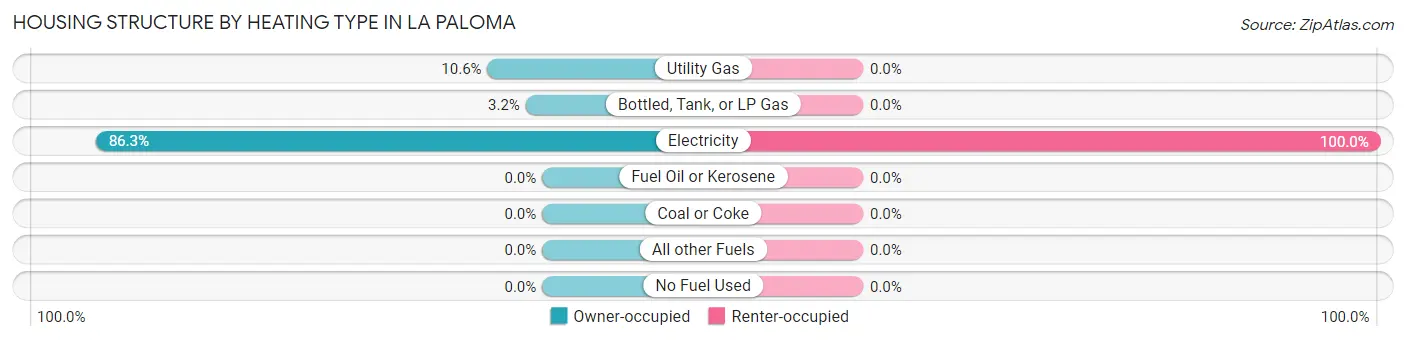
| Heating Type | Owner-occupied | Renter-occupied |
| Utility Gas | 70 (10.6%) | 0 (0.0%) |
| Bottled, Tank, or LP Gas | 21 (3.2%) | 0 (0.0%) |
| Electricity | 571 (86.3%) | 131 (100.0%) |
| Fuel Oil or Kerosene | 0 (0.0%) | 0 (0.0%) |
| Coal or Coke | 0 (0.0%) | 0 (0.0%) |
| All other Fuels | 0 (0.0%) | 0 (0.0%) |
| No Fuel Used | 0 (0.0%) | 0 (0.0%) |
| Total | 662 (100.0%) | 131 (100.0%) |
Household Vehicle Usage in La Paloma
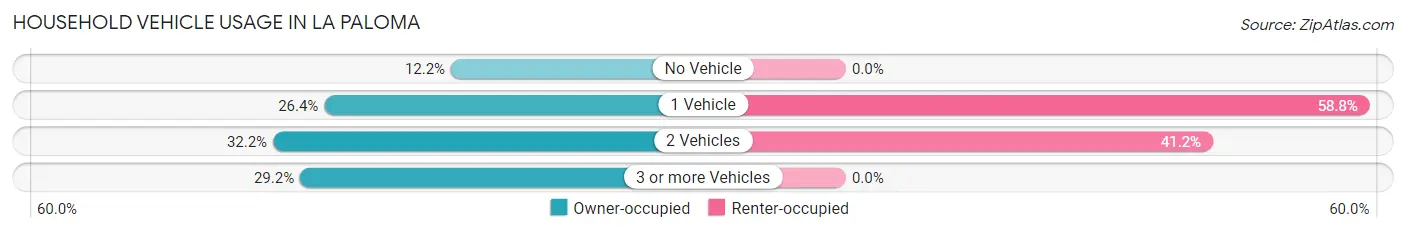
| Vehicles per Household | Owner-occupied | Renter-occupied |
| No Vehicle | 81 (12.2%) | 0 (0.0%) |
| 1 Vehicle | 175 (26.4%) | 77 (58.8%) |
| 2 Vehicles | 213 (32.2%) | 54 (41.2%) |
| 3 or more Vehicles | 193 (29.1%) | 0 (0.0%) |
| Total | 662 (100.0%) | 131 (100.0%) |
Real Estate & Mortgages in La Paloma
Real Estate and Mortgage Overview in La Paloma
| Characteristic | Without Mortgage | With Mortgage |
| Housing Units | 409 | 253 |
| Median Property Value | $70,300 | $0 |
| Median Household Income | - | - |
| Monthly Housing Costs | $312 | $0 |
| Real Estate Taxes | $1,179 | $21 |
Property Value by Mortgage Status in La Paloma
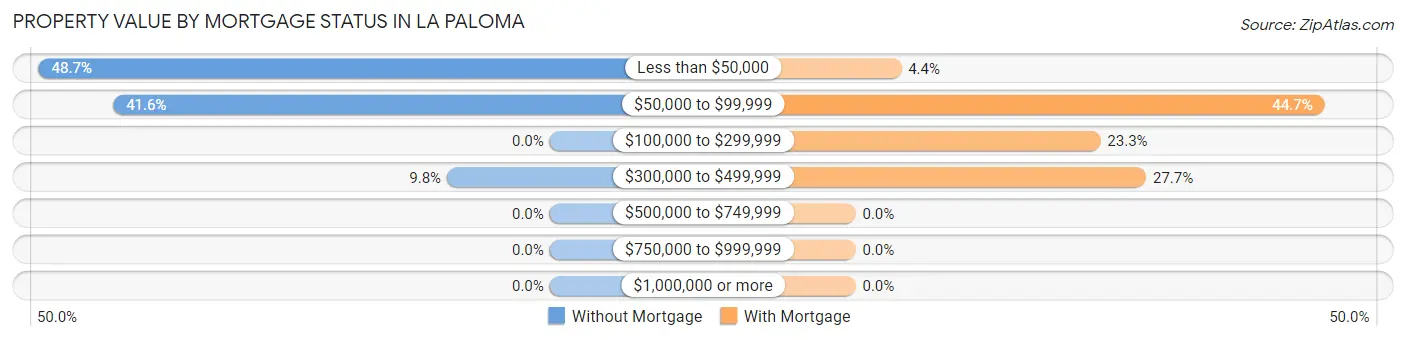
| Property Value | Without Mortgage | With Mortgage |
| Less than $50,000 | 199 (48.7%) | 11 (4.3%) |
| $50,000 to $99,999 | 170 (41.6%) | 113 (44.7%) |
| $100,000 to $299,999 | 0 (0.0%) | 59 (23.3%) |
| $300,000 to $499,999 | 40 (9.8%) | 70 (27.7%) |
| $500,000 to $749,999 | 0 (0.0%) | 0 (0.0%) |
| $750,000 to $999,999 | 0 (0.0%) | 0 (0.0%) |
| $1,000,000 or more | 0 (0.0%) | 0 (0.0%) |
| Total | 409 (100.0%) | 253 (100.0%) |
Household Income by Mortgage Status in La Paloma
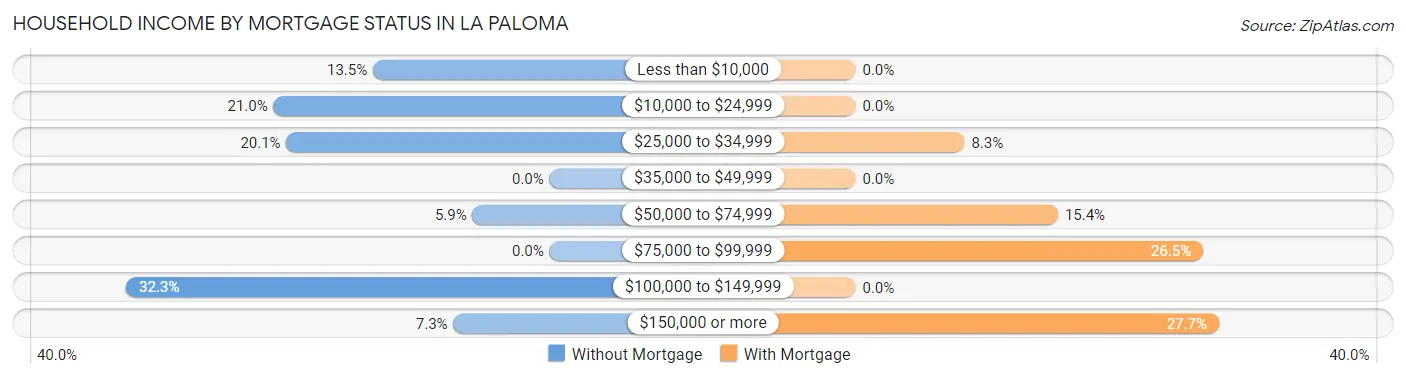
| Household Income | Without Mortgage | With Mortgage |
| Less than $10,000 | 55 (13.5%) | 0 (0.0%) |
| $10,000 to $24,999 | 86 (21.0%) | 0 (0.0%) |
| $25,000 to $34,999 | 82 (20.1%) | 21 (8.3%) |
| $35,000 to $49,999 | 0 (0.0%) | 0 (0.0%) |
| $50,000 to $74,999 | 24 (5.9%) | 39 (15.4%) |
| $75,000 to $99,999 | 0 (0.0%) | 67 (26.5%) |
| $100,000 to $149,999 | 132 (32.3%) | 0 (0.0%) |
| $150,000 or more | 30 (7.3%) | 70 (27.7%) |
| Total | 409 (100.0%) | 253 (100.0%) |
Property Value to Household Income Ratio in La Paloma
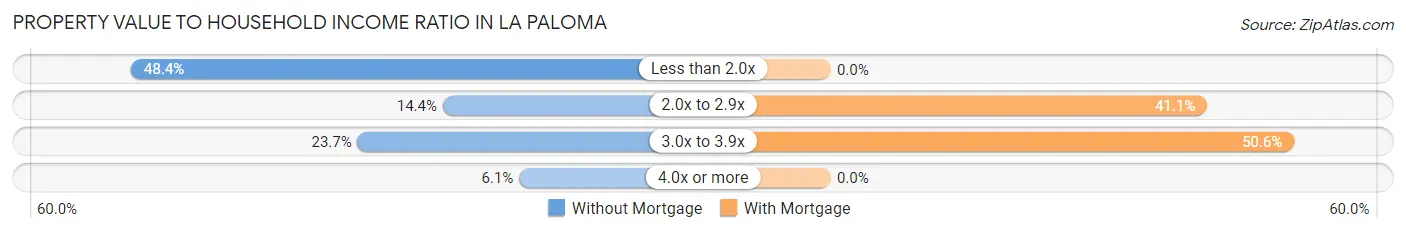
| Value-to-Income Ratio | Without Mortgage | With Mortgage |
| Less than 2.0x | 198 (48.4%) | 0 (0.0%) |
| 2.0x to 2.9x | 59 (14.4%) | 104 (41.1%) |
| 3.0x to 3.9x | 97 (23.7%) | 128 (50.6%) |
| 4.0x or more | 25 (6.1%) | 0 (0.0%) |
| Total | 409 (100.0%) | 253 (100.0%) |
Real Estate Taxes by Mortgage Status in La Paloma
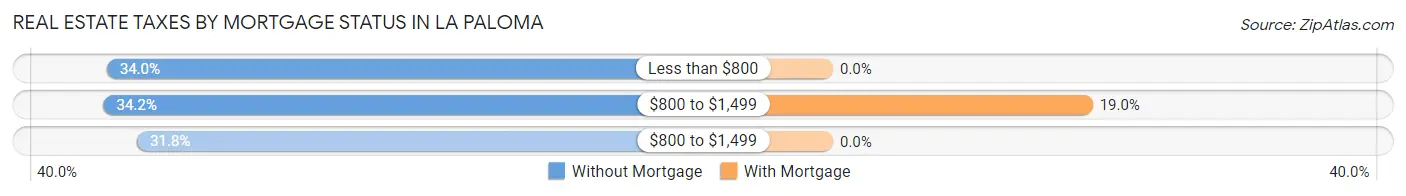
| Property Taxes | Without Mortgage | With Mortgage |
| Less than $800 | 139 (34.0%) | 0 (0.0%) |
| $800 to $1,499 | 140 (34.2%) | 48 (19.0%) |
| $800 to $1,499 | 130 (31.8%) | 0 (0.0%) |
| Total | 409 (100.0%) | 253 (100.0%) |
Health & Disability in La Paloma
Health Insurance Coverage by Age in La Paloma
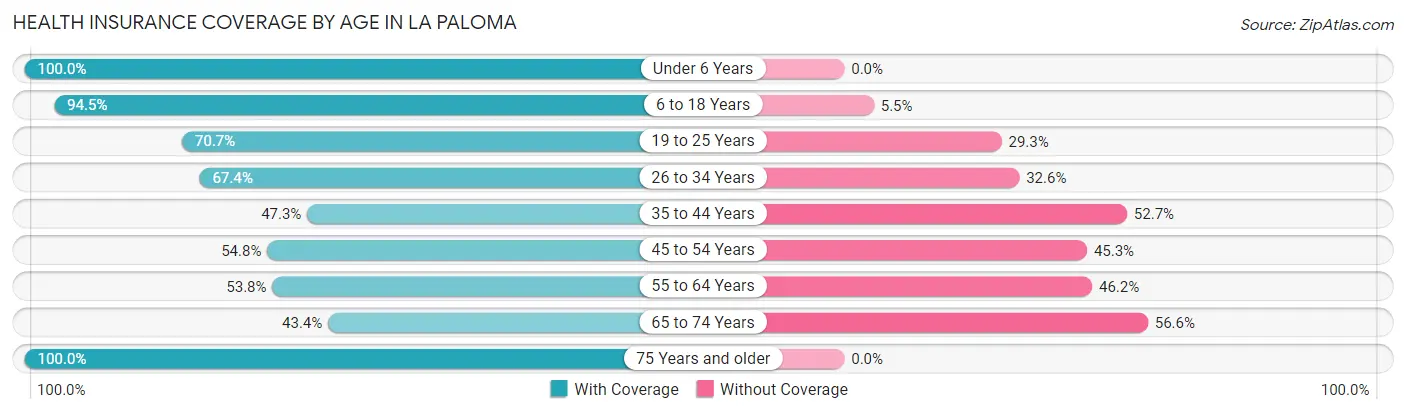
| Age Bracket | With Coverage | Without Coverage |
| Under 6 Years | 438 (100.0%) | 0 (0.0%) |
| 6 to 18 Years | 670 (94.5%) | 39 (5.5%) |
| 19 to 25 Years | 106 (70.7%) | 44 (29.3%) |
| 26 to 34 Years | 190 (67.4%) | 92 (32.6%) |
| 35 to 44 Years | 245 (47.3%) | 273 (52.7%) |
| 45 to 54 Years | 98 (54.7%) | 81 (45.3%) |
| 55 to 64 Years | 184 (53.8%) | 158 (46.2%) |
| 65 to 74 Years | 69 (43.4%) | 90 (56.6%) |
| 75 Years and older | 29 (100.0%) | 0 (0.0%) |
| Total | 2,029 (72.3%) | 777 (27.7%) |
Health Insurance Coverage by Citizenship Status in La Paloma
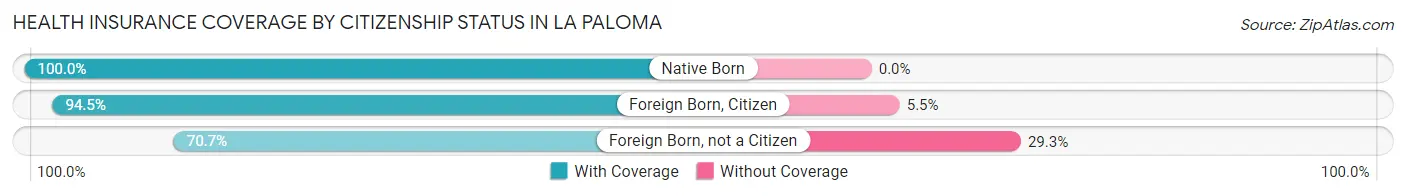
| Citizenship Status | With Coverage | Without Coverage |
| Native Born | 438 (100.0%) | 0 (0.0%) |
| Foreign Born, Citizen | 670 (94.5%) | 39 (5.5%) |
| Foreign Born, not a Citizen | 106 (70.7%) | 44 (29.3%) |
Health Insurance Coverage by Household Income in La Paloma
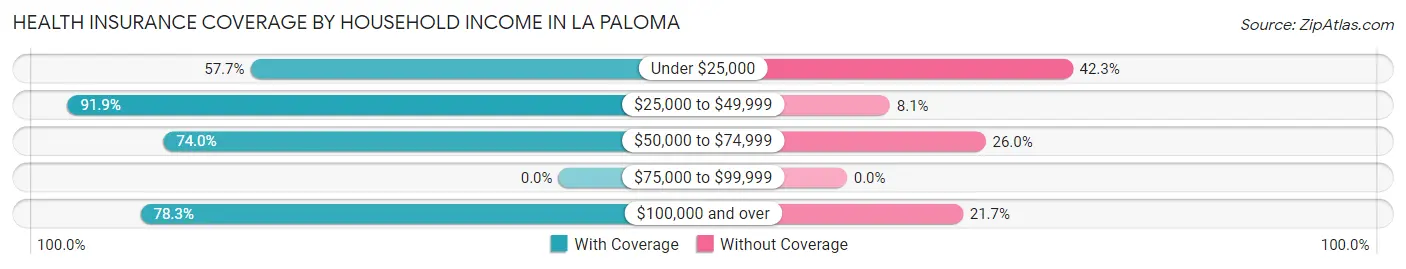
| Household Income | With Coverage | Without Coverage |
| Under $25,000 | 513 (57.7%) | 376 (42.3%) |
| $25,000 to $49,999 | 228 (91.9%) | 20 (8.1%) |
| $50,000 to $74,999 | 319 (74.0%) | 112 (26.0%) |
| $75,000 to $99,999 | 0 (0.0%) | 0 (0.0%) |
| $100,000 and over | 969 (78.3%) | 269 (21.7%) |
Public vs Private Health Insurance Coverage by Age in La Paloma
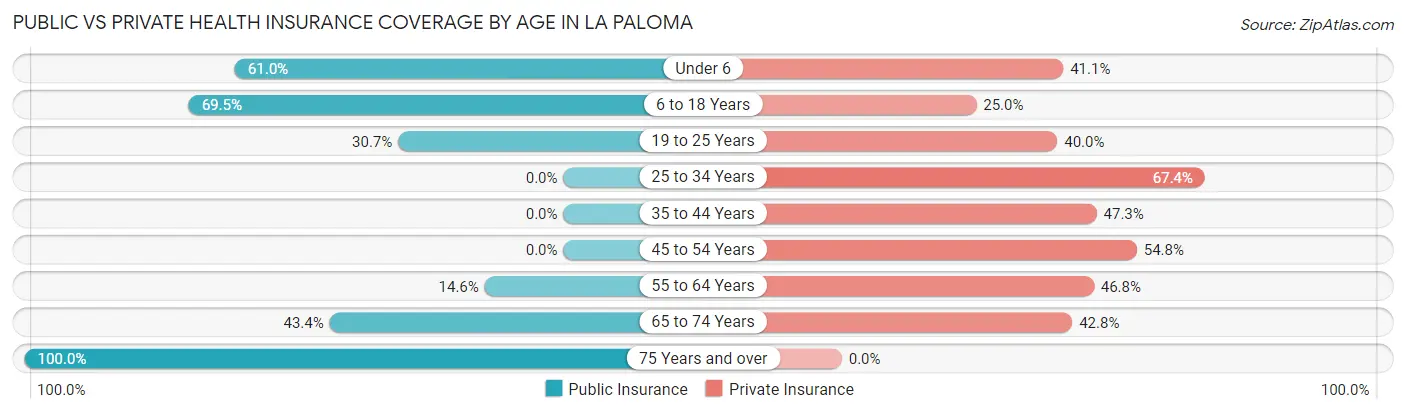
| Age Bracket | Public Insurance | Private Insurance |
| Under 6 | 267 (61.0%) | 180 (41.1%) |
| 6 to 18 Years | 493 (69.5%) | 177 (25.0%) |
| 19 to 25 Years | 46 (30.7%) | 60 (40.0%) |
| 25 to 34 Years | 0 (0.0%) | 190 (67.4%) |
| 35 to 44 Years | 0 (0.0%) | 245 (47.3%) |
| 45 to 54 Years | 0 (0.0%) | 98 (54.7%) |
| 55 to 64 Years | 50 (14.6%) | 160 (46.8%) |
| 65 to 74 Years | 69 (43.4%) | 68 (42.8%) |
| 75 Years and over | 29 (100.0%) | 0 (0.0%) |
| Total | 954 (34.0%) | 1,178 (42.0%) |
Disability Status by Sex by Age in La Paloma
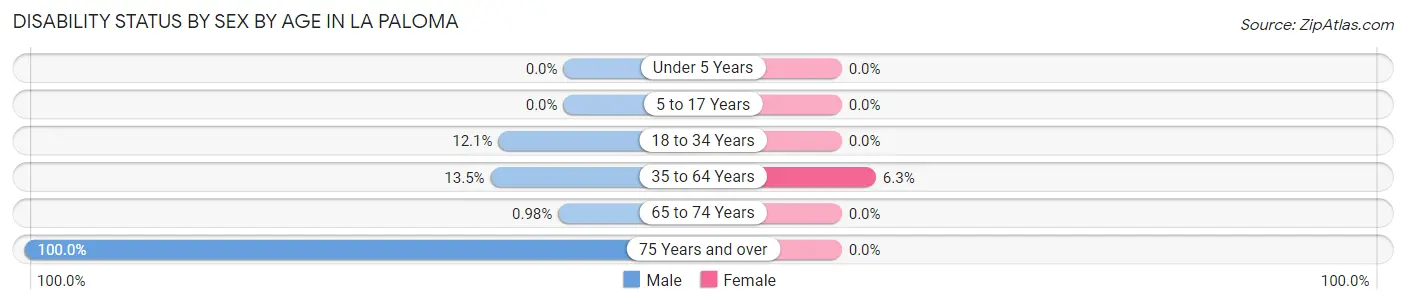
| Age Bracket | Male | Female |
| Under 5 Years | 0 (0.0%) | 0 (0.0%) |
| 5 to 17 Years | 0 (0.0%) | 0 (0.0%) |
| 18 to 34 Years | 21 (12.1%) | 0 (0.0%) |
| 35 to 64 Years | 85 (13.5%) | 26 (6.3%) |
| 65 to 74 Years | 1 (1.0%) | 0 (0.0%) |
| 75 Years and over | 29 (100.0%) | 0 (0.0%) |
Disability Class by Sex by Age in La Paloma
Disability Class: Hearing Difficulty
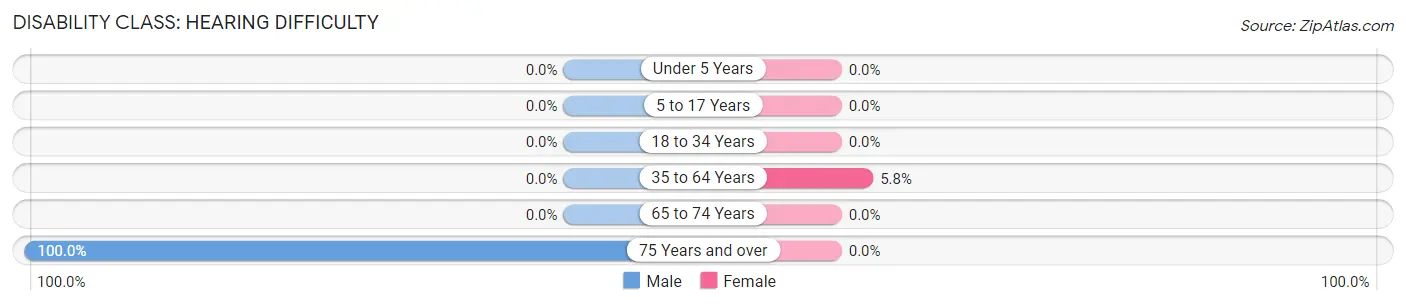
| Age Bracket | Male | Female |
| Under 5 Years | 0 (0.0%) | 0 (0.0%) |
| 5 to 17 Years | 0 (0.0%) | 0 (0.0%) |
| 18 to 34 Years | 0 (0.0%) | 0 (0.0%) |
| 35 to 64 Years | 0 (0.0%) | 24 (5.8%) |
| 65 to 74 Years | 0 (0.0%) | 0 (0.0%) |
| 75 Years and over | 29 (100.0%) | 0 (0.0%) |
Disability Class: Vision Difficulty
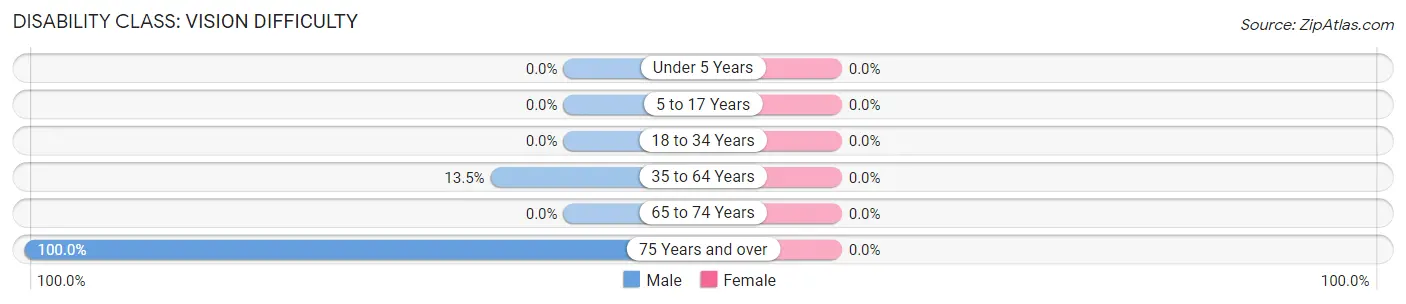
| Age Bracket | Male | Female |
| Under 5 Years | 0 (0.0%) | 0 (0.0%) |
| 5 to 17 Years | 0 (0.0%) | 0 (0.0%) |
| 18 to 34 Years | 0 (0.0%) | 0 (0.0%) |
| 35 to 64 Years | 85 (13.5%) | 0 (0.0%) |
| 65 to 74 Years | 0 (0.0%) | 0 (0.0%) |
| 75 Years and over | 29 (100.0%) | 0 (0.0%) |
Disability Class: Cognitive Difficulty
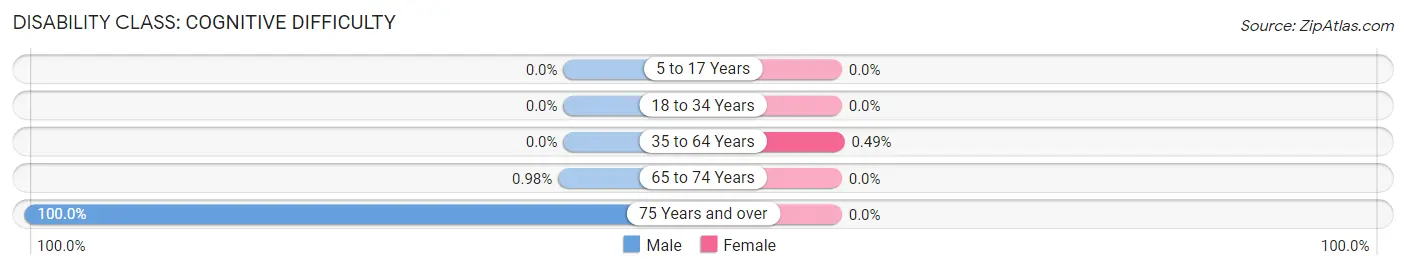
| Age Bracket | Male | Female |
| 5 to 17 Years | 0 (0.0%) | 0 (0.0%) |
| 18 to 34 Years | 0 (0.0%) | 0 (0.0%) |
| 35 to 64 Years | 0 (0.0%) | 2 (0.5%) |
| 65 to 74 Years | 1 (1.0%) | 0 (0.0%) |
| 75 Years and over | 29 (100.0%) | 0 (0.0%) |
Disability Class: Ambulatory Difficulty
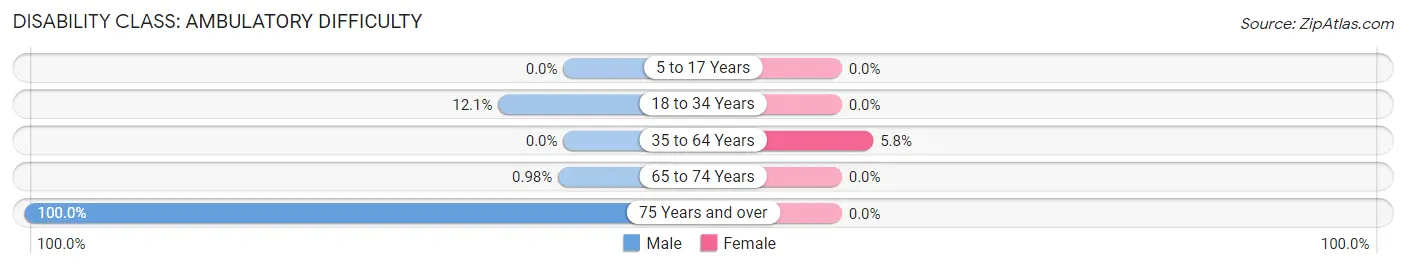
| Age Bracket | Male | Female |
| 5 to 17 Years | 0 (0.0%) | 0 (0.0%) |
| 18 to 34 Years | 21 (12.1%) | 0 (0.0%) |
| 35 to 64 Years | 0 (0.0%) | 24 (5.8%) |
| 65 to 74 Years | 1 (1.0%) | 0 (0.0%) |
| 75 Years and over | 29 (100.0%) | 0 (0.0%) |
Disability Class: Self-Care Difficulty
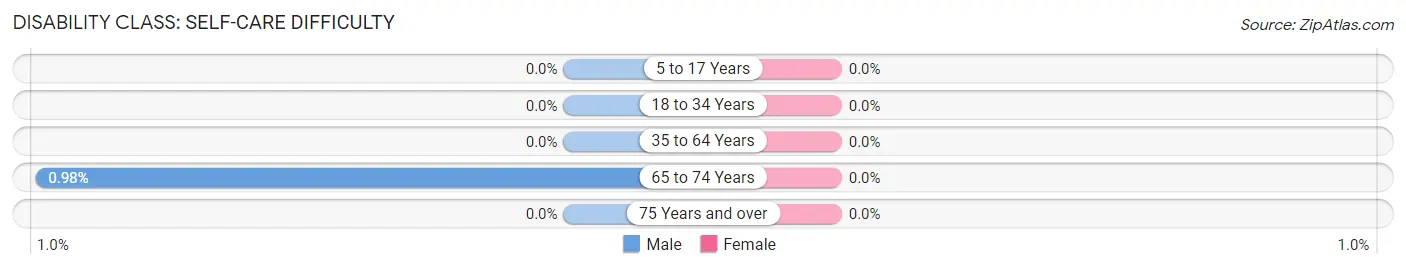
| Age Bracket | Male | Female |
| 5 to 17 Years | 0 (0.0%) | 0 (0.0%) |
| 18 to 34 Years | 0 (0.0%) | 0 (0.0%) |
| 35 to 64 Years | 0 (0.0%) | 0 (0.0%) |
| 65 to 74 Years | 1 (1.0%) | 0 (0.0%) |
| 75 Years and over | 0 (0.0%) | 0 (0.0%) |
Technology Access in La Paloma
Computing Device Access in La Paloma
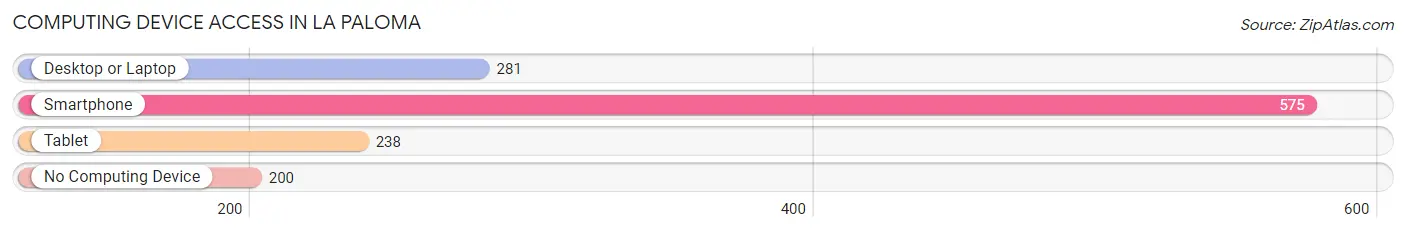
| Device Type | # Households | % Households |
| Desktop or Laptop | 281 | 35.4% |
| Smartphone | 575 | 72.5% |
| Tablet | 238 | 30.0% |
| No Computing Device | 200 | 25.2% |
| Total | 793 | 100.0% |
Internet Access in La Paloma
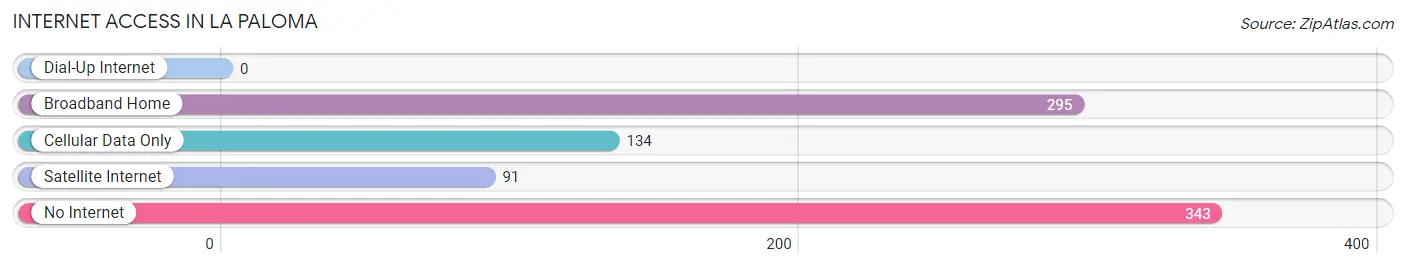
| Internet Type | # Households | % Households |
| Dial-Up Internet | 0 | 0.0% |
| Broadband Home | 295 | 37.2% |
| Cellular Data Only | 134 | 16.9% |
| Satellite Internet | 91 | 11.5% |
| No Internet | 343 | 43.2% |
| Total | 793 | 100.0% |
La Paloma Summary
La Paloma is a small unincorporated community located in Starr County, Texas. It is situated on the banks of the Rio Grande, approximately 20 miles south of Rio Grande City. The population of La Paloma was estimated to be around 1,000 in 2020.
History
La Paloma was founded in the late 19th century by a group of Mexican settlers who were looking for a place to settle and farm. The area was originally known as La Paloma de la Frontera, which translates to “The Dove of the Frontier”. The name was chosen to honor the dove, which is a symbol of peace and hope.
The first settlers of La Paloma were mostly farmers and ranchers who grew crops such as corn, beans, and cotton. They also raised livestock such as cattle, horses, and sheep. The area was also known for its production of sugar cane and sorghum.
In the early 20th century, La Paloma began to grow and develop. The town was incorporated in 1912 and the first mayor was elected in 1913. The town was also home to a post office, a school, and a few stores.
Geography
La Paloma is located in Starr County, Texas, on the banks of the Rio Grande. The town is situated in the Rio Grande Valley, which is a region of south Texas that is known for its fertile soil and warm climate. The area is also known for its diverse wildlife, including birds, reptiles, and mammals.
The terrain of La Paloma is mostly flat, with some rolling hills. The area is also home to several rivers and streams, including the Rio Grande, which forms the border between the United States and Mexico.
Economy
The economy of La Paloma is largely based on agriculture. The area is known for its production of cotton, corn, beans, and sorghum. The town is also home to several small businesses, including restaurants, grocery stores, and gas stations.
The town is also home to a few manufacturing companies, including a furniture factory and a clothing factory. The town is also home to a few tourist attractions, including a museum and a historic church.
Demographics
The population of La Paloma was estimated to be around 1,000 in 2020. The majority of the population is of Hispanic or Latino descent. The town is also home to a small number of African Americans, Native Americans, and other ethnicities.
The median household income in La Paloma is around $30,000, which is lower than the national average. The poverty rate in the town is also higher than the national average, with around 25% of the population living below the poverty line.
Conclusion
La Paloma is a small unincorporated community located in Starr County, Texas. It is situated on the banks of the Rio Grande, approximately 20 miles south of Rio Grande City. The population of La Paloma was estimated to be around 1,000 in 2020. The town is known for its production of cotton, corn, beans, and sorghum, as well as its small businesses and tourist attractions. The majority of the population is of Hispanic or Latino descent, with a median household income of around $30,000 and a poverty rate of around 25%.
Common Questions
What is Per Capita Income in La Paloma?
Per Capita income in La Paloma is $22,445.
What is the Median Household income in La Paloma?
Median Household Income in La Paloma is $56,893.
What is Inequality or Gini Index in La Paloma?
Inequality or Gini Index in La Paloma is 0.45.
What is the Total Population of La Paloma?
Total Population of La Paloma is 2,806.
What is the Total Male Population of La Paloma?
Total Male Population of La Paloma is 1,428.
What is the Total Female Population of La Paloma?
Total Female Population of La Paloma is 1,378.
What is the Ratio of Males per 100 Females in La Paloma?
There are 103.63 Males per 100 Females in La Paloma.
What is the Ratio of Females per 100 Males in La Paloma?
There are 96.50 Females per 100 Males in La Paloma.
What is the Median Population Age in La Paloma?
Median Population Age in La Paloma is 29.4 Years.
What is the Average Family Size in La Paloma
Average Family Size in La Paloma is 3.9 People.
What is the Average Household Size in La Paloma
Average Household Size in La Paloma is 3.5 People.
How Large is the Labor Force in La Paloma?
There are 1,185 People in the Labor Forcein in La Paloma.
What is the Percentage of People in the Labor Force in La Paloma?
62.3% of People are in the Labor Force in La Paloma.
What is the Unemployment Rate in La Paloma?
Unemployment Rate in La Paloma is 2.6%.