Coupland, TX Map & Demographics
Coupland Map
Coupland Overview
$26,698
PER CAPITA INCOME
$108,780
AVG FAMILY INCOME
$83,750
AVG HOUSEHOLD INCOME
39.5%
WAGE / INCOME GAP [ % ]
60.5¢/ $1
WAGE / INCOME GAP [ $ ]
0.42
INEQUALITY / GINI INDEX
481
TOTAL POPULATION
216
MALE POPULATION
265
FEMALE POPULATION
81.51
MALES / 100 FEMALES
122.69
FEMALES / 100 MALES
30.5
MEDIAN AGE
4.2
AVG FAMILY SIZE
3.0
AVG HOUSEHOLD SIZE
169
LABOR FORCE [ PEOPLE ]
60.4%
PERCENT IN LABOR FORCE
0.6%
UNEMPLOYMENT RATE
Coupland Zip Codes
Coupland Area Codes
Income in Coupland
Income Overview in Coupland
Per Capita Income in Coupland is $26,698, while median incomes of families and households are $108,780 and $83,750 respectively.
| Characteristic | Number | Measure |
| Per Capita Income | 481 | $26,698 |
| Median Family Income | 97 | $108,780 |
| Mean Family Income | 97 | $106,219 |
| Median Household Income | 162 | $83,750 |
| Mean Household Income | 162 | $76,564 |
| Income Deficit | 97 | $0 |
| Wage / Income Gap (%) | 481 | 39.49% |
| Wage / Income Gap ($) | 481 | 60.51¢ per $1 |
| Gini / Inequality Index | 481 | 0.42 |
Earnings by Sex in Coupland
Average Earnings in Coupland are $56,250, $68,495 for men and $41,444 for women, a difference of 39.5%.
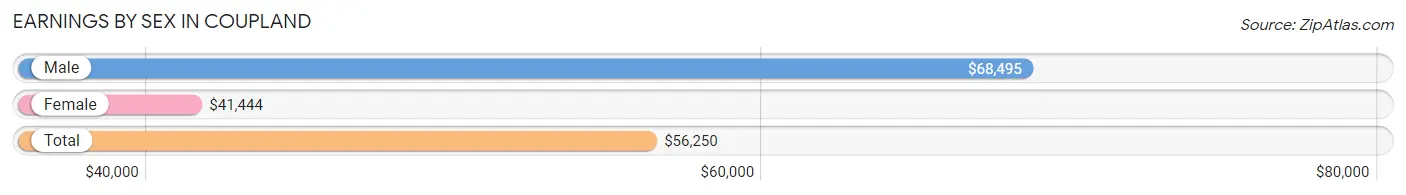
| Sex | Number | Average Earnings |
| Male | 91 (53.8%) | $68,495 |
| Female | 78 (46.2%) | $41,444 |
| Total | 169 (100.0%) | $56,250 |
Earnings by Sex by Income Bracket in Coupland
The most common earnings brackets in Coupland are $65,000 to $74,999 for men (54 | 59.3%) and $40,000 to $44,999 for women (45 | 57.7%).
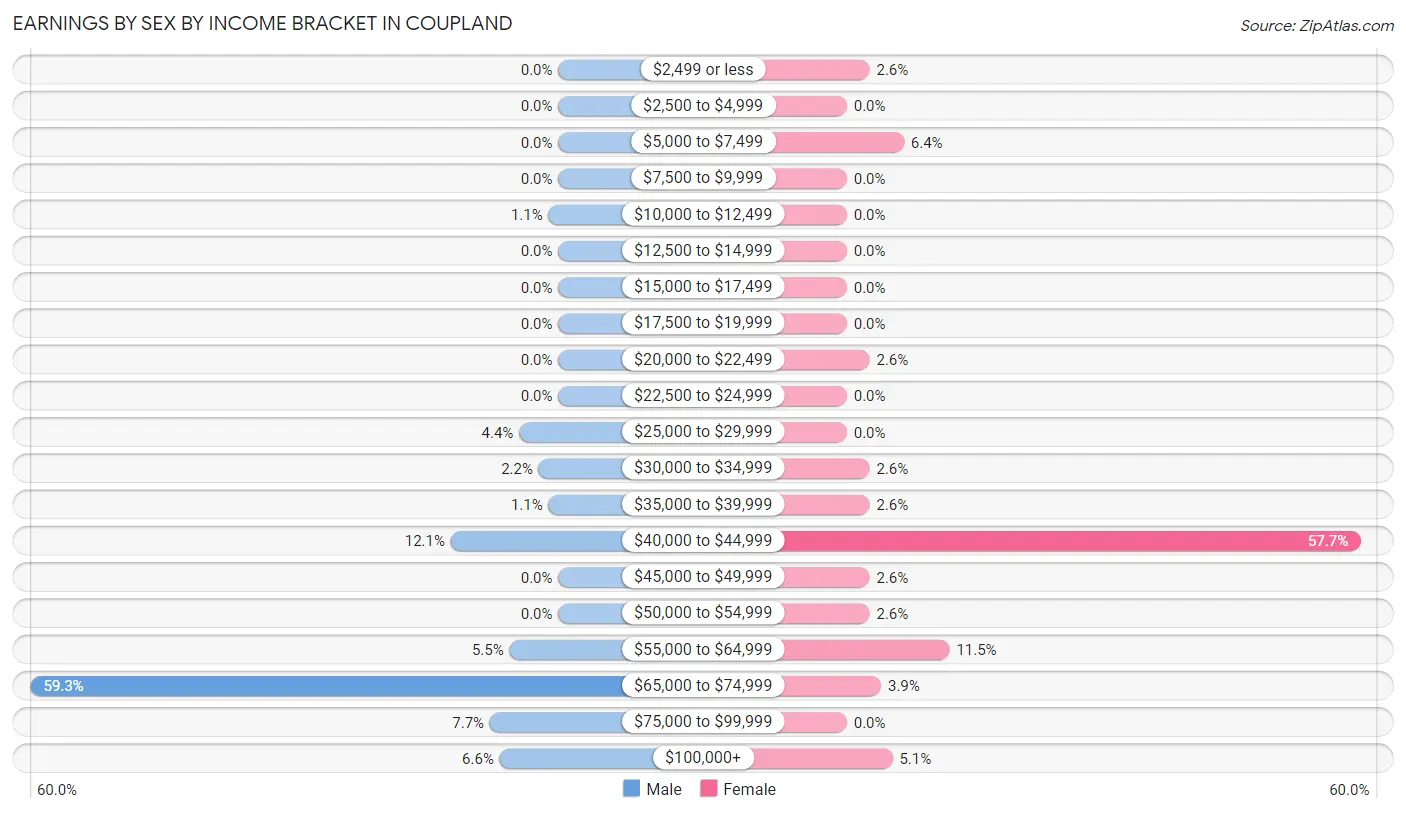
| Income | Male | Female |
| $2,499 or less | 0 (0.0%) | 2 (2.6%) |
| $2,500 to $4,999 | 0 (0.0%) | 0 (0.0%) |
| $5,000 to $7,499 | 0 (0.0%) | 5 (6.4%) |
| $7,500 to $9,999 | 0 (0.0%) | 0 (0.0%) |
| $10,000 to $12,499 | 1 (1.1%) | 0 (0.0%) |
| $12,500 to $14,999 | 0 (0.0%) | 0 (0.0%) |
| $15,000 to $17,499 | 0 (0.0%) | 0 (0.0%) |
| $17,500 to $19,999 | 0 (0.0%) | 0 (0.0%) |
| $20,000 to $22,499 | 0 (0.0%) | 2 (2.6%) |
| $22,500 to $24,999 | 0 (0.0%) | 0 (0.0%) |
| $25,000 to $29,999 | 4 (4.4%) | 0 (0.0%) |
| $30,000 to $34,999 | 2 (2.2%) | 2 (2.6%) |
| $35,000 to $39,999 | 1 (1.1%) | 2 (2.6%) |
| $40,000 to $44,999 | 11 (12.1%) | 45 (57.7%) |
| $45,000 to $49,999 | 0 (0.0%) | 2 (2.6%) |
| $50,000 to $54,999 | 0 (0.0%) | 2 (2.6%) |
| $55,000 to $64,999 | 5 (5.5%) | 9 (11.5%) |
| $65,000 to $74,999 | 54 (59.3%) | 3 (3.8%) |
| $75,000 to $99,999 | 7 (7.7%) | 0 (0.0%) |
| $100,000+ | 6 (6.6%) | 4 (5.1%) |
| Total | 91 (100.0%) | 78 (100.0%) |
Earnings by Sex by Educational Attainment in Coupland
Average earnings in Coupland are $68,519 for men and $41,556 for women, a difference of 39.4%. Men with an educational attainment of high school diploma enjoy the highest average annual earnings of $78,125, while those with college or associate's degree education earn the least with $64,000. Women with an educational attainment of high school diploma earn the most with the average annual earnings of $41,420, while those with high school diploma education have the smallest earnings of $41,420.
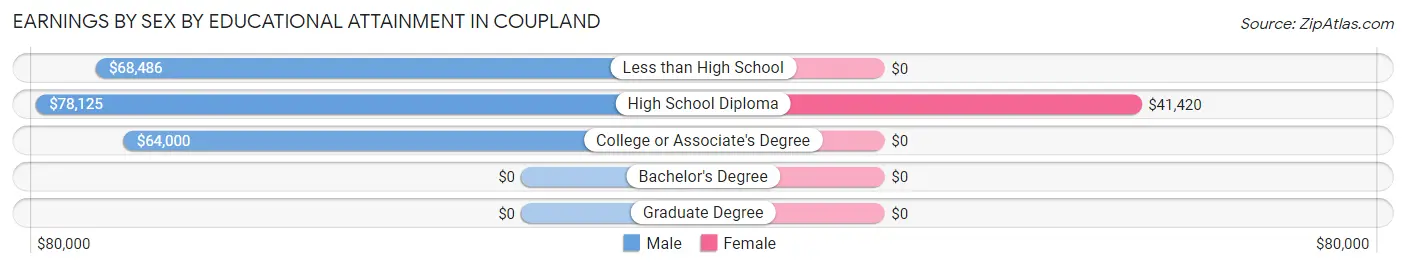
| Educational Attainment | Male Income | Female Income |
| Less than High School | $68,486 | $0 |
| High School Diploma | $78,125 | $41,420 |
| College or Associate's Degree | $64,000 | $0 |
| Bachelor's Degree | - | - |
| Graduate Degree | - | - |
| Total | $68,519 | $41,556 |
Family Income in Coupland
Family Income Brackets in Coupland
According to the Coupland family income data, there are 65 families falling into the $100,000 to $149,999 income range, which is the most common income bracket and makes up 67.0% of all families.
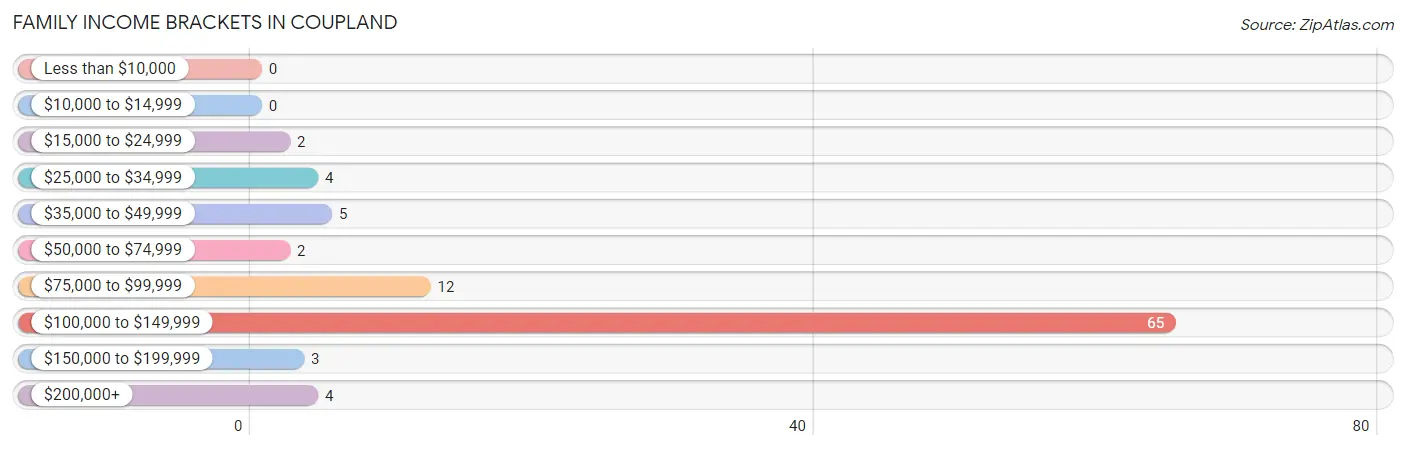
| Income Bracket | # Families | % Families |
| Less than $10,000 | 0 | 0.0% |
| $10,000 to $14,999 | 0 | 0.0% |
| $15,000 to $24,999 | 2 | 2.1% |
| $25,000 to $34,999 | 4 | 4.1% |
| $35,000 to $49,999 | 5 | 5.2% |
| $50,000 to $74,999 | 2 | 2.1% |
| $75,000 to $99,999 | 12 | 12.4% |
| $100,000 to $149,999 | 65 | 67.0% |
| $150,000 to $199,999 | 3 | 3.1% |
| $200,000+ | 4 | 4.1% |
Family Income by Famaliy Size in Coupland
2-person families (34 | 35.0%) account for the highest median family income in Coupland with $121,250 per family, while 2-person families (34 | 35.0%) have the highest median income of $60,625 per family member.
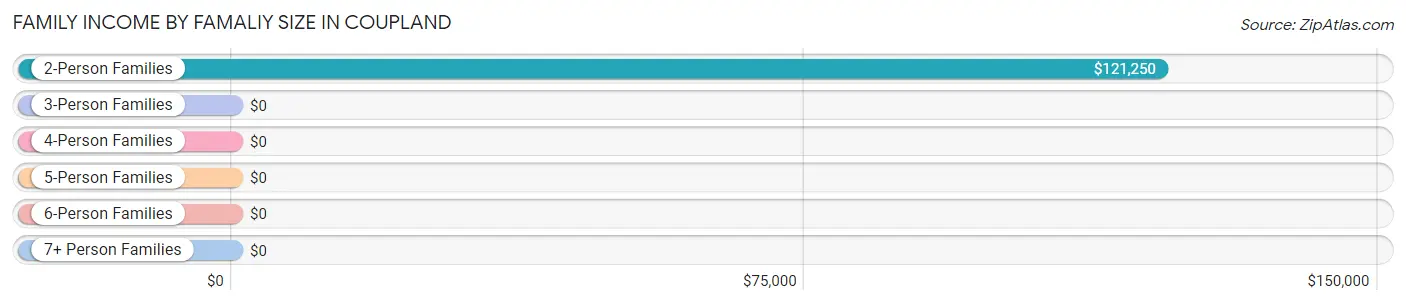
| Income Bracket | # Families | Median Income |
| 2-Person Families | 34 (35.0%) | $121,250 |
| 3-Person Families | 12 (12.4%) | $0 |
| 4-Person Families | 3 (3.1%) | $0 |
| 5-Person Families | 6 (6.2%) | $0 |
| 6-Person Families | 42 (43.3%) | $0 |
| 7+ Person Families | 0 (0.0%) | $0 |
| Total | 97 (100.0%) | $108,780 |
Family Income by Number of Earners in Coupland
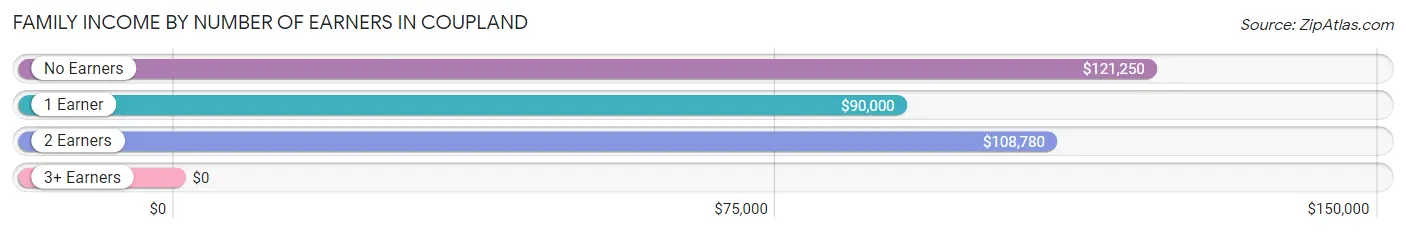
| Number of Earners | # Families | Median Income |
| No Earners | 28 (28.9%) | $121,250 |
| 1 Earner | 10 (10.3%) | $90,000 |
| 2 Earners | 55 (56.7%) | $108,780 |
| 3+ Earners | 4 (4.1%) | $0 |
| Total | 97 (100.0%) | $108,780 |
Household Income in Coupland
Household Income Brackets in Coupland
With 65 households falling in the category, the $100,000 to $149,999 income range is the most frequent in Coupland, accounting for 40.1% of all households. In contrast, only 4 households (2.5%) fall into the $10,000 to $14,999 income bracket, making it the least populous group.
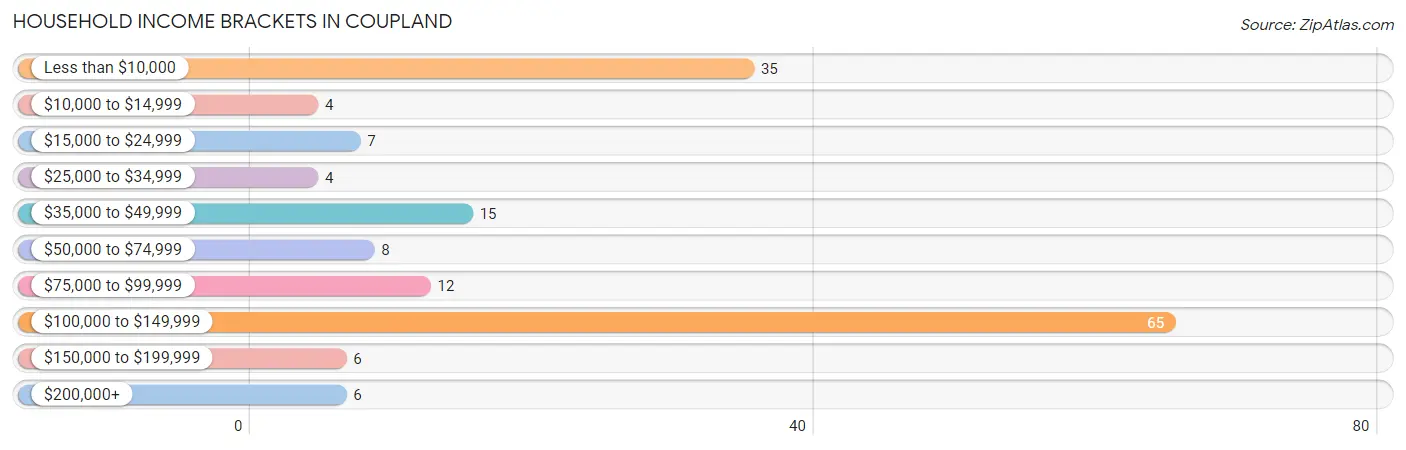
| Income Bracket | # Households | % Households |
| Less than $10,000 | 35 | 21.6% |
| $10,000 to $14,999 | 4 | 2.5% |
| $15,000 to $24,999 | 7 | 4.3% |
| $25,000 to $34,999 | 4 | 2.5% |
| $35,000 to $49,999 | 15 | 9.3% |
| $50,000 to $74,999 | 8 | 4.9% |
| $75,000 to $99,999 | 12 | 7.4% |
| $100,000 to $149,999 | 65 | 40.1% |
| $150,000 to $199,999 | 6 | 3.7% |
| $200,000+ | 6 | 3.7% |
Household Income by Householder Age in Coupland
The median household income in Coupland is $83,750, with the highest median household income of $108,631 found in the 25 to 44 years age bracket for the primary householder. A total of 64 households (39.5%) fall into this category.
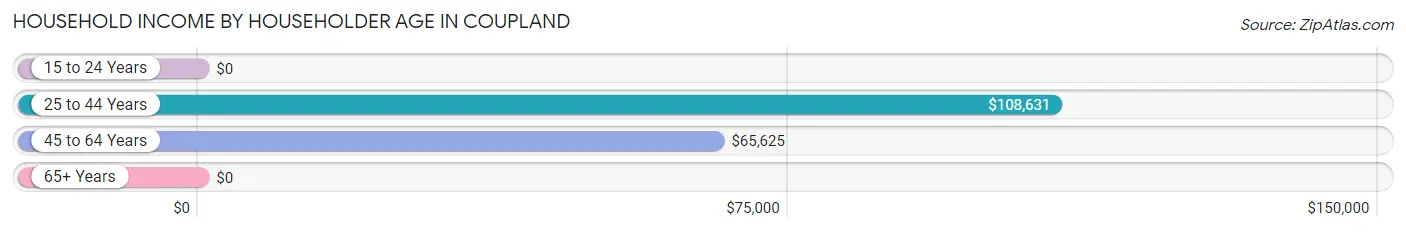
| Income Bracket | # Households | Median Income |
| 15 to 24 Years | 0 (0.0%) | $0 |
| 25 to 44 Years | 64 (39.5%) | $108,631 |
| 45 to 64 Years | 21 (13.0%) | $65,625 |
| 65+ Years | 77 (47.5%) | $0 |
| Total | 162 (100.0%) | $83,750 |
Poverty in Coupland
Income Below Poverty by Sex and Age in Coupland
With 17.1% poverty level for males and 1.9% for females among the residents of Coupland, 75 year old and over males and 55 to 64 year old females are the most vulnerable to poverty, with 30 males (85.7%) and 5 females (45.5%) in their respective age groups living below the poverty level.
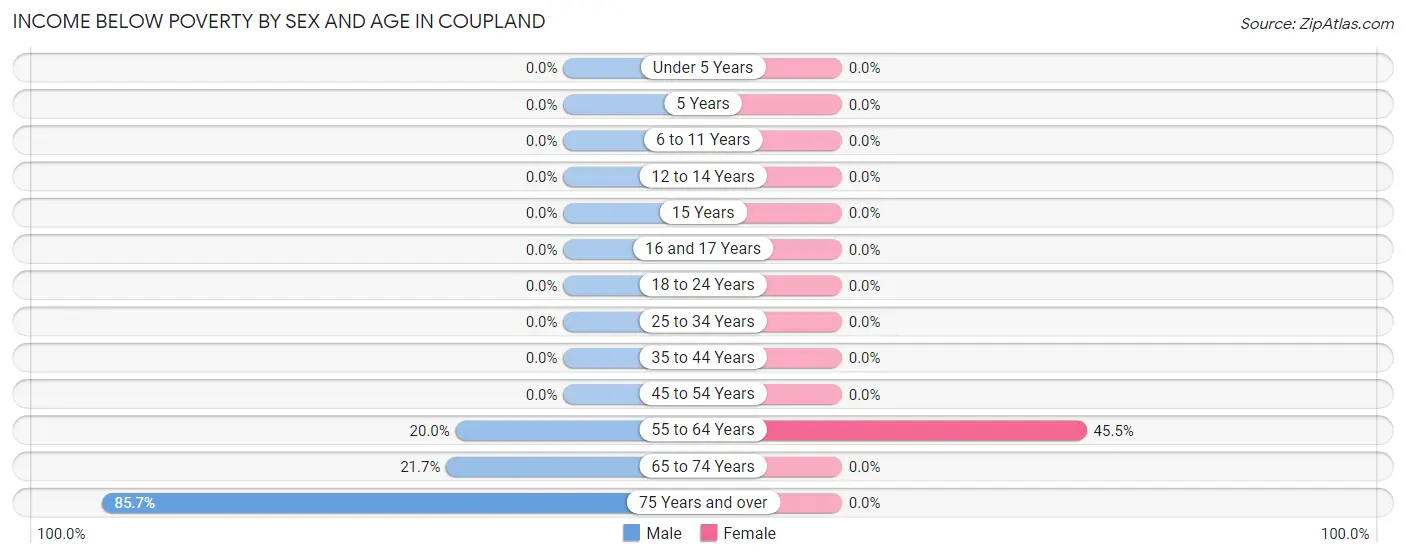
| Age Bracket | Male | Female |
| Under 5 Years | 0 (0.0%) | 0 (0.0%) |
| 5 Years | 0 (0.0%) | 0 (0.0%) |
| 6 to 11 Years | 0 (0.0%) | 0 (0.0%) |
| 12 to 14 Years | 0 (0.0%) | 0 (0.0%) |
| 15 Years | 0 (0.0%) | 0 (0.0%) |
| 16 and 17 Years | 0 (0.0%) | 0 (0.0%) |
| 18 to 24 Years | 0 (0.0%) | 0 (0.0%) |
| 25 to 34 Years | 0 (0.0%) | 0 (0.0%) |
| 35 to 44 Years | 0 (0.0%) | 0 (0.0%) |
| 45 to 54 Years | 0 (0.0%) | 0 (0.0%) |
| 55 to 64 Years | 2 (20.0%) | 5 (45.5%) |
| 65 to 74 Years | 5 (21.7%) | 0 (0.0%) |
| 75 Years and over | 30 (85.7%) | 0 (0.0%) |
| Total | 37 (17.1%) | 5 (1.9%) |
Income Above Poverty by Sex and Age in Coupland
According to the poverty statistics in Coupland, males aged under 5 years and females aged under 5 years are the age groups that are most secure financially, with 100.0% of males and 100.0% of females in these age groups living above the poverty line.
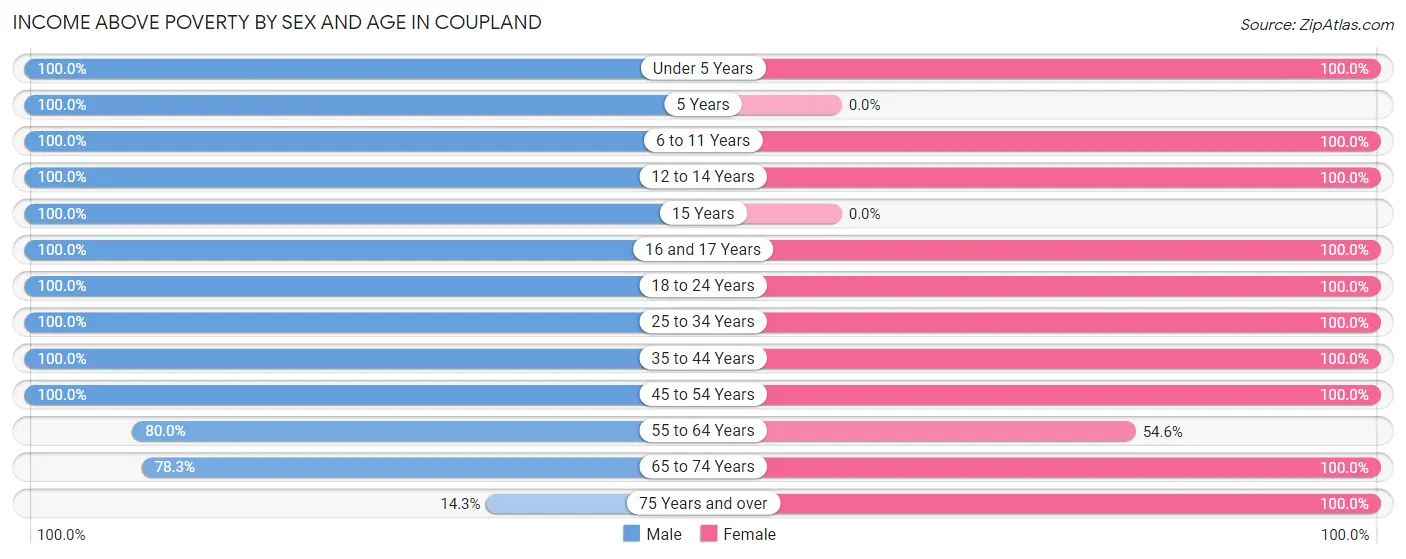
| Age Bracket | Male | Female |
| Under 5 Years | 6 (100.0%) | 41 (100.0%) |
| 5 Years | 5 (100.0%) | 0 (0.0%) |
| 6 to 11 Years | 2 (100.0%) | 96 (100.0%) |
| 12 to 14 Years | 42 (100.0%) | 4 (100.0%) |
| 15 Years | 5 (100.0%) | 0 (0.0%) |
| 16 and 17 Years | 3 (100.0%) | 2 (100.0%) |
| 18 to 24 Years | 3 (100.0%) | 2 (100.0%) |
| 25 to 34 Years | 67 (100.0%) | 50 (100.0%) |
| 35 to 44 Years | 5 (100.0%) | 7 (100.0%) |
| 45 to 54 Years | 10 (100.0%) | 10 (100.0%) |
| 55 to 64 Years | 8 (80.0%) | 6 (54.5%) |
| 65 to 74 Years | 18 (78.3%) | 32 (100.0%) |
| 75 Years and over | 5 (14.3%) | 10 (100.0%) |
| Total | 179 (82.9%) | 260 (98.1%) |
Income Below Poverty Among Married-Couple Families in Coupland
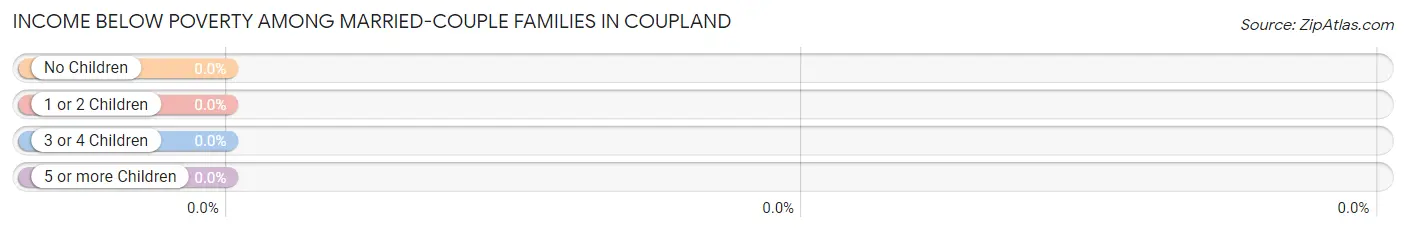
| Children | Above Poverty | Below Poverty |
| No Children | 38 (100.0%) | 0 (0.0%) |
| 1 or 2 Children | 7 (100.0%) | 0 (0.0%) |
| 3 or 4 Children | 48 (100.0%) | 0 (0.0%) |
| 5 or more Children | 0 (0.0%) | 0 (0.0%) |
| Total | 93 (100.0%) | 0 (0.0%) |
Income Below Poverty Among Single-Parent Households in Coupland
| Children | Single Father | Single Mother |
| No Children | 0 (0.0%) | 0 (0.0%) |
| 1 or 2 Children | 0 (0.0%) | 0 (0.0%) |
| 3 or 4 Children | 0 (0.0%) | 0 (0.0%) |
| 5 or more Children | 0 (0.0%) | 0 (0.0%) |
| Total | 0 (0.0%) | 0 (0.0%) |
Income Below Poverty Among Married-Couple vs Single-Parent Households in Coupland
| Children | Married-Couple Families | Single-Parent Households |
| No Children | 0 (0.0%) | 0 (0.0%) |
| 1 or 2 Children | 0 (0.0%) | 0 (0.0%) |
| 3 or 4 Children | 0 (0.0%) | 0 (0.0%) |
| 5 or more Children | 0 (0.0%) | 0 (0.0%) |
| Total | 0 (0.0%) | 0 (0.0%) |
Race in Coupland
The most populous races in Coupland are Hispanic or Latino (296 | 61.5%), Two or more Races (286 | 59.5%), and White / Caucasian (195 | 40.5%).
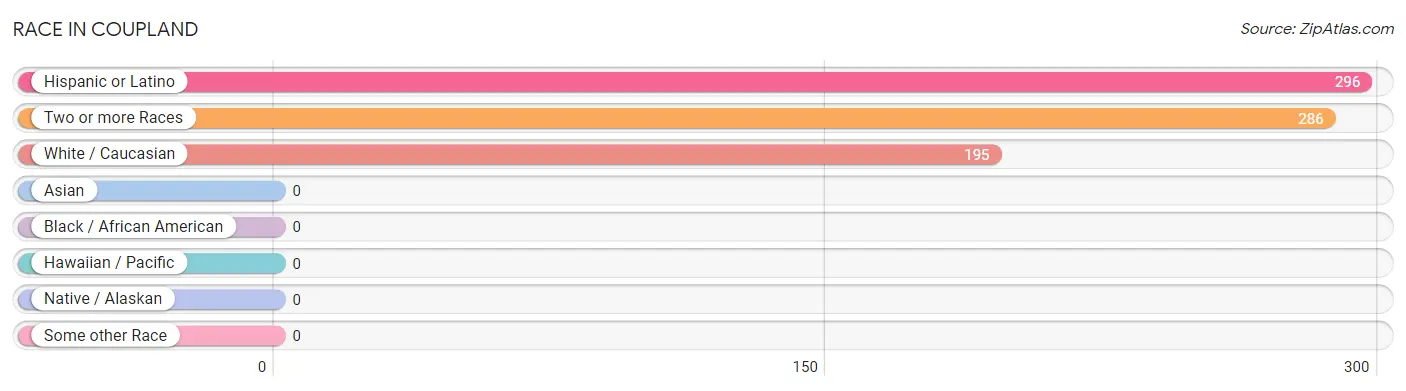
| Race | # Population | % Population |
| Asian | 0 | 0.0% |
| Black / African American | 0 | 0.0% |
| Hawaiian / Pacific | 0 | 0.0% |
| Hispanic or Latino | 296 | 61.5% |
| Native / Alaskan | 0 | 0.0% |
| White / Caucasian | 195 | 40.5% |
| Two or more Races | 286 | 59.5% |
| Some other Race | 0 | 0.0% |
| Total | 481 | 100.0% |
Ancestry in Coupland
The most populous ancestries reported in Coupland are Mexican (291 | 60.5%), German (56 | 11.6%), Swiss (44 | 9.1%), English (31 | 6.4%), and Irish (10 | 2.1%), together accounting for 89.8% of all Coupland residents.
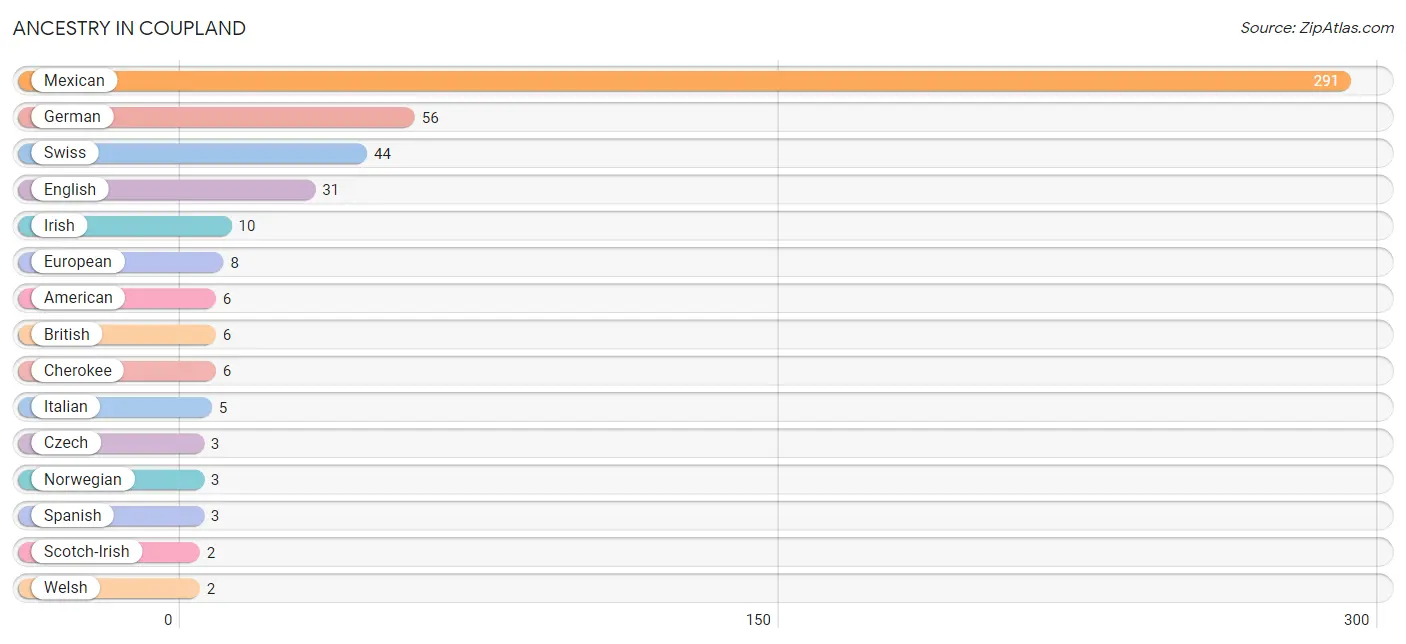
| Ancestry | # Population | % Population |
| American | 6 | 1.3% |
| British | 6 | 1.3% |
| Cherokee | 6 | 1.3% |
| Czech | 3 | 0.6% |
| Eastern European | 1 | 0.2% |
| English | 31 | 6.4% |
| European | 8 | 1.7% |
| French | 1 | 0.2% |
| German | 56 | 11.6% |
| Irish | 10 | 2.1% |
| Italian | 5 | 1.0% |
| Mexican | 291 | 60.5% |
| Norwegian | 3 | 0.6% |
| Scotch-Irish | 2 | 0.4% |
| Spanish | 3 | 0.6% |
| Swedish | 1 | 0.2% |
| Swiss | 44 | 9.1% |
| Welsh | 2 | 0.4% | View All 18 Rows |
Immigrants in Coupland
The most numerous immigrant groups reported in Coupland came from Central America (54 | 11.2%), Latin America (54 | 11.2%), and Mexico (54 | 11.2%), together accounting for 33.7% of all Coupland residents.
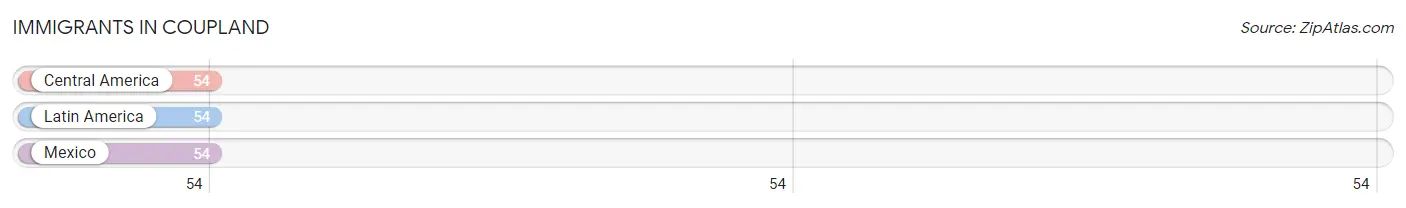
| Immigration Origin | # Population | % Population |
| Central America | 54 | 11.2% |
| Latin America | 54 | 11.2% |
| Mexico | 54 | 11.2% | View All 3 Rows |
Sex and Age in Coupland
Sex and Age in Coupland
The most populous age groups in Coupland are 30 to 34 Years (66 | 30.6%) for men and 5 to 9 Years (51 | 19.3%) for women.
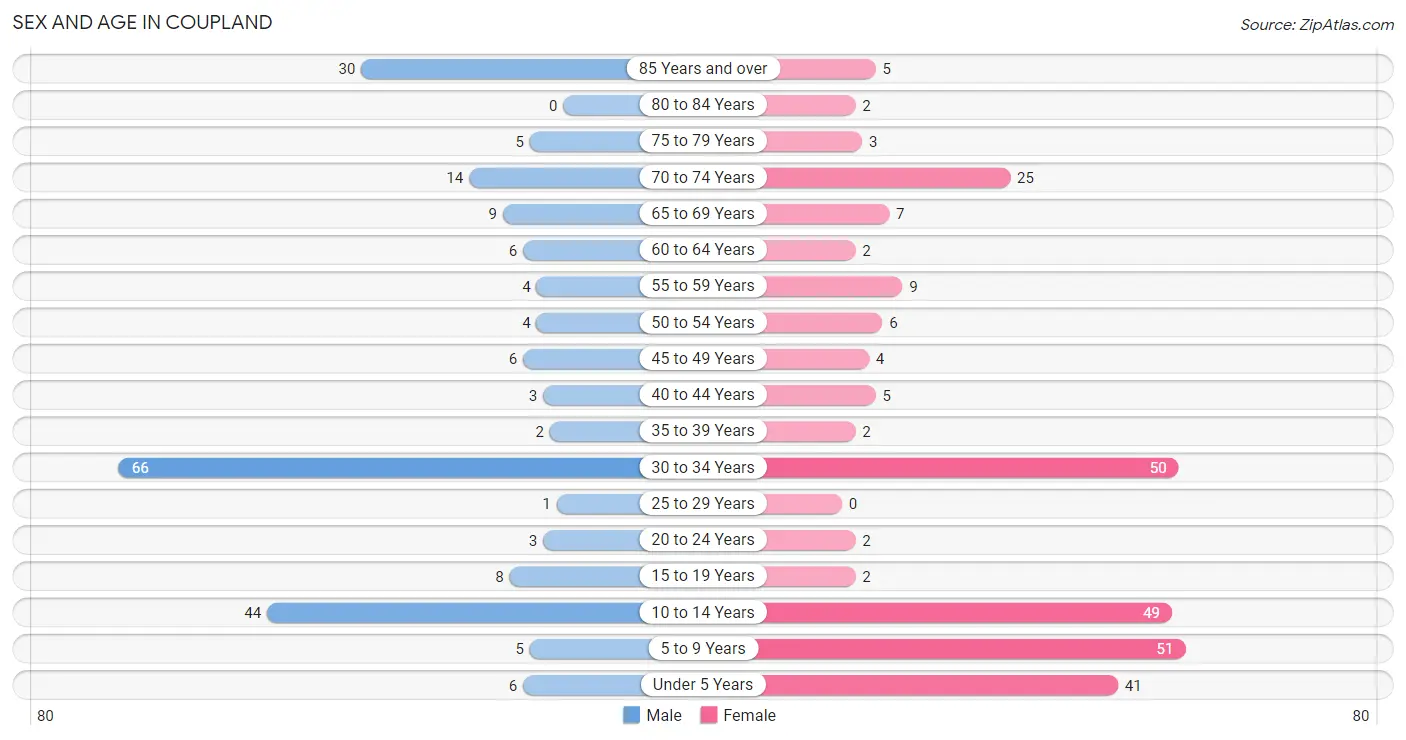
| Age Bracket | Male | Female |
| Under 5 Years | 6 (2.8%) | 41 (15.5%) |
| 5 to 9 Years | 5 (2.3%) | 51 (19.3%) |
| 10 to 14 Years | 44 (20.4%) | 49 (18.5%) |
| 15 to 19 Years | 8 (3.7%) | 2 (0.7%) |
| 20 to 24 Years | 3 (1.4%) | 2 (0.7%) |
| 25 to 29 Years | 1 (0.5%) | 0 (0.0%) |
| 30 to 34 Years | 66 (30.6%) | 50 (18.9%) |
| 35 to 39 Years | 2 (0.9%) | 2 (0.7%) |
| 40 to 44 Years | 3 (1.4%) | 5 (1.9%) |
| 45 to 49 Years | 6 (2.8%) | 4 (1.5%) |
| 50 to 54 Years | 4 (1.8%) | 6 (2.3%) |
| 55 to 59 Years | 4 (1.8%) | 9 (3.4%) |
| 60 to 64 Years | 6 (2.8%) | 2 (0.7%) |
| 65 to 69 Years | 9 (4.2%) | 7 (2.6%) |
| 70 to 74 Years | 14 (6.5%) | 25 (9.4%) |
| 75 to 79 Years | 5 (2.3%) | 3 (1.1%) |
| 80 to 84 Years | 0 (0.0%) | 2 (0.7%) |
| 85 Years and over | 30 (13.9%) | 5 (1.9%) |
| Total | 216 (100.0%) | 265 (100.0%) |
Families and Households in Coupland
Median Family Size in Coupland
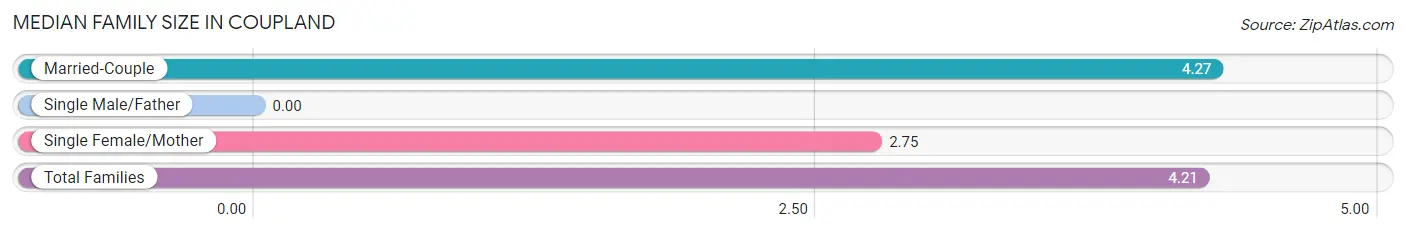
| Family Type | # Families | Family Size |
| Married-Couple | 93 (95.9%) | 4.27 |
| Single Male/Father | 0 (0.0%) | - |
| Single Female/Mother | 4 (4.1%) | 2.75 |
| Total Families | 97 (100.0%) | 4.21 |
Median Household Size in Coupland
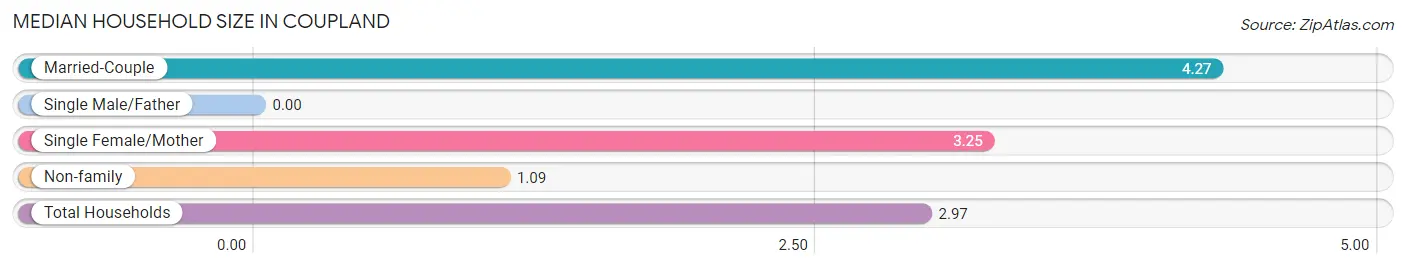
| Household Type | # Households | Household Size |
| Married-Couple | 93 (57.4%) | 4.27 |
| Single Male/Father | 0 (0.0%) | - |
| Single Female/Mother | 4 (2.5%) | 3.25 |
| Non-family | 65 (40.1%) | 1.09 |
| Total Households | 162 (100.0%) | 2.97 |
Household Size by Marriage Status in Coupland
Out of a total of 162 households in Coupland, 97 (59.9%) are family households, while 65 (40.1%) are nonfamily households. The most numerous type of family households are 6-person households, comprising 42, and the most common type of nonfamily households are 1-person households, comprising 60.
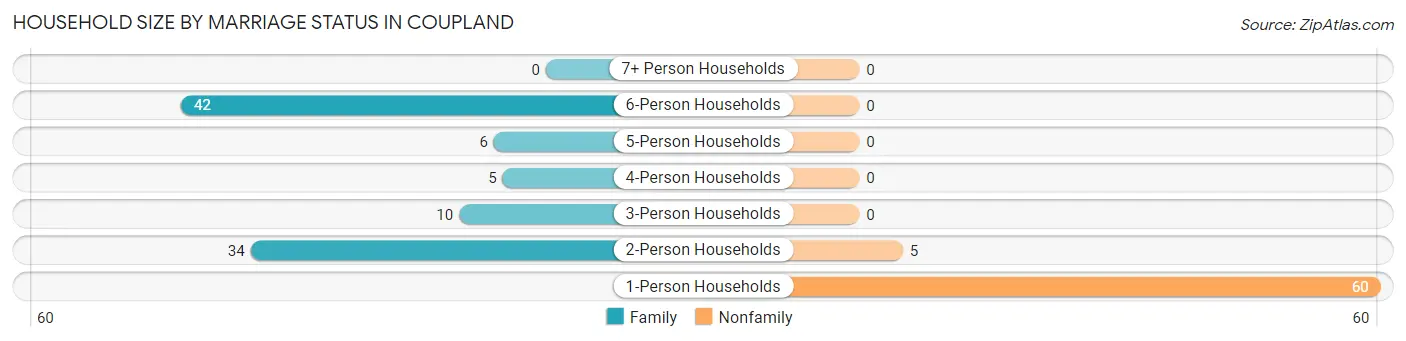
| Household Size | Family Households | Nonfamily Households |
| 1-Person Households | - | 60 (37.0%) |
| 2-Person Households | 34 (21.0%) | 5 (3.1%) |
| 3-Person Households | 10 (6.2%) | 0 (0.0%) |
| 4-Person Households | 5 (3.1%) | 0 (0.0%) |
| 5-Person Households | 6 (3.7%) | 0 (0.0%) |
| 6-Person Households | 42 (25.9%) | 0 (0.0%) |
| 7+ Person Households | 0 (0.0%) | 0 (0.0%) |
| Total | 97 (59.9%) | 65 (40.1%) |
Female Fertility in Coupland
Fertility by Age in Coupland
Average fertility rate in Coupland is 14.0 births per 1,000 women. Women in the age bracket of 35 to 50 years have the highest fertility rate with 67.0 births per 1,000 women. Women in the age bracket of 35 to 50 years acount for 100.0% of all women with births.
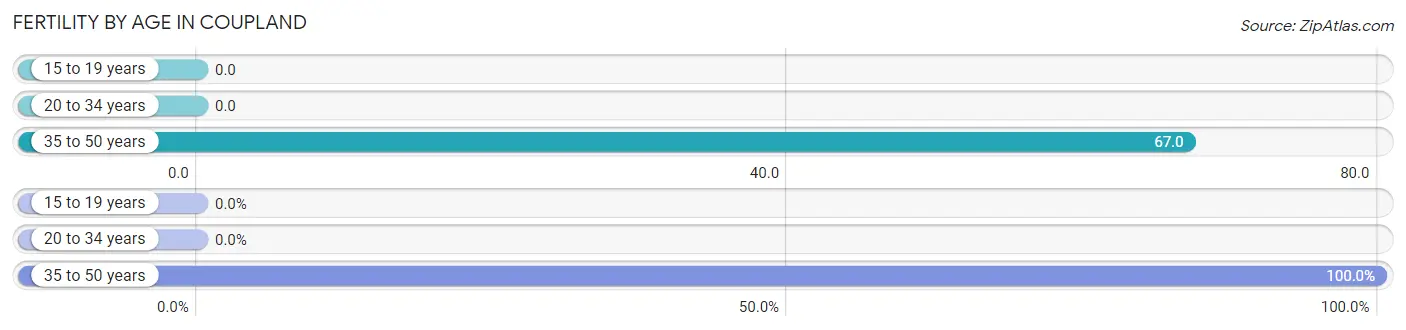
| Age Bracket | Women with Births | Births / 1,000 Women |
| 15 to 19 years | 0 (0.0%) | 0.0 |
| 20 to 34 years | 0 (0.0%) | 0.0 |
| 35 to 50 years | 1 (100.0%) | 67.0 |
| Total | 1 (100.0%) | 14.0 |
Fertility by Age by Marriage Status in Coupland
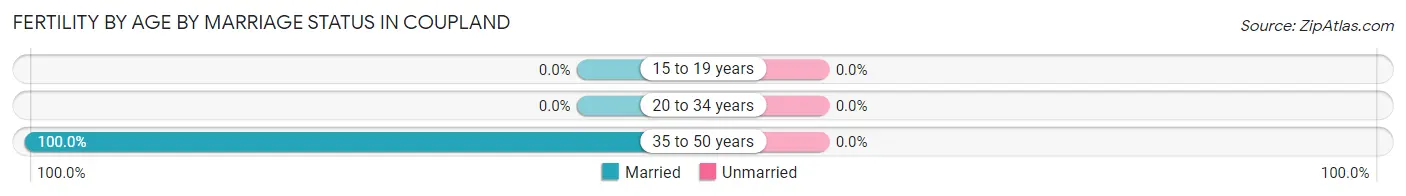
| Age Bracket | Married | Unmarried |
| 15 to 19 years | 0 (0.0%) | 0 (0.0%) |
| 20 to 34 years | 0 (0.0%) | 0 (0.0%) |
| 35 to 50 years | 1 (100.0%) | 0 (0.0%) |
| Total | 1 (100.0%) | 0 (0.0%) |
Fertility by Education in Coupland
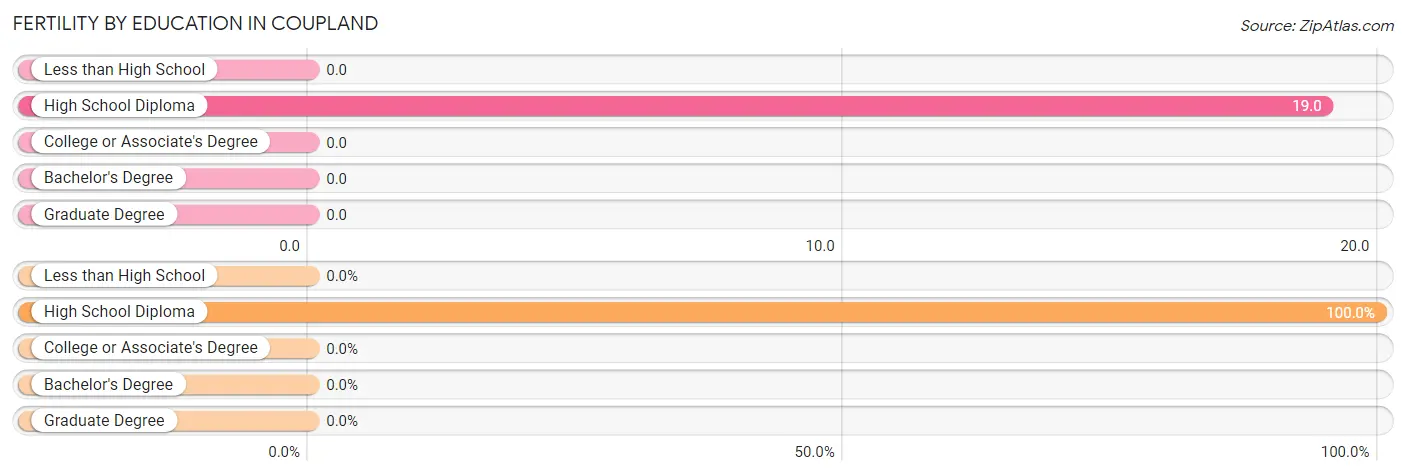
| Educational Attainment | Women with Births | Births / 1,000 Women |
| Less than High School | 0 (0.0%) | 0.0 |
| High School Diploma | 1 (100.0%) | 19.0 |
| College or Associate's Degree | 0 (0.0%) | 0.0 |
| Bachelor's Degree | 0 (0.0%) | 0.0 |
| Graduate Degree | 0 (0.0%) | 0.0 |
| Total | 1 (100.0%) | 14.0 |
Fertility by Education by Marriage Status in Coupland
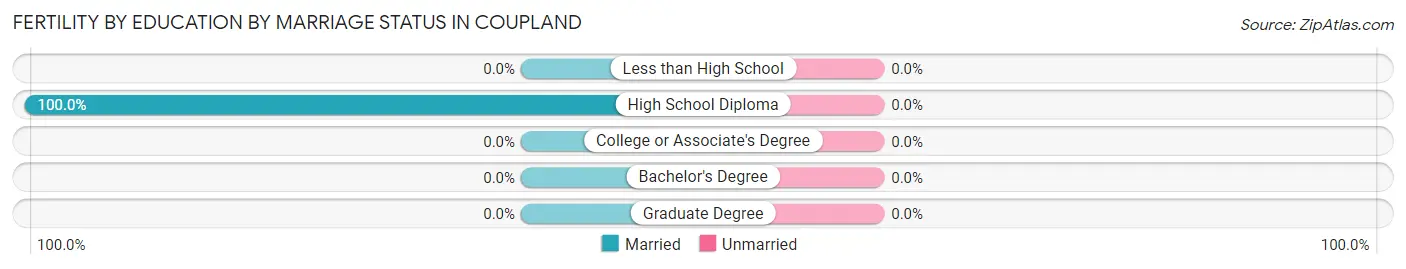
| Educational Attainment | Married | Unmarried |
| Less than High School | 0 (0.0%) | 0 (0.0%) |
| High School Diploma | 1 (100.0%) | 0 (0.0%) |
| College or Associate's Degree | 0 (0.0%) | 0 (0.0%) |
| Bachelor's Degree | 0 (0.0%) | 0 (0.0%) |
| Graduate Degree | 0 (0.0%) | 0 (0.0%) |
| Total | 1 (100.0%) | 0 (0.0%) |
Employment Characteristics in Coupland
Employment by Class of Employer in Coupland
Among the 166 employed individuals in Coupland, private company employees (105 | 63.2%), local government employees (47 | 28.3%), and not-for-profit organizations (7 | 4.2%) make up the most common classes of employment.
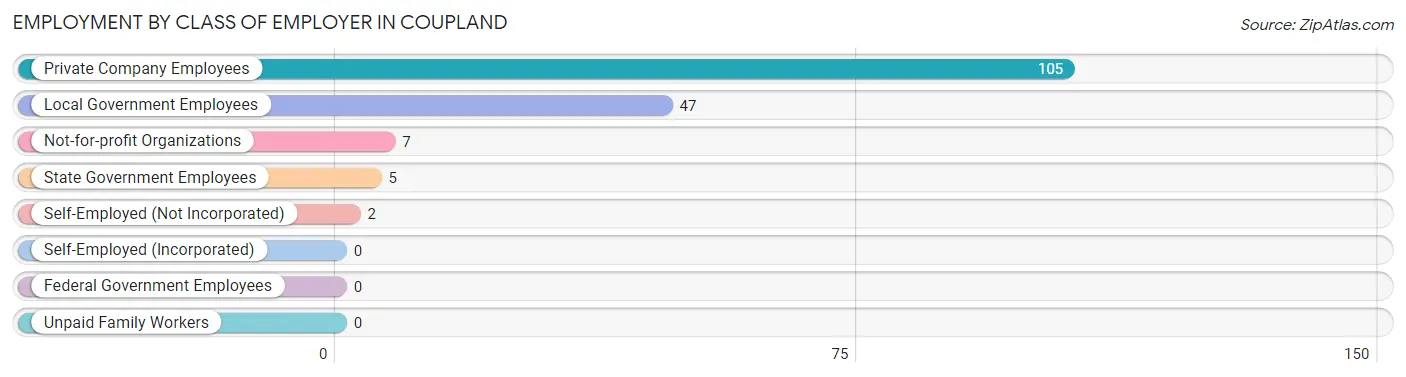
| Employer Class | # Employees | % Employees |
| Private Company Employees | 105 | 63.2% |
| Self-Employed (Incorporated) | 0 | 0.0% |
| Self-Employed (Not Incorporated) | 2 | 1.2% |
| Not-for-profit Organizations | 7 | 4.2% |
| Local Government Employees | 47 | 28.3% |
| State Government Employees | 5 | 3.0% |
| Federal Government Employees | 0 | 0.0% |
| Unpaid Family Workers | 0 | 0.0% |
| Total | 166 | 100.0% |
Employment Status by Age in Coupland
According to the labor force statistics for Coupland, out of the total population over 16 years of age (280), 60.4% or 169 individuals are in the labor force, with 0.6% or 1 of them unemployed. The age group with the highest labor force participation rate is 25 to 29 years, with 100.0% or 1 individuals in the labor force. Within the labor force, the 35 to 44 years age range has the highest percentage of unemployed individuals, with 10.0% or 1 of them being unemployed.
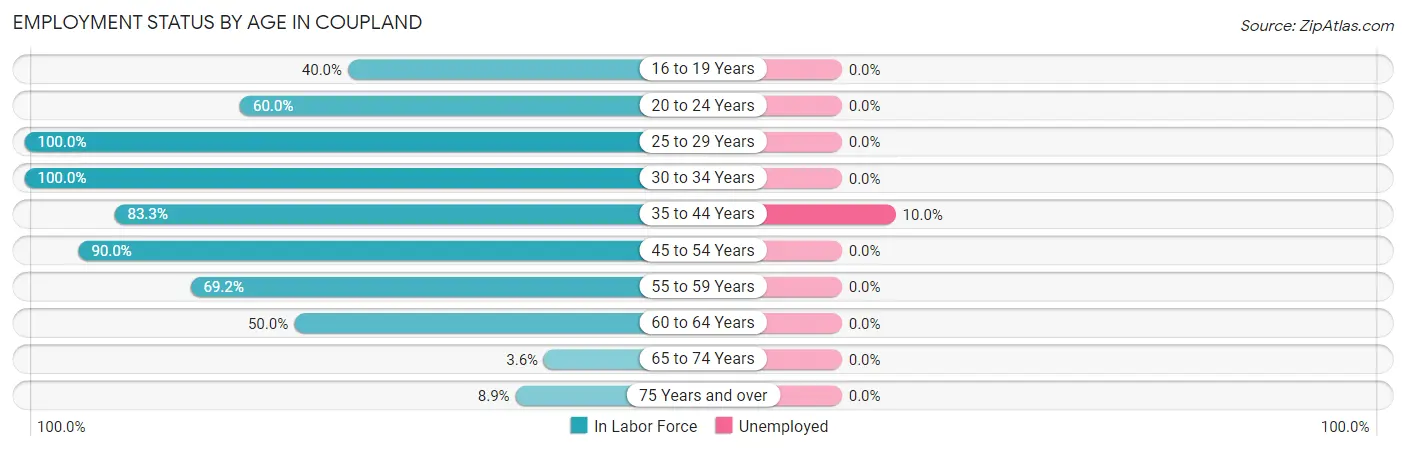
| Age Bracket | In Labor Force | Unemployed |
| 16 to 19 Years | 2 (40.0%) | 0 (0.0%) |
| 20 to 24 Years | 3 (60.0%) | 0 (0.0%) |
| 25 to 29 Years | 1 (100.0%) | 0 (0.0%) |
| 30 to 34 Years | 116 (100.0%) | 0 (0.0%) |
| 35 to 44 Years | 10 (83.3%) | 1 (10.0%) |
| 45 to 54 Years | 18 (90.0%) | 0 (0.0%) |
| 55 to 59 Years | 9 (69.2%) | 0 (0.0%) |
| 60 to 64 Years | 4 (50.0%) | 0 (0.0%) |
| 65 to 74 Years | 2 (3.6%) | 0 (0.0%) |
| 75 Years and over | 4 (8.9%) | 0 (0.0%) |
| Total | 169 (60.4%) | 1 (0.6%) |
Employment Status by Educational Attainment in Coupland
According to labor force statistics for Coupland, 92.9% of individuals (158) out of the total population between 25 and 64 years of age (170) are in the labor force, with 0.6% or 1 of them being unemployed. The group with the highest labor force participation rate are those with the educational attainment of less than high school, with 100.0% or 63 individuals in the labor force. Within the labor force, individuals with college / associate degree education have the highest percentage of unemployment, with 5.0% or 1 of them being unemployed.
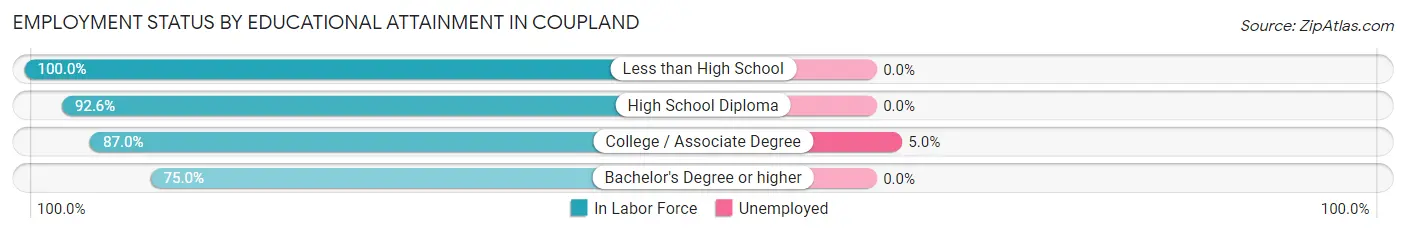
| Educational Attainment | In Labor Force | Unemployed |
| Less than High School | 63 (100.0%) | 0 (0.0%) |
| High School Diploma | 63 (92.6%) | 0 (0.0%) |
| College / Associate Degree | 20 (87.0%) | 1 (5.0%) |
| Bachelor's Degree or higher | 12 (75.0%) | 0 (0.0%) |
| Total | 158 (92.9%) | 1 (0.6%) |
Employment Occupations by Sex in Coupland
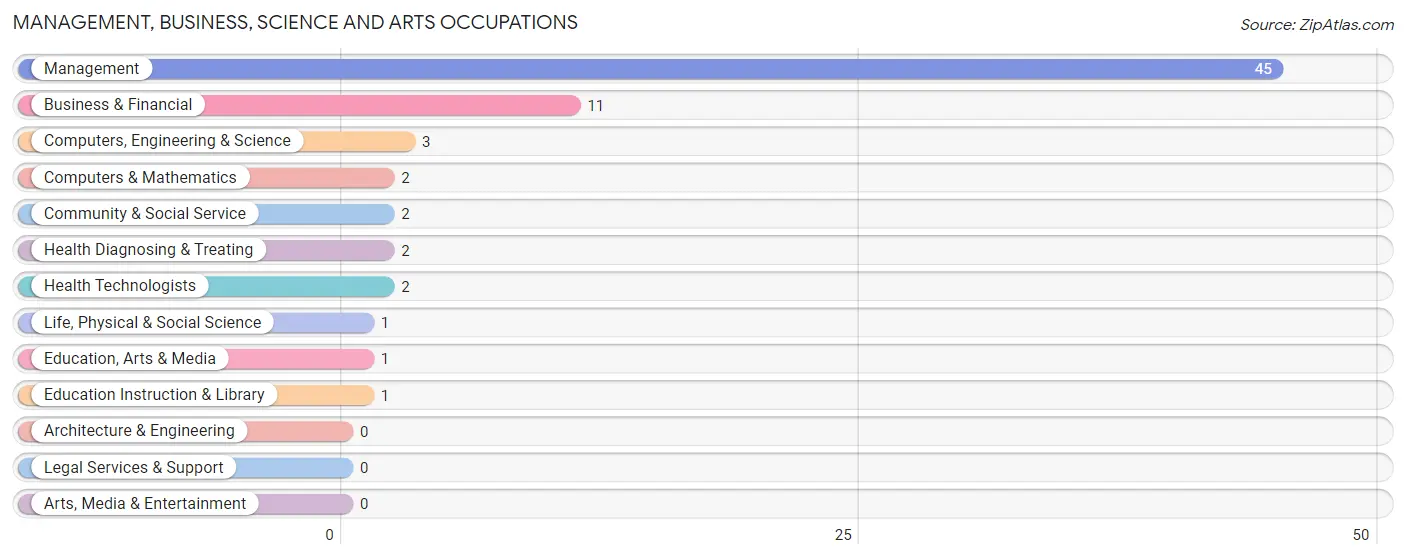
Management, Business, Science and Arts Occupations
The most common Management, Business, Science and Arts occupations in Coupland are Management (45 | 26.8%), Business & Financial (11 | 6.6%), Computers, Engineering & Science (3 | 1.8%), Computers & Mathematics (2 | 1.2%), and Community & Social Service (2 | 1.2%).
Management, Business, Science and Arts Occupations by Sex
Within the Management, Business, Science and Arts occupations in Coupland, the most male-oriented occupations are Life, Physical & Social Science (100.0%), Computers, Engineering & Science (33.3%), and Business & Financial (18.2%), while the most female-oriented occupations are Computers & Mathematics (100.0%), Community & Social Service (100.0%), and Education, Arts & Media (100.0%).
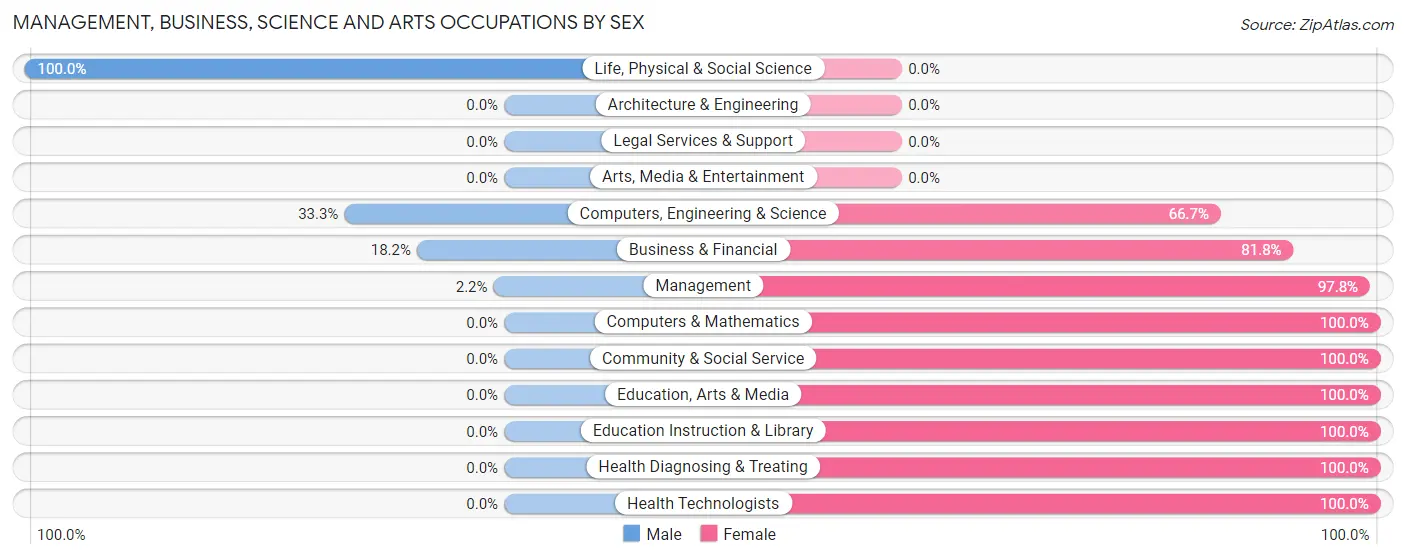
| Occupation | Male | Female |
| Management | 1 (2.2%) | 44 (97.8%) |
| Business & Financial | 2 (18.2%) | 9 (81.8%) |
| Computers, Engineering & Science | 1 (33.3%) | 2 (66.7%) |
| Computers & Mathematics | 0 (0.0%) | 2 (100.0%) |
| Architecture & Engineering | 0 (0.0%) | 0 (0.0%) |
| Life, Physical & Social Science | 1 (100.0%) | 0 (0.0%) |
| Community & Social Service | 0 (0.0%) | 2 (100.0%) |
| Education, Arts & Media | 0 (0.0%) | 1 (100.0%) |
| Legal Services & Support | 0 (0.0%) | 0 (0.0%) |
| Education Instruction & Library | 0 (0.0%) | 1 (100.0%) |
| Arts, Media & Entertainment | 0 (0.0%) | 0 (0.0%) |
| Health Diagnosing & Treating | 0 (0.0%) | 2 (100.0%) |
| Health Technologists | 0 (0.0%) | 2 (100.0%) |
| Total (Category) | 4 (6.4%) | 59 (93.6%) |
| Total (Overall) | 90 (53.6%) | 78 (46.4%) |
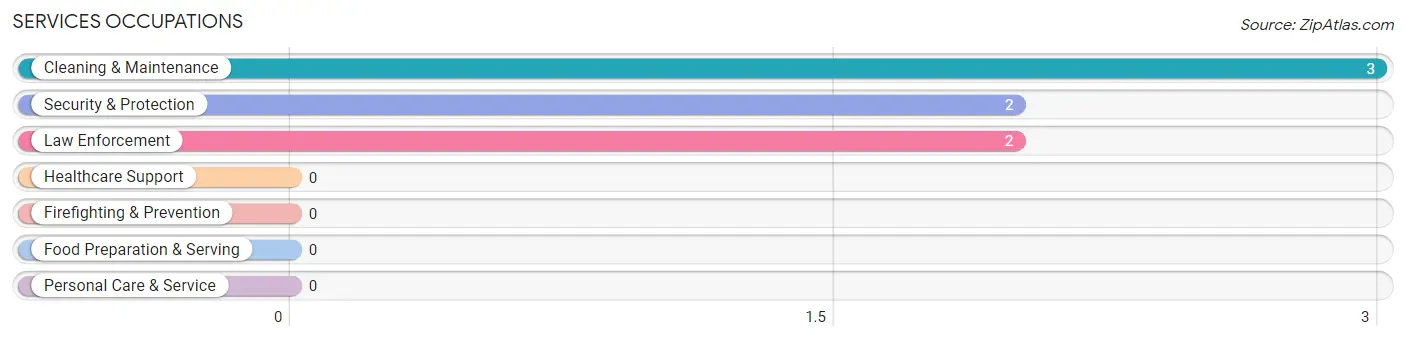
Services Occupations
The most common Services occupations in Coupland are Cleaning & Maintenance (3 | 1.8%), Security & Protection (2 | 1.2%), and Law Enforcement (2 | 1.2%).
Services Occupations by Sex
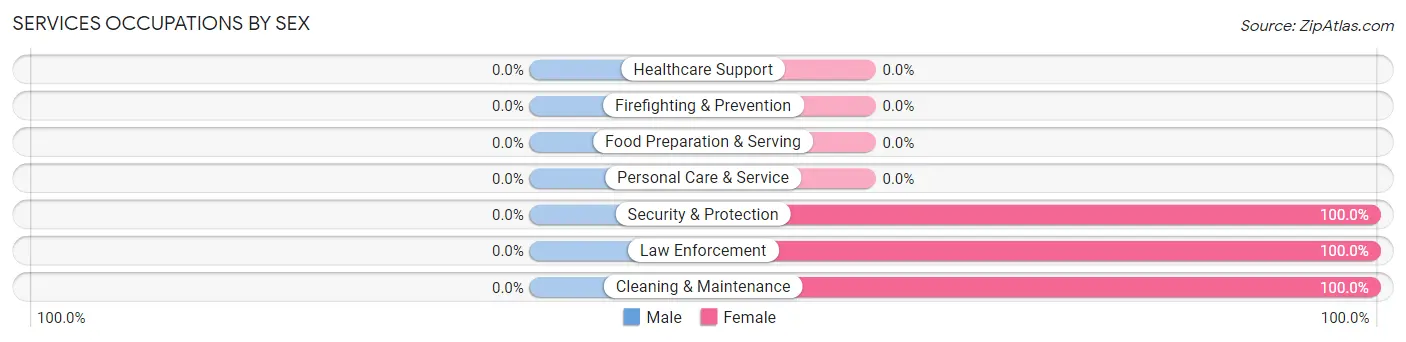
| Occupation | Male | Female |
| Healthcare Support | 0 (0.0%) | 0 (0.0%) |
| Security & Protection | 0 (0.0%) | 2 (100.0%) |
| Firefighting & Prevention | 0 (0.0%) | 0 (0.0%) |
| Law Enforcement | 0 (0.0%) | 2 (100.0%) |
| Food Preparation & Serving | 0 (0.0%) | 0 (0.0%) |
| Cleaning & Maintenance | 0 (0.0%) | 3 (100.0%) |
| Personal Care & Service | 0 (0.0%) | 0 (0.0%) |
| Total (Category) | 0 (0.0%) | 5 (100.0%) |
| Total (Overall) | 90 (53.6%) | 78 (46.4%) |
Sales and Office Occupations
The most common Sales and Office occupations in Coupland are Office & Administration (12 | 7.1%), and Sales & Related (8 | 4.8%).

Sales and Office Occupations by Sex
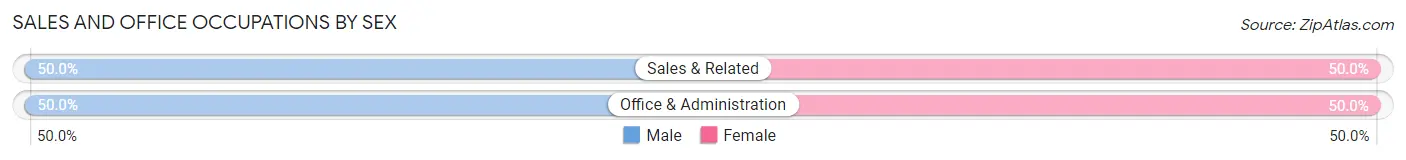
| Occupation | Male | Female |
| Sales & Related | 4 (50.0%) | 4 (50.0%) |
| Office & Administration | 6 (50.0%) | 6 (50.0%) |
| Total (Category) | 10 (50.0%) | 10 (50.0%) |
| Total (Overall) | 90 (53.6%) | 78 (46.4%) |
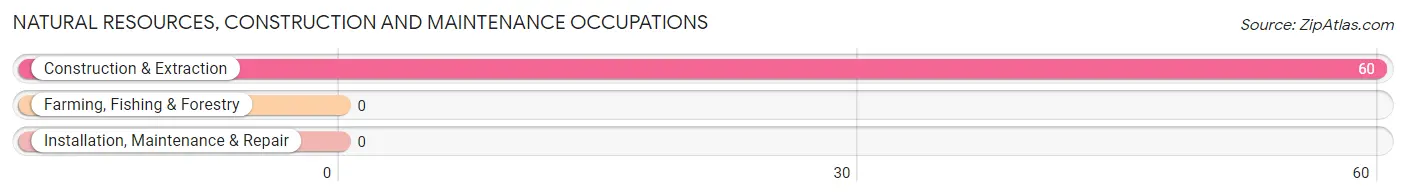
Natural Resources, Construction and Maintenance Occupations
The most common Natural Resources, Construction and Maintenance occupations in Coupland are , and Construction & Extraction (60 | 35.7%).
Natural Resources, Construction and Maintenance Occupations by Sex
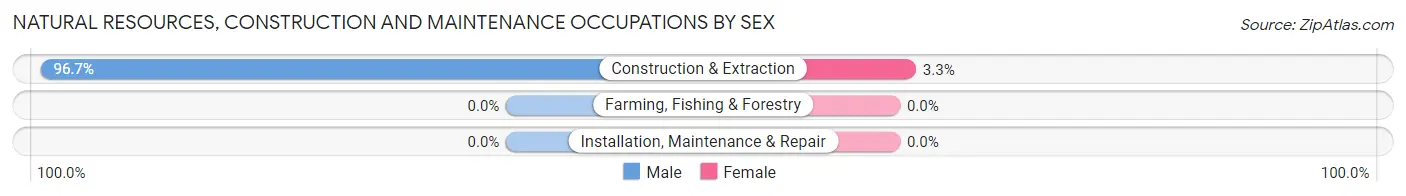
| Occupation | Male | Female |
| Farming, Fishing & Forestry | 0 (0.0%) | 0 (0.0%) |
| Construction & Extraction | 58 (96.7%) | 2 (3.3%) |
| Installation, Maintenance & Repair | 0 (0.0%) | 0 (0.0%) |
| Total (Category) | 58 (96.7%) | 2 (3.3%) |
| Total (Overall) | 90 (53.6%) | 78 (46.4%) |
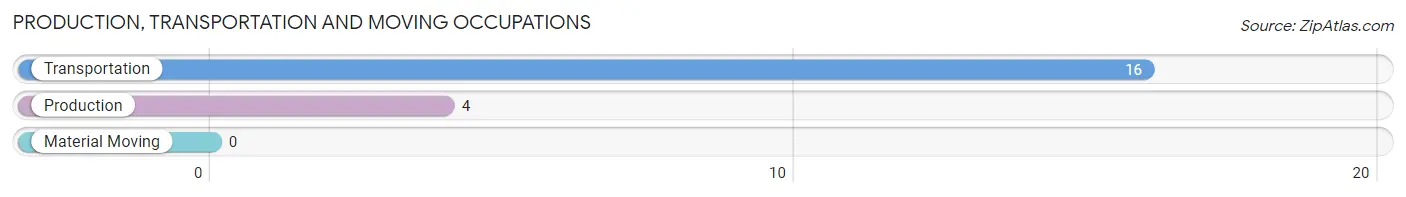
Production, Transportation and Moving Occupations
The most common Production, Transportation and Moving occupations in Coupland are Transportation (16 | 9.5%), and Production (4 | 2.4%).
Production, Transportation and Moving Occupations by Sex
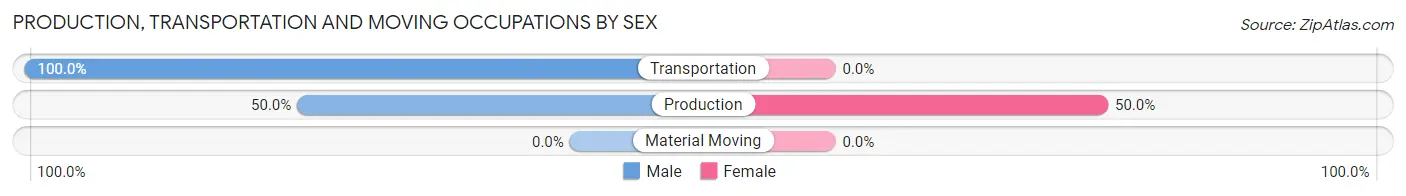
| Occupation | Male | Female |
| Production | 2 (50.0%) | 2 (50.0%) |
| Transportation | 16 (100.0%) | 0 (0.0%) |
| Material Moving | 0 (0.0%) | 0 (0.0%) |
| Total (Category) | 18 (90.0%) | 2 (10.0%) |
| Total (Overall) | 90 (53.6%) | 78 (46.4%) |
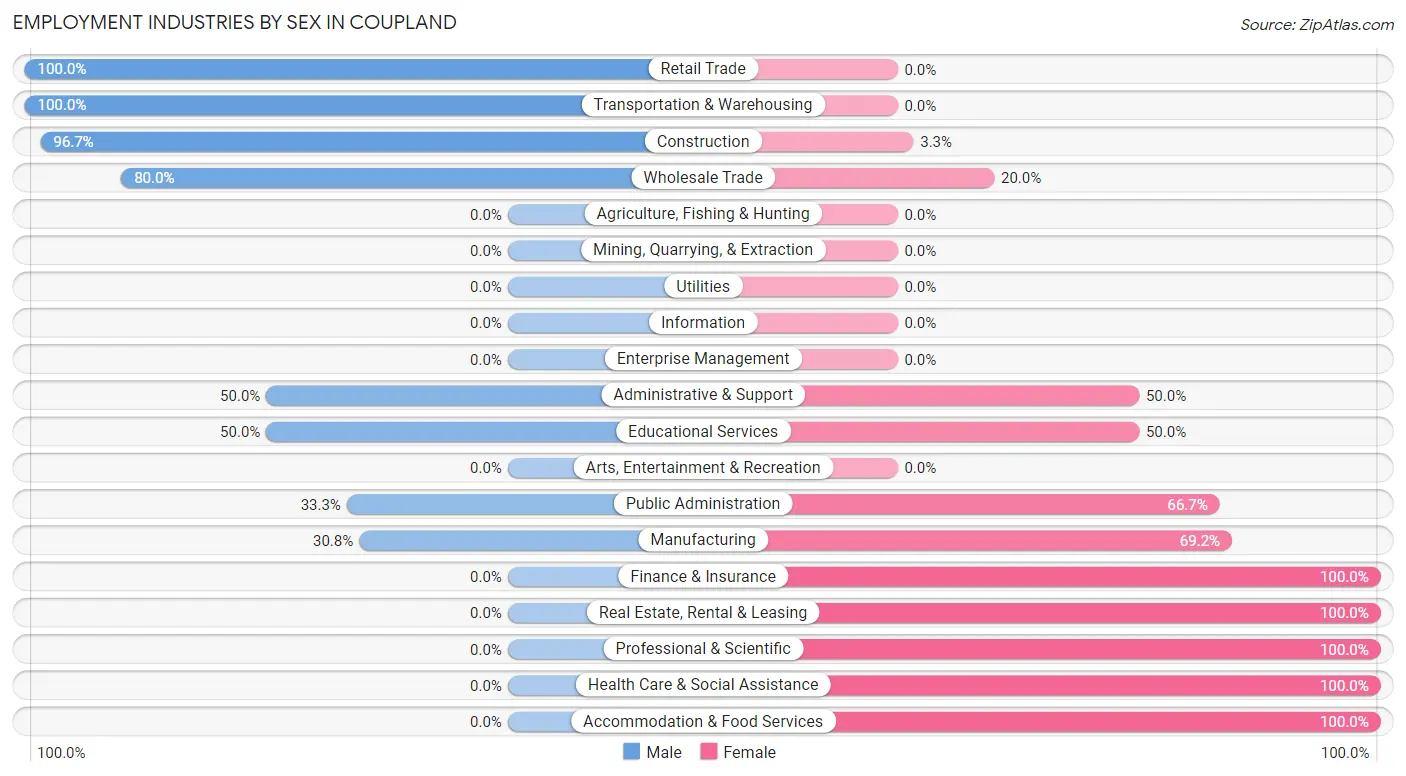
Employment Industries by Sex in Coupland
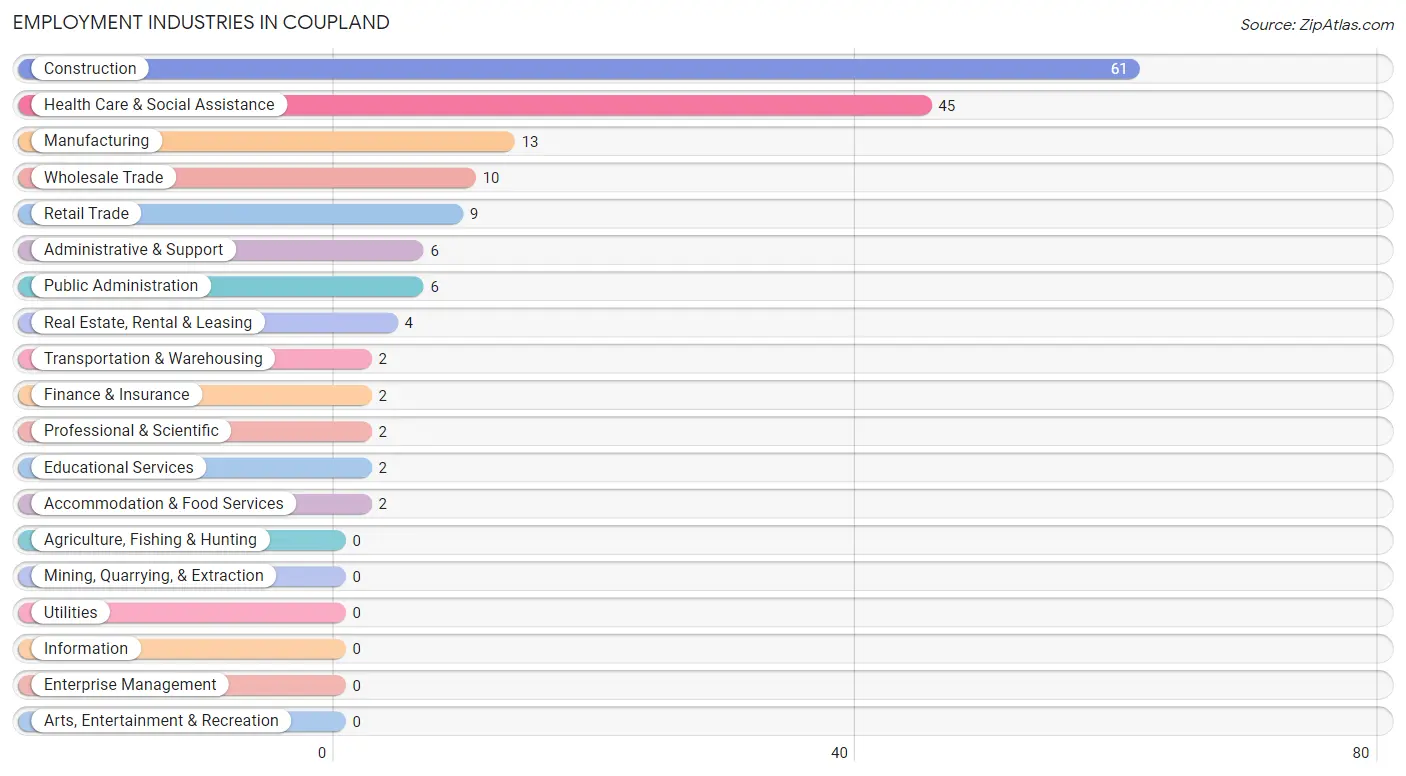
Employment Industries in Coupland
The major employment industries in Coupland include Construction (61 | 36.3%), Health Care & Social Assistance (45 | 26.8%), Manufacturing (13 | 7.7%), Wholesale Trade (10 | 5.9%), and Retail Trade (9 | 5.4%).
Employment Industries by Sex in Coupland
The Coupland industries that see more men than women are Retail Trade (100.0%), Transportation & Warehousing (100.0%), and Construction (96.7%), whereas the industries that tend to have a higher number of women are Finance & Insurance (100.0%), Real Estate, Rental & Leasing (100.0%), and Professional & Scientific (100.0%).
| Industry | Male | Female |
| Agriculture, Fishing & Hunting | 0 (0.0%) | 0 (0.0%) |
| Mining, Quarrying, & Extraction | 0 (0.0%) | 0 (0.0%) |
| Construction | 59 (96.7%) | 2 (3.3%) |
| Manufacturing | 4 (30.8%) | 9 (69.2%) |
| Wholesale Trade | 8 (80.0%) | 2 (20.0%) |
| Retail Trade | 9 (100.0%) | 0 (0.0%) |
| Transportation & Warehousing | 2 (100.0%) | 0 (0.0%) |
| Utilities | 0 (0.0%) | 0 (0.0%) |
| Information | 0 (0.0%) | 0 (0.0%) |
| Finance & Insurance | 0 (0.0%) | 2 (100.0%) |
| Real Estate, Rental & Leasing | 0 (0.0%) | 4 (100.0%) |
| Professional & Scientific | 0 (0.0%) | 2 (100.0%) |
| Enterprise Management | 0 (0.0%) | 0 (0.0%) |
| Administrative & Support | 3 (50.0%) | 3 (50.0%) |
| Educational Services | 1 (50.0%) | 1 (50.0%) |
| Health Care & Social Assistance | 0 (0.0%) | 45 (100.0%) |
| Arts, Entertainment & Recreation | 0 (0.0%) | 0 (0.0%) |
| Accommodation & Food Services | 0 (0.0%) | 2 (100.0%) |
| Public Administration | 2 (33.3%) | 4 (66.7%) |
| Total | 90 (53.6%) | 78 (46.4%) |
Education in Coupland
School Enrollment in Coupland
The most common levels of schooling among the 195 students in Coupland are middle school (87 | 44.6%), elementary school (53 | 27.2%), and nursery / preschool (39 | 20.0%).
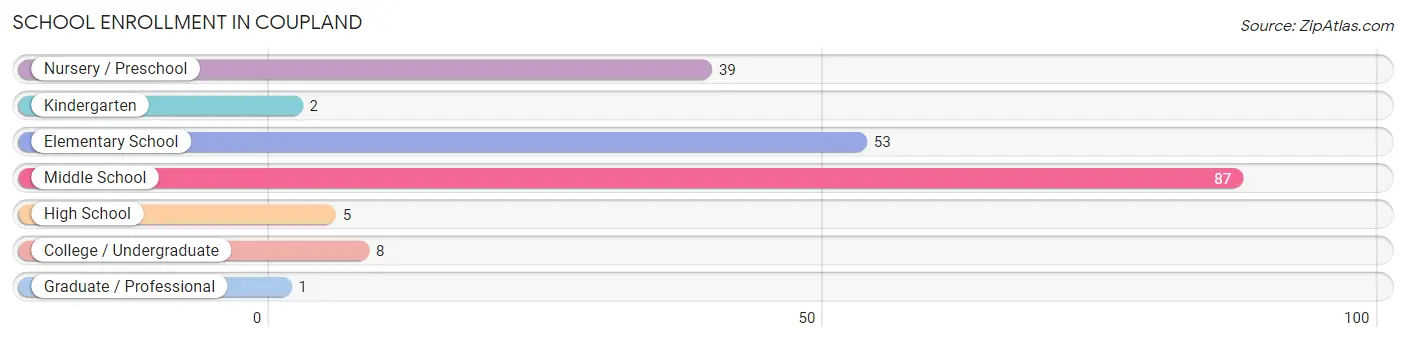
| School Level | # Students | % Students |
| Nursery / Preschool | 39 | 20.0% |
| Kindergarten | 2 | 1.0% |
| Elementary School | 53 | 27.2% |
| Middle School | 87 | 44.6% |
| High School | 5 | 2.6% |
| College / Undergraduate | 8 | 4.1% |
| Graduate / Professional | 1 | 0.5% |
| Total | 195 | 100.0% |
School Enrollment by Age by Funding Source in Coupland
Out of a total of 195 students who are enrolled in schools in Coupland, 3 (1.5%) attend a private institution, while the remaining 192 (98.5%) are enrolled in public schools. The age group of 35 years and over has the highest likelihood of being enrolled in private schools, with 3 (75.0% in the age bracket) enrolled. Conversely, the age group of 3 to 4 year olds has the lowest likelihood of being enrolled in a private school, with 39 (100.0% in the age bracket) attending a public institution.
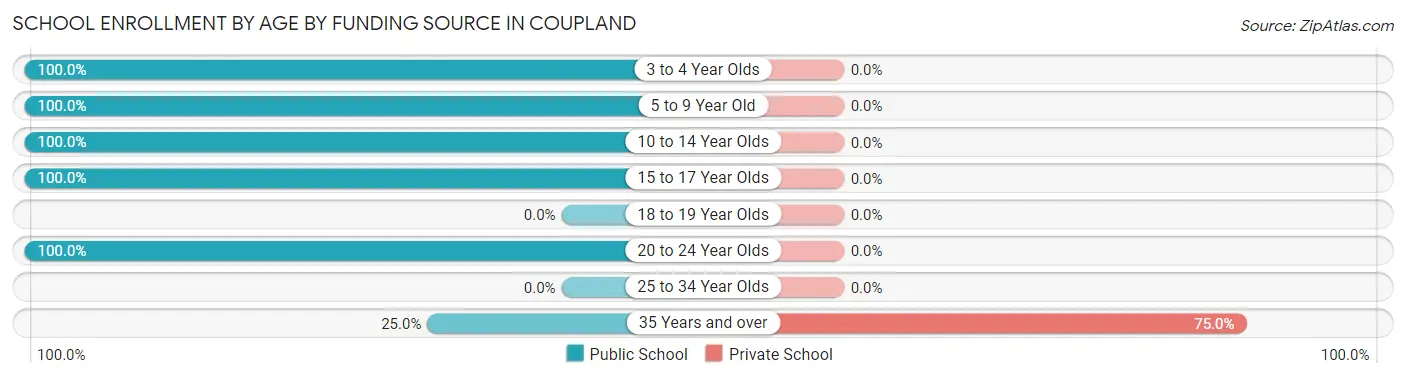
| Age Bracket | Public School | Private School |
| 3 to 4 Year Olds | 39 (100.0%) | 0 (0.0%) |
| 5 to 9 Year Old | 51 (100.0%) | 0 (0.0%) |
| 10 to 14 Year Olds | 93 (100.0%) | 0 (0.0%) |
| 15 to 17 Year Olds | 5 (100.0%) | 0 (0.0%) |
| 18 to 19 Year Olds | 0 (0.0%) | 0 (0.0%) |
| 20 to 24 Year Olds | 3 (100.0%) | 0 (0.0%) |
| 25 to 34 Year Olds | 0 (0.0%) | 0 (0.0%) |
| 35 Years and over | 1 (25.0%) | 3 (75.0%) |
| Total | 192 (98.5%) | 3 (1.5%) |
Educational Attainment by Field of Study in Coupland
Liberal arts & history (14 | 28.6%), education (6 | 12.2%), visual & performing arts (6 | 12.2%), bio, nature & agricultural (4 | 8.2%), and social sciences (4 | 8.2%) are the most common fields of study among 49 individuals in Coupland who have obtained a bachelor's degree or higher.
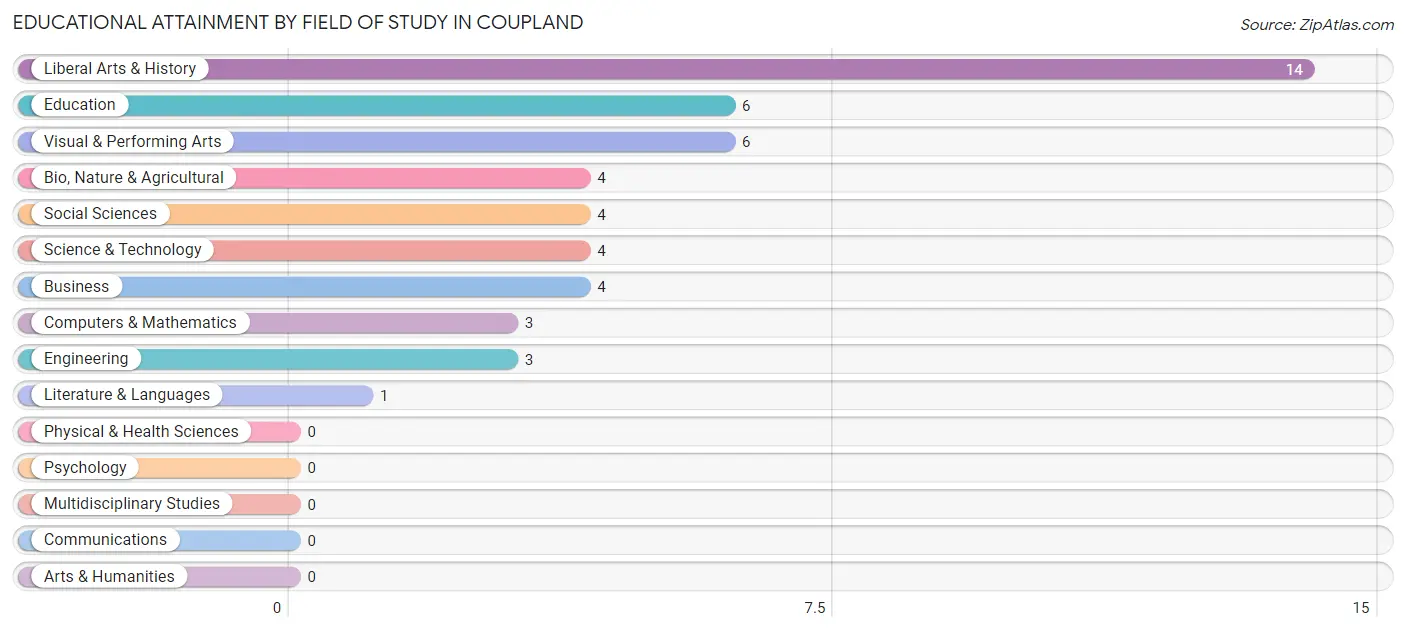
| Field of Study | # Graduates | % Graduates |
| Computers & Mathematics | 3 | 6.1% |
| Bio, Nature & Agricultural | 4 | 8.2% |
| Physical & Health Sciences | 0 | 0.0% |
| Psychology | 0 | 0.0% |
| Social Sciences | 4 | 8.2% |
| Engineering | 3 | 6.1% |
| Multidisciplinary Studies | 0 | 0.0% |
| Science & Technology | 4 | 8.2% |
| Business | 4 | 8.2% |
| Education | 6 | 12.2% |
| Literature & Languages | 1 | 2.0% |
| Liberal Arts & History | 14 | 28.6% |
| Visual & Performing Arts | 6 | 12.2% |
| Communications | 0 | 0.0% |
| Arts & Humanities | 0 | 0.0% |
| Total | 49 | 100.0% |
Transportation & Commute in Coupland
Vehicle Availability by Sex in Coupland
The most prevalent vehicle ownership categories in Coupland are males with 2 vehicles (62, accounting for 68.9%) and females with 2 vehicles (58, making up 81.6%).
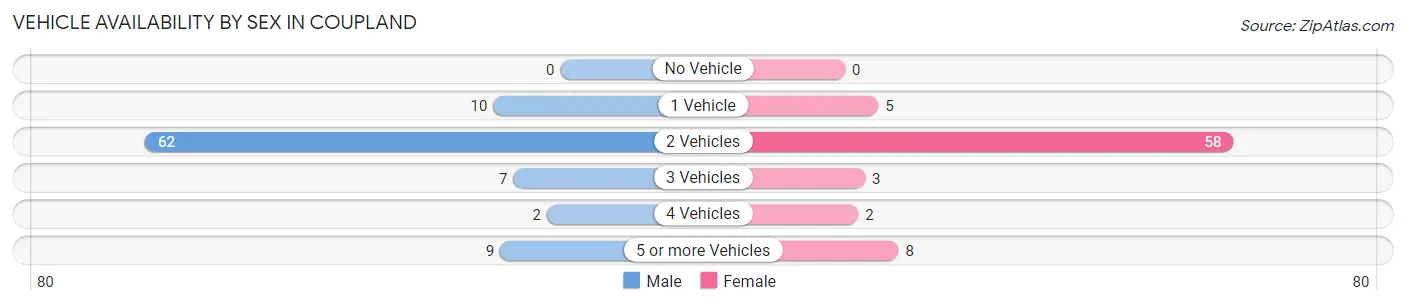
| Vehicles Available | Male | Female |
| No Vehicle | 0 (0.0%) | 0 (0.0%) |
| 1 Vehicle | 10 (11.1%) | 5 (6.6%) |
| 2 Vehicles | 62 (68.9%) | 58 (76.3%) |
| 3 Vehicles | 7 (7.8%) | 3 (4.0%) |
| 4 Vehicles | 2 (2.2%) | 2 (2.6%) |
| 5 or more Vehicles | 9 (10.0%) | 8 (10.5%) |
| Total | 90 (100.0%) | 76 (100.0%) |
Commute Time in Coupland
The most frequently occuring commute durations in Coupland are 35 to 39 minutes (52 commuters, 35.1%), 60 to 89 minutes (45 commuters, 30.4%), and 90 or more minutes (14 commuters, 9.5%).
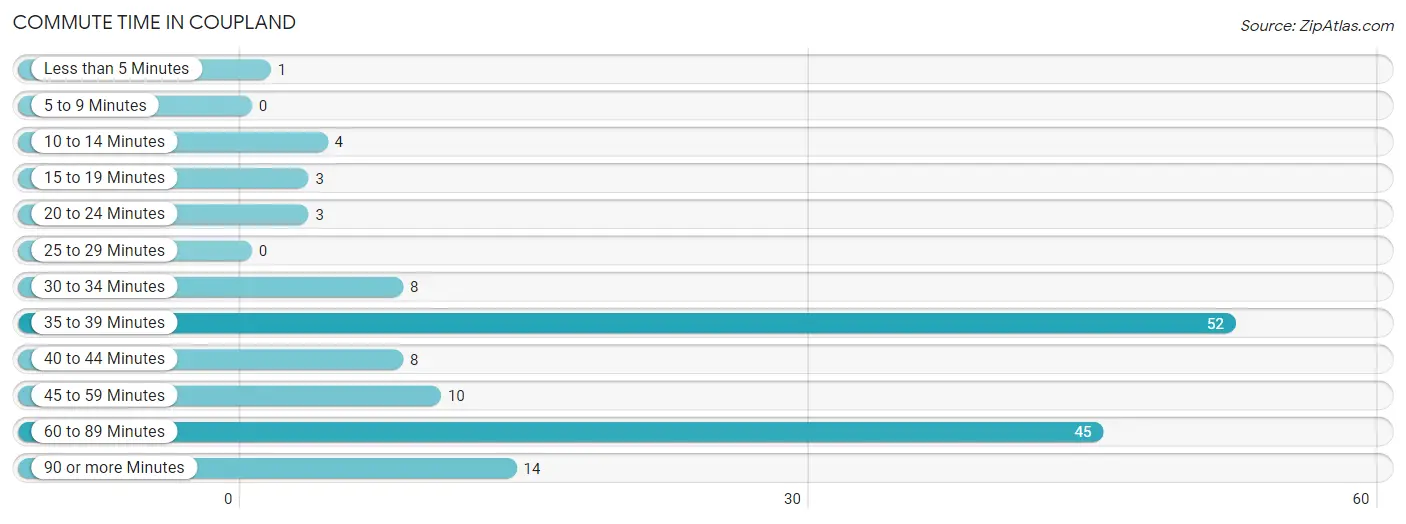
| Commute Time | # Commuters | % Commuters |
| Less than 5 Minutes | 1 | 0.7% |
| 5 to 9 Minutes | 0 | 0.0% |
| 10 to 14 Minutes | 4 | 2.7% |
| 15 to 19 Minutes | 3 | 2.0% |
| 20 to 24 Minutes | 3 | 2.0% |
| 25 to 29 Minutes | 0 | 0.0% |
| 30 to 34 Minutes | 8 | 5.4% |
| 35 to 39 Minutes | 52 | 35.1% |
| 40 to 44 Minutes | 8 | 5.4% |
| 45 to 59 Minutes | 10 | 6.8% |
| 60 to 89 Minutes | 45 | 30.4% |
| 90 or more Minutes | 14 | 9.5% |
Commute Time by Sex in Coupland
The most common commute times in Coupland are 35 to 39 minutes (52 commuters, 68.4%) for males and 60 to 89 minutes (44 commuters, 61.1%) for females.
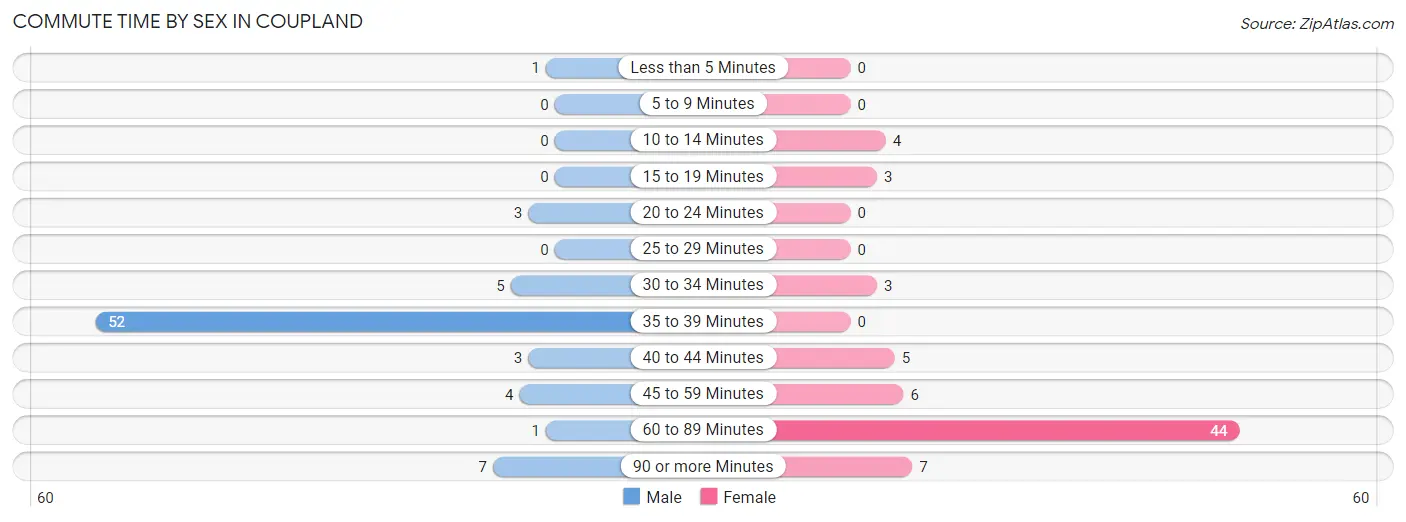
| Commute Time | Male | Female |
| Less than 5 Minutes | 1 (1.3%) | 0 (0.0%) |
| 5 to 9 Minutes | 0 (0.0%) | 0 (0.0%) |
| 10 to 14 Minutes | 0 (0.0%) | 4 (5.6%) |
| 15 to 19 Minutes | 0 (0.0%) | 3 (4.2%) |
| 20 to 24 Minutes | 3 (4.0%) | 0 (0.0%) |
| 25 to 29 Minutes | 0 (0.0%) | 0 (0.0%) |
| 30 to 34 Minutes | 5 (6.6%) | 3 (4.2%) |
| 35 to 39 Minutes | 52 (68.4%) | 0 (0.0%) |
| 40 to 44 Minutes | 3 (4.0%) | 5 (6.9%) |
| 45 to 59 Minutes | 4 (5.3%) | 6 (8.3%) |
| 60 to 89 Minutes | 1 (1.3%) | 44 (61.1%) |
| 90 or more Minutes | 7 (9.2%) | 7 (9.7%) |
Time of Departure to Work by Sex in Coupland
The most frequent times of departure to work in Coupland are 7:00 AM to 7:29 AM (53, 69.7%) for males and 6:30 AM to 6:59 AM (51, 70.8%) for females.
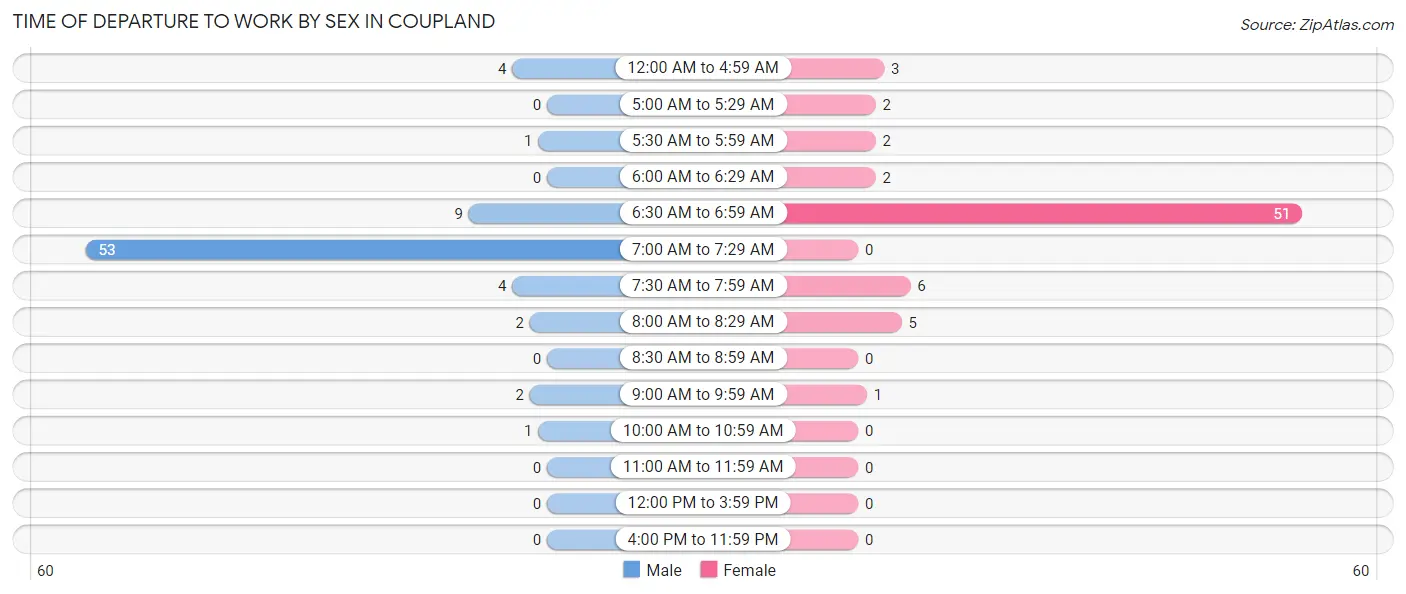
| Time of Departure | Male | Female |
| 12:00 AM to 4:59 AM | 4 (5.3%) | 3 (4.2%) |
| 5:00 AM to 5:29 AM | 0 (0.0%) | 2 (2.8%) |
| 5:30 AM to 5:59 AM | 1 (1.3%) | 2 (2.8%) |
| 6:00 AM to 6:29 AM | 0 (0.0%) | 2 (2.8%) |
| 6:30 AM to 6:59 AM | 9 (11.8%) | 51 (70.8%) |
| 7:00 AM to 7:29 AM | 53 (69.7%) | 0 (0.0%) |
| 7:30 AM to 7:59 AM | 4 (5.3%) | 6 (8.3%) |
| 8:00 AM to 8:29 AM | 2 (2.6%) | 5 (6.9%) |
| 8:30 AM to 8:59 AM | 0 (0.0%) | 0 (0.0%) |
| 9:00 AM to 9:59 AM | 2 (2.6%) | 1 (1.4%) |
| 10:00 AM to 10:59 AM | 1 (1.3%) | 0 (0.0%) |
| 11:00 AM to 11:59 AM | 0 (0.0%) | 0 (0.0%) |
| 12:00 PM to 3:59 PM | 0 (0.0%) | 0 (0.0%) |
| 4:00 PM to 11:59 PM | 0 (0.0%) | 0 (0.0%) |
| Total | 76 (100.0%) | 72 (100.0%) |
Housing Occupancy in Coupland
Occupancy by Ownership in Coupland
Of the total 162 dwellings in Coupland, owner-occupied units account for 140 (86.4%), while renter-occupied units make up 22 (13.6%).
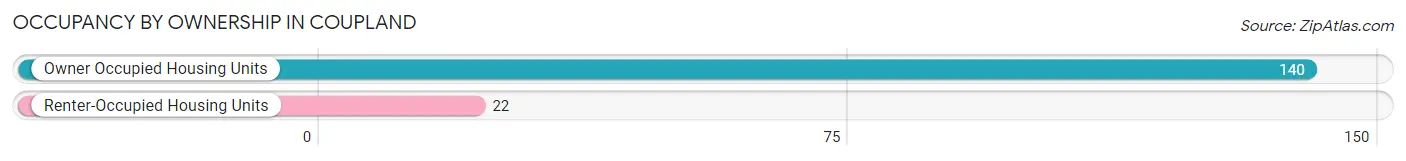
| Occupancy | # Housing Units | % Housing Units |
| Owner Occupied Housing Units | 140 | 86.4% |
| Renter-Occupied Housing Units | 22 | 13.6% |
| Total Occupied Housing Units | 162 | 100.0% |
Occupancy by Household Size in Coupland
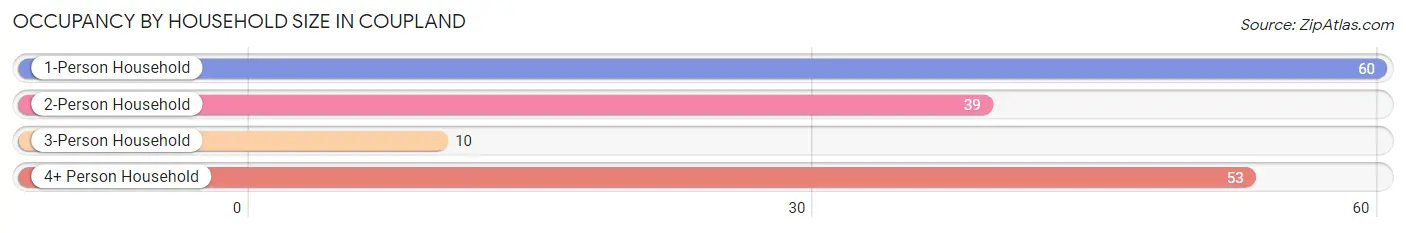
| Household Size | # Housing Units | % Housing Units |
| 1-Person Household | 60 | 37.0% |
| 2-Person Household | 39 | 24.1% |
| 3-Person Household | 10 | 6.2% |
| 4+ Person Household | 53 | 32.7% |
| Total Housing Units | 162 | 100.0% |
Occupancy by Ownership by Household Size in Coupland
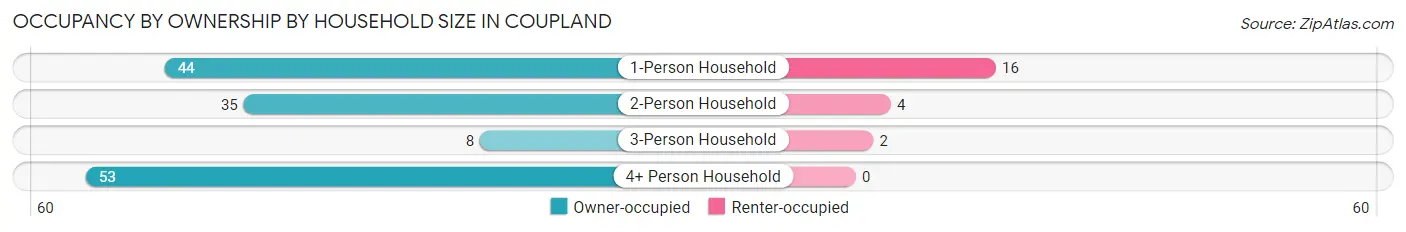
| Household Size | Owner-occupied | Renter-occupied |
| 1-Person Household | 44 (73.3%) | 16 (26.7%) |
| 2-Person Household | 35 (89.7%) | 4 (10.3%) |
| 3-Person Household | 8 (80.0%) | 2 (20.0%) |
| 4+ Person Household | 53 (100.0%) | 0 (0.0%) |
| Total Housing Units | 140 (86.4%) | 22 (13.6%) |
Occupancy by Educational Attainment in Coupland
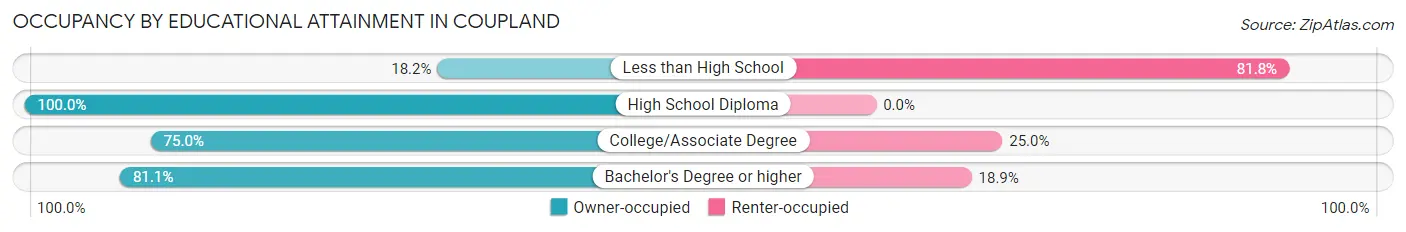
| Household Size | Owner-occupied | Renter-occupied |
| Less than High School | 2 (18.2%) | 9 (81.8%) |
| High School Diploma | 90 (100.0%) | 0 (0.0%) |
| College/Associate Degree | 18 (75.0%) | 6 (25.0%) |
| Bachelor's Degree or higher | 30 (81.1%) | 7 (18.9%) |
Occupancy by Age of Householder in Coupland
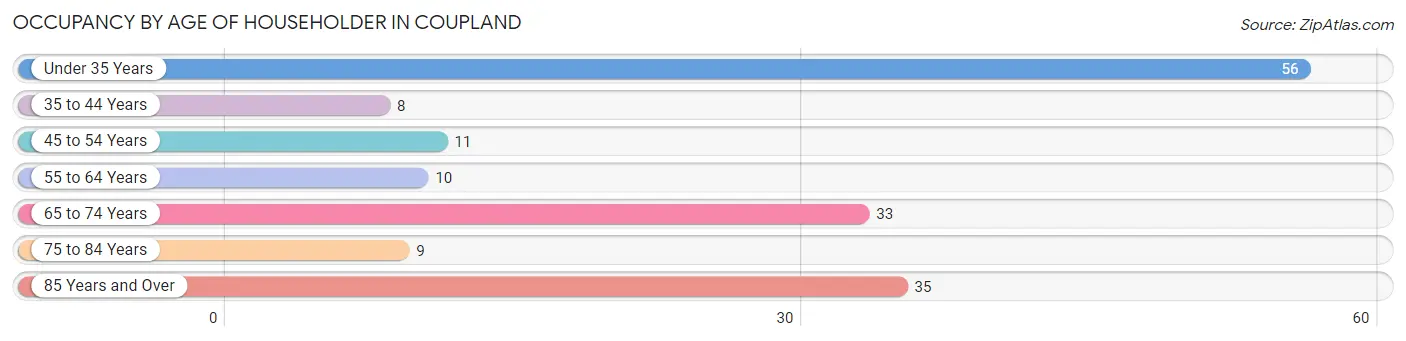
| Age Bracket | # Households | % Households |
| Under 35 Years | 56 | 34.6% |
| 35 to 44 Years | 8 | 4.9% |
| 45 to 54 Years | 11 | 6.8% |
| 55 to 64 Years | 10 | 6.2% |
| 65 to 74 Years | 33 | 20.4% |
| 75 to 84 Years | 9 | 5.6% |
| 85 Years and Over | 35 | 21.6% |
| Total | 162 | 100.0% |
Housing Finances in Coupland
Median Income by Occupancy in Coupland
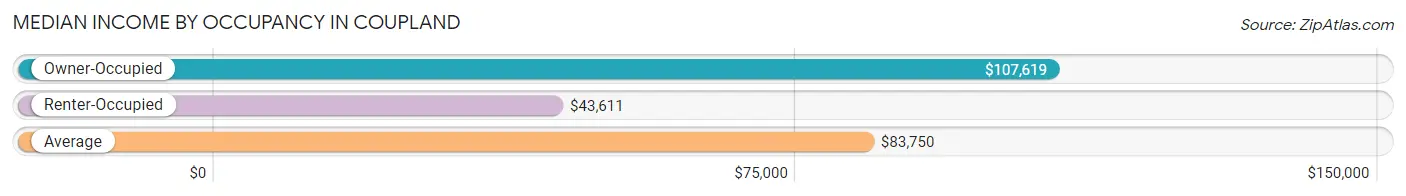
| Occupancy Type | # Households | Median Income |
| Owner-Occupied | 140 (86.4%) | $107,619 |
| Renter-Occupied | 22 (13.6%) | $43,611 |
| Average | 162 (100.0%) | $83,750 |
Occupancy by Householder Income Bracket in Coupland
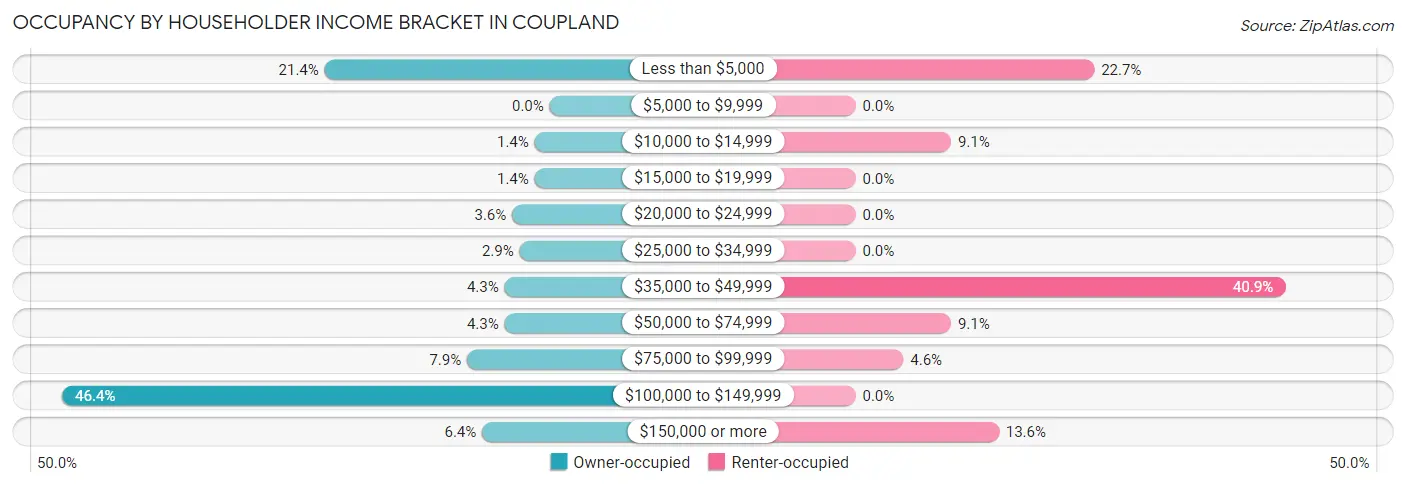
| Income Bracket | Owner-occupied | Renter-occupied |
| Less than $5,000 | 30 (21.4%) | 5 (22.7%) |
| $5,000 to $9,999 | 0 (0.0%) | 0 (0.0%) |
| $10,000 to $14,999 | 2 (1.4%) | 2 (9.1%) |
| $15,000 to $19,999 | 2 (1.4%) | 0 (0.0%) |
| $20,000 to $24,999 | 5 (3.6%) | 0 (0.0%) |
| $25,000 to $34,999 | 4 (2.9%) | 0 (0.0%) |
| $35,000 to $49,999 | 6 (4.3%) | 9 (40.9%) |
| $50,000 to $74,999 | 6 (4.3%) | 2 (9.1%) |
| $75,000 to $99,999 | 11 (7.9%) | 1 (4.5%) |
| $100,000 to $149,999 | 65 (46.4%) | 0 (0.0%) |
| $150,000 or more | 9 (6.4%) | 3 (13.6%) |
| Total | 140 (100.0%) | 22 (100.0%) |
Monthly Housing Cost Tiers in Coupland
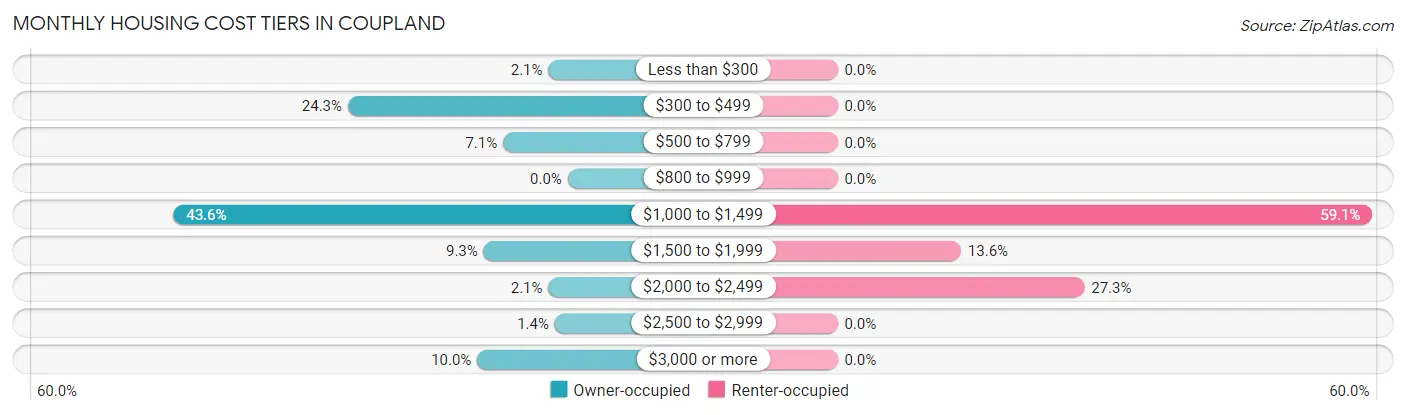
| Monthly Cost | Owner-occupied | Renter-occupied |
| Less than $300 | 3 (2.1%) | 0 (0.0%) |
| $300 to $499 | 34 (24.3%) | 0 (0.0%) |
| $500 to $799 | 10 (7.1%) | 0 (0.0%) |
| $800 to $999 | 0 (0.0%) | 0 (0.0%) |
| $1,000 to $1,499 | 61 (43.6%) | 13 (59.1%) |
| $1,500 to $1,999 | 13 (9.3%) | 3 (13.6%) |
| $2,000 to $2,499 | 3 (2.1%) | 6 (27.3%) |
| $2,500 to $2,999 | 2 (1.4%) | 0 (0.0%) |
| $3,000 or more | 14 (10.0%) | 0 (0.0%) |
| Total | 140 (100.0%) | 22 (100.0%) |
Physical Housing Characteristics in Coupland
Housing Structures in Coupland
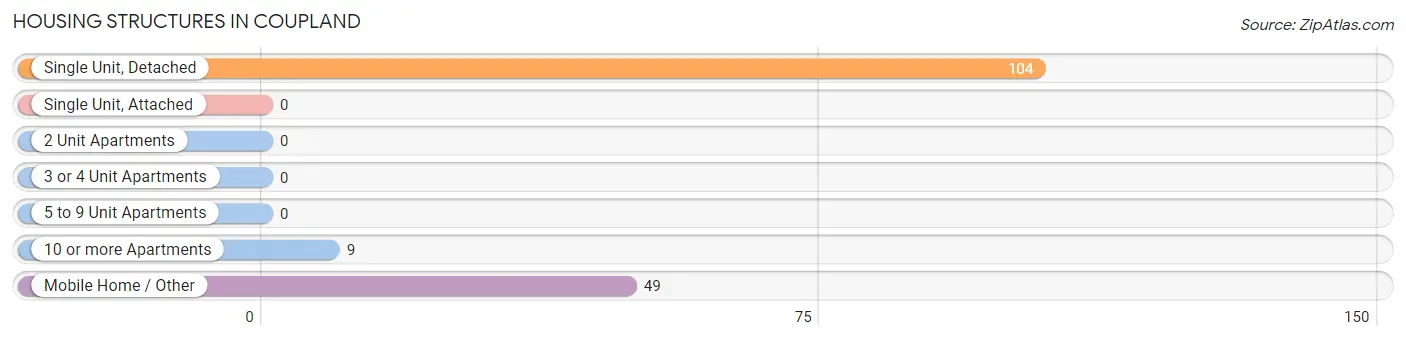
| Structure Type | # Housing Units | % Housing Units |
| Single Unit, Detached | 104 | 64.2% |
| Single Unit, Attached | 0 | 0.0% |
| 2 Unit Apartments | 0 | 0.0% |
| 3 or 4 Unit Apartments | 0 | 0.0% |
| 5 to 9 Unit Apartments | 0 | 0.0% |
| 10 or more Apartments | 9 | 5.6% |
| Mobile Home / Other | 49 | 30.2% |
| Total | 162 | 100.0% |
Housing Structures by Occupancy in Coupland
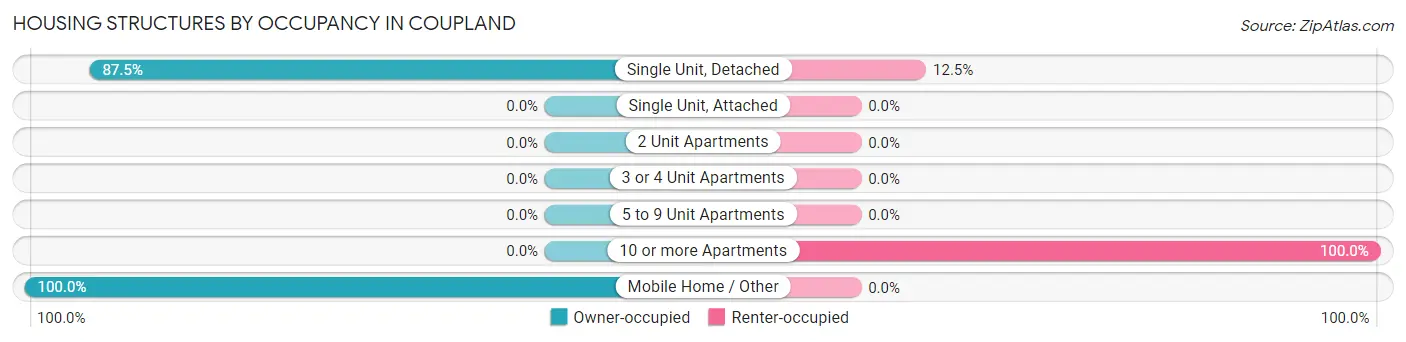
| Structure Type | Owner-occupied | Renter-occupied |
| Single Unit, Detached | 91 (87.5%) | 13 (12.5%) |
| Single Unit, Attached | 0 (0.0%) | 0 (0.0%) |
| 2 Unit Apartments | 0 (0.0%) | 0 (0.0%) |
| 3 or 4 Unit Apartments | 0 (0.0%) | 0 (0.0%) |
| 5 to 9 Unit Apartments | 0 (0.0%) | 0 (0.0%) |
| 10 or more Apartments | 0 (0.0%) | 9 (100.0%) |
| Mobile Home / Other | 49 (100.0%) | 0 (0.0%) |
| Total | 140 (86.4%) | 22 (13.6%) |
Housing Structures by Number of Rooms in Coupland
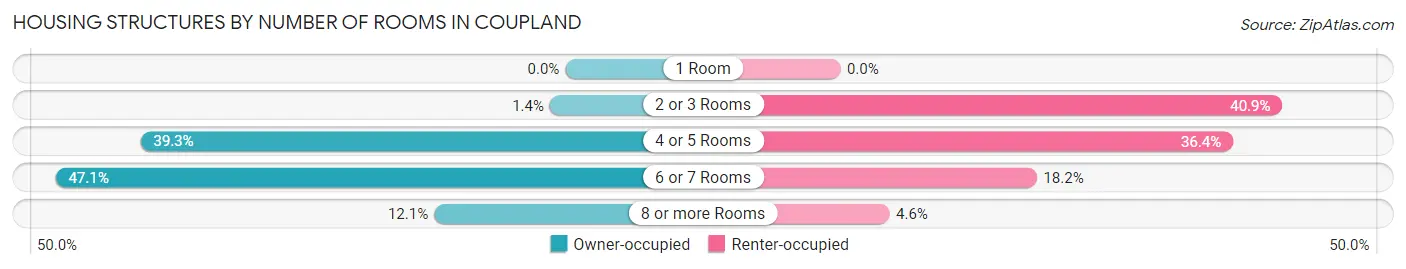
| Number of Rooms | Owner-occupied | Renter-occupied |
| 1 Room | 0 (0.0%) | 0 (0.0%) |
| 2 or 3 Rooms | 2 (1.4%) | 9 (40.9%) |
| 4 or 5 Rooms | 55 (39.3%) | 8 (36.4%) |
| 6 or 7 Rooms | 66 (47.1%) | 4 (18.2%) |
| 8 or more Rooms | 17 (12.1%) | 1 (4.5%) |
| Total | 140 (100.0%) | 22 (100.0%) |
Housing Structure by Heating Type in Coupland
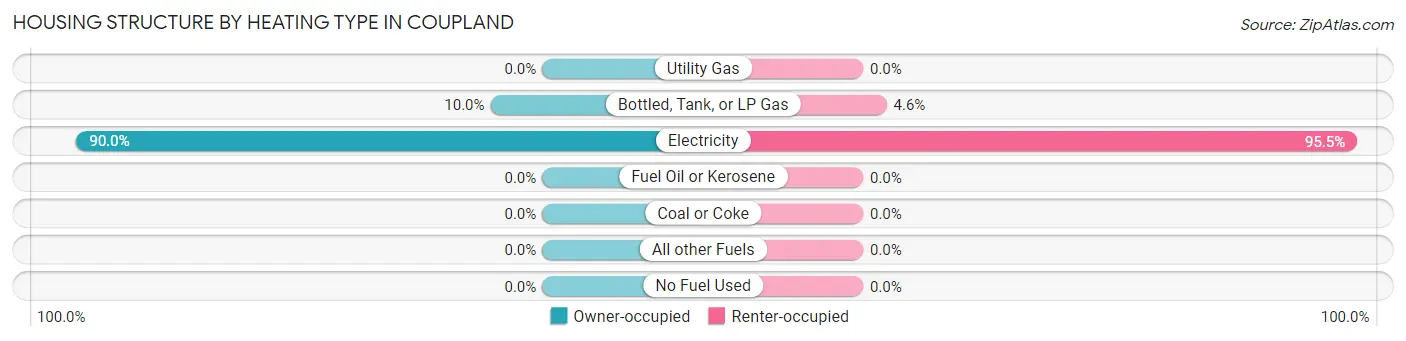
| Heating Type | Owner-occupied | Renter-occupied |
| Utility Gas | 0 (0.0%) | 0 (0.0%) |
| Bottled, Tank, or LP Gas | 14 (10.0%) | 1 (4.5%) |
| Electricity | 126 (90.0%) | 21 (95.5%) |
| Fuel Oil or Kerosene | 0 (0.0%) | 0 (0.0%) |
| Coal or Coke | 0 (0.0%) | 0 (0.0%) |
| All other Fuels | 0 (0.0%) | 0 (0.0%) |
| No Fuel Used | 0 (0.0%) | 0 (0.0%) |
| Total | 140 (100.0%) | 22 (100.0%) |
Household Vehicle Usage in Coupland
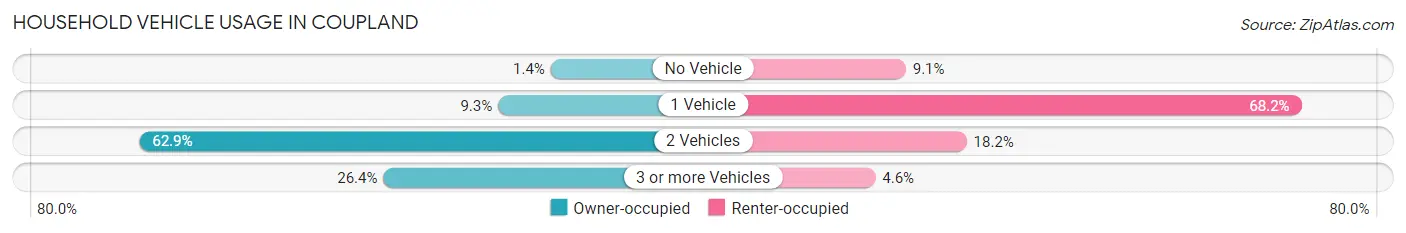
| Vehicles per Household | Owner-occupied | Renter-occupied |
| No Vehicle | 2 (1.4%) | 2 (9.1%) |
| 1 Vehicle | 13 (9.3%) | 15 (68.2%) |
| 2 Vehicles | 88 (62.9%) | 4 (18.2%) |
| 3 or more Vehicles | 37 (26.4%) | 1 (4.5%) |
| Total | 140 (100.0%) | 22 (100.0%) |
Real Estate & Mortgages in Coupland
Real Estate and Mortgage Overview in Coupland
| Characteristic | Without Mortgage | With Mortgage |
| Housing Units | 57 | 83 |
| Median Property Value | $236,700 | $0 |
| Median Household Income | - | - |
| Monthly Housing Costs | $475 | $14 |
| Real Estate Taxes | - | - |
Property Value by Mortgage Status in Coupland
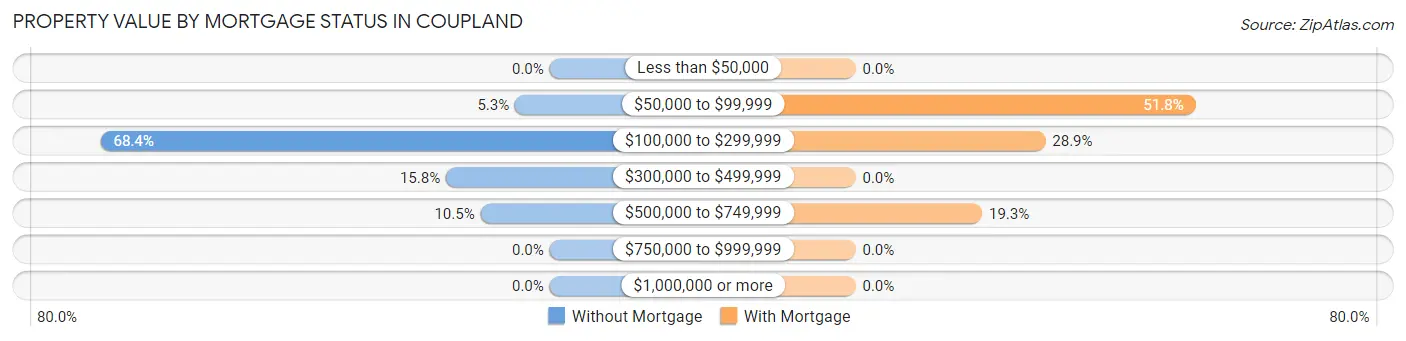
| Property Value | Without Mortgage | With Mortgage |
| Less than $50,000 | 0 (0.0%) | 0 (0.0%) |
| $50,000 to $99,999 | 3 (5.3%) | 43 (51.8%) |
| $100,000 to $299,999 | 39 (68.4%) | 24 (28.9%) |
| $300,000 to $499,999 | 9 (15.8%) | 0 (0.0%) |
| $500,000 to $749,999 | 6 (10.5%) | 16 (19.3%) |
| $750,000 to $999,999 | 0 (0.0%) | 0 (0.0%) |
| $1,000,000 or more | 0 (0.0%) | 0 (0.0%) |
| Total | 57 (100.0%) | 83 (100.0%) |
Household Income by Mortgage Status in Coupland
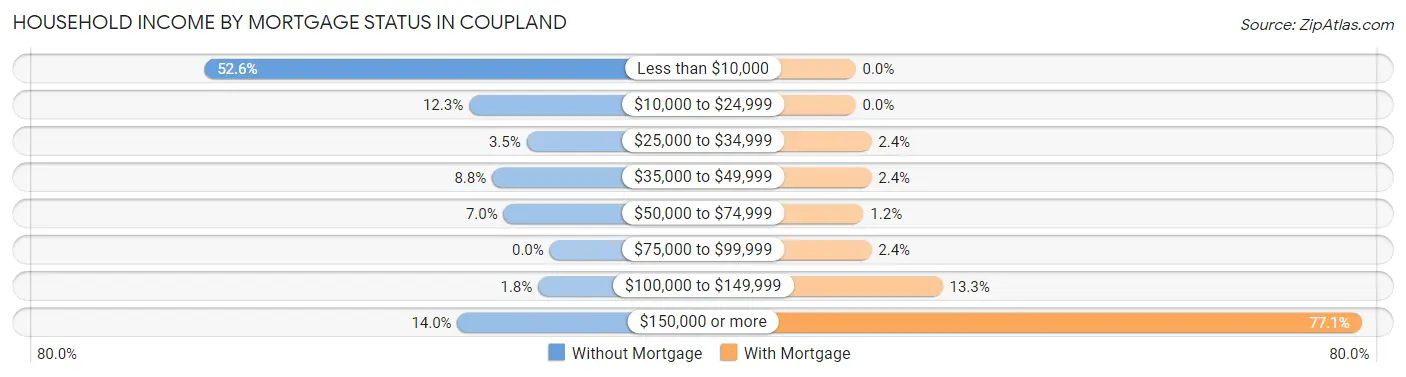
| Household Income | Without Mortgage | With Mortgage |
| Less than $10,000 | 30 (52.6%) | 0 (0.0%) |
| $10,000 to $24,999 | 7 (12.3%) | 0 (0.0%) |
| $25,000 to $34,999 | 2 (3.5%) | 2 (2.4%) |
| $35,000 to $49,999 | 5 (8.8%) | 2 (2.4%) |
| $50,000 to $74,999 | 4 (7.0%) | 1 (1.2%) |
| $75,000 to $99,999 | 0 (0.0%) | 2 (2.4%) |
| $100,000 to $149,999 | 1 (1.8%) | 11 (13.3%) |
| $150,000 or more | 8 (14.0%) | 64 (77.1%) |
| Total | 57 (100.0%) | 83 (100.0%) |
Property Value to Household Income Ratio in Coupland
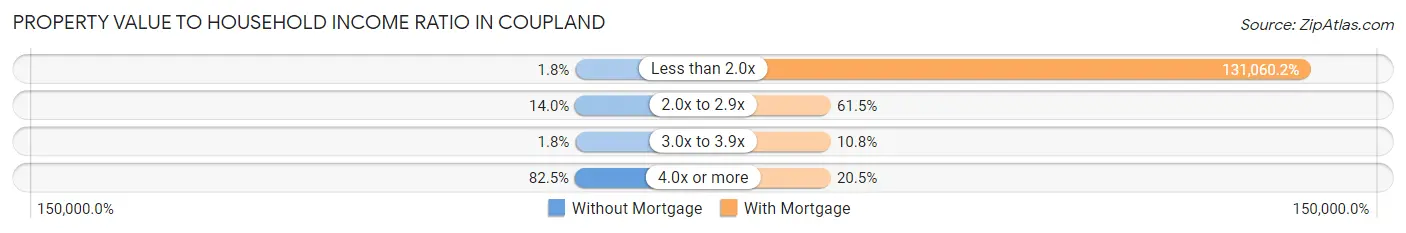
| Value-to-Income Ratio | Without Mortgage | With Mortgage |
| Less than 2.0x | 1 (1.8%) | 108,780 (131,060.2%) |
| 2.0x to 2.9x | 8 (14.0%) | 51 (61.5%) |
| 3.0x to 3.9x | 1 (1.8%) | 9 (10.8%) |
| 4.0x or more | 47 (82.5%) | 17 (20.5%) |
| Total | 57 (100.0%) | 83 (100.0%) |
Real Estate Taxes by Mortgage Status in Coupland
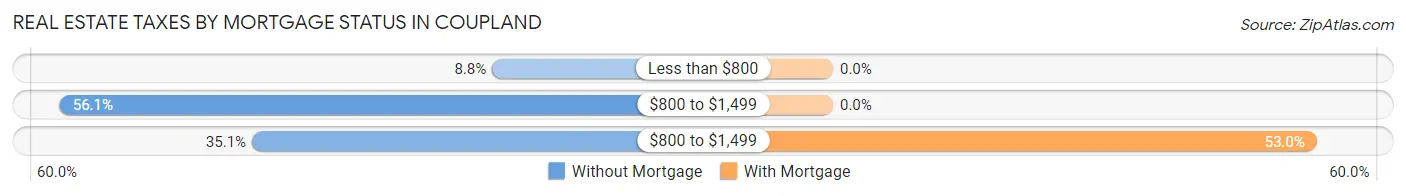
| Property Taxes | Without Mortgage | With Mortgage |
| Less than $800 | 5 (8.8%) | 0 (0.0%) |
| $800 to $1,499 | 32 (56.1%) | 0 (0.0%) |
| $800 to $1,499 | 20 (35.1%) | 44 (53.0%) |
| Total | 57 (100.0%) | 83 (100.0%) |
Health & Disability in Coupland
Health Insurance Coverage by Age in Coupland
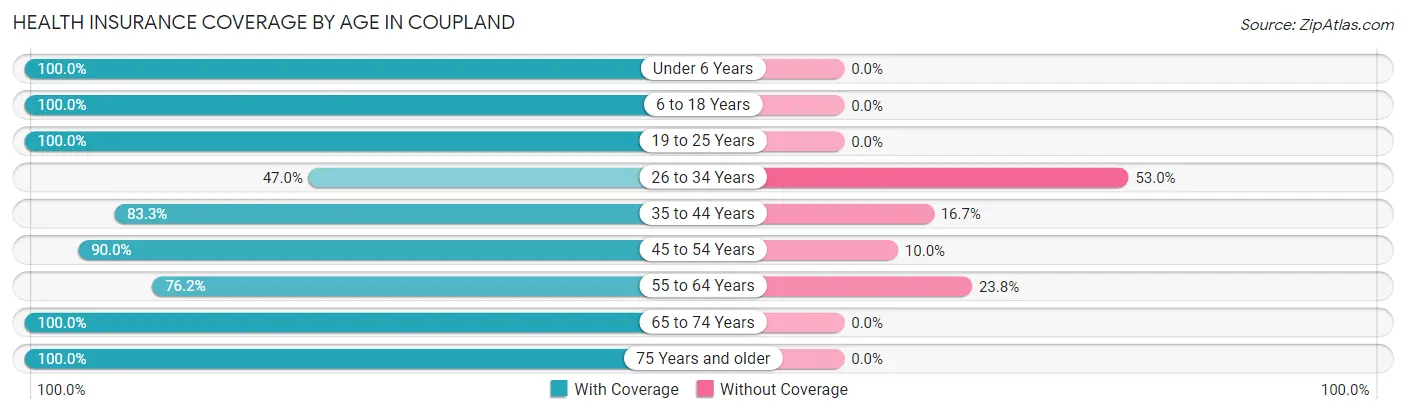
| Age Bracket | With Coverage | Without Coverage |
| Under 6 Years | 52 (100.0%) | 0 (0.0%) |
| 6 to 18 Years | 154 (100.0%) | 0 (0.0%) |
| 19 to 25 Years | 5 (100.0%) | 0 (0.0%) |
| 26 to 34 Years | 55 (47.0%) | 62 (53.0%) |
| 35 to 44 Years | 10 (83.3%) | 2 (16.7%) |
| 45 to 54 Years | 18 (90.0%) | 2 (10.0%) |
| 55 to 64 Years | 16 (76.2%) | 5 (23.8%) |
| 65 to 74 Years | 55 (100.0%) | 0 (0.0%) |
| 75 Years and older | 45 (100.0%) | 0 (0.0%) |
| Total | 410 (85.2%) | 71 (14.8%) |
Health Insurance Coverage by Citizenship Status in Coupland
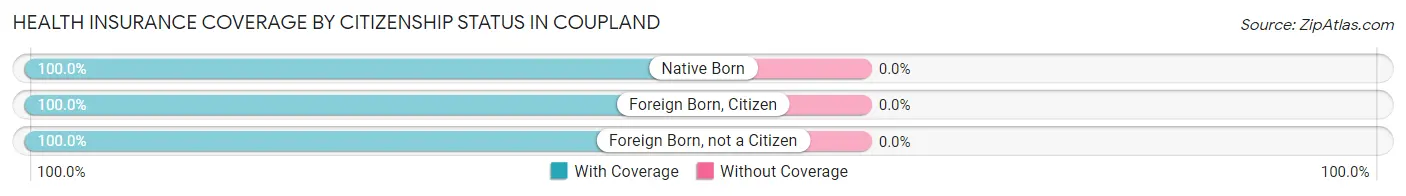
| Citizenship Status | With Coverage | Without Coverage |
| Native Born | 52 (100.0%) | 0 (0.0%) |
| Foreign Born, Citizen | 154 (100.0%) | 0 (0.0%) |
| Foreign Born, not a Citizen | 5 (100.0%) | 0 (0.0%) |
Health Insurance Coverage by Household Income in Coupland
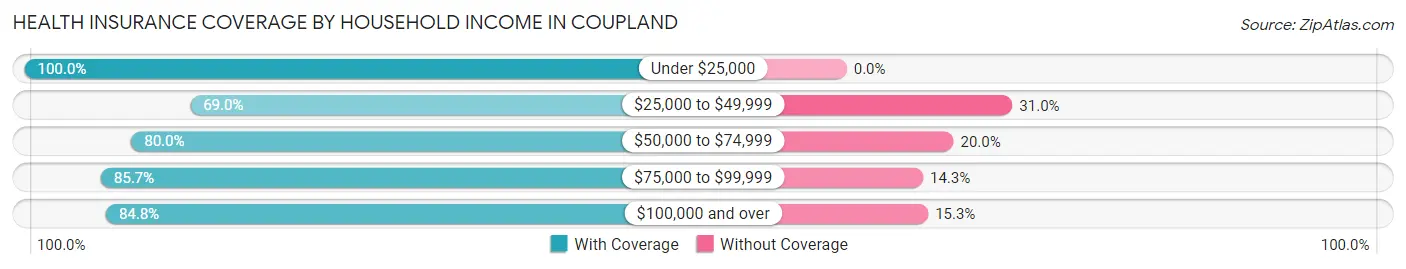
| Household Income | With Coverage | Without Coverage |
| Under $25,000 | 48 (100.0%) | 0 (0.0%) |
| $25,000 to $49,999 | 20 (69.0%) | 9 (31.0%) |
| $50,000 to $74,999 | 12 (80.0%) | 3 (20.0%) |
| $75,000 to $99,999 | 30 (85.7%) | 5 (14.3%) |
| $100,000 and over | 300 (84.8%) | 54 (15.2%) |
Public vs Private Health Insurance Coverage by Age in Coupland
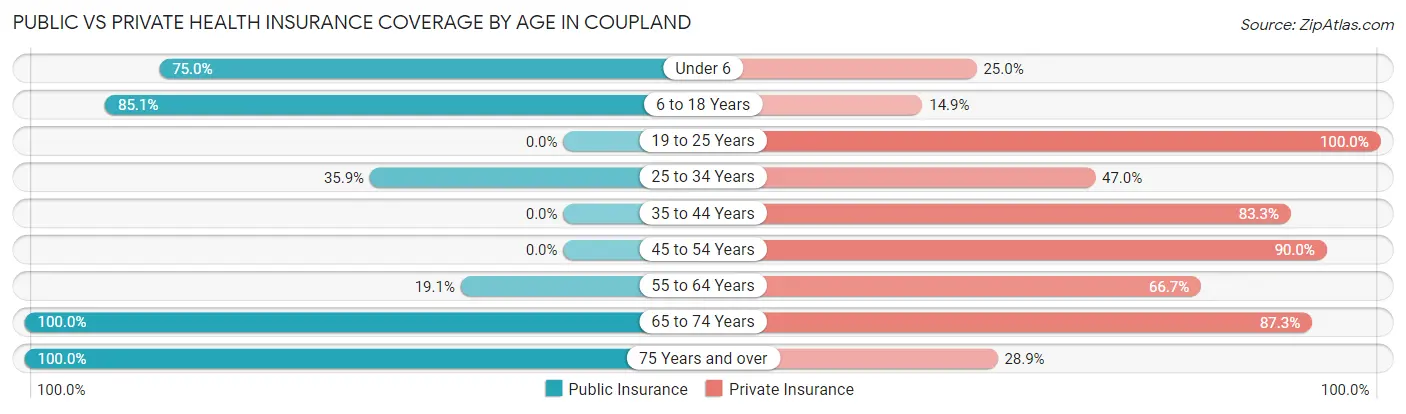
| Age Bracket | Public Insurance | Private Insurance |
| Under 6 | 39 (75.0%) | 13 (25.0%) |
| 6 to 18 Years | 131 (85.1%) | 23 (14.9%) |
| 19 to 25 Years | 0 (0.0%) | 5 (100.0%) |
| 25 to 34 Years | 42 (35.9%) | 55 (47.0%) |
| 35 to 44 Years | 0 (0.0%) | 10 (83.3%) |
| 45 to 54 Years | 0 (0.0%) | 18 (90.0%) |
| 55 to 64 Years | 4 (19.1%) | 14 (66.7%) |
| 65 to 74 Years | 55 (100.0%) | 48 (87.3%) |
| 75 Years and over | 45 (100.0%) | 13 (28.9%) |
| Total | 316 (65.7%) | 199 (41.4%) |
Disability Status by Sex by Age in Coupland
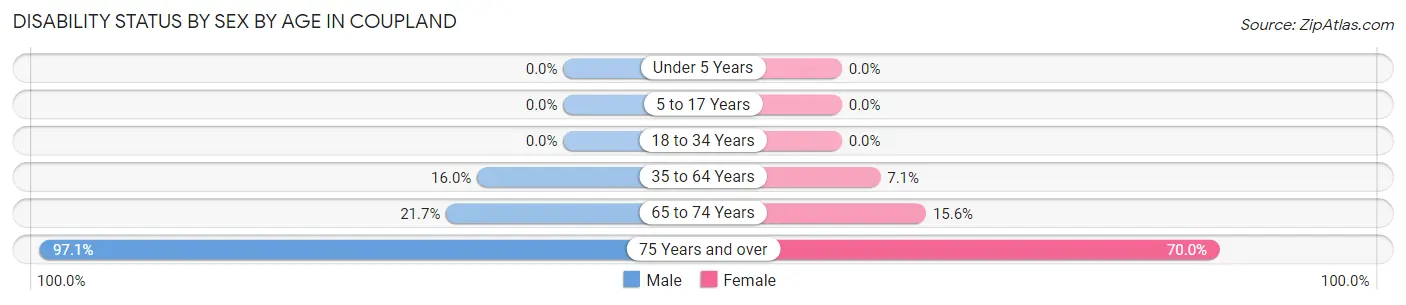
| Age Bracket | Male | Female |
| Under 5 Years | 0 (0.0%) | 0 (0.0%) |
| 5 to 17 Years | 0 (0.0%) | 0 (0.0%) |
| 18 to 34 Years | 0 (0.0%) | 0 (0.0%) |
| 35 to 64 Years | 4 (16.0%) | 2 (7.1%) |
| 65 to 74 Years | 5 (21.7%) | 5 (15.6%) |
| 75 Years and over | 34 (97.1%) | 7 (70.0%) |
Disability Class by Sex by Age in Coupland
Disability Class: Hearing Difficulty
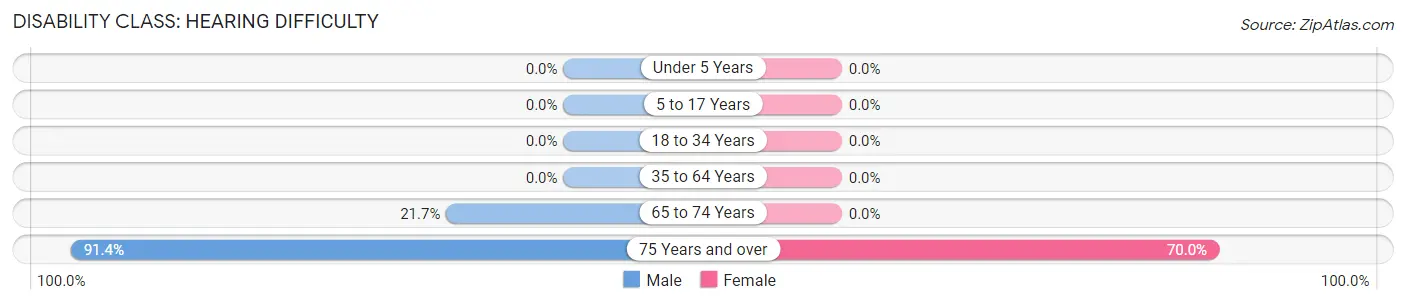
| Age Bracket | Male | Female |
| Under 5 Years | 0 (0.0%) | 0 (0.0%) |
| 5 to 17 Years | 0 (0.0%) | 0 (0.0%) |
| 18 to 34 Years | 0 (0.0%) | 0 (0.0%) |
| 35 to 64 Years | 0 (0.0%) | 0 (0.0%) |
| 65 to 74 Years | 5 (21.7%) | 0 (0.0%) |
| 75 Years and over | 32 (91.4%) | 7 (70.0%) |
Disability Class: Vision Difficulty
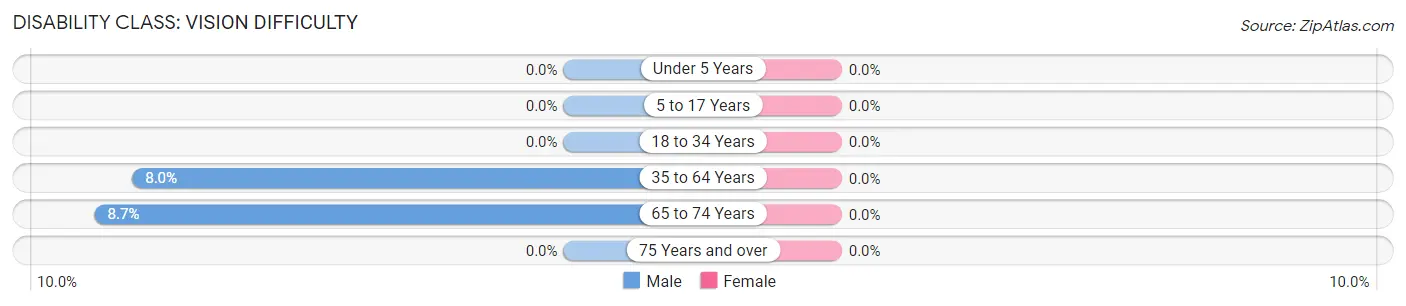
| Age Bracket | Male | Female |
| Under 5 Years | 0 (0.0%) | 0 (0.0%) |
| 5 to 17 Years | 0 (0.0%) | 0 (0.0%) |
| 18 to 34 Years | 0 (0.0%) | 0 (0.0%) |
| 35 to 64 Years | 2 (8.0%) | 0 (0.0%) |
| 65 to 74 Years | 2 (8.7%) | 0 (0.0%) |
| 75 Years and over | 0 (0.0%) | 0 (0.0%) |
Disability Class: Cognitive Difficulty
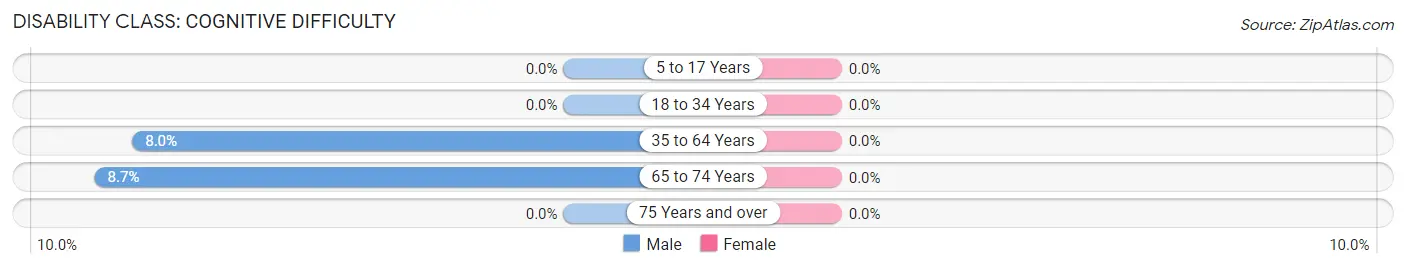
| Age Bracket | Male | Female |
| 5 to 17 Years | 0 (0.0%) | 0 (0.0%) |
| 18 to 34 Years | 0 (0.0%) | 0 (0.0%) |
| 35 to 64 Years | 2 (8.0%) | 0 (0.0%) |
| 65 to 74 Years | 2 (8.7%) | 0 (0.0%) |
| 75 Years and over | 0 (0.0%) | 0 (0.0%) |
Disability Class: Ambulatory Difficulty
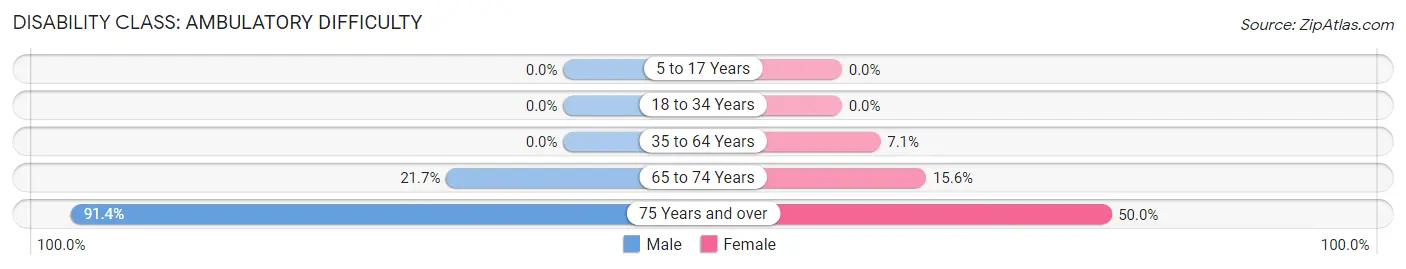
| Age Bracket | Male | Female |
| 5 to 17 Years | 0 (0.0%) | 0 (0.0%) |
| 18 to 34 Years | 0 (0.0%) | 0 (0.0%) |
| 35 to 64 Years | 0 (0.0%) | 2 (7.1%) |
| 65 to 74 Years | 5 (21.7%) | 5 (15.6%) |
| 75 Years and over | 32 (91.4%) | 5 (50.0%) |
Disability Class: Self-Care Difficulty
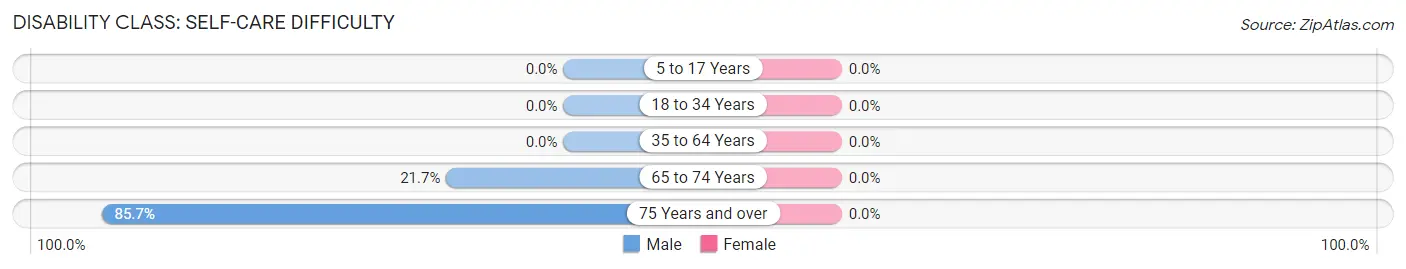
| Age Bracket | Male | Female |
| 5 to 17 Years | 0 (0.0%) | 0 (0.0%) |
| 18 to 34 Years | 0 (0.0%) | 0 (0.0%) |
| 35 to 64 Years | 0 (0.0%) | 0 (0.0%) |
| 65 to 74 Years | 5 (21.7%) | 0 (0.0%) |
| 75 Years and over | 30 (85.7%) | 0 (0.0%) |
Technology Access in Coupland
Computing Device Access in Coupland
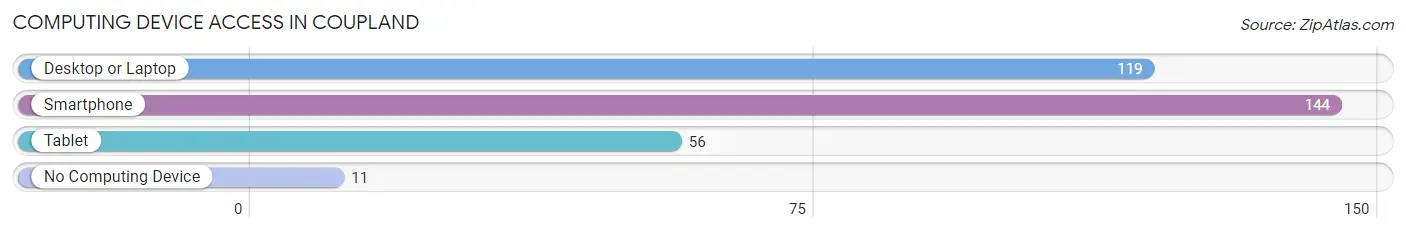
| Device Type | # Households | % Households |
| Desktop or Laptop | 119 | 73.5% |
| Smartphone | 144 | 88.9% |
| Tablet | 56 | 34.6% |
| No Computing Device | 11 | 6.8% |
| Total | 162 | 100.0% |
Internet Access in Coupland
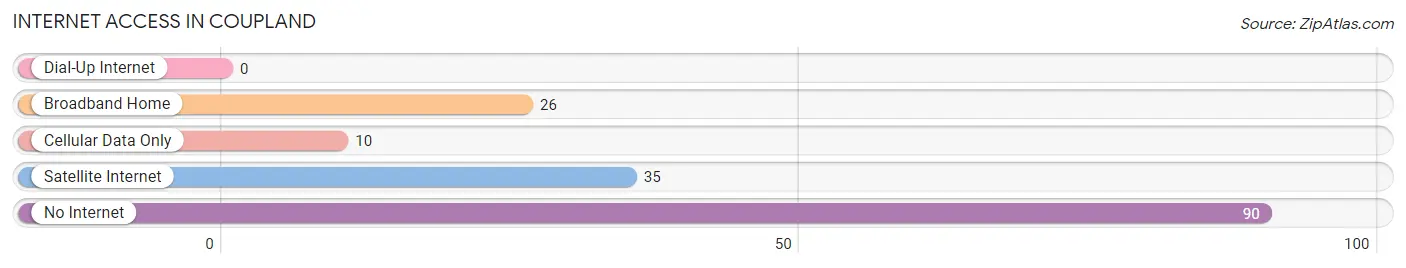
| Internet Type | # Households | % Households |
| Dial-Up Internet | 0 | 0.0% |
| Broadband Home | 26 | 16.1% |
| Cellular Data Only | 10 | 6.2% |
| Satellite Internet | 35 | 21.6% |
| No Internet | 90 | 55.6% |
| Total | 162 | 100.0% |
Coupland Summary
Coupland is a small town located in Williamson County, Texas, United States. It is situated about 25 miles northeast of Austin and is part of the Austin–Round Rock–San Marcos metropolitan area. The population of Coupland was estimated to be 545 in 2019.
History
Coupland was founded in 1882 by a group of German immigrants led by John Coupland. The town was named after him and was originally known as Coupland Station. The town was incorporated in 1891 and was the first incorporated town in Williamson County.
The town was a major stop on the International-Great Northern Railroad, which connected Austin to Houston. The railroad was a major factor in the growth of the town, as it allowed for the transportation of goods and people.
Geography
Coupland is located at 30°31'25"N 97°25'45"W (30.523607, -97.429097). It is situated in the rolling hills of Central Texas, about 25 miles northeast of Austin. The town is located in the Blackland Prairie region of Texas, which is characterized by its fertile soil and flat terrain.
The climate in Coupland is humid subtropical, with hot summers and mild winters. The average annual temperature is 68°F (20°C). The average annual precipitation is 33 inches (84 cm).
Economy
The economy of Coupland is largely based on agriculture. The town is home to several farms, which produce a variety of crops, including cotton, corn, wheat, and hay. The town is also home to several businesses, including a feed store, a hardware store, and a restaurant.
Demographics
As of the 2010 census, the population of Coupland was 545. The racial makeup of the town was 94.2% White, 0.2% African American, 0.2% Native American, 0.2% Asian, 0.2% Pacific Islander, 3.3% from other races, and 1.8% from two or more races. Hispanic or Latino of any race were 8.2% of the population.
The median household income in Coupland was $45,000, and the median family income was $50,000. The per capita income was $20,000. About 10.3% of the population was below the poverty line.
Conclusion
Coupland is a small town located in Williamson County, Texas, United States. It was founded in 1882 by a group of German immigrants and was the first incorporated town in Williamson County. The town is situated in the rolling hills of Central Texas, about 25 miles northeast of Austin. The economy of Coupland is largely based on agriculture, and the town is home to several businesses. The population of Coupland was estimated to be 545 in 2019.
Common Questions
What is Per Capita Income in Coupland?
Per Capita income in Coupland is $26,698.
What is the Median Family Income in Coupland?
Median Family Income in Coupland is $108,780.
What is the Median Household income in Coupland?
Median Household Income in Coupland is $83,750.
What is Income or Wage Gap in Coupland?
Income or Wage Gap in Coupland is 39.5%.
Women in Coupland earn 60.5 cents for every dollar earned by a man.
What is Inequality or Gini Index in Coupland?
Inequality or Gini Index in Coupland is 0.42.
What is the Total Population of Coupland?
Total Population of Coupland is 481.
What is the Total Male Population of Coupland?
Total Male Population of Coupland is 216.
What is the Total Female Population of Coupland?
Total Female Population of Coupland is 265.
What is the Ratio of Males per 100 Females in Coupland?
There are 81.51 Males per 100 Females in Coupland.
What is the Ratio of Females per 100 Males in Coupland?
There are 122.69 Females per 100 Males in Coupland.
What is the Median Population Age in Coupland?
Median Population Age in Coupland is 30.5 Years.
What is the Average Family Size in Coupland
Average Family Size in Coupland is 4.2 People.
What is the Average Household Size in Coupland
Average Household Size in Coupland is 3.0 People.
How Large is the Labor Force in Coupland?
There are 169 People in the Labor Forcein in Coupland.
What is the Percentage of People in the Labor Force in Coupland?
60.4% of People are in the Labor Force in Coupland.
What is the Unemployment Rate in Coupland?
Unemployment Rate in Coupland is 0.6%.