Santa Rosa, TX Map & Demographics
Santa Rosa Map
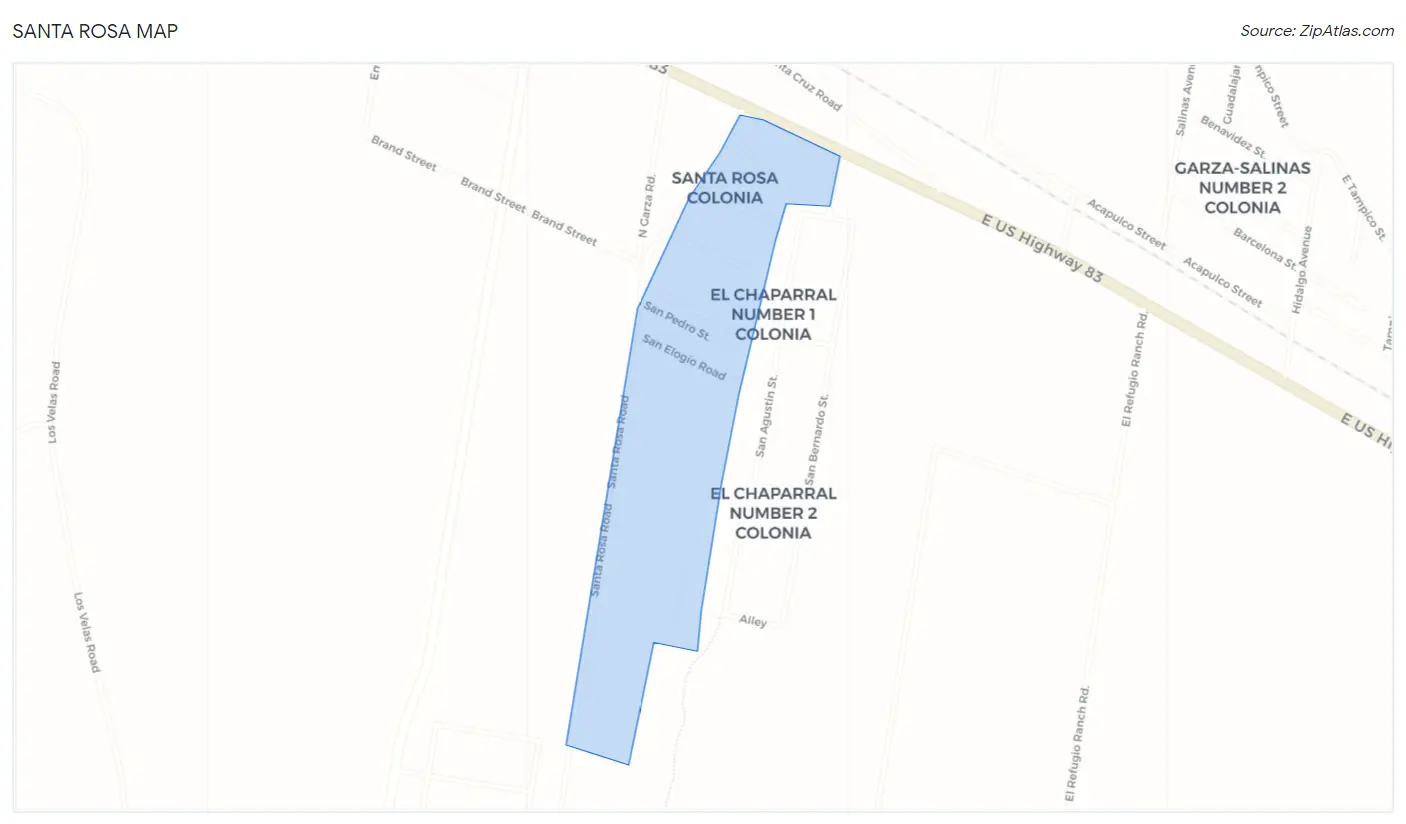
Santa Rosa Overview
$14,215
PER CAPITA INCOME
$39,044
AVG FAMILY INCOME
$39,412
AVG HOUSEHOLD INCOME
48.8%
WAGE / INCOME GAP [ % ]
51.2¢/ $1
WAGE / INCOME GAP [ $ ]
0.30
INEQUALITY / GINI INDEX
386
TOTAL POPULATION
116
MALE POPULATION
270
FEMALE POPULATION
42.96
MALES / 100 FEMALES
232.76
FEMALES / 100 MALES
35.5
MEDIAN AGE
4.7
AVG FAMILY SIZE
3.6
AVG HOUSEHOLD SIZE
199
LABOR FORCE [ PEOPLE ]
69.1%
PERCENT IN LABOR FORCE
Santa Rosa Zip Codes
Santa Rosa Area Codes
Income in Santa Rosa
Income Overview in Santa Rosa
Per Capita Income in Santa Rosa is $14,215, while median incomes of families and households are $39,044 and $39,412 respectively.
| Characteristic | Number | Measure |
| Per Capita Income | 386 | $14,215 |
| Median Family Income | 75 | $39,044 |
| Mean Family Income | 75 | $40,525 |
| Median Household Income | 108 | $39,412 |
| Mean Household Income | 108 | $43,799 |
| Income Deficit | 75 | $0 |
| Wage / Income Gap (%) | 386 | 48.78% |
| Wage / Income Gap ($) | 386 | 51.22¢ per $1 |
| Gini / Inequality Index | 386 | 0.30 |
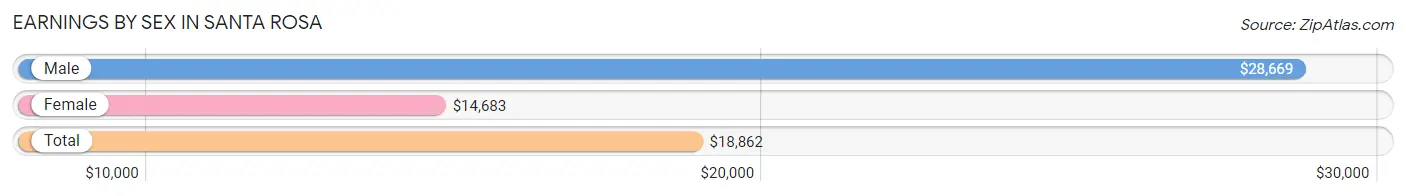
Earnings by Sex in Santa Rosa
Average Earnings in Santa Rosa are $18,862, $28,669 for men and $14,683 for women, a difference of 48.8%.
| Sex | Number | Average Earnings |
| Male | 62 (30.4%) | $28,669 |
| Female | 142 (69.6%) | $14,683 |
| Total | 204 (100.0%) | $18,862 |
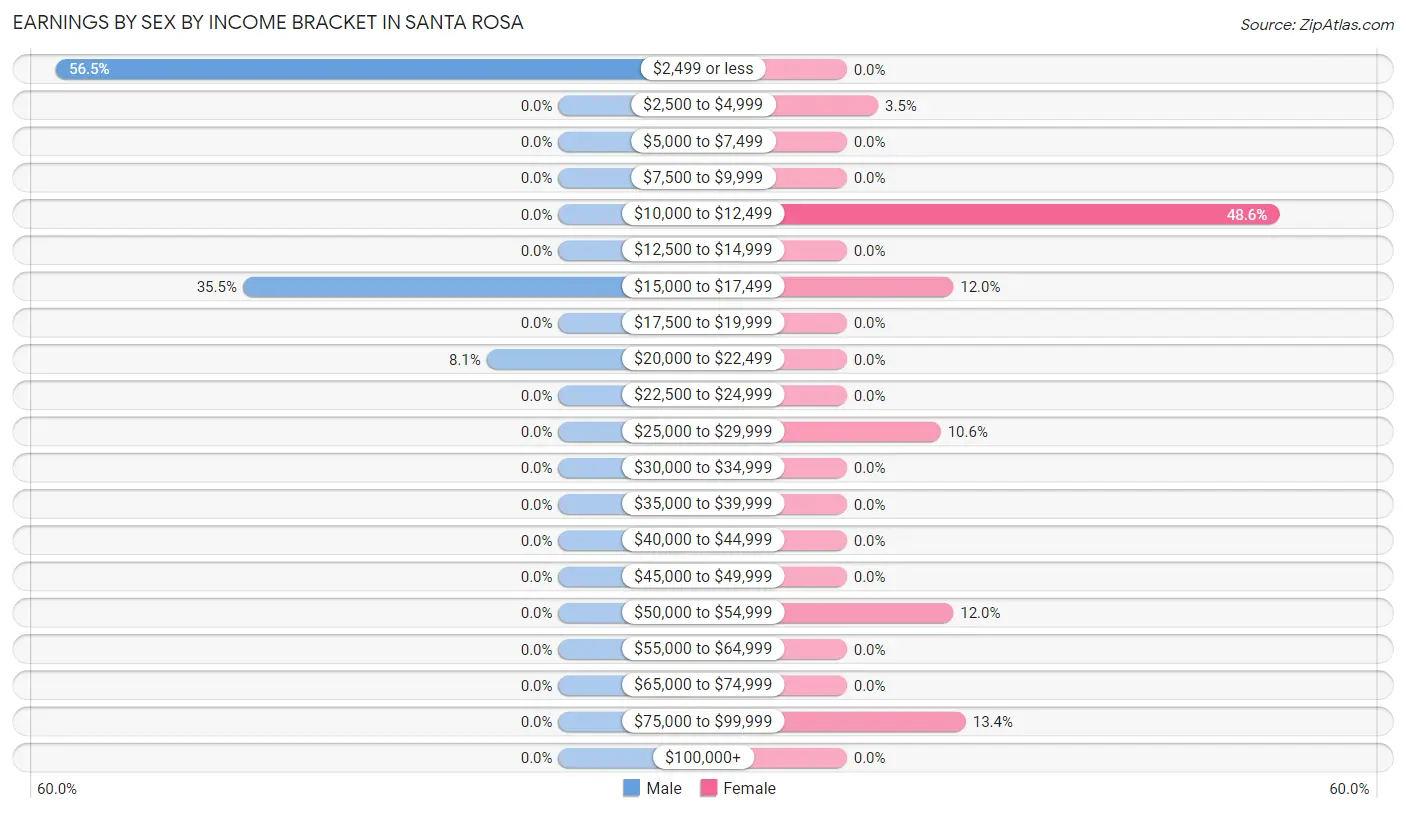
Earnings by Sex by Income Bracket in Santa Rosa
The most common earnings brackets in Santa Rosa are $2,499 or less for men (35 | 56.5%) and $10,000 to $12,499 for women (69 | 48.6%).
| Income | Male | Female |
| $2,499 or less | 35 (56.5%) | 0 (0.0%) |
| $2,500 to $4,999 | 0 (0.0%) | 5 (3.5%) |
| $5,000 to $7,499 | 0 (0.0%) | 0 (0.0%) |
| $7,500 to $9,999 | 0 (0.0%) | 0 (0.0%) |
| $10,000 to $12,499 | 0 (0.0%) | 69 (48.6%) |
| $12,500 to $14,999 | 0 (0.0%) | 0 (0.0%) |
| $15,000 to $17,499 | 22 (35.5%) | 17 (12.0%) |
| $17,500 to $19,999 | 0 (0.0%) | 0 (0.0%) |
| $20,000 to $22,499 | 5 (8.1%) | 0 (0.0%) |
| $22,500 to $24,999 | 0 (0.0%) | 0 (0.0%) |
| $25,000 to $29,999 | 0 (0.0%) | 15 (10.6%) |
| $30,000 to $34,999 | 0 (0.0%) | 0 (0.0%) |
| $35,000 to $39,999 | 0 (0.0%) | 0 (0.0%) |
| $40,000 to $44,999 | 0 (0.0%) | 0 (0.0%) |
| $45,000 to $49,999 | 0 (0.0%) | 0 (0.0%) |
| $50,000 to $54,999 | 0 (0.0%) | 17 (12.0%) |
| $55,000 to $64,999 | 0 (0.0%) | 0 (0.0%) |
| $65,000 to $74,999 | 0 (0.0%) | 0 (0.0%) |
| $75,000 to $99,999 | 0 (0.0%) | 19 (13.4%) |
| $100,000+ | 0 (0.0%) | 0 (0.0%) |
| Total | 62 (100.0%) | 142 (100.0%) |
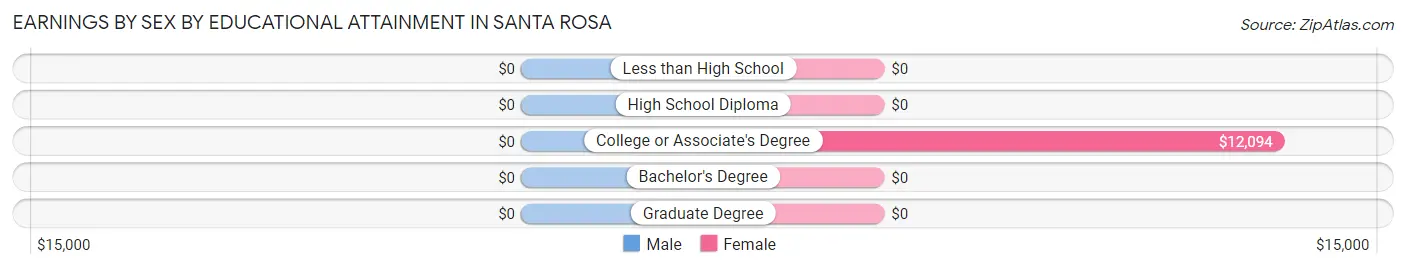
Earnings by Sex by Educational Attainment in Santa Rosa
| Educational Attainment | Male Income | Female Income |
| Less than High School | - | - |
| High School Diploma | - | - |
| College or Associate's Degree | - | - |
| Bachelor's Degree | - | - |
| Graduate Degree | - | - |
| Total | - | - |
Family Income in Santa Rosa
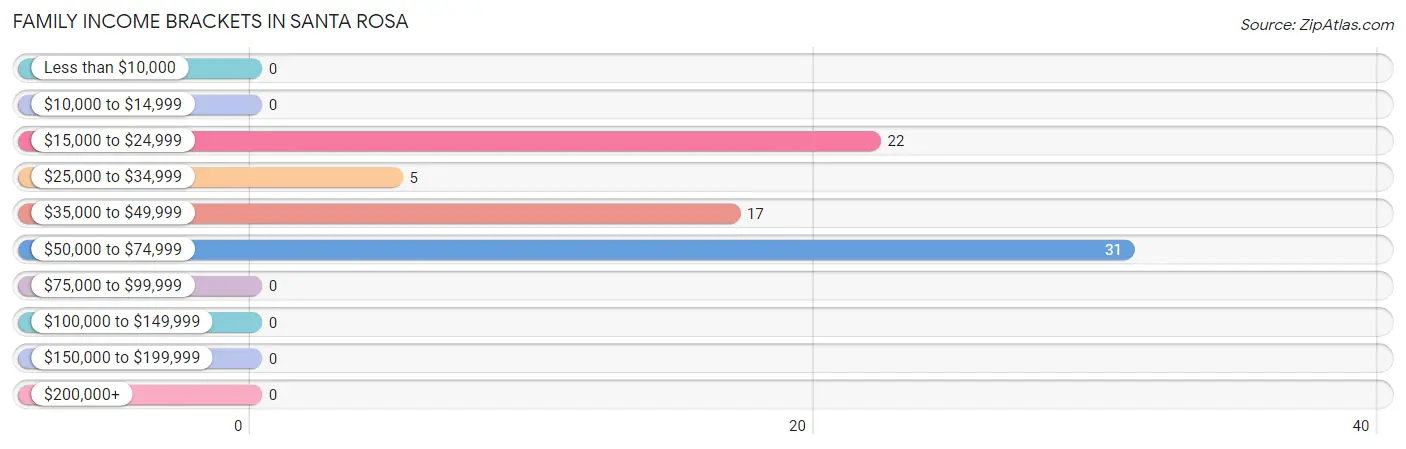
Family Income Brackets in Santa Rosa
According to the Santa Rosa family income data, there are 31 families falling into the $50,000 to $74,999 income range, which is the most common income bracket and makes up 41.3% of all families.
| Income Bracket | # Families | % Families |
| Less than $10,000 | 0 | 0.0% |
| $10,000 to $14,999 | 0 | 0.0% |
| $15,000 to $24,999 | 22 | 29.3% |
| $25,000 to $34,999 | 5 | 6.7% |
| $35,000 to $49,999 | 17 | 22.7% |
| $50,000 to $74,999 | 31 | 41.3% |
| $75,000 to $99,999 | 0 | 0.0% |
| $100,000 to $149,999 | 0 | 0.0% |
| $150,000 to $199,999 | 0 | 0.0% |
| $200,000+ | 0 | 0.0% |
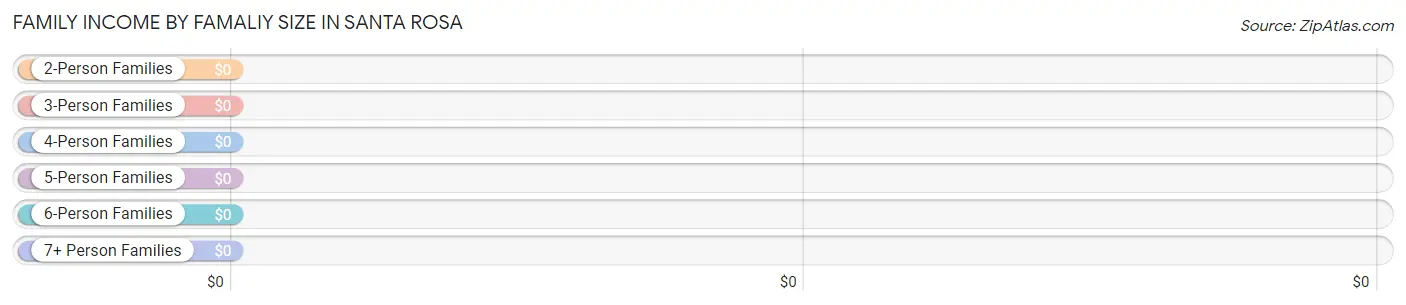
Family Income by Famaliy Size in Santa Rosa
| Income Bracket | # Families | Median Income |
| 2-Person Families | 22 (29.3%) | $0 |
| 3-Person Families | 8 (10.7%) | $0 |
| 4-Person Families | 23 (30.7%) | $0 |
| 5-Person Families | 22 (29.3%) | $0 |
| 6-Person Families | 0 (0.0%) | $0 |
| 7+ Person Families | 0 (0.0%) | $0 |
| Total | 75 (100.0%) | $39,044 |
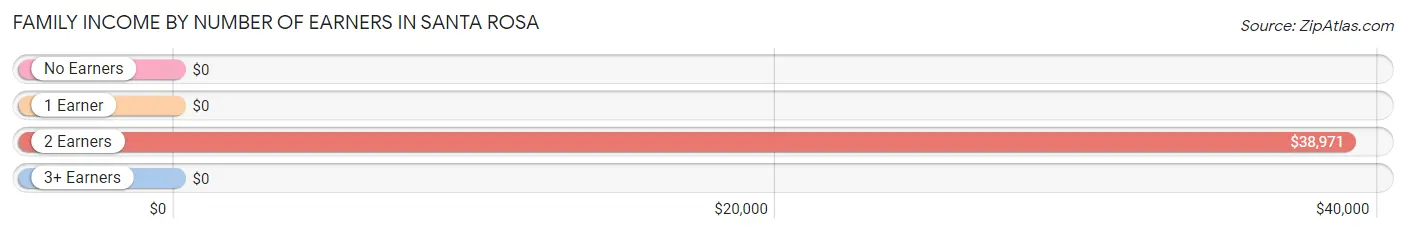
Family Income by Number of Earners in Santa Rosa
| Number of Earners | # Families | Median Income |
| No Earners | 6 (8.0%) | $0 |
| 1 Earner | 5 (6.7%) | $0 |
| 2 Earners | 64 (85.3%) | $38,971 |
| 3+ Earners | 0 (0.0%) | $0 |
| Total | 75 (100.0%) | $39,044 |
Household Income in Santa Rosa
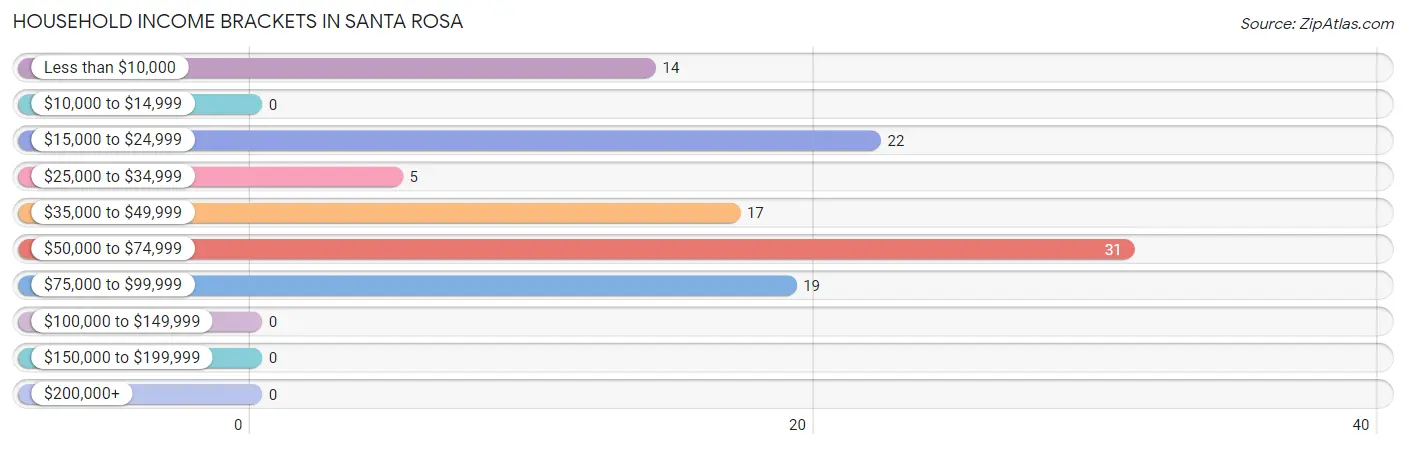
Household Income Brackets in Santa Rosa
With 31 households falling in the category, the $50,000 to $74,999 income range is the most frequent in Santa Rosa, accounting for 28.7% of all households.
| Income Bracket | # Households | % Households |
| Less than $10,000 | 14 | 13.0% |
| $10,000 to $14,999 | 0 | 0.0% |
| $15,000 to $24,999 | 22 | 20.4% |
| $25,000 to $34,999 | 5 | 4.6% |
| $35,000 to $49,999 | 17 | 15.7% |
| $50,000 to $74,999 | 31 | 28.7% |
| $75,000 to $99,999 | 19 | 17.6% |
| $100,000 to $149,999 | 0 | 0.0% |
| $150,000 to $199,999 | 0 | 0.0% |
| $200,000+ | 0 | 0.0% |
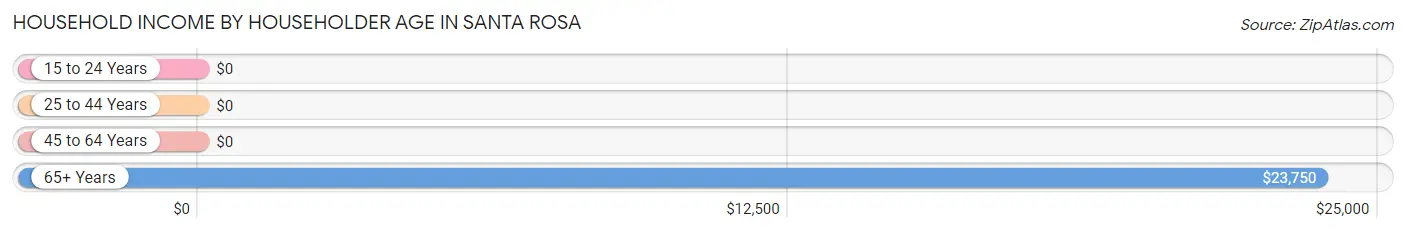
Household Income by Householder Age in Santa Rosa
The median household income in Santa Rosa is $39,412, with the highest median household income of $23,750 found in the 65+ years age bracket for the primary householder. A total of 50 households (46.3%) fall into this category.
| Income Bracket | # Households | Median Income |
| 15 to 24 Years | 0 (0.0%) | $0 |
| 25 to 44 Years | 36 (33.3%) | $0 |
| 45 to 64 Years | 22 (20.4%) | $0 |
| 65+ Years | 50 (46.3%) | $23,750 |
| Total | 108 (100.0%) | $39,412 |
Poverty in Santa Rosa
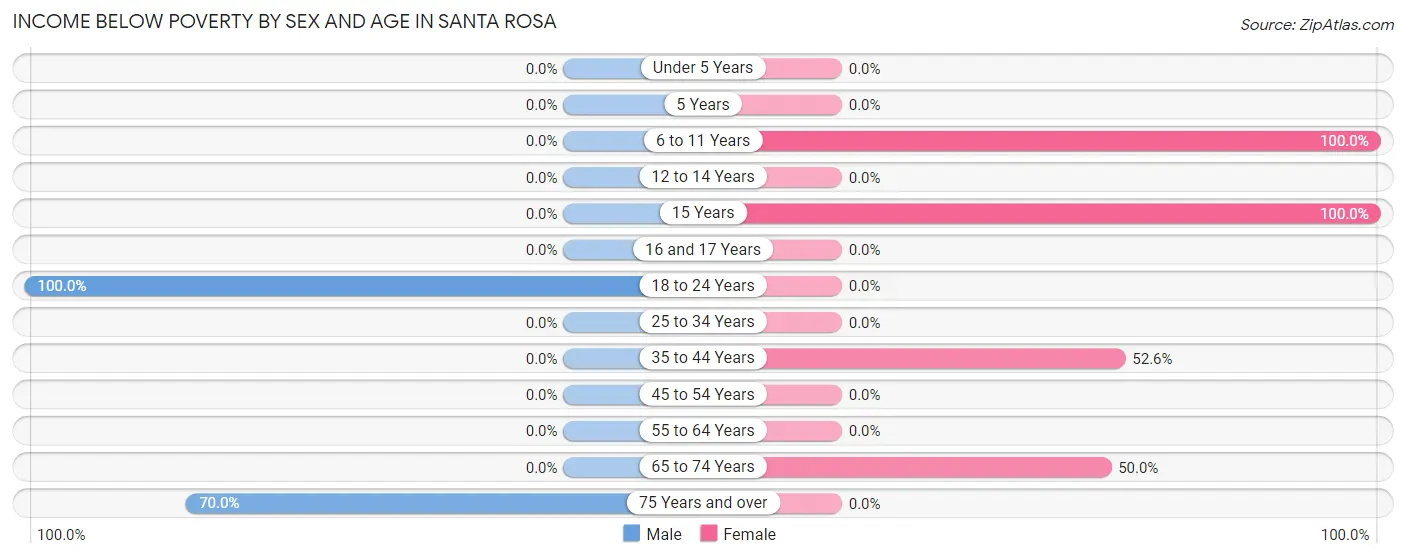
Income Below Poverty by Sex and Age in Santa Rosa
With 42.2% poverty level for males and 46.7% for females among the residents of Santa Rosa, 18 to 24 year old males and 6 to 11 year old females are the most vulnerable to poverty, with 35 males (100.0%) and 36 females (100.0%) in their respective age groups living below the poverty level.
| Age Bracket | Male | Female |
| Under 5 Years | 0 (0.0%) | 0 (0.0%) |
| 5 Years | 0 (0.0%) | 0 (0.0%) |
| 6 to 11 Years | 0 (0.0%) | 36 (100.0%) |
| 12 to 14 Years | 0 (0.0%) | 0 (0.0%) |
| 15 Years | 0 (0.0%) | 28 (100.0%) |
| 16 and 17 Years | 0 (0.0%) | 0 (0.0%) |
| 18 to 24 Years | 35 (100.0%) | 0 (0.0%) |
| 25 to 34 Years | 0 (0.0%) | 0 (0.0%) |
| 35 to 44 Years | 0 (0.0%) | 40 (52.6%) |
| 45 to 54 Years | 0 (0.0%) | 0 (0.0%) |
| 55 to 64 Years | 0 (0.0%) | 0 (0.0%) |
| 65 to 74 Years | 0 (0.0%) | 22 (50.0%) |
| 75 Years and over | 14 (70.0%) | 0 (0.0%) |
| Total | 49 (42.2%) | 126 (46.7%) |
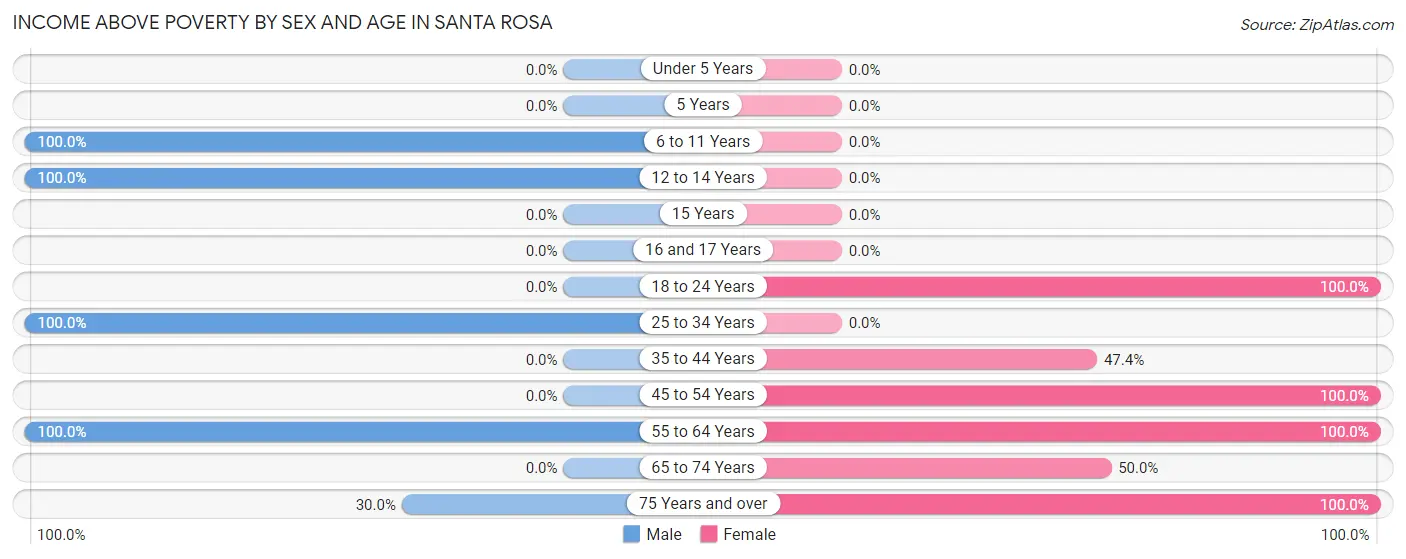
Income Above Poverty by Sex and Age in Santa Rosa
According to the poverty statistics in Santa Rosa, males aged 6 to 11 years and females aged 18 to 24 years are the age groups that are most secure financially, with 100.0% of males and 100.0% of females in these age groups living above the poverty line.
| Age Bracket | Male | Female |
| Under 5 Years | 0 (0.0%) | 0 (0.0%) |
| 5 Years | 0 (0.0%) | 0 (0.0%) |
| 6 to 11 Years | 25 (100.0%) | 0 (0.0%) |
| 12 to 14 Years | 9 (100.0%) | 0 (0.0%) |
| 15 Years | 0 (0.0%) | 0 (0.0%) |
| 16 and 17 Years | 0 (0.0%) | 0 (0.0%) |
| 18 to 24 Years | 0 (0.0%) | 29 (100.0%) |
| 25 to 34 Years | 22 (100.0%) | 0 (0.0%) |
| 35 to 44 Years | 0 (0.0%) | 36 (47.4%) |
| 45 to 54 Years | 0 (0.0%) | 40 (100.0%) |
| 55 to 64 Years | 5 (100.0%) | 9 (100.0%) |
| 65 to 74 Years | 0 (0.0%) | 22 (50.0%) |
| 75 Years and over | 6 (30.0%) | 8 (100.0%) |
| Total | 67 (57.8%) | 144 (53.3%) |
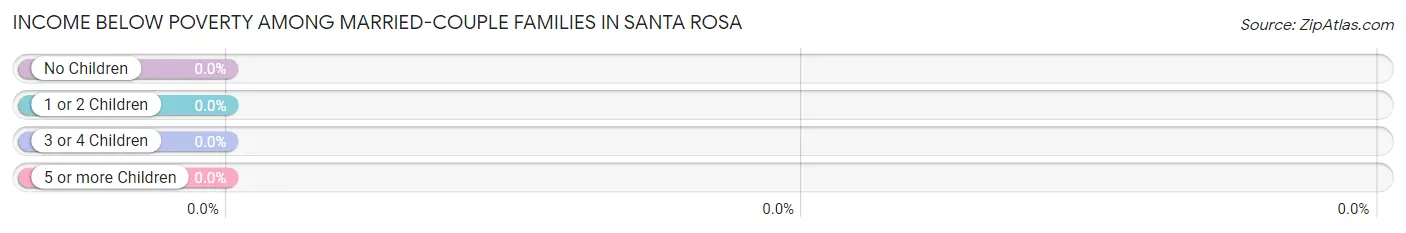
Income Below Poverty Among Married-Couple Families in Santa Rosa
| Children | Above Poverty | Below Poverty |
| No Children | 5 (100.0%) | 0 (0.0%) |
| 1 or 2 Children | 6 (100.0%) | 0 (0.0%) |
| 3 or 4 Children | 0 (0.0%) | 0 (0.0%) |
| 5 or more Children | 0 (0.0%) | 0 (0.0%) |
| Total | 11 (100.0%) | 0 (0.0%) |
Income Below Poverty Among Single-Parent Households in Santa Rosa
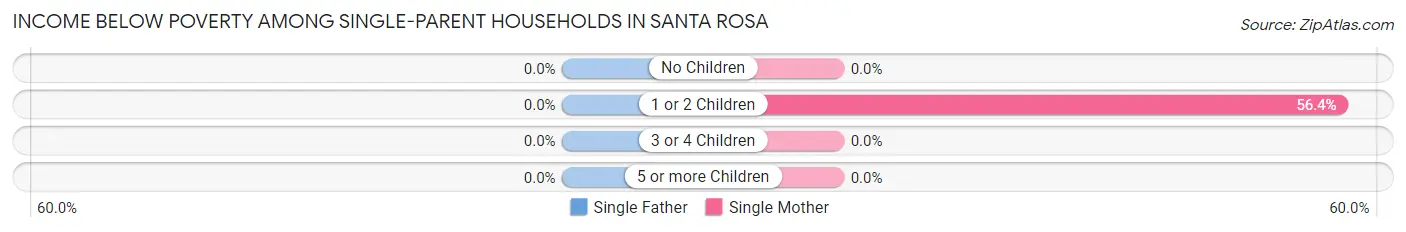
| Children | Single Father | Single Mother |
| No Children | 0 (0.0%) | 0 (0.0%) |
| 1 or 2 Children | 0 (0.0%) | 22 (56.4%) |
| 3 or 4 Children | 0 (0.0%) | 0 (0.0%) |
| 5 or more Children | 0 (0.0%) | 0 (0.0%) |
| Total | 0 (0.0%) | 22 (34.4%) |
Income Below Poverty Among Married-Couple vs Single-Parent Households in Santa Rosa
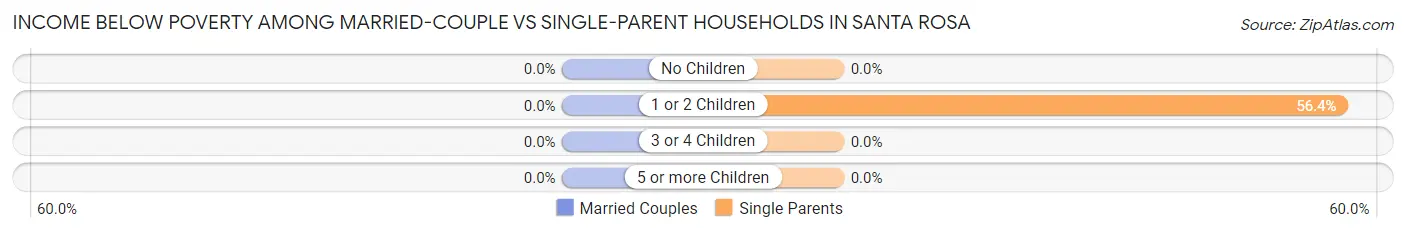
| Children | Married-Couple Families | Single-Parent Households |
| No Children | 0 (0.0%) | 0 (0.0%) |
| 1 or 2 Children | 0 (0.0%) | 22 (56.4%) |
| 3 or 4 Children | 0 (0.0%) | 0 (0.0%) |
| 5 or more Children | 0 (0.0%) | 0 (0.0%) |
| Total | 0 (0.0%) | 22 (34.4%) |
Race in Santa Rosa
The most populous races in Santa Rosa are Hispanic or Latino (364 | 94.3%), Two or more Races (206 | 53.4%), and White / Caucasian (180 | 46.6%).
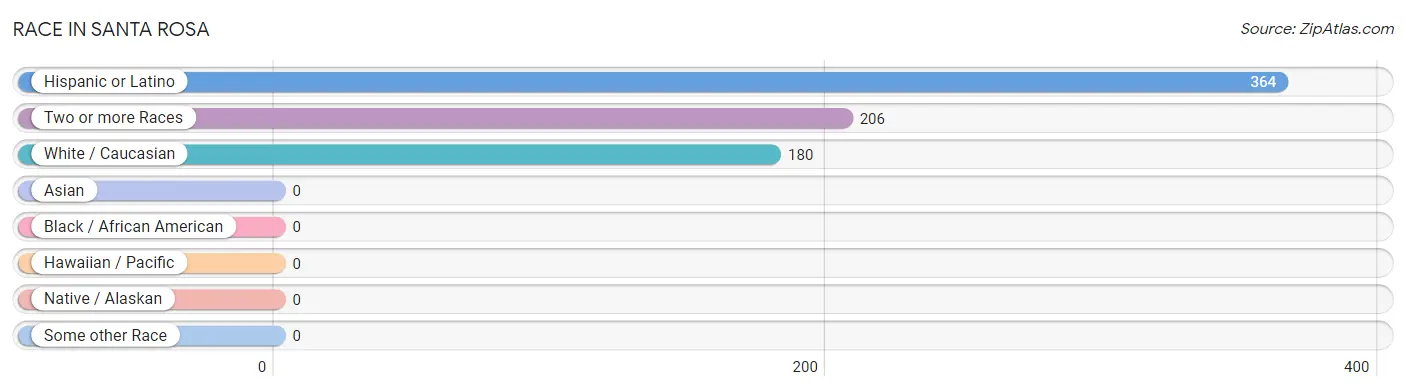
| Race | # Population | % Population |
| Asian | 0 | 0.0% |
| Black / African American | 0 | 0.0% |
| Hawaiian / Pacific | 0 | 0.0% |
| Hispanic or Latino | 364 | 94.3% |
| Native / Alaskan | 0 | 0.0% |
| White / Caucasian | 180 | 46.6% |
| Two or more Races | 206 | 53.4% |
| Some other Race | 0 | 0.0% |
| Total | 386 | 100.0% |
Ancestry in Santa Rosa
The most populous ancestries reported in Santa Rosa are , and Mexican (342 | 88.6%), together accounting for 88.6% of all Santa Rosa residents.

| Ancestry | # Population | % Population |
| Mexican | 342 | 88.6% | View All 1 Rows |
Immigrants in Santa Rosa
The most numerous immigrant groups reported in Santa Rosa came from Central America (52 | 13.5%), Latin America (52 | 13.5%), and Mexico (52 | 13.5%), together accounting for 40.4% of all Santa Rosa residents.
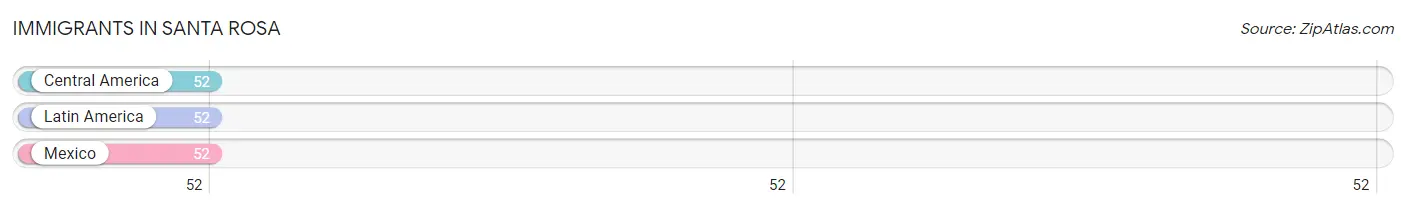
| Immigration Origin | # Population | % Population |
| Central America | 52 | 13.5% |
| Latin America | 52 | 13.5% |
| Mexico | 52 | 13.5% | View All 3 Rows |
Sex and Age in Santa Rosa
Sex and Age in Santa Rosa
The most populous age groups in Santa Rosa are 15 to 19 Years (35 | 30.2%) for men and 15 to 19 Years (57 | 21.1%) for women.
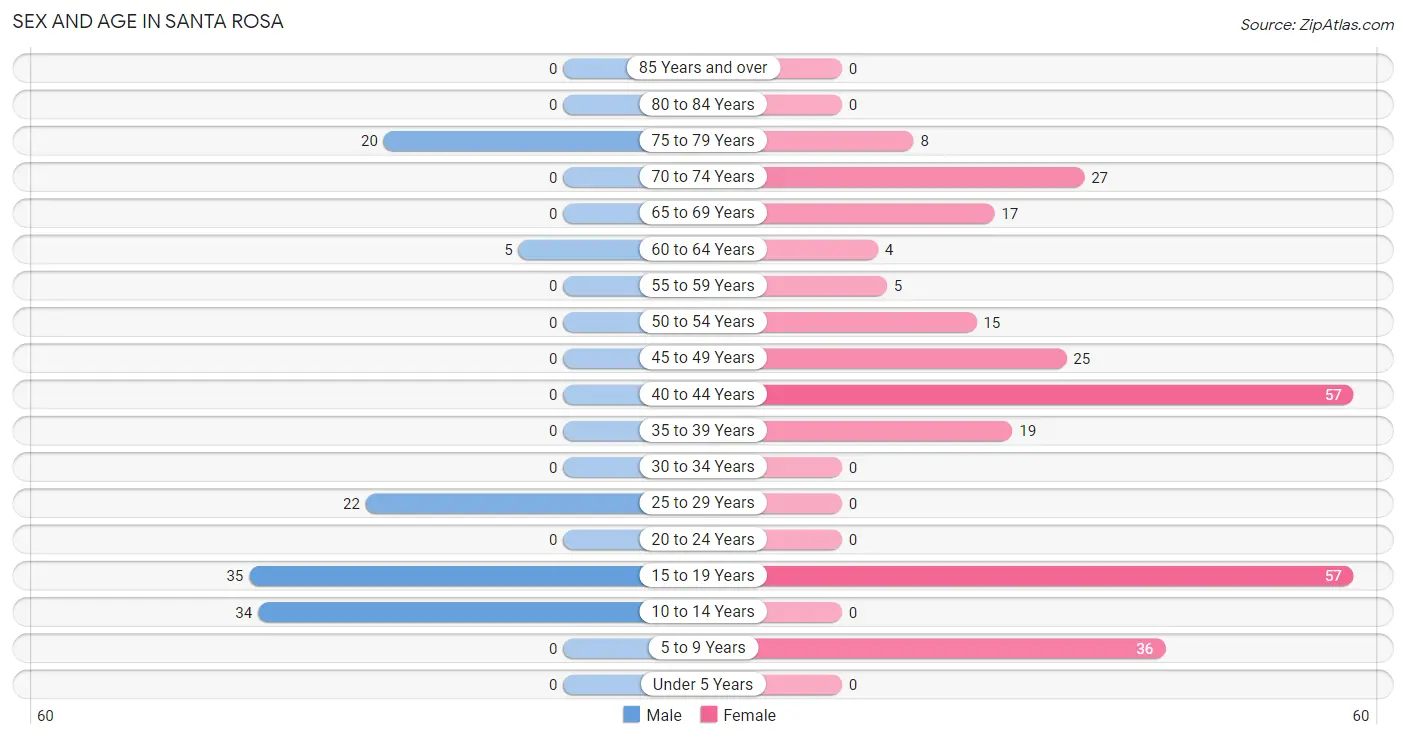
| Age Bracket | Male | Female |
| Under 5 Years | 0 (0.0%) | 0 (0.0%) |
| 5 to 9 Years | 0 (0.0%) | 36 (13.3%) |
| 10 to 14 Years | 34 (29.3%) | 0 (0.0%) |
| 15 to 19 Years | 35 (30.2%) | 57 (21.1%) |
| 20 to 24 Years | 0 (0.0%) | 0 (0.0%) |
| 25 to 29 Years | 22 (19.0%) | 0 (0.0%) |
| 30 to 34 Years | 0 (0.0%) | 0 (0.0%) |
| 35 to 39 Years | 0 (0.0%) | 19 (7.0%) |
| 40 to 44 Years | 0 (0.0%) | 57 (21.1%) |
| 45 to 49 Years | 0 (0.0%) | 25 (9.3%) |
| 50 to 54 Years | 0 (0.0%) | 15 (5.6%) |
| 55 to 59 Years | 0 (0.0%) | 5 (1.8%) |
| 60 to 64 Years | 5 (4.3%) | 4 (1.5%) |
| 65 to 69 Years | 0 (0.0%) | 17 (6.3%) |
| 70 to 74 Years | 0 (0.0%) | 27 (10.0%) |
| 75 to 79 Years | 20 (17.2%) | 8 (3.0%) |
| 80 to 84 Years | 0 (0.0%) | 0 (0.0%) |
| 85 Years and over | 0 (0.0%) | 0 (0.0%) |
| Total | 116 (100.0%) | 270 (100.0%) |
Families and Households in Santa Rosa
Median Family Size in Santa Rosa
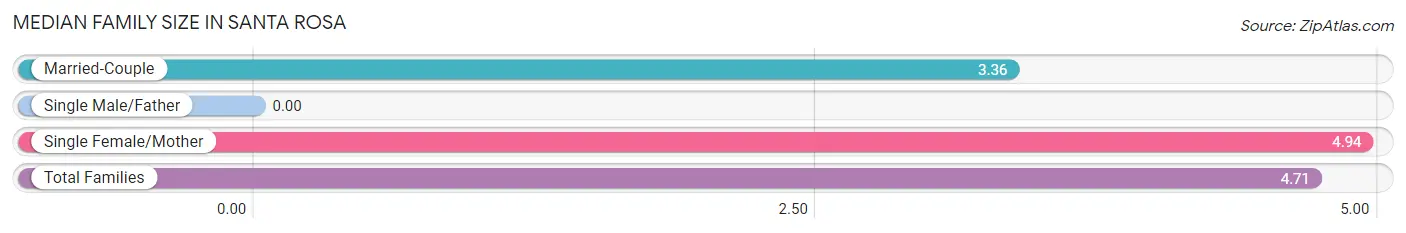
| Family Type | # Families | Family Size |
| Married-Couple | 11 (14.7%) | 3.36 |
| Single Male/Father | 0 (0.0%) | - |
| Single Female/Mother | 64 (85.3%) | 4.94 |
| Total Families | 75 (100.0%) | 4.71 |
Median Household Size in Santa Rosa
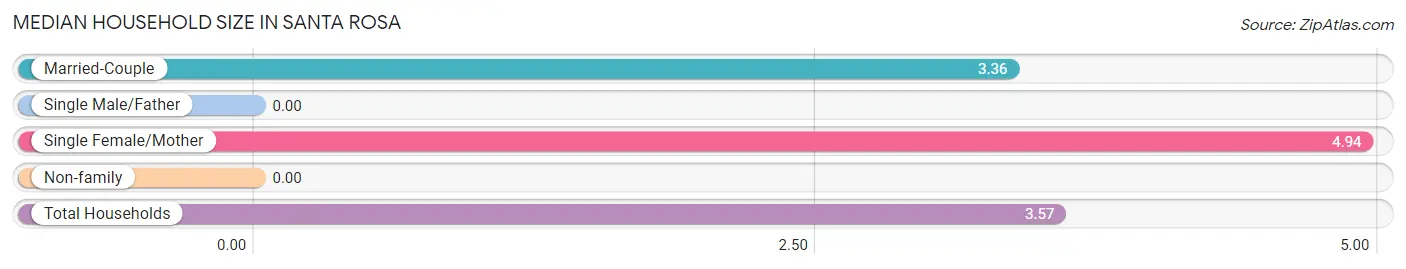
| Household Type | # Households | Household Size |
| Married-Couple | 11 (10.2%) | 3.36 |
| Single Male/Father | 0 (0.0%) | - |
| Single Female/Mother | 64 (59.3%) | 4.94 |
| Non-family | 33 (30.6%) | - |
| Total Households | 108 (100.0%) | 3.57 |
Household Size by Marriage Status in Santa Rosa
Out of a total of 108 households in Santa Rosa, 75 (69.4%) are family households, while 33 (30.6%) are nonfamily households. The most numerous type of family households are 4-person households, comprising 23, and the most common type of nonfamily households are 1-person households, comprising 33.
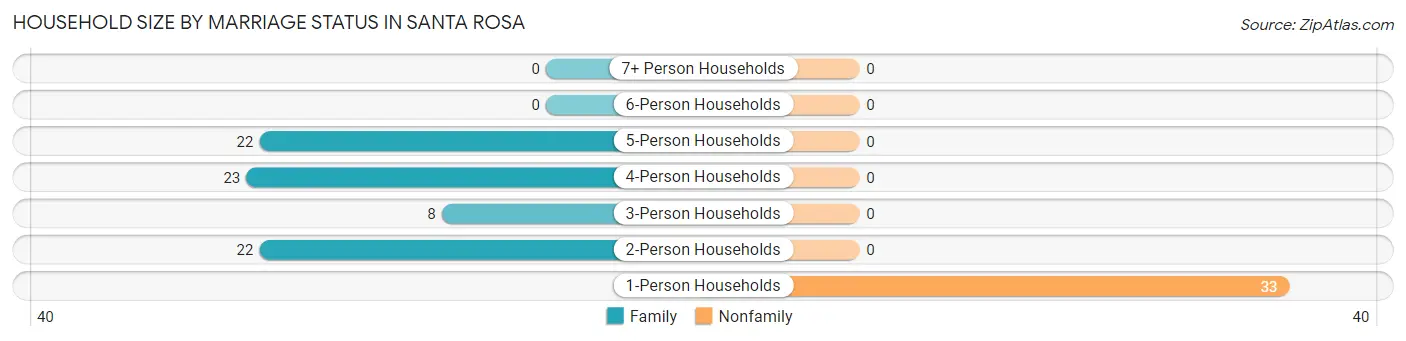
| Household Size | Family Households | Nonfamily Households |
| 1-Person Households | - | 33 (30.6%) |
| 2-Person Households | 22 (20.4%) | 0 (0.0%) |
| 3-Person Households | 8 (7.4%) | 0 (0.0%) |
| 4-Person Households | 23 (21.3%) | 0 (0.0%) |
| 5-Person Households | 22 (20.4%) | 0 (0.0%) |
| 6-Person Households | 0 (0.0%) | 0 (0.0%) |
| 7+ Person Households | 0 (0.0%) | 0 (0.0%) |
| Total | 75 (69.4%) | 33 (30.6%) |
Female Fertility in Santa Rosa
Fertility by Age in Santa Rosa
| Age Bracket | Women with Births | Births / 1,000 Women |
| 15 to 19 years | 0 (0.0%) | 0.0 |
| 20 to 34 years | 0 (0.0%) | 0.0 |
| 35 to 50 years | 0 (0.0%) | 0.0 |
| Total | 0 (0.0%) | 0.0 |
Fertility by Age by Marriage Status in Santa Rosa
| Age Bracket | Married | Unmarried |
| 15 to 19 years | 0 (0.0%) | 0 (0.0%) |
| 20 to 34 years | 0 (0.0%) | 0 (0.0%) |
| 35 to 50 years | 0 (0.0%) | 0 (0.0%) |
| Total | 0 (0.0%) | 0 (0.0%) |
Fertility by Education in Santa Rosa
| Educational Attainment | Women with Births | Births / 1,000 Women |
| Less than High School | 0 (0.0%) | 0.0 |
| High School Diploma | 0 (0.0%) | 0.0 |
| College or Associate's Degree | 0 (0.0%) | 0.0 |
| Bachelor's Degree | 0 (0.0%) | 0.0 |
| Graduate Degree | 0 (0.0%) | 0.0 |
| Total | 0 (0.0%) | 0.0 |
Fertility by Education by Marriage Status in Santa Rosa
| Educational Attainment | Married | Unmarried |
| Less than High School | 0 (0.0%) | 0 (0.0%) |
| High School Diploma | 0 (0.0%) | 0 (0.0%) |
| College or Associate's Degree | 0 (0.0%) | 0 (0.0%) |
| Bachelor's Degree | 0 (0.0%) | 0 (0.0%) |
| Graduate Degree | 0 (0.0%) | 0 (0.0%) |
| Total | 0 (0.0%) | 0 (0.0%) |
Employment Characteristics in Santa Rosa
Employment by Class of Employer in Santa Rosa
Among the 199 employed individuals in Santa Rosa, private company employees (121 | 60.8%), local government employees (42 | 21.1%), and not-for-profit organizations (36 | 18.1%) make up the most common classes of employment.
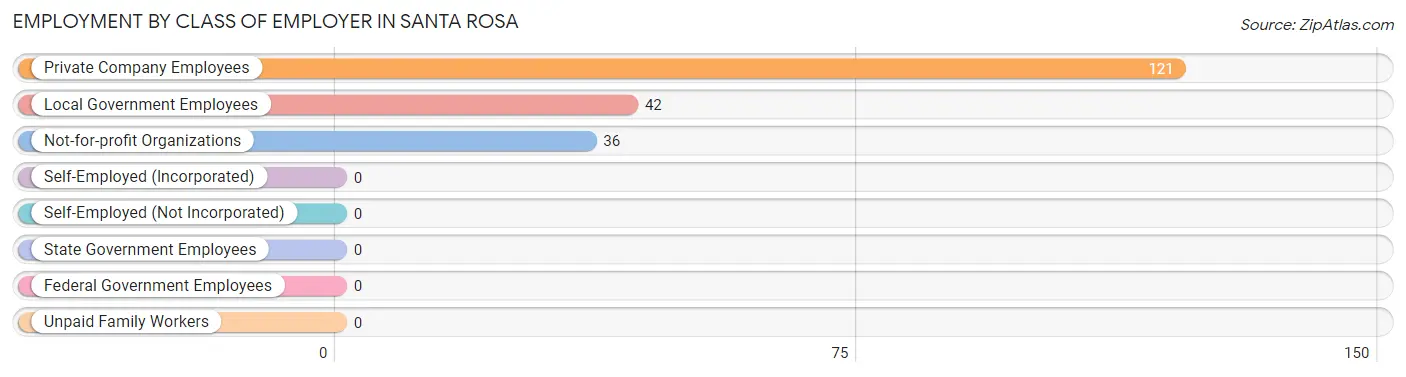
| Employer Class | # Employees | % Employees |
| Private Company Employees | 121 | 60.8% |
| Self-Employed (Incorporated) | 0 | 0.0% |
| Self-Employed (Not Incorporated) | 0 | 0.0% |
| Not-for-profit Organizations | 36 | 18.1% |
| Local Government Employees | 42 | 21.1% |
| State Government Employees | 0 | 0.0% |
| Federal Government Employees | 0 | 0.0% |
| Unpaid Family Workers | 0 | 0.0% |
| Total | 199 | 100.0% |
Employment Status by Age in Santa Rosa
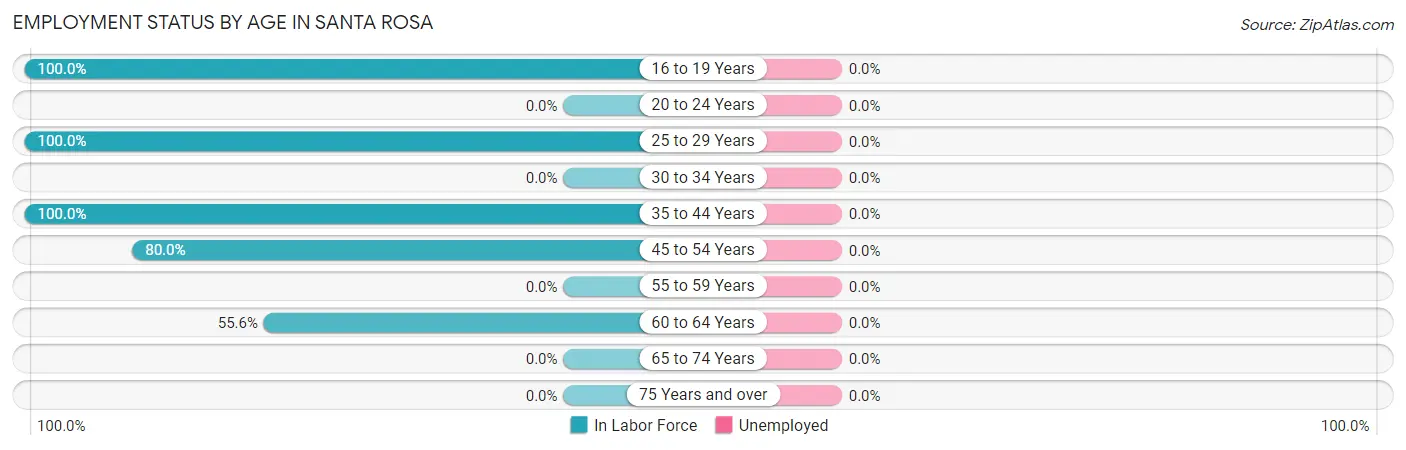
| Age Bracket | In Labor Force | Unemployed |
| 16 to 19 Years | 64 (100.0%) | 0 (0.0%) |
| 20 to 24 Years | 0 (0.0%) | 0 (0.0%) |
| 25 to 29 Years | 22 (100.0%) | 0 (0.0%) |
| 30 to 34 Years | 0 (0.0%) | 0 (0.0%) |
| 35 to 44 Years | 76 (100.0%) | 0 (0.0%) |
| 45 to 54 Years | 32 (80.0%) | 0 (0.0%) |
| 55 to 59 Years | 0 (0.0%) | 0 (0.0%) |
| 60 to 64 Years | 5 (55.6%) | 0 (0.0%) |
| 65 to 74 Years | 0 (0.0%) | 0 (0.0%) |
| 75 Years and over | 0 (0.0%) | 0 (0.0%) |
| Total | 199 (69.1%) | 0 (0.0%) |
Employment Status by Educational Attainment in Santa Rosa
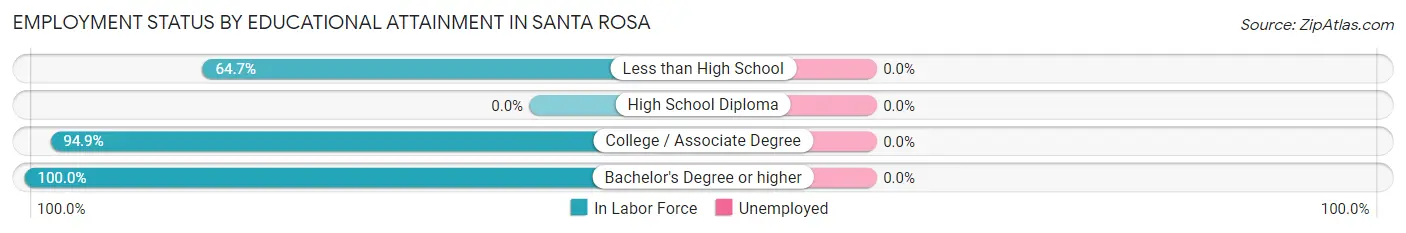
| Educational Attainment | In Labor Force | Unemployed |
| Less than High School | 22 (64.7%) | 0 (0.0%) |
| High School Diploma | 0 (0.0%) | 0 (0.0%) |
| College / Associate Degree | 94 (94.9%) | 0 (0.0%) |
| Bachelor's Degree or higher | 19 (100.0%) | 0 (0.0%) |
| Total | 135 (88.8%) | 0 (0.0%) |
Employment Occupations by Sex in Santa Rosa
Management, Business, Science and Arts Occupations
The most common Management, Business, Science and Arts occupations in Santa Rosa are Community & Social Service (36 | 18.1%), Legal Services & Support (19 | 9.6%), and Education Instruction & Library (17 | 8.5%).
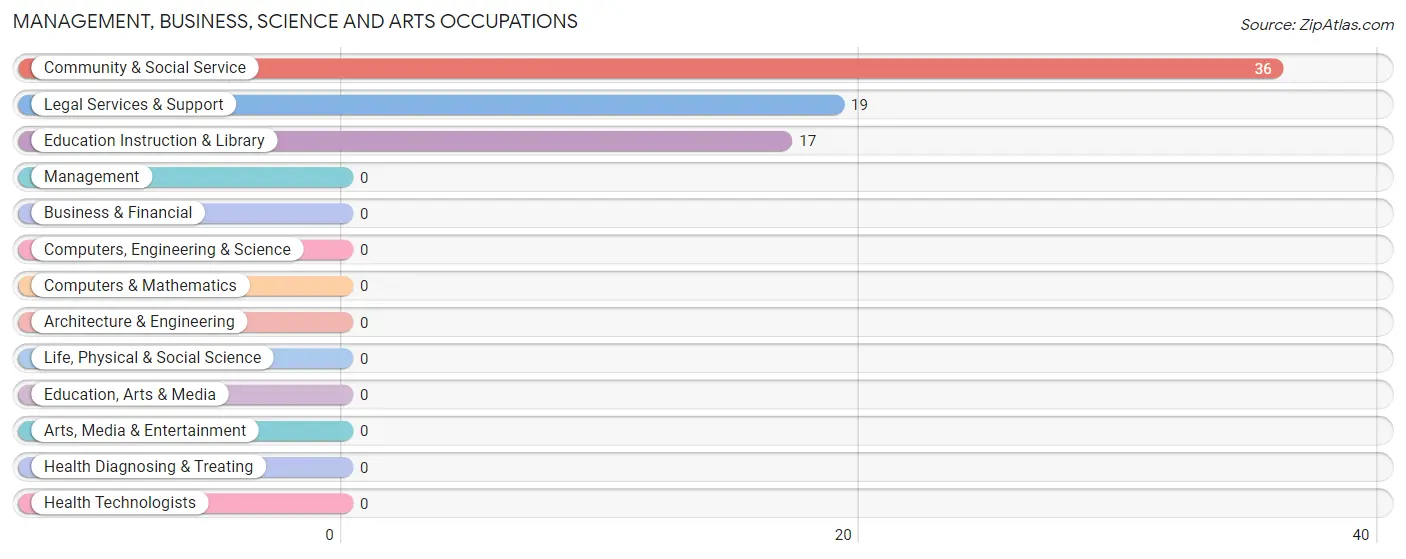
Management, Business, Science and Arts Occupations by Sex
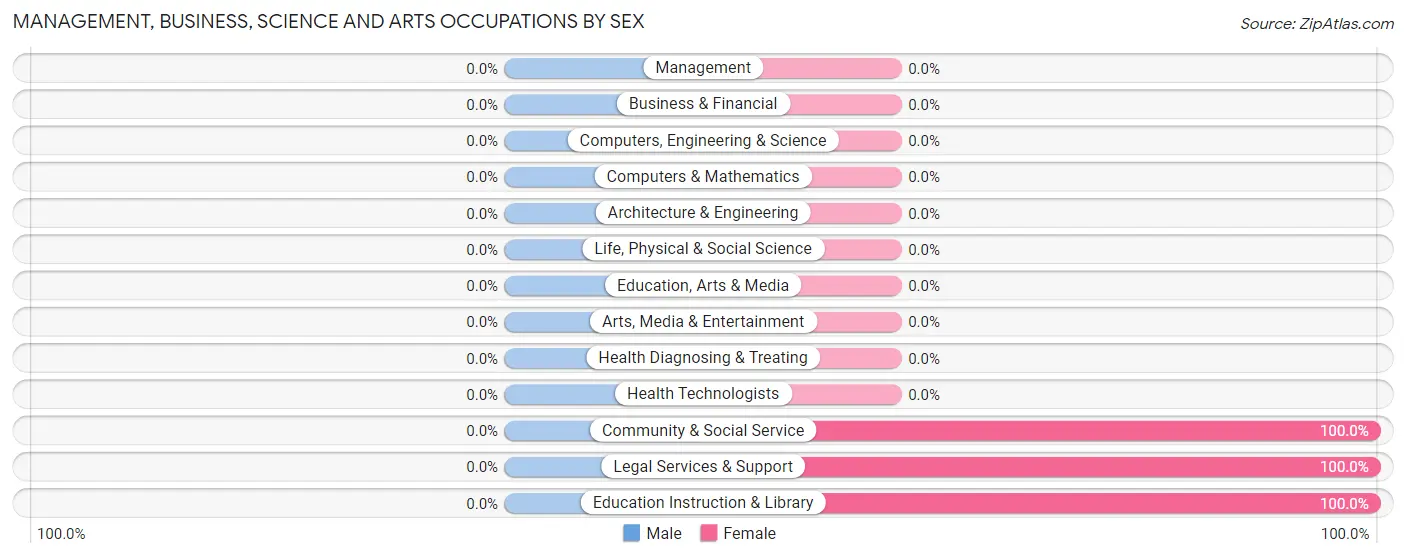
| Occupation | Male | Female |
| Management | 0 (0.0%) | 0 (0.0%) |
| Business & Financial | 0 (0.0%) | 0 (0.0%) |
| Computers, Engineering & Science | 0 (0.0%) | 0 (0.0%) |
| Computers & Mathematics | 0 (0.0%) | 0 (0.0%) |
| Architecture & Engineering | 0 (0.0%) | 0 (0.0%) |
| Life, Physical & Social Science | 0 (0.0%) | 0 (0.0%) |
| Community & Social Service | 0 (0.0%) | 36 (100.0%) |
| Education, Arts & Media | 0 (0.0%) | 0 (0.0%) |
| Legal Services & Support | 0 (0.0%) | 19 (100.0%) |
| Education Instruction & Library | 0 (0.0%) | 17 (100.0%) |
| Arts, Media & Entertainment | 0 (0.0%) | 0 (0.0%) |
| Health Diagnosing & Treating | 0 (0.0%) | 0 (0.0%) |
| Health Technologists | 0 (0.0%) | 0 (0.0%) |
| Total (Category) | 0 (0.0%) | 36 (100.0%) |
| Total (Overall) | 62 (31.2%) | 137 (68.8%) |
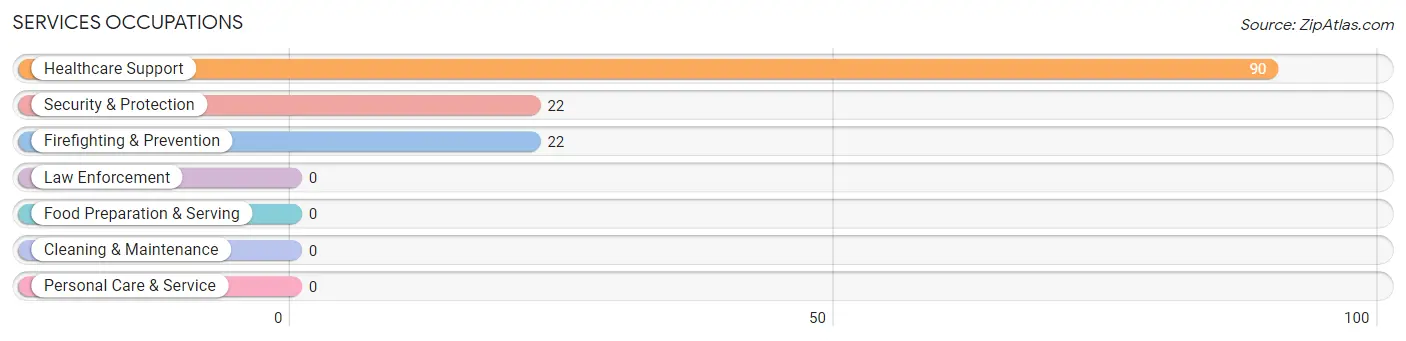
Services Occupations
The most common Services occupations in Santa Rosa are Healthcare Support (90 | 45.2%), Security & Protection (22 | 11.1%), and Firefighting & Prevention (22 | 11.1%).
Services Occupations by Sex
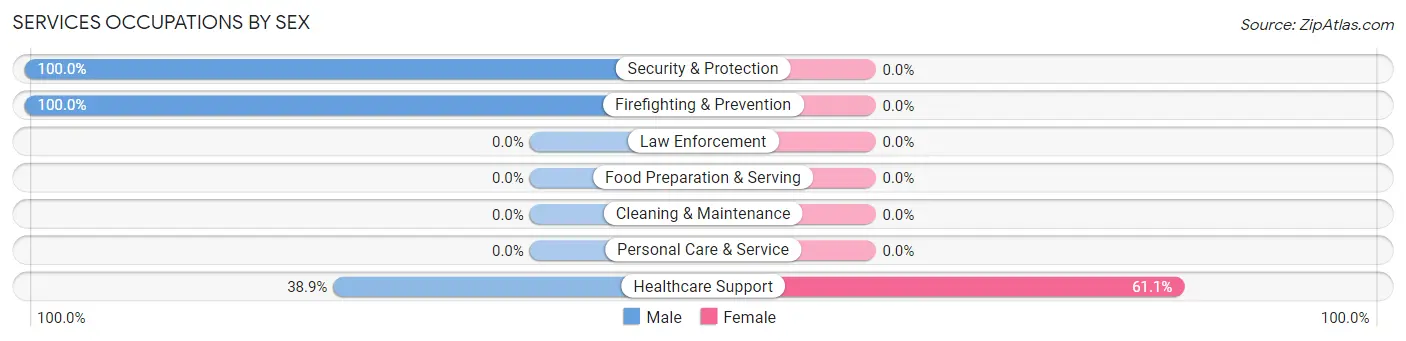
| Occupation | Male | Female |
| Healthcare Support | 35 (38.9%) | 55 (61.1%) |
| Security & Protection | 22 (100.0%) | 0 (0.0%) |
| Firefighting & Prevention | 22 (100.0%) | 0 (0.0%) |
| Law Enforcement | 0 (0.0%) | 0 (0.0%) |
| Food Preparation & Serving | 0 (0.0%) | 0 (0.0%) |
| Cleaning & Maintenance | 0 (0.0%) | 0 (0.0%) |
| Personal Care & Service | 0 (0.0%) | 0 (0.0%) |
| Total (Category) | 57 (50.9%) | 55 (49.1%) |
| Total (Overall) | 62 (31.2%) | 137 (68.8%) |
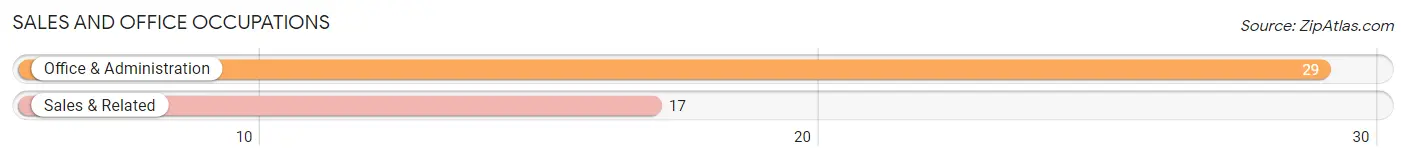
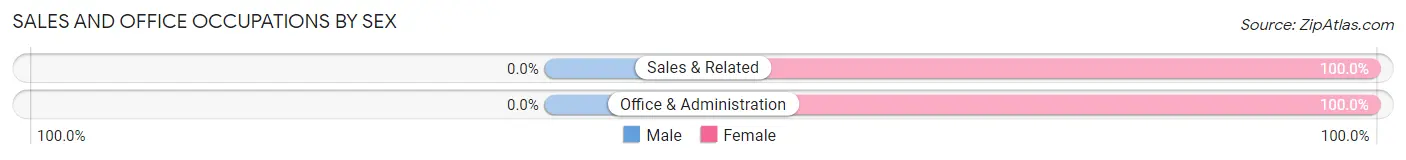
Sales and Office Occupations
The most common Sales and Office occupations in Santa Rosa are Office & Administration (29 | 14.6%), and Sales & Related (17 | 8.5%).
Sales and Office Occupations by Sex
| Occupation | Male | Female |
| Sales & Related | 0 (0.0%) | 17 (100.0%) |
| Office & Administration | 0 (0.0%) | 29 (100.0%) |
| Total (Category) | 0 (0.0%) | 46 (100.0%) |
| Total (Overall) | 62 (31.2%) | 137 (68.8%) |
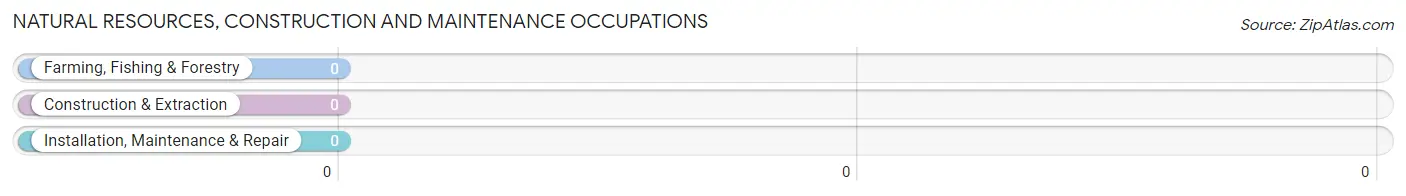
Natural Resources, Construction and Maintenance Occupations
Natural Resources, Construction and Maintenance Occupations by Sex
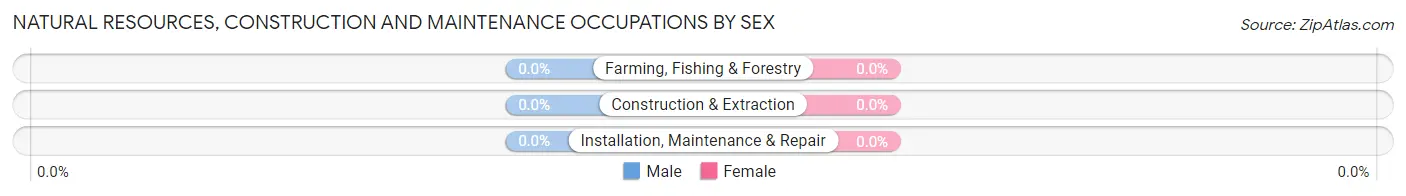
| Occupation | Male | Female |
| Farming, Fishing & Forestry | 0 (0.0%) | 0 (0.0%) |
| Construction & Extraction | 0 (0.0%) | 0 (0.0%) |
| Installation, Maintenance & Repair | 0 (0.0%) | 0 (0.0%) |
| Total (Category) | 0 (0.0%) | 0 (0.0%) |
| Total (Overall) | 62 (31.2%) | 137 (68.8%) |
Production, Transportation and Moving Occupations
The most common Production, Transportation and Moving occupations in Santa Rosa are , and Transportation (5 | 2.5%).
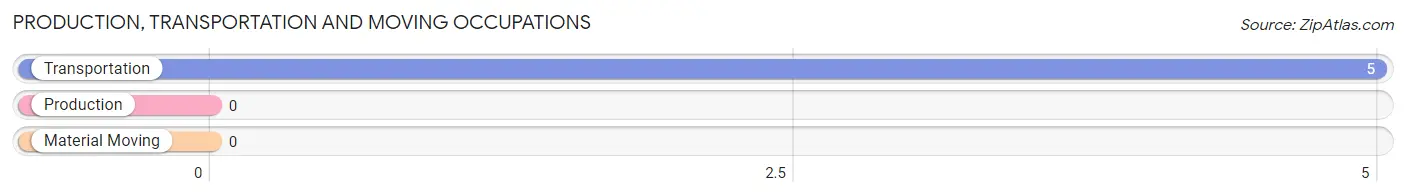
Production, Transportation and Moving Occupations by Sex
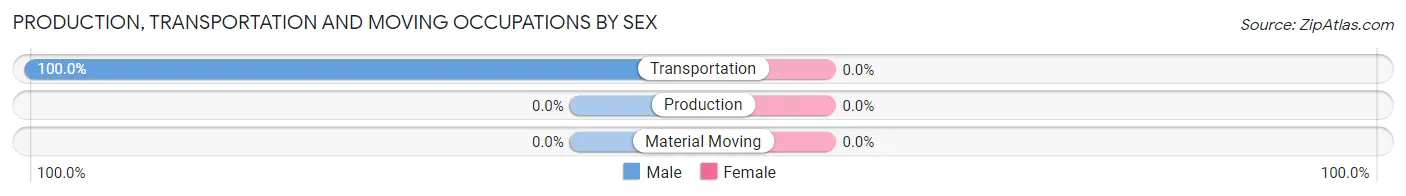
| Occupation | Male | Female |
| Production | 0 (0.0%) | 0 (0.0%) |
| Transportation | 5 (100.0%) | 0 (0.0%) |
| Material Moving | 0 (0.0%) | 0 (0.0%) |
| Total (Category) | 5 (100.0%) | 0 (0.0%) |
| Total (Overall) | 62 (31.2%) | 137 (68.8%) |
Employment Industries by Sex in Santa Rosa
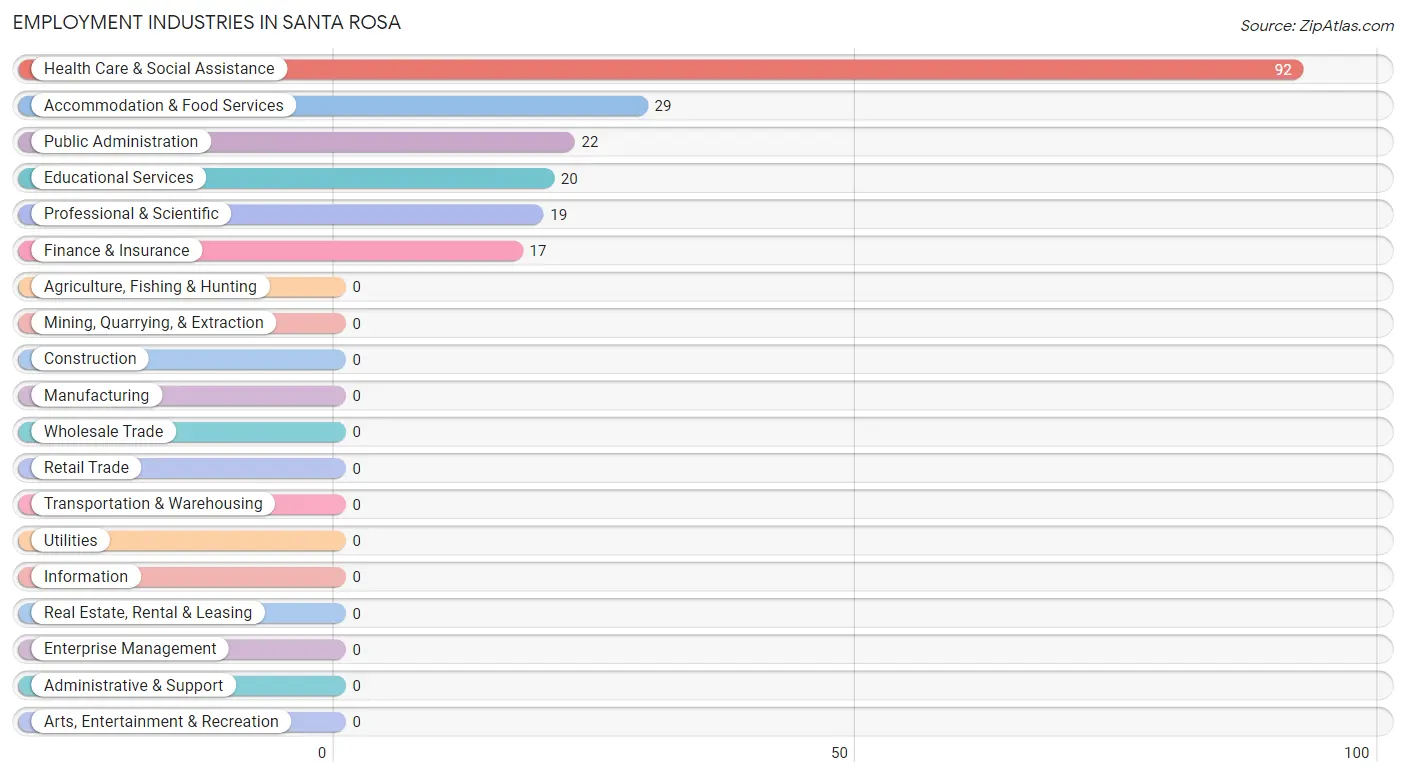
Employment Industries in Santa Rosa
The major employment industries in Santa Rosa include Health Care & Social Assistance (92 | 46.2%), Accommodation & Food Services (29 | 14.6%), Public Administration (22 | 11.1%), Educational Services (20 | 10.1%), and Professional & Scientific (19 | 9.6%).
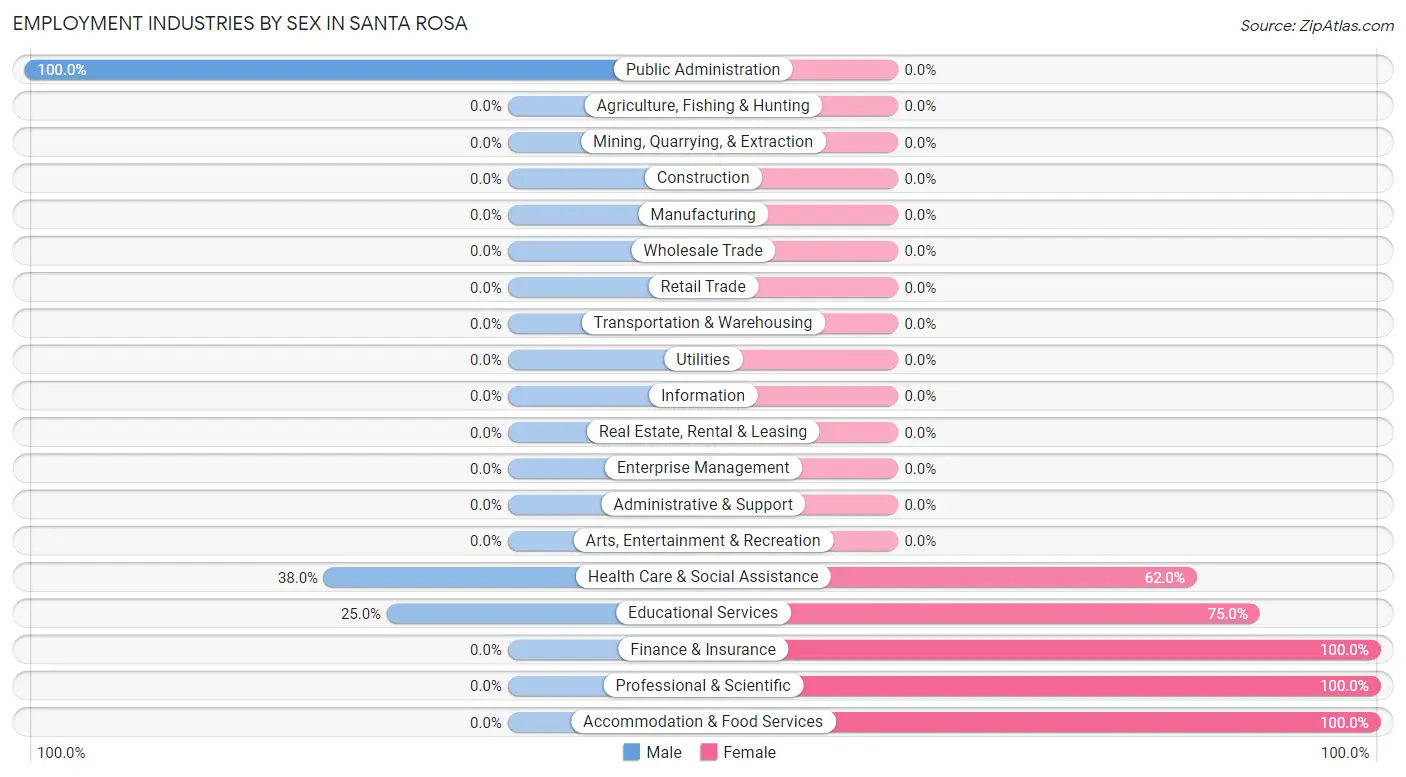
Employment Industries by Sex in Santa Rosa
The Santa Rosa industries that see more men than women are Public Administration (100.0%), Health Care & Social Assistance (38.0%), and Educational Services (25.0%), whereas the industries that tend to have a higher number of women are Finance & Insurance (100.0%), Professional & Scientific (100.0%), and Accommodation & Food Services (100.0%).
| Industry | Male | Female |
| Agriculture, Fishing & Hunting | 0 (0.0%) | 0 (0.0%) |
| Mining, Quarrying, & Extraction | 0 (0.0%) | 0 (0.0%) |
| Construction | 0 (0.0%) | 0 (0.0%) |
| Manufacturing | 0 (0.0%) | 0 (0.0%) |
| Wholesale Trade | 0 (0.0%) | 0 (0.0%) |
| Retail Trade | 0 (0.0%) | 0 (0.0%) |
| Transportation & Warehousing | 0 (0.0%) | 0 (0.0%) |
| Utilities | 0 (0.0%) | 0 (0.0%) |
| Information | 0 (0.0%) | 0 (0.0%) |
| Finance & Insurance | 0 (0.0%) | 17 (100.0%) |
| Real Estate, Rental & Leasing | 0 (0.0%) | 0 (0.0%) |
| Professional & Scientific | 0 (0.0%) | 19 (100.0%) |
| Enterprise Management | 0 (0.0%) | 0 (0.0%) |
| Administrative & Support | 0 (0.0%) | 0 (0.0%) |
| Educational Services | 5 (25.0%) | 15 (75.0%) |
| Health Care & Social Assistance | 35 (38.0%) | 57 (62.0%) |
| Arts, Entertainment & Recreation | 0 (0.0%) | 0 (0.0%) |
| Accommodation & Food Services | 0 (0.0%) | 29 (100.0%) |
| Public Administration | 22 (100.0%) | 0 (0.0%) |
| Total | 62 (31.2%) | 137 (68.8%) |
Education in Santa Rosa
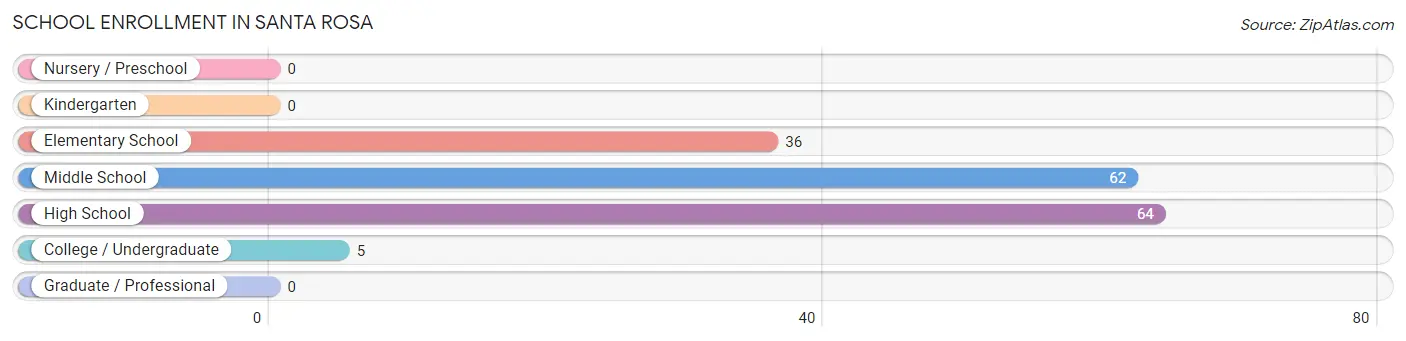
School Enrollment in Santa Rosa
The most common levels of schooling among the 167 students in Santa Rosa are high school (64 | 38.3%), middle school (62 | 37.1%), and elementary school (36 | 21.6%).
| School Level | # Students | % Students |
| Nursery / Preschool | 0 | 0.0% |
| Kindergarten | 0 | 0.0% |
| Elementary School | 36 | 21.6% |
| Middle School | 62 | 37.1% |
| High School | 64 | 38.3% |
| College / Undergraduate | 5 | 3.0% |
| Graduate / Professional | 0 | 0.0% |
| Total | 167 | 100.0% |
School Enrollment by Age by Funding Source in Santa Rosa
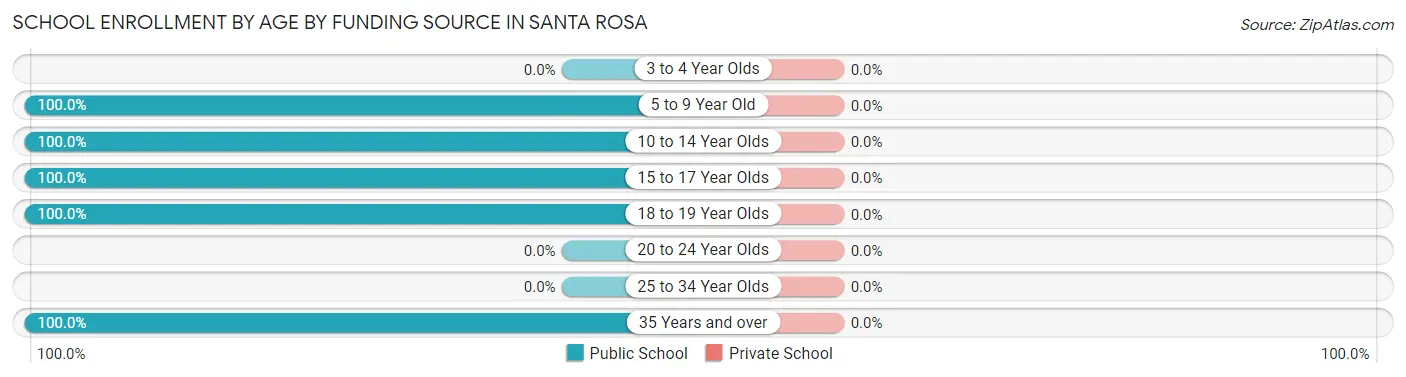
| Age Bracket | Public School | Private School |
| 3 to 4 Year Olds | 0 (0.0%) | 0 (0.0%) |
| 5 to 9 Year Old | 36 (100.0%) | 0 (0.0%) |
| 10 to 14 Year Olds | 34 (100.0%) | 0 (0.0%) |
| 15 to 17 Year Olds | 28 (100.0%) | 0 (0.0%) |
| 18 to 19 Year Olds | 64 (100.0%) | 0 (0.0%) |
| 20 to 24 Year Olds | 0 (0.0%) | 0 (0.0%) |
| 25 to 34 Year Olds | 0 (0.0%) | 0 (0.0%) |
| 35 Years and over | 5 (100.0%) | 0 (0.0%) |
| Total | 167 (100.0%) | 0 (0.0%) |
Educational Attainment by Field of Study in Santa Rosa
, and social sciences (19 | 100.0%) are the most common fields of study among 19 individuals in Santa Rosa who have obtained a bachelor's degree or higher.
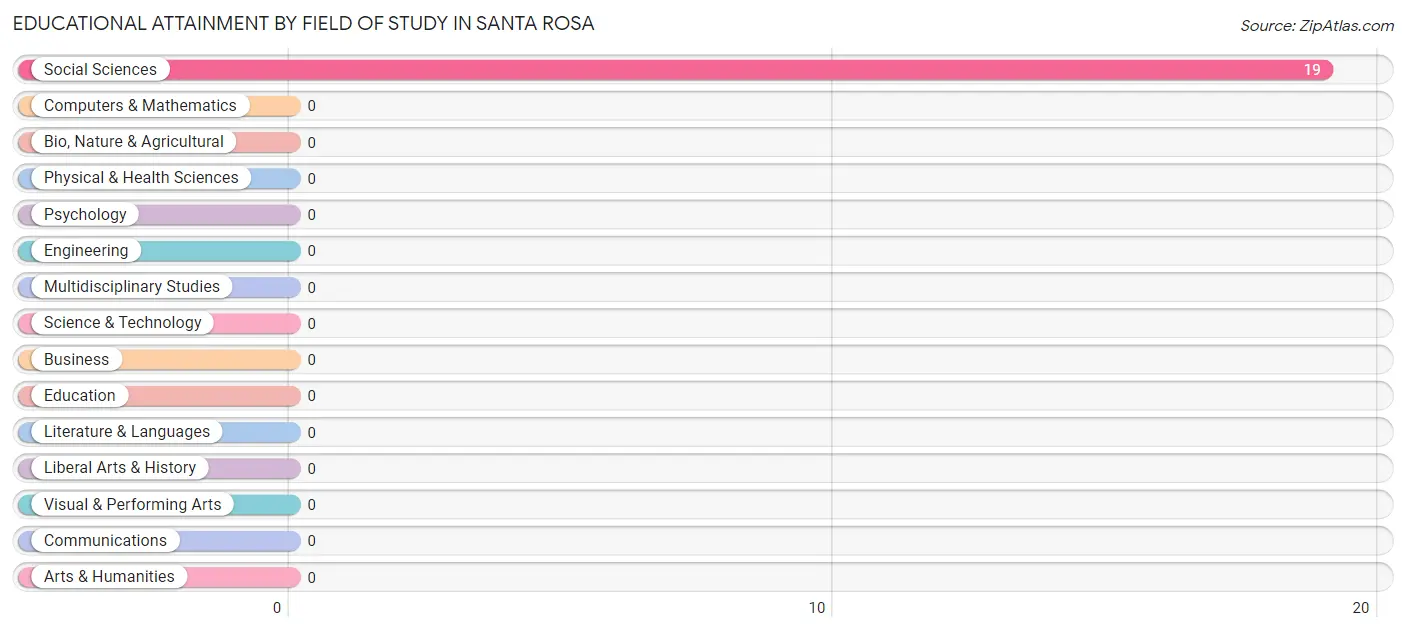
| Field of Study | # Graduates | % Graduates |
| Computers & Mathematics | 0 | 0.0% |
| Bio, Nature & Agricultural | 0 | 0.0% |
| Physical & Health Sciences | 0 | 0.0% |
| Psychology | 0 | 0.0% |
| Social Sciences | 19 | 100.0% |
| Engineering | 0 | 0.0% |
| Multidisciplinary Studies | 0 | 0.0% |
| Science & Technology | 0 | 0.0% |
| Business | 0 | 0.0% |
| Education | 0 | 0.0% |
| Literature & Languages | 0 | 0.0% |
| Liberal Arts & History | 0 | 0.0% |
| Visual & Performing Arts | 0 | 0.0% |
| Communications | 0 | 0.0% |
| Arts & Humanities | 0 | 0.0% |
| Total | 19 | 100.0% |
Transportation & Commute in Santa Rosa
Vehicle Availability by Sex in Santa Rosa
The most prevalent vehicle ownership categories in Santa Rosa are males with 1 vehicle (40, accounting for 64.5%) and females with 1 vehicle (76, making up 29.2%).
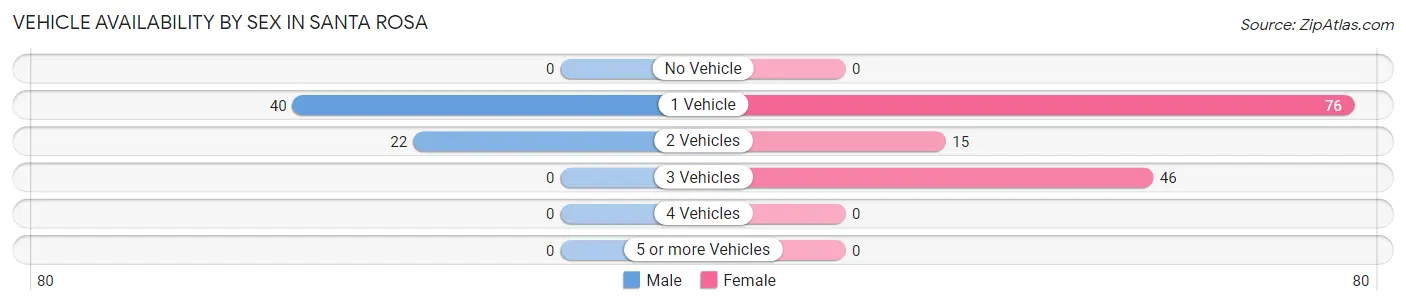
| Vehicles Available | Male | Female |
| No Vehicle | 0 (0.0%) | 0 (0.0%) |
| 1 Vehicle | 40 (64.5%) | 76 (55.5%) |
| 2 Vehicles | 22 (35.5%) | 15 (11.0%) |
| 3 Vehicles | 0 (0.0%) | 46 (33.6%) |
| 4 Vehicles | 0 (0.0%) | 0 (0.0%) |
| 5 or more Vehicles | 0 (0.0%) | 0 (0.0%) |
| Total | 62 (100.0%) | 137 (100.0%) |
Commute Time in Santa Rosa
The most frequently occuring commute durations in Santa Rosa are 10 to 14 minutes (102 commuters, 51.3%), 30 to 34 minutes (75 commuters, 37.7%), and 15 to 19 minutes (22 commuters, 11.1%).
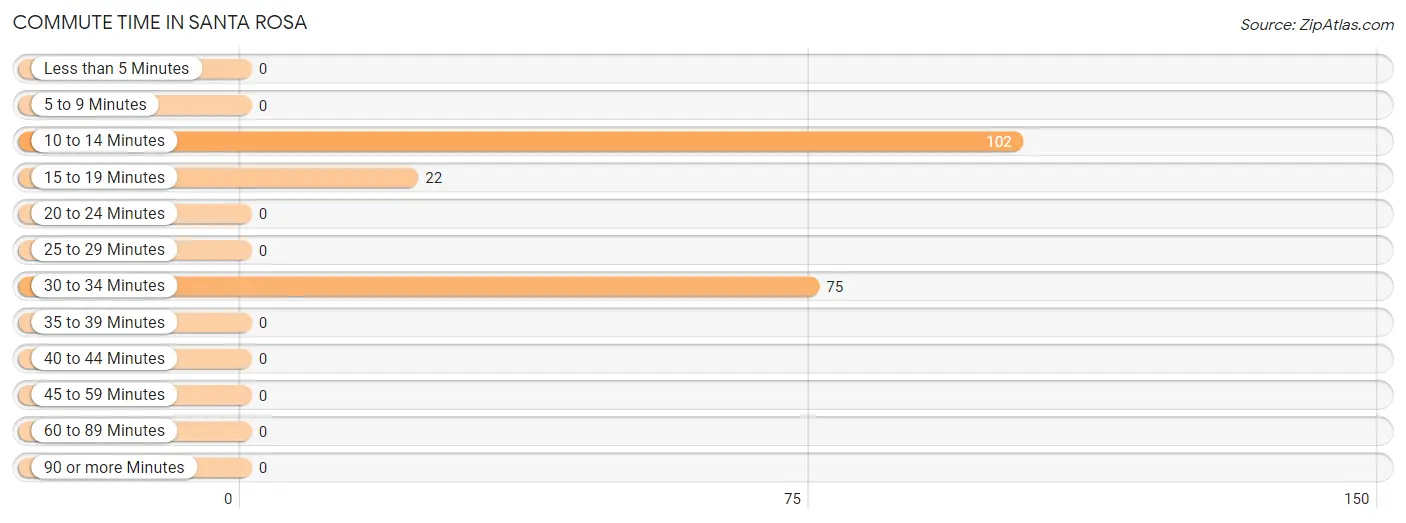
| Commute Time | # Commuters | % Commuters |
| Less than 5 Minutes | 0 | 0.0% |
| 5 to 9 Minutes | 0 | 0.0% |
| 10 to 14 Minutes | 102 | 51.3% |
| 15 to 19 Minutes | 22 | 11.1% |
| 20 to 24 Minutes | 0 | 0.0% |
| 25 to 29 Minutes | 0 | 0.0% |
| 30 to 34 Minutes | 75 | 37.7% |
| 35 to 39 Minutes | 0 | 0.0% |
| 40 to 44 Minutes | 0 | 0.0% |
| 45 to 59 Minutes | 0 | 0.0% |
| 60 to 89 Minutes | 0 | 0.0% |
| 90 or more Minutes | 0 | 0.0% |
Commute Time by Sex in Santa Rosa
The most common commute times in Santa Rosa are 30 to 34 minutes (35 commuters, 56.5%) for males and 10 to 14 minutes (80 commuters, 58.4%) for females.
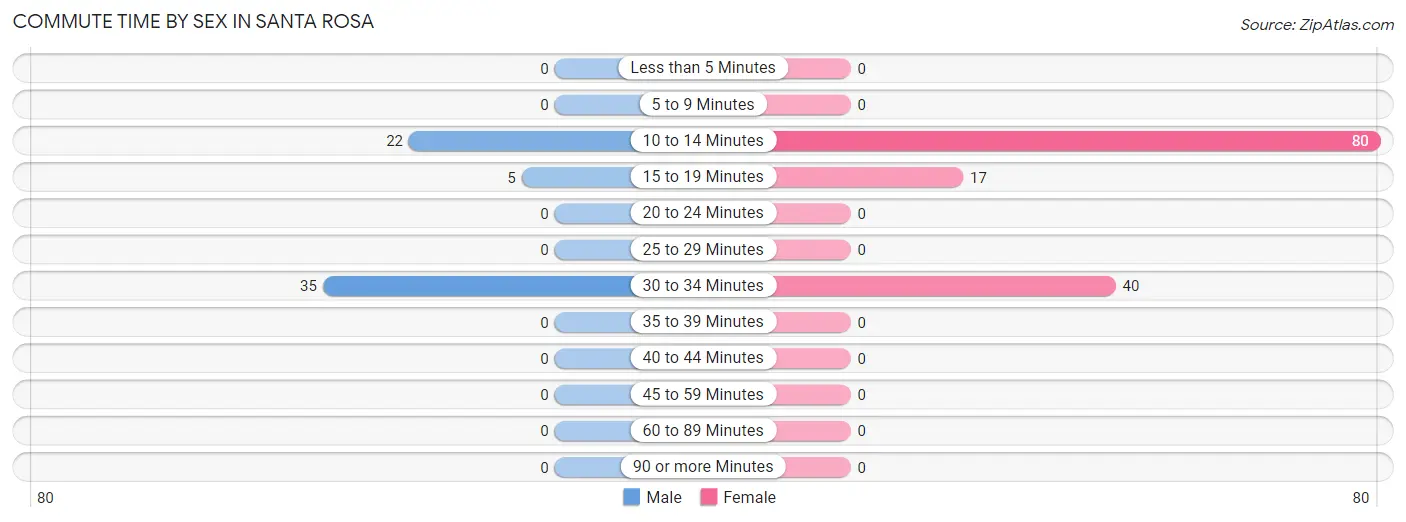
| Commute Time | Male | Female |
| Less than 5 Minutes | 0 (0.0%) | 0 (0.0%) |
| 5 to 9 Minutes | 0 (0.0%) | 0 (0.0%) |
| 10 to 14 Minutes | 22 (35.5%) | 80 (58.4%) |
| 15 to 19 Minutes | 5 (8.1%) | 17 (12.4%) |
| 20 to 24 Minutes | 0 (0.0%) | 0 (0.0%) |
| 25 to 29 Minutes | 0 (0.0%) | 0 (0.0%) |
| 30 to 34 Minutes | 35 (56.5%) | 40 (29.2%) |
| 35 to 39 Minutes | 0 (0.0%) | 0 (0.0%) |
| 40 to 44 Minutes | 0 (0.0%) | 0 (0.0%) |
| 45 to 59 Minutes | 0 (0.0%) | 0 (0.0%) |
| 60 to 89 Minutes | 0 (0.0%) | 0 (0.0%) |
| 90 or more Minutes | 0 (0.0%) | 0 (0.0%) |
Time of Departure to Work by Sex in Santa Rosa
The most frequent times of departure to work in Santa Rosa are 4:00 PM to 11:59 PM (35, 56.5%) for males and 7:30 AM to 7:59 AM (91, 66.4%) for females.
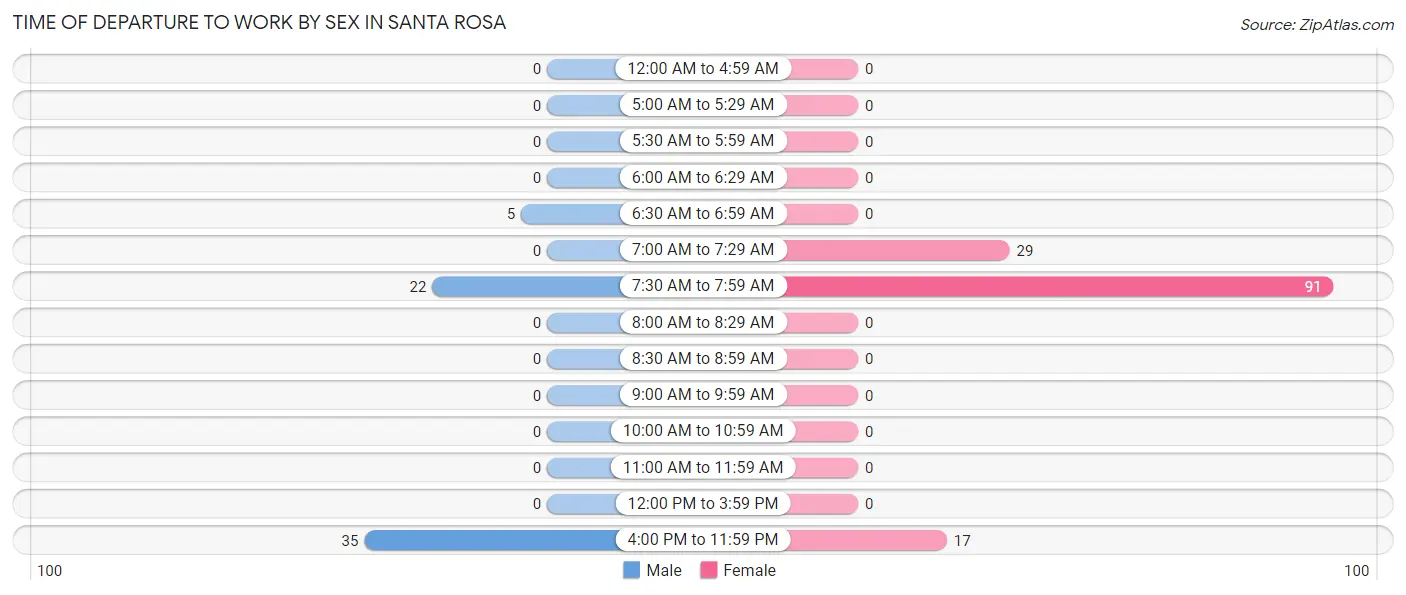
| Time of Departure | Male | Female |
| 12:00 AM to 4:59 AM | 0 (0.0%) | 0 (0.0%) |
| 5:00 AM to 5:29 AM | 0 (0.0%) | 0 (0.0%) |
| 5:30 AM to 5:59 AM | 0 (0.0%) | 0 (0.0%) |
| 6:00 AM to 6:29 AM | 0 (0.0%) | 0 (0.0%) |
| 6:30 AM to 6:59 AM | 5 (8.1%) | 0 (0.0%) |
| 7:00 AM to 7:29 AM | 0 (0.0%) | 29 (21.2%) |
| 7:30 AM to 7:59 AM | 22 (35.5%) | 91 (66.4%) |
| 8:00 AM to 8:29 AM | 0 (0.0%) | 0 (0.0%) |
| 8:30 AM to 8:59 AM | 0 (0.0%) | 0 (0.0%) |
| 9:00 AM to 9:59 AM | 0 (0.0%) | 0 (0.0%) |
| 10:00 AM to 10:59 AM | 0 (0.0%) | 0 (0.0%) |
| 11:00 AM to 11:59 AM | 0 (0.0%) | 0 (0.0%) |
| 12:00 PM to 3:59 PM | 0 (0.0%) | 0 (0.0%) |
| 4:00 PM to 11:59 PM | 35 (56.5%) | 17 (12.4%) |
| Total | 62 (100.0%) | 137 (100.0%) |
Housing Occupancy in Santa Rosa
Occupancy by Ownership in Santa Rosa
Of the total 920 dwellings in Santa Rosa, owner-occupied units account for 495 (53.8%), while renter-occupied units make up 425 (46.2%).
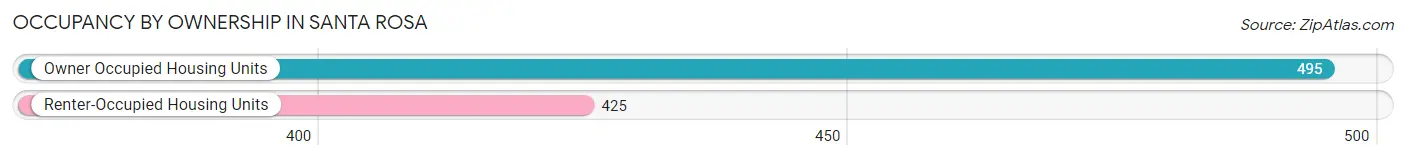
| Occupancy | # Housing Units | % Housing Units |
| Owner Occupied Housing Units | 495 | 53.8% |
| Renter-Occupied Housing Units | 425 | 46.2% |
| Total Occupied Housing Units | 920 | 100.0% |
Occupancy by Household Size in Santa Rosa
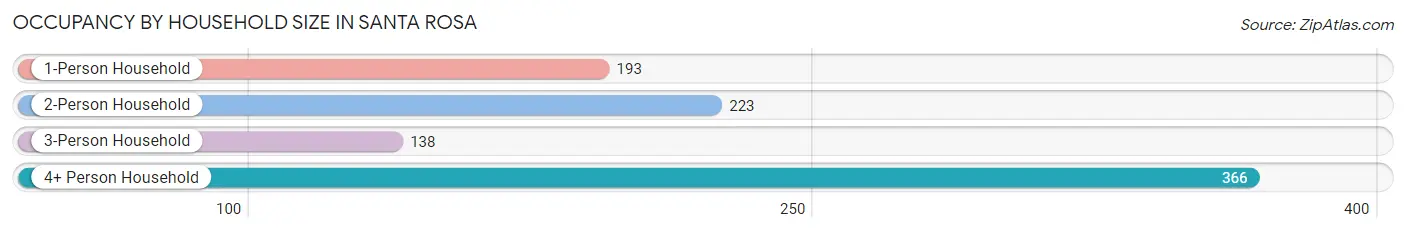
| Household Size | # Housing Units | % Housing Units |
| 1-Person Household | 193 | 21.0% |
| 2-Person Household | 223 | 24.2% |
| 3-Person Household | 138 | 15.0% |
| 4+ Person Household | 366 | 39.8% |
| Total Housing Units | 920 | 100.0% |
Occupancy by Ownership by Household Size in Santa Rosa
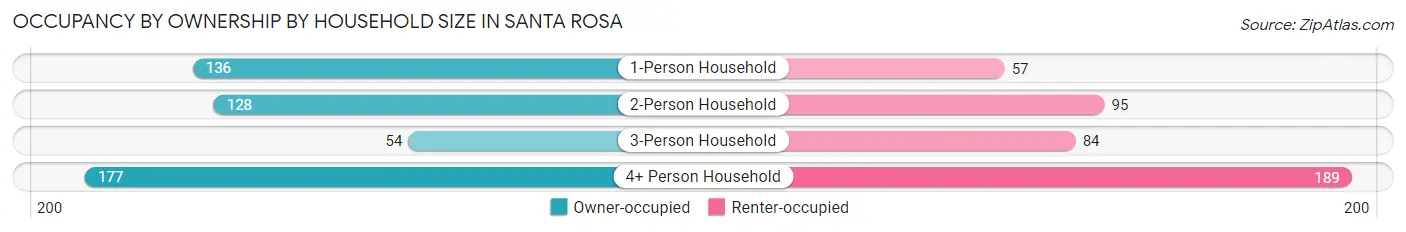
| Household Size | Owner-occupied | Renter-occupied |
| 1-Person Household | 136 (70.5%) | 57 (29.5%) |
| 2-Person Household | 128 (57.4%) | 95 (42.6%) |
| 3-Person Household | 54 (39.1%) | 84 (60.9%) |
| 4+ Person Household | 177 (48.4%) | 189 (51.6%) |
| Total Housing Units | 495 (53.8%) | 425 (46.2%) |
Occupancy by Educational Attainment in Santa Rosa
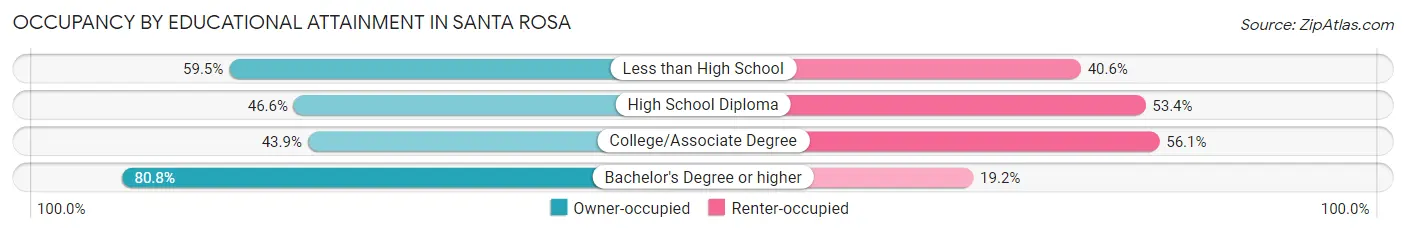
| Household Size | Owner-occupied | Renter-occupied |
| Less than High School | 217 (59.5%) | 148 (40.6%) |
| High School Diploma | 97 (46.6%) | 111 (53.4%) |
| College/Associate Degree | 118 (43.9%) | 151 (56.1%) |
| Bachelor's Degree or higher | 63 (80.8%) | 15 (19.2%) |
Occupancy by Age of Householder in Santa Rosa
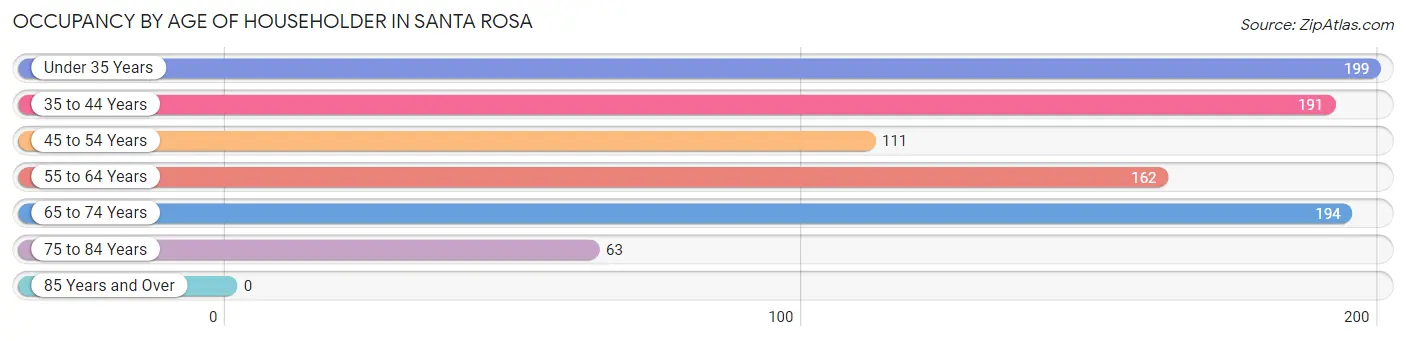
| Age Bracket | # Households | % Households |
| Under 35 Years | 199 | 21.6% |
| 35 to 44 Years | 191 | 20.8% |
| 45 to 54 Years | 111 | 12.1% |
| 55 to 64 Years | 162 | 17.6% |
| 65 to 74 Years | 194 | 21.1% |
| 75 to 84 Years | 63 | 6.9% |
| 85 Years and Over | 0 | 0.0% |
| Total | 920 | 100.0% |
Housing Finances in Santa Rosa
Median Income by Occupancy in Santa Rosa
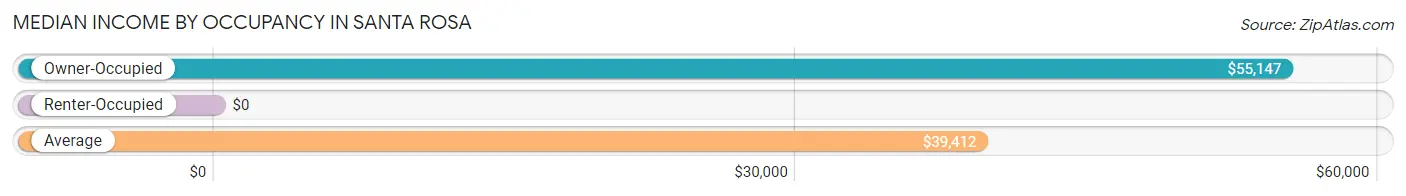
| Occupancy Type | # Households | Median Income |
| Owner-Occupied | 86 (79.6%) | $55,147 |
| Renter-Occupied | 22 (20.4%) | $0 |
| Average | 108 (100.0%) | $39,412 |
Occupancy by Householder Income Bracket in Santa Rosa
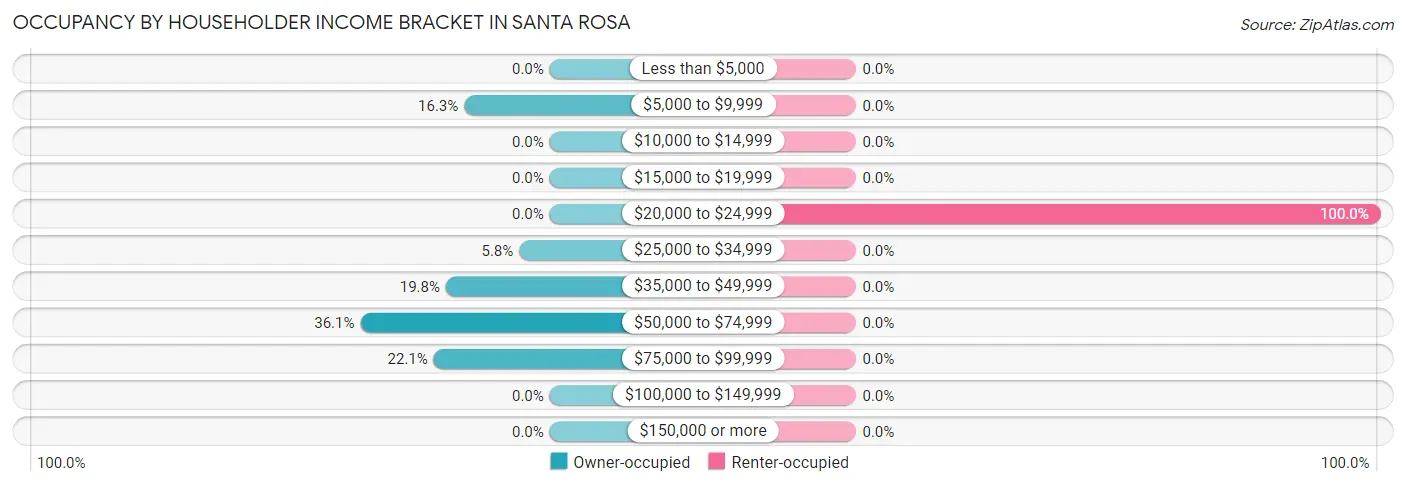
| Income Bracket | Owner-occupied | Renter-occupied |
| Less than $5,000 | 0 (0.0%) | 0 (0.0%) |
| $5,000 to $9,999 | 14 (16.3%) | 0 (0.0%) |
| $10,000 to $14,999 | 0 (0.0%) | 0 (0.0%) |
| $15,000 to $19,999 | 0 (0.0%) | 0 (0.0%) |
| $20,000 to $24,999 | 0 (0.0%) | 22 (100.0%) |
| $25,000 to $34,999 | 5 (5.8%) | 0 (0.0%) |
| $35,000 to $49,999 | 17 (19.8%) | 0 (0.0%) |
| $50,000 to $74,999 | 31 (36.0%) | 0 (0.0%) |
| $75,000 to $99,999 | 19 (22.1%) | 0 (0.0%) |
| $100,000 to $149,999 | 0 (0.0%) | 0 (0.0%) |
| $150,000 or more | 0 (0.0%) | 0 (0.0%) |
| Total | 86 (100.0%) | 22 (100.0%) |
Monthly Housing Cost Tiers in Santa Rosa
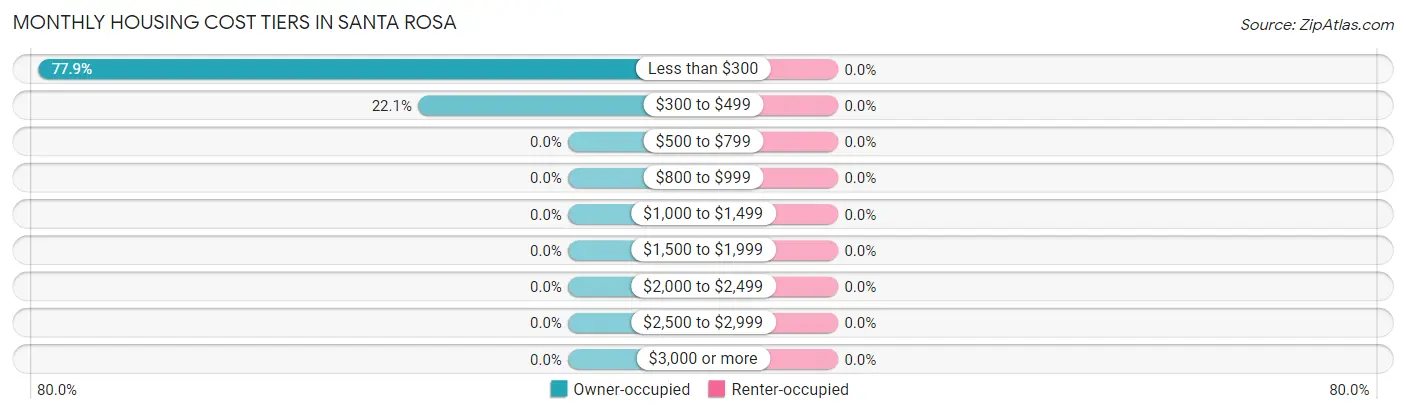
| Monthly Cost | Owner-occupied | Renter-occupied |
| Less than $300 | 67 (77.9%) | 0 (0.0%) |
| $300 to $499 | 19 (22.1%) | 0 (0.0%) |
| $500 to $799 | 0 (0.0%) | 0 (0.0%) |
| $800 to $999 | 0 (0.0%) | 0 (0.0%) |
| $1,000 to $1,499 | 0 (0.0%) | 0 (0.0%) |
| $1,500 to $1,999 | 0 (0.0%) | 0 (0.0%) |
| $2,000 to $2,499 | 0 (0.0%) | 0 (0.0%) |
| $2,500 to $2,999 | 0 (0.0%) | 0 (0.0%) |
| $3,000 or more | 0 (0.0%) | 0 (0.0%) |
| Total | 86 (100.0%) | 22 (100.0%) |
Physical Housing Characteristics in Santa Rosa
Housing Structures in Santa Rosa
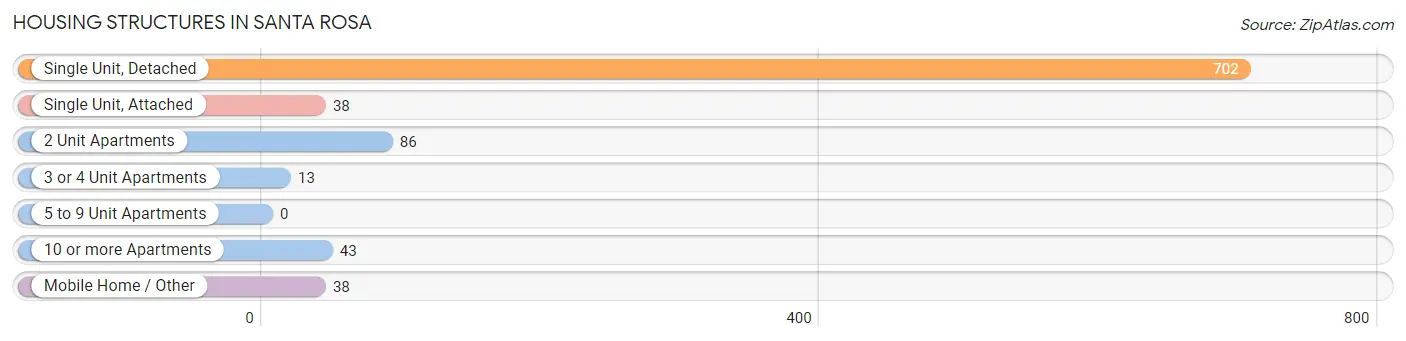
| Structure Type | # Housing Units | % Housing Units |
| Single Unit, Detached | 702 | 76.3% |
| Single Unit, Attached | 38 | 4.1% |
| 2 Unit Apartments | 86 | 9.3% |
| 3 or 4 Unit Apartments | 13 | 1.4% |
| 5 to 9 Unit Apartments | 0 | 0.0% |
| 10 or more Apartments | 43 | 4.7% |
| Mobile Home / Other | 38 | 4.1% |
| Total | 920 | 100.0% |
Housing Structures by Occupancy in Santa Rosa
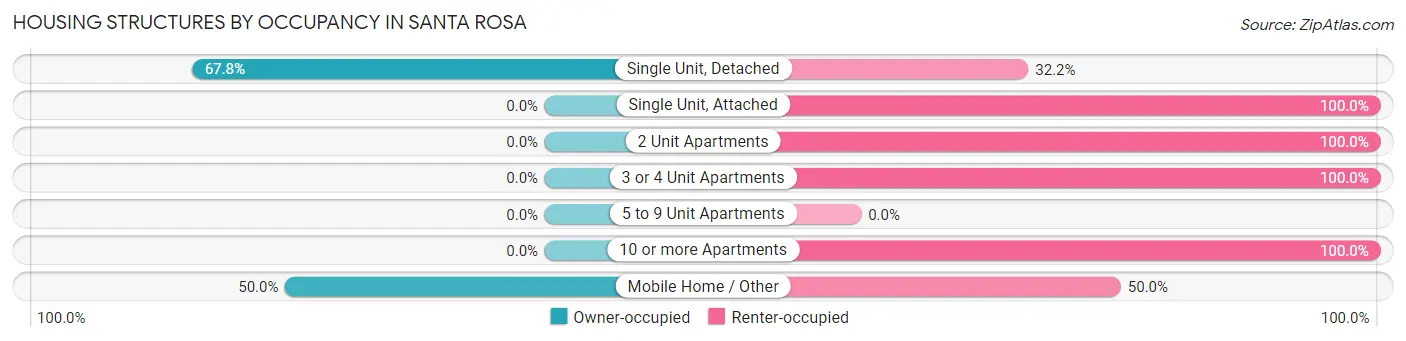
| Structure Type | Owner-occupied | Renter-occupied |
| Single Unit, Detached | 476 (67.8%) | 226 (32.2%) |
| Single Unit, Attached | 0 (0.0%) | 38 (100.0%) |
| 2 Unit Apartments | 0 (0.0%) | 86 (100.0%) |
| 3 or 4 Unit Apartments | 0 (0.0%) | 13 (100.0%) |
| 5 to 9 Unit Apartments | 0 (0.0%) | 0 (0.0%) |
| 10 or more Apartments | 0 (0.0%) | 43 (100.0%) |
| Mobile Home / Other | 19 (50.0%) | 19 (50.0%) |
| Total | 495 (53.8%) | 425 (46.2%) |
Housing Structures by Number of Rooms in Santa Rosa
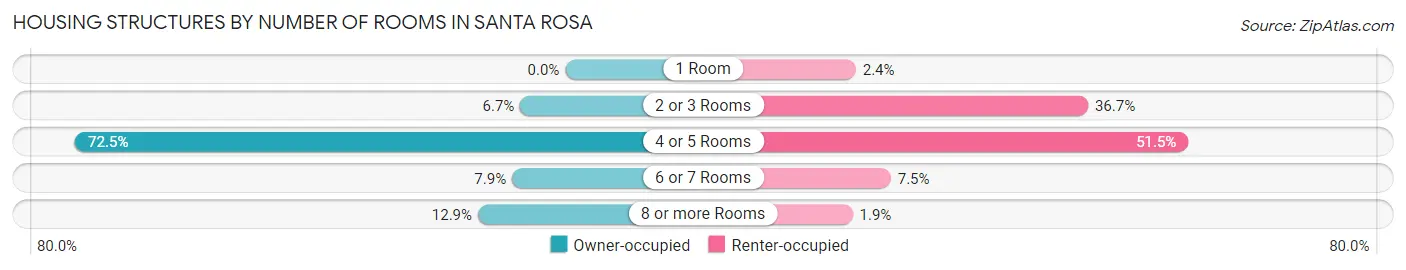
| Number of Rooms | Owner-occupied | Renter-occupied |
| 1 Room | 0 (0.0%) | 10 (2.4%) |
| 2 or 3 Rooms | 33 (6.7%) | 156 (36.7%) |
| 4 or 5 Rooms | 359 (72.5%) | 219 (51.5%) |
| 6 or 7 Rooms | 39 (7.9%) | 32 (7.5%) |
| 8 or more Rooms | 64 (12.9%) | 8 (1.9%) |
| Total | 495 (100.0%) | 425 (100.0%) |
Housing Structure by Heating Type in Santa Rosa
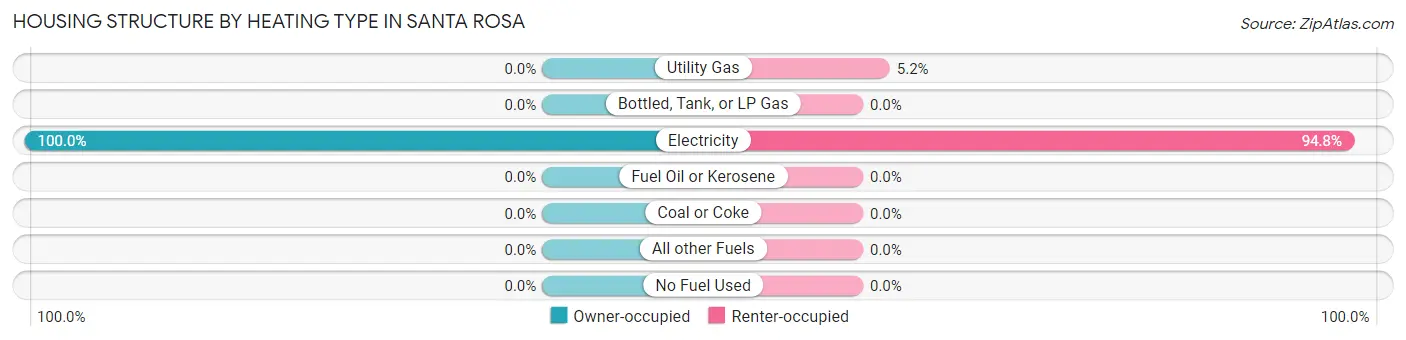
| Heating Type | Owner-occupied | Renter-occupied |
| Utility Gas | 0 (0.0%) | 22 (5.2%) |
| Bottled, Tank, or LP Gas | 0 (0.0%) | 0 (0.0%) |
| Electricity | 495 (100.0%) | 403 (94.8%) |
| Fuel Oil or Kerosene | 0 (0.0%) | 0 (0.0%) |
| Coal or Coke | 0 (0.0%) | 0 (0.0%) |
| All other Fuels | 0 (0.0%) | 0 (0.0%) |
| No Fuel Used | 0 (0.0%) | 0 (0.0%) |
| Total | 495 (100.0%) | 425 (100.0%) |
Household Vehicle Usage in Santa Rosa
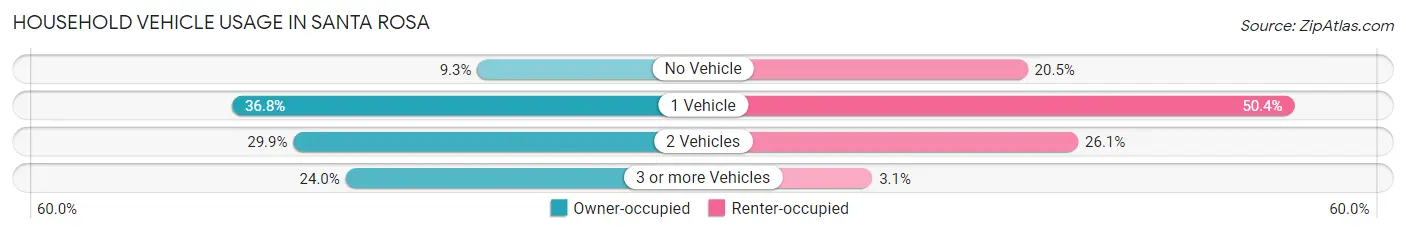
| Vehicles per Household | Owner-occupied | Renter-occupied |
| No Vehicle | 46 (9.3%) | 87 (20.5%) |
| 1 Vehicle | 182 (36.8%) | 214 (50.3%) |
| 2 Vehicles | 148 (29.9%) | 111 (26.1%) |
| 3 or more Vehicles | 119 (24.0%) | 13 (3.1%) |
| Total | 495 (100.0%) | 425 (100.0%) |
Real Estate & Mortgages in Santa Rosa
Real Estate and Mortgage Overview in Santa Rosa
| Characteristic | Without Mortgage | With Mortgage |
| Housing Units | 417 | 0 |
| Median Property Value | $49,700 | $0 |
| Median Household Income | $37,813 | $0 |
| Monthly Housing Costs | $345 | $0 |
| Real Estate Taxes | $846 | $0 |
Property Value by Mortgage Status in Santa Rosa
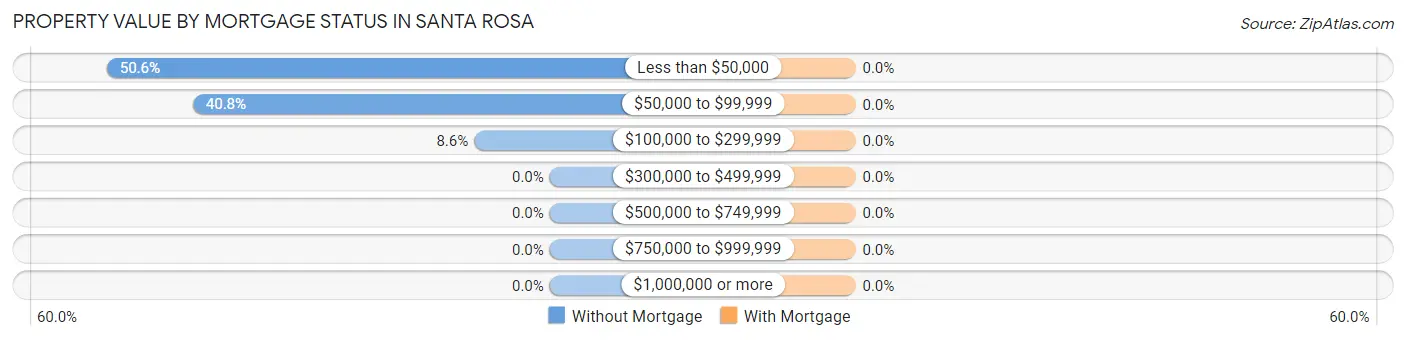
| Property Value | Without Mortgage | With Mortgage |
| Less than $50,000 | 211 (50.6%) | 0 (0.0%) |
| $50,000 to $99,999 | 170 (40.8%) | 0 (0.0%) |
| $100,000 to $299,999 | 36 (8.6%) | 0 (0.0%) |
| $300,000 to $499,999 | 0 (0.0%) | 0 (0.0%) |
| $500,000 to $749,999 | 0 (0.0%) | 0 (0.0%) |
| $750,000 to $999,999 | 0 (0.0%) | 0 (0.0%) |
| $1,000,000 or more | 0 (0.0%) | 0 (0.0%) |
| Total | 417 (100.0%) | 0 (0.0%) |
Household Income by Mortgage Status in Santa Rosa
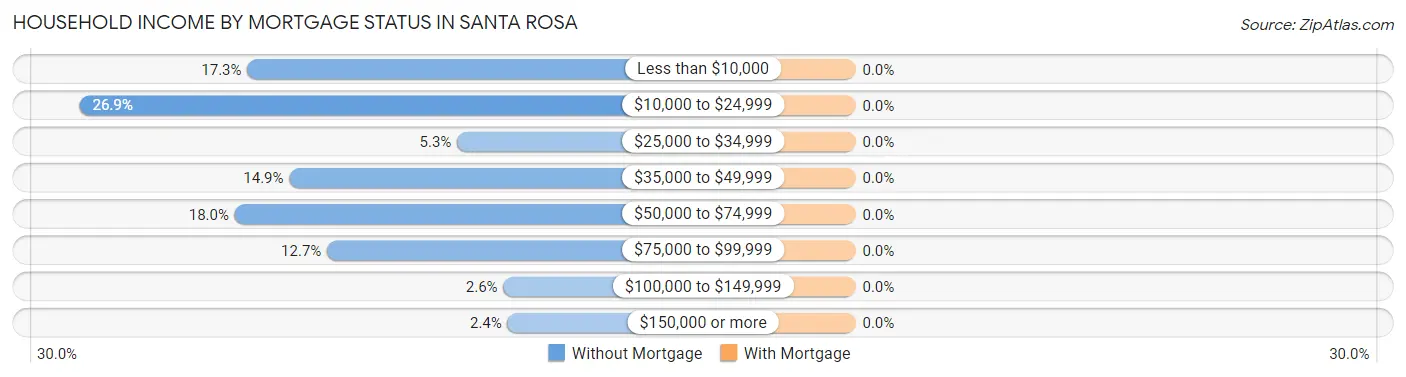
| Household Income | Without Mortgage | With Mortgage |
| Less than $10,000 | 72 (17.3%) | 0 (0.0%) |
| $10,000 to $24,999 | 112 (26.9%) | 0 (0.0%) |
| $25,000 to $34,999 | 22 (5.3%) | 0 (0.0%) |
| $35,000 to $49,999 | 62 (14.9%) | 0 (0.0%) |
| $50,000 to $74,999 | 75 (18.0%) | 0 (0.0%) |
| $75,000 to $99,999 | 53 (12.7%) | 0 (0.0%) |
| $100,000 to $149,999 | 11 (2.6%) | 0 (0.0%) |
| $150,000 or more | 10 (2.4%) | 0 (0.0%) |
| Total | 417 (100.0%) | 0 (0.0%) |
Property Value to Household Income Ratio in Santa Rosa
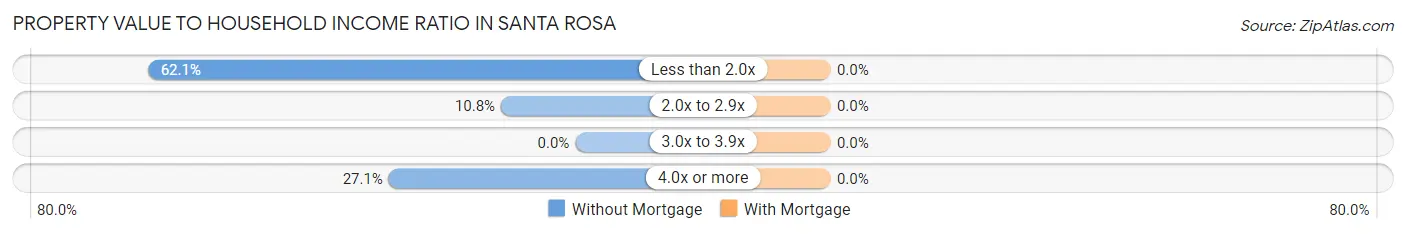
| Value-to-Income Ratio | Without Mortgage | With Mortgage |
| Less than 2.0x | 259 (62.1%) | 0 (0.0%) |
| 2.0x to 2.9x | 45 (10.8%) | 0 (0.0%) |
| 3.0x to 3.9x | 0 (0.0%) | 0 (0.0%) |
| 4.0x or more | 113 (27.1%) | 0 (0.0%) |
| Total | 417 (100.0%) | 0 (0.0%) |
Real Estate Taxes by Mortgage Status in Santa Rosa
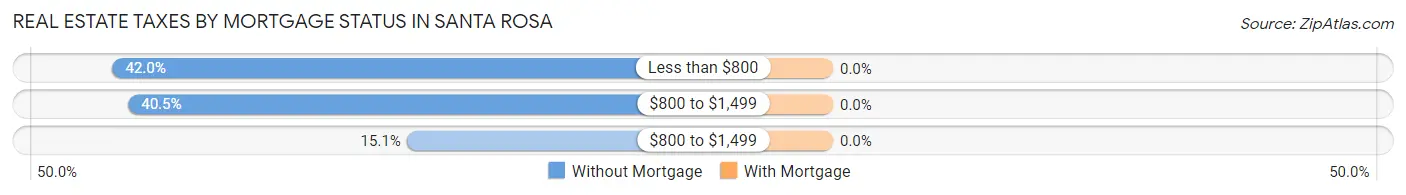
| Property Taxes | Without Mortgage | With Mortgage |
| Less than $800 | 175 (42.0%) | 0 (0.0%) |
| $800 to $1,499 | 169 (40.5%) | 0 (0.0%) |
| $800 to $1,499 | 63 (15.1%) | 0 (0.0%) |
| Total | 417 (100.0%) | 0 (0.0%) |
Health & Disability in Santa Rosa
Health Insurance Coverage by Age in Santa Rosa
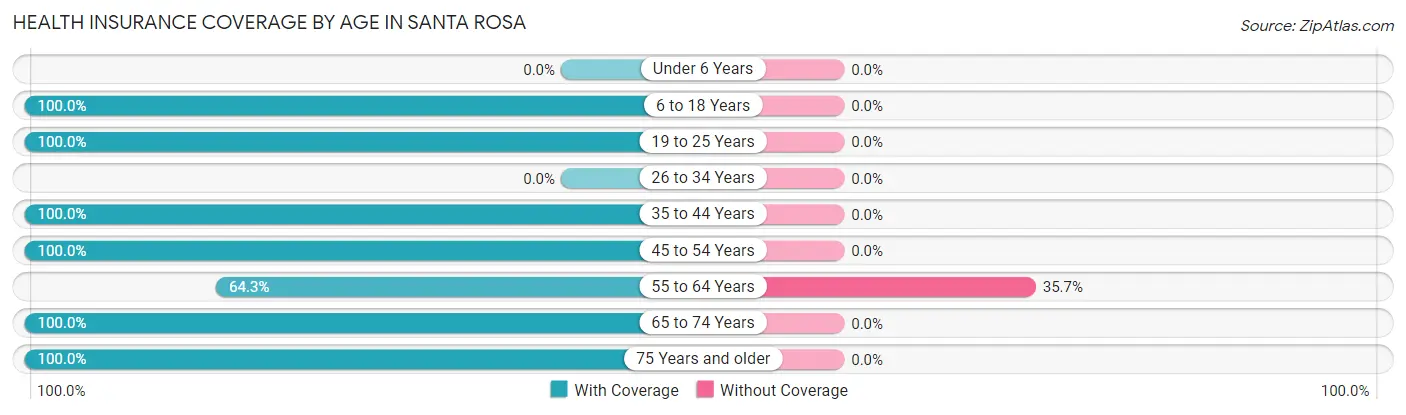
| Age Bracket | With Coverage | Without Coverage |
| Under 6 Years | 0 (0.0%) | 0 (0.0%) |
| 6 to 18 Years | 127 (100.0%) | 0 (0.0%) |
| 19 to 25 Years | 57 (100.0%) | 0 (0.0%) |
| 26 to 34 Years | 0 (0.0%) | 0 (0.0%) |
| 35 to 44 Years | 76 (100.0%) | 0 (0.0%) |
| 45 to 54 Years | 40 (100.0%) | 0 (0.0%) |
| 55 to 64 Years | 9 (64.3%) | 5 (35.7%) |
| 65 to 74 Years | 44 (100.0%) | 0 (0.0%) |
| 75 Years and older | 28 (100.0%) | 0 (0.0%) |
| Total | 381 (98.7%) | 5 (1.3%) |
Health Insurance Coverage by Citizenship Status in Santa Rosa
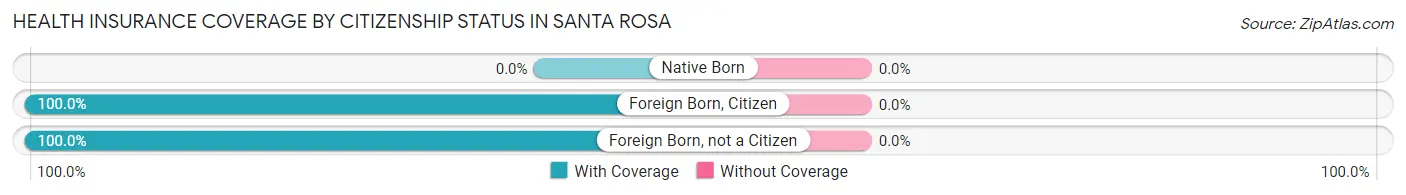
| Citizenship Status | With Coverage | Without Coverage |
| Native Born | 0 (0.0%) | 0 (0.0%) |
| Foreign Born, Citizen | 127 (100.0%) | 0 (0.0%) |
| Foreign Born, not a Citizen | 57 (100.0%) | 0 (0.0%) |
Health Insurance Coverage by Household Income in Santa Rosa
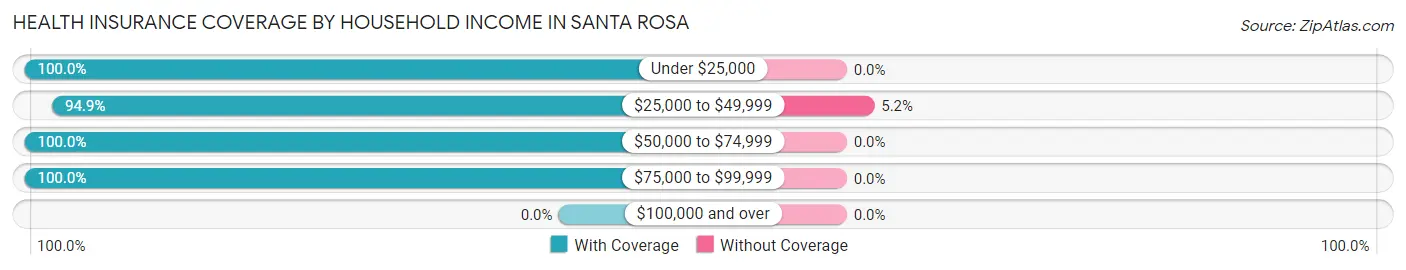
| Household Income | With Coverage | Without Coverage |
| Under $25,000 | 175 (100.0%) | 0 (0.0%) |
| $25,000 to $49,999 | 92 (94.9%) | 5 (5.1%) |
| $50,000 to $74,999 | 95 (100.0%) | 0 (0.0%) |
| $75,000 to $99,999 | 19 (100.0%) | 0 (0.0%) |
| $100,000 and over | 0 (0.0%) | 0 (0.0%) |
Public vs Private Health Insurance Coverage by Age in Santa Rosa
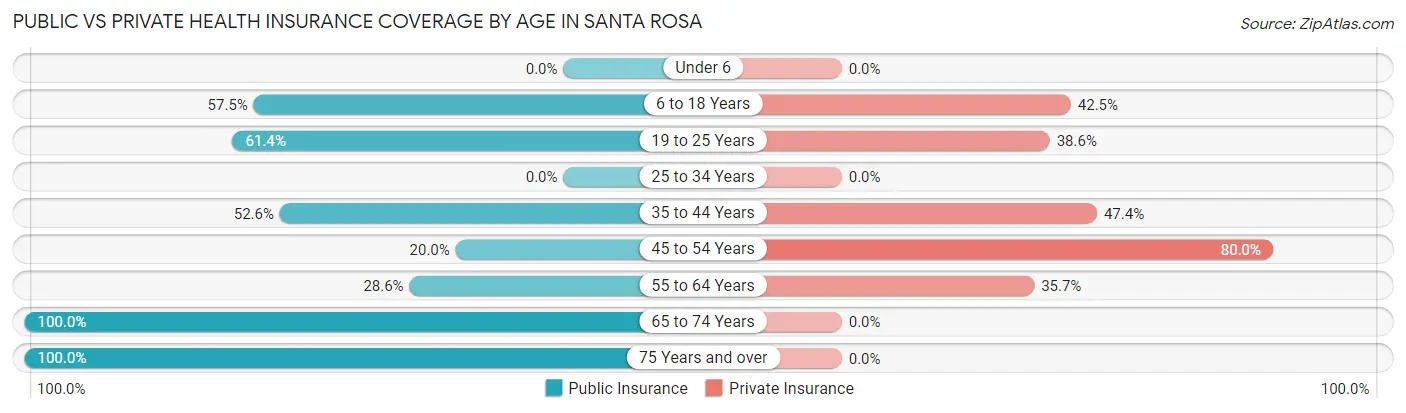
| Age Bracket | Public Insurance | Private Insurance |
| Under 6 | 0 (0.0%) | 0 (0.0%) |
| 6 to 18 Years | 73 (57.5%) | 54 (42.5%) |
| 19 to 25 Years | 35 (61.4%) | 22 (38.6%) |
| 25 to 34 Years | 0 (0.0%) | 0 (0.0%) |
| 35 to 44 Years | 40 (52.6%) | 36 (47.4%) |
| 45 to 54 Years | 8 (20.0%) | 32 (80.0%) |
| 55 to 64 Years | 4 (28.6%) | 5 (35.7%) |
| 65 to 74 Years | 44 (100.0%) | 0 (0.0%) |
| 75 Years and over | 28 (100.0%) | 0 (0.0%) |
| Total | 232 (60.1%) | 149 (38.6%) |
Disability Status by Sex by Age in Santa Rosa
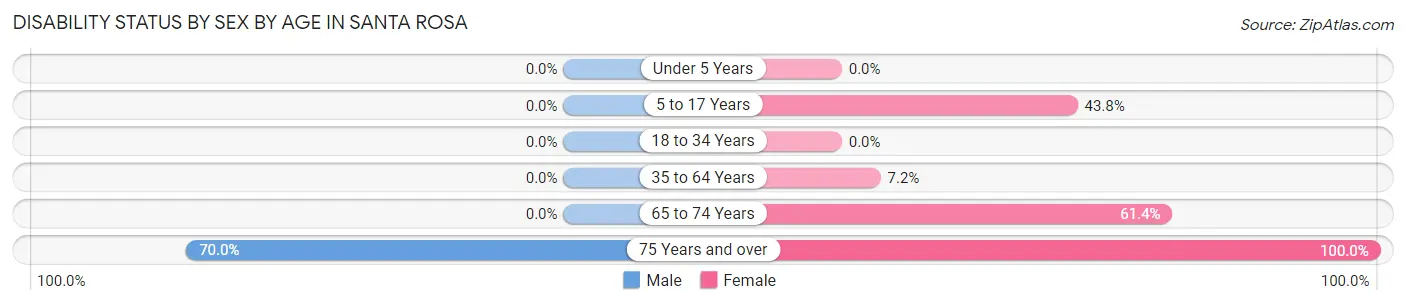
| Age Bracket | Male | Female |
| Under 5 Years | 0 (0.0%) | 0 (0.0%) |
| 5 to 17 Years | 0 (0.0%) | 28 (43.8%) |
| 18 to 34 Years | 0 (0.0%) | 0 (0.0%) |
| 35 to 64 Years | 0 (0.0%) | 9 (7.2%) |
| 65 to 74 Years | 0 (0.0%) | 27 (61.4%) |
| 75 Years and over | 14 (70.0%) | 8 (100.0%) |
Disability Class by Sex by Age in Santa Rosa
Disability Class: Hearing Difficulty
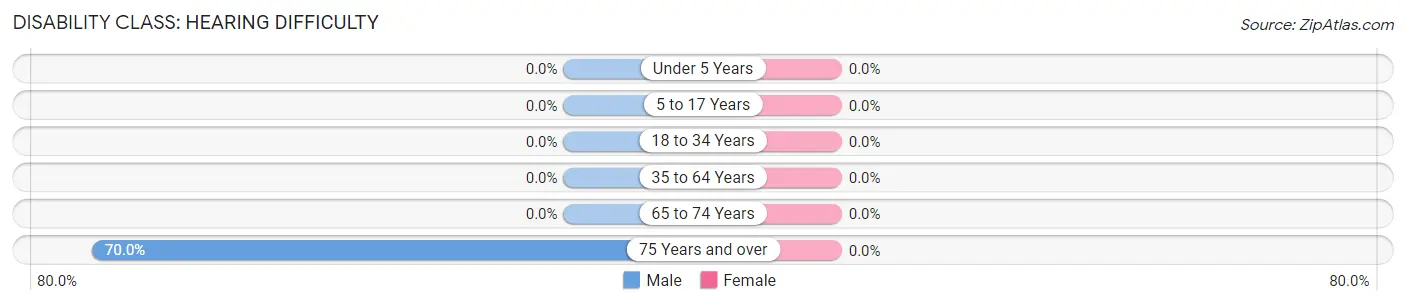
| Age Bracket | Male | Female |
| Under 5 Years | 0 (0.0%) | 0 (0.0%) |
| 5 to 17 Years | 0 (0.0%) | 0 (0.0%) |
| 18 to 34 Years | 0 (0.0%) | 0 (0.0%) |
| 35 to 64 Years | 0 (0.0%) | 0 (0.0%) |
| 65 to 74 Years | 0 (0.0%) | 0 (0.0%) |
| 75 Years and over | 14 (70.0%) | 0 (0.0%) |
Disability Class: Vision Difficulty
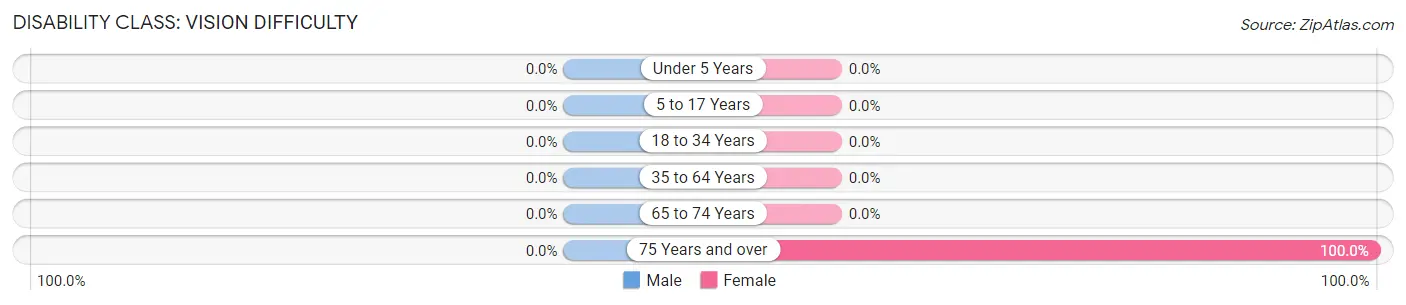
| Age Bracket | Male | Female |
| Under 5 Years | 0 (0.0%) | 0 (0.0%) |
| 5 to 17 Years | 0 (0.0%) | 0 (0.0%) |
| 18 to 34 Years | 0 (0.0%) | 0 (0.0%) |
| 35 to 64 Years | 0 (0.0%) | 0 (0.0%) |
| 65 to 74 Years | 0 (0.0%) | 0 (0.0%) |
| 75 Years and over | 0 (0.0%) | 8 (100.0%) |
Disability Class: Cognitive Difficulty
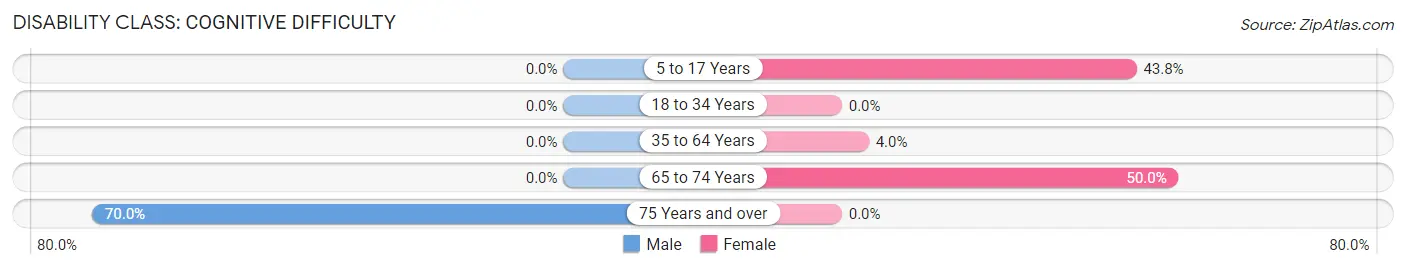
| Age Bracket | Male | Female |
| 5 to 17 Years | 0 (0.0%) | 28 (43.8%) |
| 18 to 34 Years | 0 (0.0%) | 0 (0.0%) |
| 35 to 64 Years | 0 (0.0%) | 5 (4.0%) |
| 65 to 74 Years | 0 (0.0%) | 22 (50.0%) |
| 75 Years and over | 14 (70.0%) | 0 (0.0%) |
Disability Class: Ambulatory Difficulty
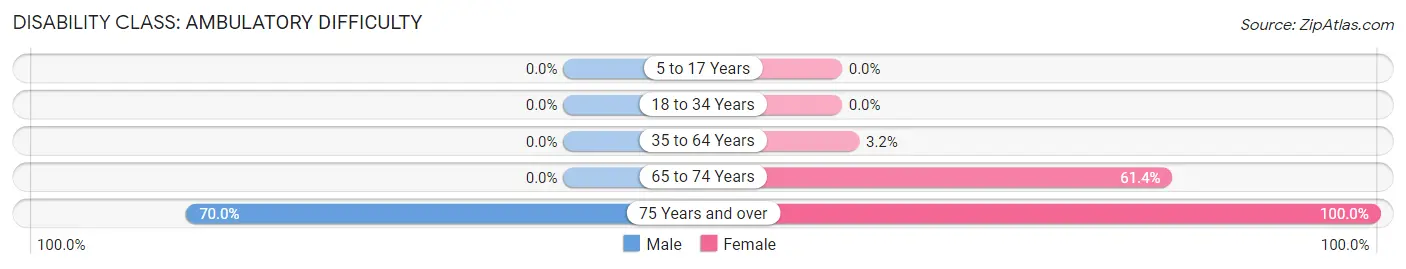
| Age Bracket | Male | Female |
| 5 to 17 Years | 0 (0.0%) | 0 (0.0%) |
| 18 to 34 Years | 0 (0.0%) | 0 (0.0%) |
| 35 to 64 Years | 0 (0.0%) | 4 (3.2%) |
| 65 to 74 Years | 0 (0.0%) | 27 (61.4%) |
| 75 Years and over | 14 (70.0%) | 8 (100.0%) |
Disability Class: Self-Care Difficulty
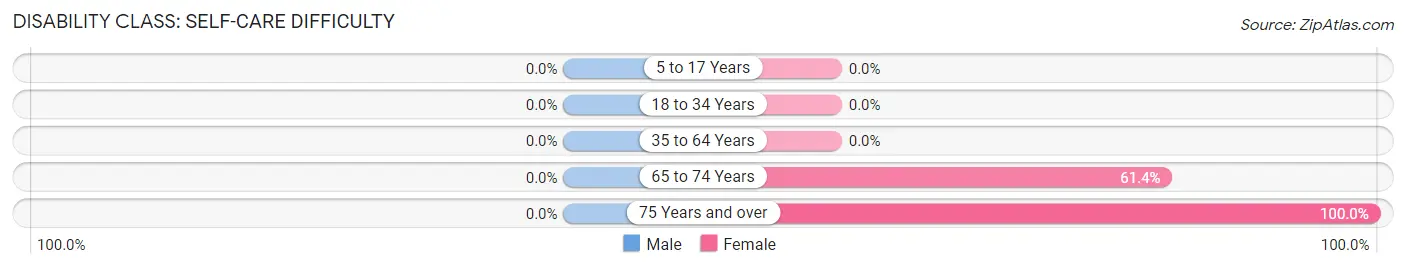
| Age Bracket | Male | Female |
| 5 to 17 Years | 0 (0.0%) | 0 (0.0%) |
| 18 to 34 Years | 0 (0.0%) | 0 (0.0%) |
| 35 to 64 Years | 0 (0.0%) | 0 (0.0%) |
| 65 to 74 Years | 0 (0.0%) | 27 (61.4%) |
| 75 Years and over | 0 (0.0%) | 8 (100.0%) |
Technology Access in Santa Rosa
Computing Device Access in Santa Rosa
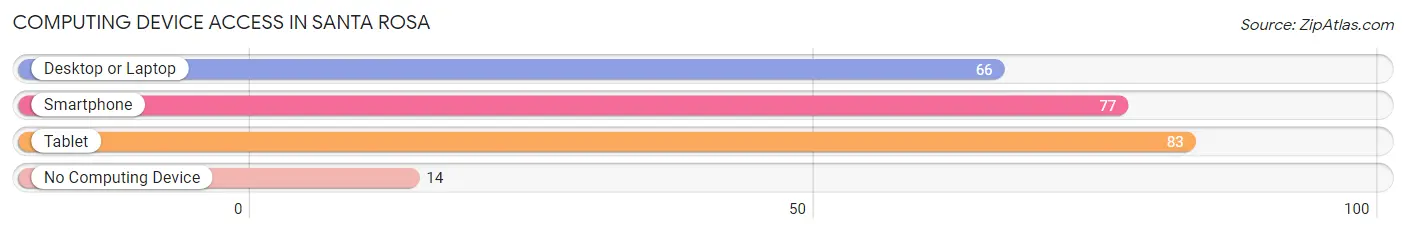
| Device Type | # Households | % Households |
| Desktop or Laptop | 66 | 61.1% |
| Smartphone | 77 | 71.3% |
| Tablet | 83 | 76.8% |
| No Computing Device | 14 | 13.0% |
| Total | 108 | 100.0% |
Internet Access in Santa Rosa
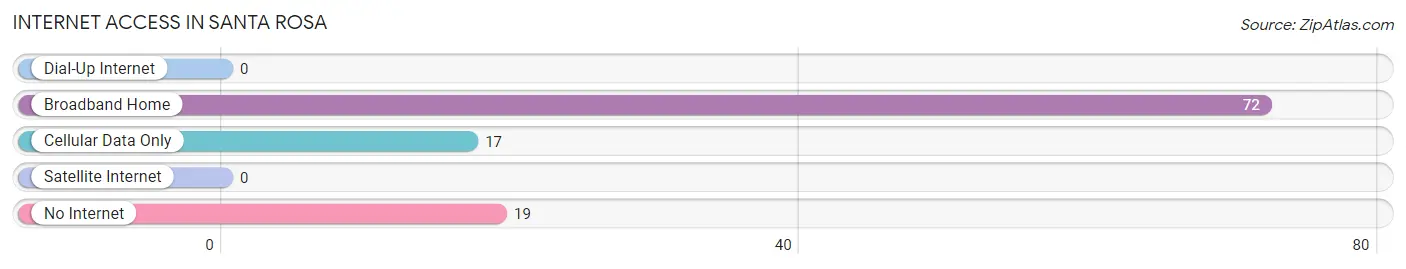
| Internet Type | # Households | % Households |
| Dial-Up Internet | 0 | 0.0% |
| Broadband Home | 72 | 66.7% |
| Cellular Data Only | 17 | 15.7% |
| Satellite Internet | 0 | 0.0% |
| No Internet | 19 | 17.6% |
| Total | 108 | 100.0% |
Santa Rosa Summary
Santa Rosa is a small town located in Hidalgo County, Texas. It is situated on the banks of the Rio Grande, just south of the city of McAllen. The town has a population of approximately 1,500 people and is part of the McAllen-Edinburg-Mission Metropolitan Statistical Area.
History
Santa Rosa was founded in 1848 by a group of Mexican settlers who were looking for a place to settle and farm. The town was named after the nearby Santa Rosa de Lima Mission, which was established in 1750. The mission was built by the Spanish to convert the local Native American population to Christianity.
The town grew slowly over the years, but it was not until the early 1900s that it began to experience significant growth. This was due to the arrival of the railroad, which allowed for the transportation of goods and people to and from the area. The railroad also allowed for the development of the local economy, which was largely based on agriculture.
In the 1950s, the town experienced a period of rapid growth due to the influx of Mexican immigrants who were looking for work in the area. This growth continued until the 1980s, when the town began to experience a decline in population due to the economic downturn in the region.
Geography
Santa Rosa is located in the Rio Grande Valley of South Texas. It is situated on the banks of the Rio Grande, just south of the city of McAllen. The town is surrounded by agricultural land, which is used for growing cotton, corn, sorghum, and other crops.
The climate in Santa Rosa is subtropical, with hot summers and mild winters. The average temperature in the summer is around 90 degrees Fahrenheit, while the average temperature in the winter is around 60 degrees Fahrenheit.
Economy
The economy of Santa Rosa is largely based on agriculture. The town is home to several large farms, which produce cotton, corn, sorghum, and other crops. The town also has a number of small businesses, including restaurants, grocery stores, and other retail establishments.
The town is also home to a number of manufacturing companies, which produce a variety of products, including furniture, clothing, and electronics.
Demographics
As of the 2010 census, the population of Santa Rosa was 1,500. The racial makeup of the town was 94.7% Hispanic or Latino, 4.3% White, and 0.7% Other. The median household income was $25,000, and the median age was 28.
The town is served by the Santa Rosa Independent School District, which includes two elementary schools, one middle school, and one high school. The town is also home to a branch of South Texas College, which offers a variety of degree and certificate programs.
Conclusion
Santa Rosa is a small town located in Hidalgo County, Texas. It is situated on the banks of the Rio Grande, just south of the city of McAllen. The town has a population of approximately 1,500 people and is part of the McAllen-Edinburg-Mission Metropolitan Statistical Area. The economy of Santa Rosa is largely based on agriculture, and the town is home to several large farms, as well as a number of small businesses and manufacturing companies. The town is served by the Santa Rosa Independent School District, and is home to a branch of South Texas College.
Common Questions
What is Per Capita Income in Santa Rosa?
Per Capita income in Santa Rosa is $14,215.
What is the Median Family Income in Santa Rosa?
Median Family Income in Santa Rosa is $39,044.
What is the Median Household income in Santa Rosa?
Median Household Income in Santa Rosa is $39,412.
What is Income or Wage Gap in Santa Rosa?
Income or Wage Gap in Santa Rosa is 48.8%.
Women in Santa Rosa earn 51.2 cents for every dollar earned by a man.
What is Inequality or Gini Index in Santa Rosa?
Inequality or Gini Index in Santa Rosa is 0.30.
What is the Total Population of Santa Rosa?
Total Population of Santa Rosa is 386.
What is the Total Male Population of Santa Rosa?
Total Male Population of Santa Rosa is 116.
What is the Total Female Population of Santa Rosa?
Total Female Population of Santa Rosa is 270.
What is the Ratio of Males per 100 Females in Santa Rosa?
There are 42.96 Males per 100 Females in Santa Rosa.
What is the Ratio of Females per 100 Males in Santa Rosa?
There are 232.76 Females per 100 Males in Santa Rosa.
What is the Median Population Age in Santa Rosa?
Median Population Age in Santa Rosa is 35.5 Years.
What is the Average Family Size in Santa Rosa
Average Family Size in Santa Rosa is 4.7 People.
What is the Average Household Size in Santa Rosa
Average Household Size in Santa Rosa is 3.6 People.
How Large is the Labor Force in Santa Rosa?
There are 199 People in the Labor Forcein in Santa Rosa.
What is the Percentage of People in the Labor Force in Santa Rosa?
69.1% of People are in the Labor Force in Santa Rosa.