Mila Doce, TX Map & Demographics
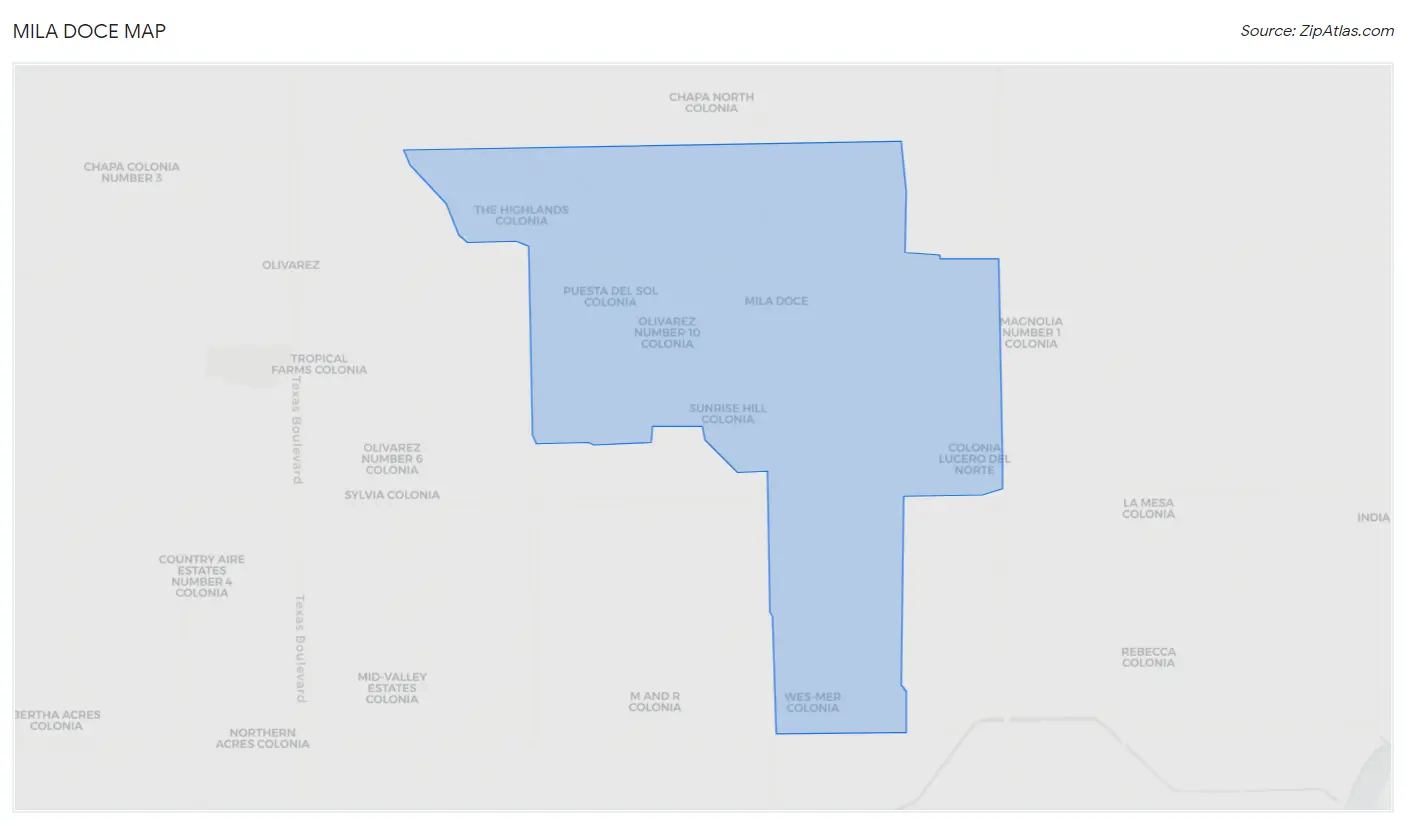
Mila Doce Map
Mila Doce Overview
$11,138
PER CAPITA INCOME
$36,997
AVG FAMILY INCOME
$39,247
AVG HOUSEHOLD INCOME
41.8%
WAGE / INCOME GAP [ % ]
58.2¢/ $1
WAGE / INCOME GAP [ $ ]
$14,507
FAMILY INCOME DEFICIT
0.43
INEQUALITY / GINI INDEX
7,554
TOTAL POPULATION
3,567
MALE POPULATION
3,987
FEMALE POPULATION
89.47
MALES / 100 FEMALES
111.77
FEMALES / 100 MALES
19.8
MEDIAN AGE
5.3
AVG FAMILY SIZE
5.0
AVG HOUSEHOLD SIZE
2,745
LABOR FORCE [ PEOPLE ]
60.4%
PERCENT IN LABOR FORCE
6.4%
UNEMPLOYMENT RATE
Income in Mila Doce
Income Overview in Mila Doce
Per Capita Income in Mila Doce is $11,138, while median incomes of families and households are $36,997 and $39,247 respectively.
| Characteristic | Number | Measure |
| Per Capita Income | 7,554 | $11,138 |
| Median Family Income | 1,371 | $36,997 |
| Mean Family Income | 1,371 | $52,460 |
| Median Household Income | 1,520 | $39,247 |
| Mean Household Income | 1,520 | $52,209 |
| Income Deficit | 1,371 | $14,507 |
| Wage / Income Gap (%) | 7,554 | 41.78% |
| Wage / Income Gap ($) | 7,554 | 58.22¢ per $1 |
| Gini / Inequality Index | 7,554 | 0.43 |
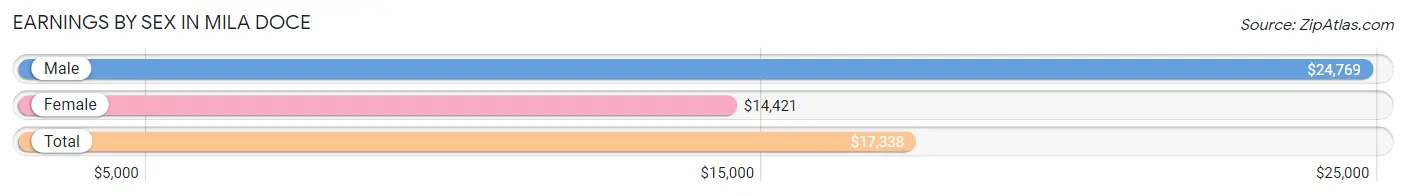
Earnings by Sex in Mila Doce
Average Earnings in Mila Doce are $17,338, $24,769 for men and $14,421 for women, a difference of 41.8%.
| Sex | Number | Average Earnings |
| Male | 1,611 (57.4%) | $24,769 |
| Female | 1,194 (42.6%) | $14,421 |
| Total | 2,805 (100.0%) | $17,338 |
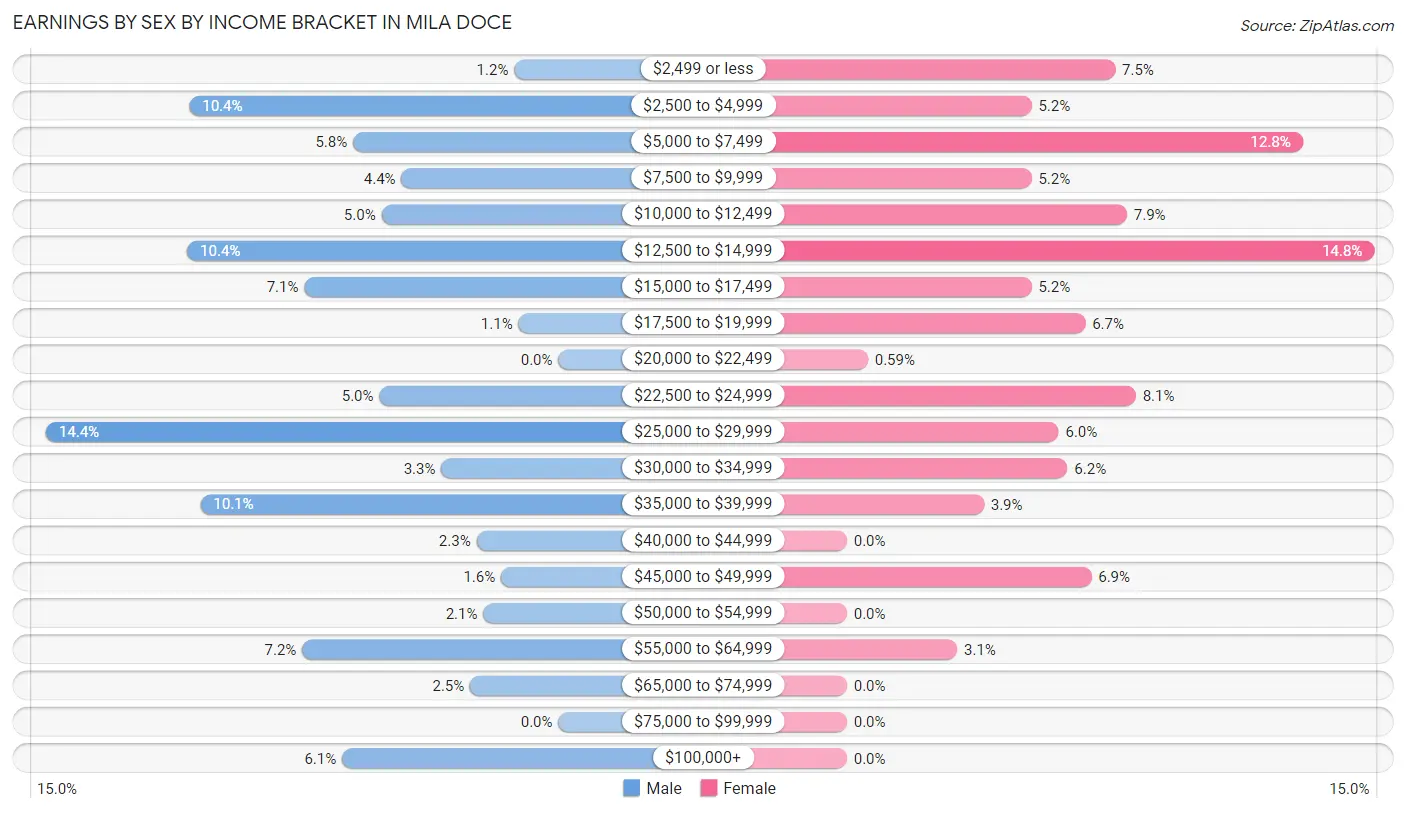
Earnings by Sex by Income Bracket in Mila Doce
The most common earnings brackets in Mila Doce are $25,000 to $29,999 for men (232 | 14.4%) and $12,500 to $14,999 for women (177 | 14.8%).
| Income | Male | Female |
| $2,499 or less | 20 (1.2%) | 90 (7.5%) |
| $2,500 to $4,999 | 167 (10.4%) | 62 (5.2%) |
| $5,000 to $7,499 | 93 (5.8%) | 153 (12.8%) |
| $7,500 to $9,999 | 71 (4.4%) | 62 (5.2%) |
| $10,000 to $12,499 | 80 (5.0%) | 94 (7.9%) |
| $12,500 to $14,999 | 168 (10.4%) | 177 (14.8%) |
| $15,000 to $17,499 | 115 (7.1%) | 62 (5.2%) |
| $17,500 to $19,999 | 18 (1.1%) | 80 (6.7%) |
| $20,000 to $22,499 | 0 (0.0%) | 7 (0.6%) |
| $22,500 to $24,999 | 81 (5.0%) | 97 (8.1%) |
| $25,000 to $29,999 | 232 (14.4%) | 71 (5.9%) |
| $30,000 to $34,999 | 53 (3.3%) | 74 (6.2%) |
| $35,000 to $39,999 | 162 (10.1%) | 46 (3.8%) |
| $40,000 to $44,999 | 37 (2.3%) | 0 (0.0%) |
| $45,000 to $49,999 | 26 (1.6%) | 82 (6.9%) |
| $50,000 to $54,999 | 34 (2.1%) | 0 (0.0%) |
| $55,000 to $64,999 | 116 (7.2%) | 37 (3.1%) |
| $65,000 to $74,999 | 40 (2.5%) | 0 (0.0%) |
| $75,000 to $99,999 | 0 (0.0%) | 0 (0.0%) |
| $100,000+ | 98 (6.1%) | 0 (0.0%) |
| Total | 1,611 (100.0%) | 1,194 (100.0%) |
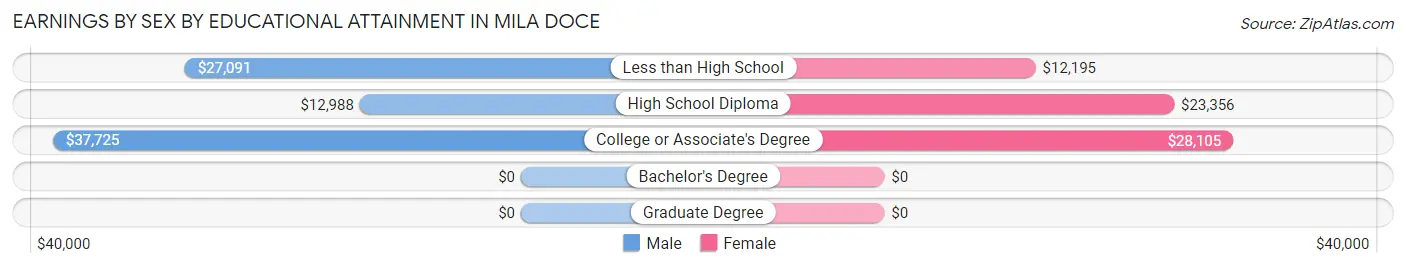
Earnings by Sex by Educational Attainment in Mila Doce
Average earnings in Mila Doce are $27,969 for men and $19,375 for women, a difference of 30.7%. Men with an educational attainment of college or associate's degree enjoy the highest average annual earnings of $37,725, while those with high school diploma education earn the least with $12,988. Women with an educational attainment of college or associate's degree earn the most with the average annual earnings of $28,105, while those with less than high school education have the smallest earnings of $12,195.
| Educational Attainment | Male Income | Female Income |
| Less than High School | $27,091 | $12,195 |
| High School Diploma | $12,988 | $23,356 |
| College or Associate's Degree | $37,725 | $28,105 |
| Bachelor's Degree | - | - |
| Graduate Degree | - | - |
| Total | $27,969 | $19,375 |
Family Income in Mila Doce
Family Income Brackets in Mila Doce
According to the Mila Doce family income data, there are 304 families falling into the $25,000 to $34,999 income range, which is the most common income bracket and makes up 22.2% of all families. Conversely, the $100,000 to $149,999 income bracket is the least frequent group with only 19 families (1.4%) belonging to this category.
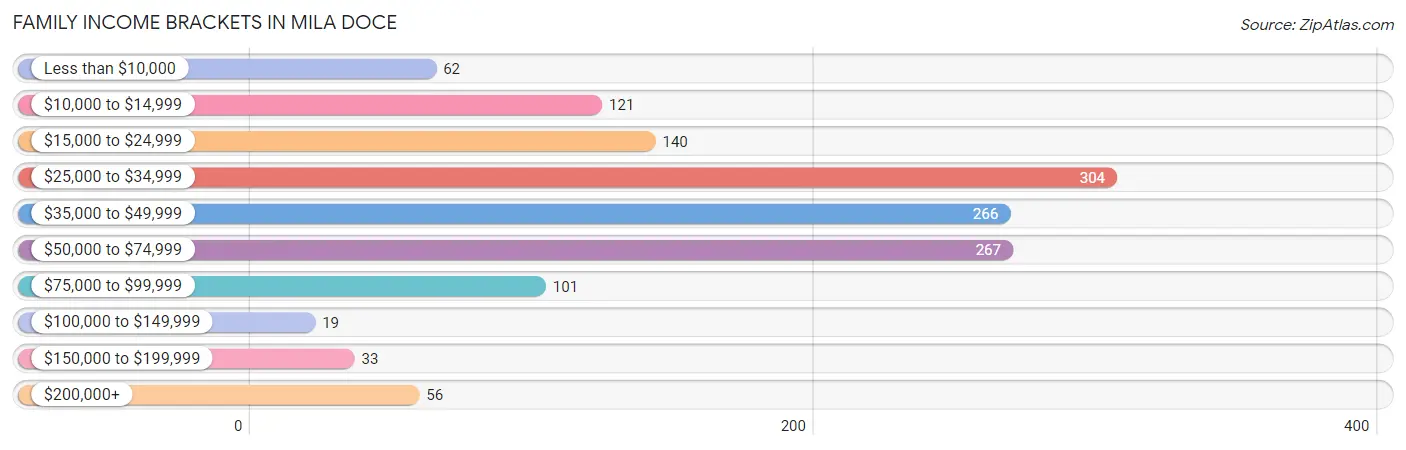
| Income Bracket | # Families | % Families |
| Less than $10,000 | 62 | 4.5% |
| $10,000 to $14,999 | 121 | 8.8% |
| $15,000 to $24,999 | 140 | 10.2% |
| $25,000 to $34,999 | 304 | 22.2% |
| $35,000 to $49,999 | 266 | 19.4% |
| $50,000 to $74,999 | 267 | 19.5% |
| $75,000 to $99,999 | 101 | 7.4% |
| $100,000 to $149,999 | 19 | 1.4% |
| $150,000 to $199,999 | 33 | 2.4% |
| $200,000+ | 56 | 4.1% |
Family Income by Famaliy Size in Mila Doce
5-person families (232 | 16.9%) account for the highest median family income in Mila Doce with $49,400 per family, while 2-person families (167 | 12.2%) have the highest median income of $13,534 per family member.
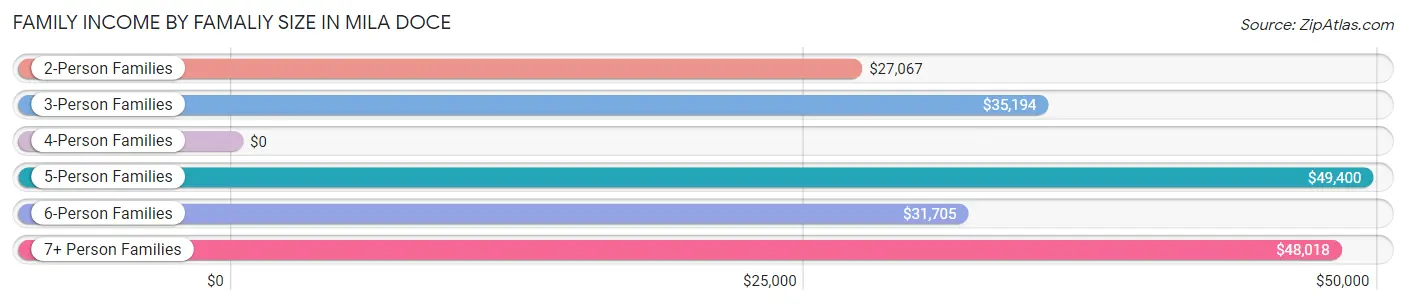
| Income Bracket | # Families | Median Income |
| 2-Person Families | 167 (12.2%) | $27,067 |
| 3-Person Families | 235 (17.1%) | $35,194 |
| 4-Person Families | 305 (22.3%) | $0 |
| 5-Person Families | 232 (16.9%) | $49,400 |
| 6-Person Families | 111 (8.1%) | $31,705 |
| 7+ Person Families | 321 (23.4%) | $48,018 |
| Total | 1,371 (100.0%) | $36,997 |
Family Income by Number of Earners in Mila Doce
The median family income in Mila Doce is $36,997, with families comprising 3+ earners (310) having the highest median family income of $72,067, while families with no earners (149) have the lowest median family income of $14,417, accounting for 22.6% and 10.9% of families, respectively.
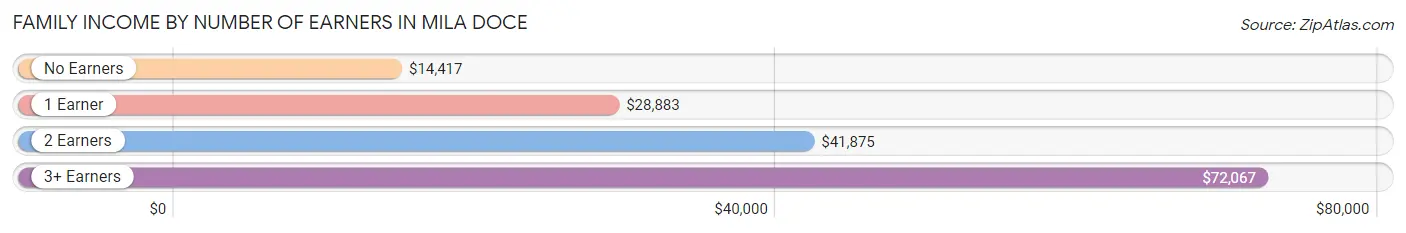
| Number of Earners | # Families | Median Income |
| No Earners | 149 (10.9%) | $14,417 |
| 1 Earner | 449 (32.8%) | $28,883 |
| 2 Earners | 463 (33.8%) | $41,875 |
| 3+ Earners | 310 (22.6%) | $72,067 |
| Total | 1,371 (100.0%) | $36,997 |
Household Income in Mila Doce
Household Income Brackets in Mila Doce
With 306 households falling in the category, the $25,000 to $34,999 income range is the most frequent in Mila Doce, accounting for 20.1% of all households. In contrast, only 20 households (1.3%) fall into the $100,000 to $149,999 income bracket, making it the least populous group.
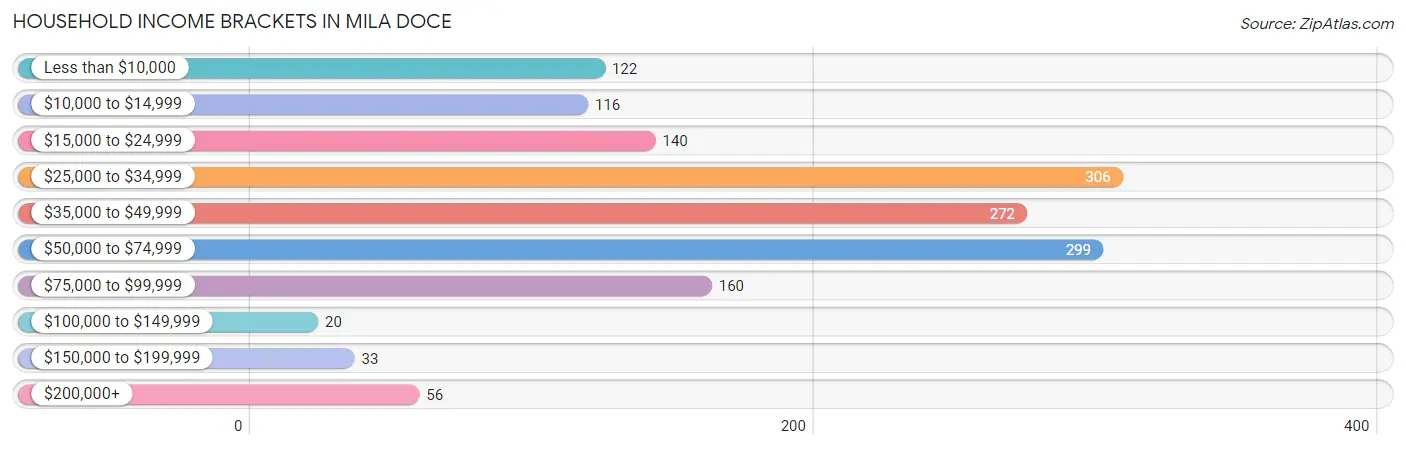
| Income Bracket | # Households | % Households |
| Less than $10,000 | 122 | 8.0% |
| $10,000 to $14,999 | 116 | 7.6% |
| $15,000 to $24,999 | 140 | 9.2% |
| $25,000 to $34,999 | 306 | 20.1% |
| $35,000 to $49,999 | 272 | 17.9% |
| $50,000 to $74,999 | 299 | 19.7% |
| $75,000 to $99,999 | 160 | 10.5% |
| $100,000 to $149,999 | 20 | 1.3% |
| $150,000 to $199,999 | 33 | 2.2% |
| $200,000+ | 56 | 3.7% |
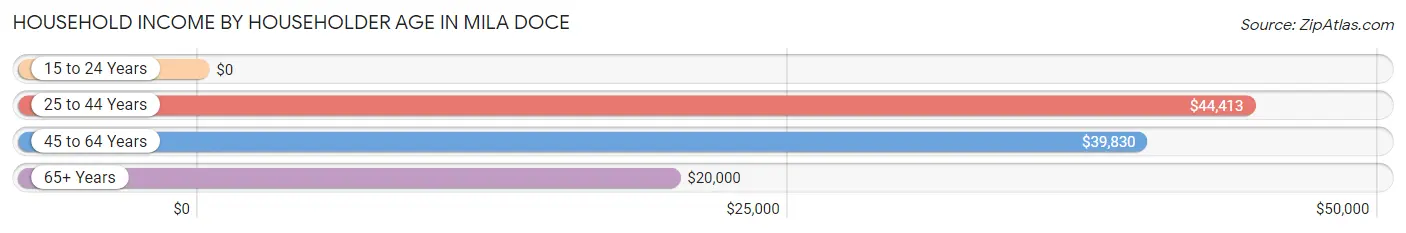
Household Income by Householder Age in Mila Doce
The median household income in Mila Doce is $39,247, with the highest median household income of $44,413 found in the 25 to 44 years age bracket for the primary householder. A total of 733 households (48.2%) fall into this category.
| Income Bracket | # Households | Median Income |
| 15 to 24 Years | 0 (0.0%) | $0 |
| 25 to 44 Years | 733 (48.2%) | $44,413 |
| 45 to 64 Years | 623 (41.0%) | $39,830 |
| 65+ Years | 164 (10.8%) | $20,000 |
| Total | 1,520 (100.0%) | $39,247 |
Poverty in Mila Doce
Income Below Poverty by Sex and Age in Mila Doce
With 33.0% poverty level for males and 44.2% for females among the residents of Mila Doce, 15 year old males and 12 to 14 year old females are the most vulnerable to poverty, with 49 males (50.0%) and 272 females (89.2%) in their respective age groups living below the poverty level.
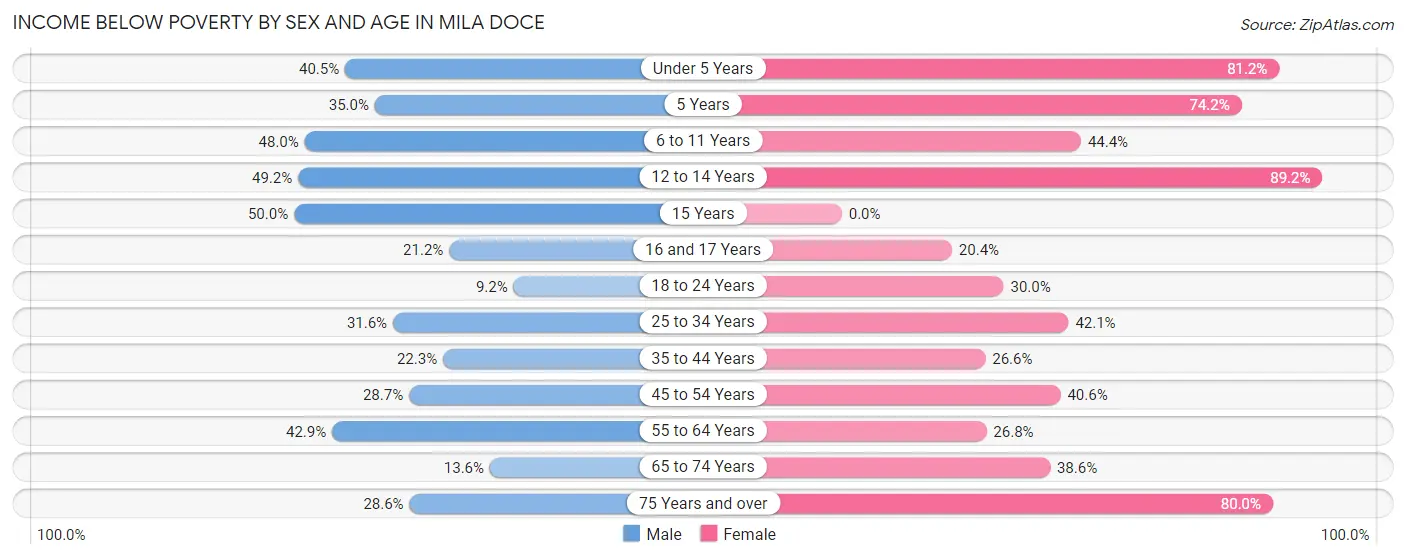
| Age Bracket | Male | Female |
| Under 5 Years | 141 (40.5%) | 233 (81.2%) |
| 5 Years | 14 (35.0%) | 46 (74.2%) |
| 6 to 11 Years | 305 (48.0%) | 388 (44.4%) |
| 12 to 14 Years | 161 (49.2%) | 272 (89.2%) |
| 15 Years | 49 (50.0%) | 0 (0.0%) |
| 16 and 17 Years | 53 (21.2%) | 28 (20.4%) |
| 18 to 24 Years | 34 (9.2%) | 176 (30.0%) |
| 25 to 34 Years | 149 (31.6%) | 167 (42.1%) |
| 35 to 44 Years | 109 (22.3%) | 142 (26.6%) |
| 45 to 54 Years | 55 (28.6%) | 110 (40.6%) |
| 55 to 64 Years | 70 (42.9%) | 91 (26.8%) |
| 65 to 74 Years | 15 (13.6%) | 34 (38.6%) |
| 75 Years and over | 22 (28.6%) | 60 (80.0%) |
| Total | 1,177 (33.0%) | 1,747 (44.2%) |
Income Above Poverty by Sex and Age in Mila Doce
According to the poverty statistics in Mila Doce, males aged 18 to 24 years and females aged 16 and 17 years are the age groups that are most secure financially, with 90.8% of males and 79.6% of females in these age groups living above the poverty line.
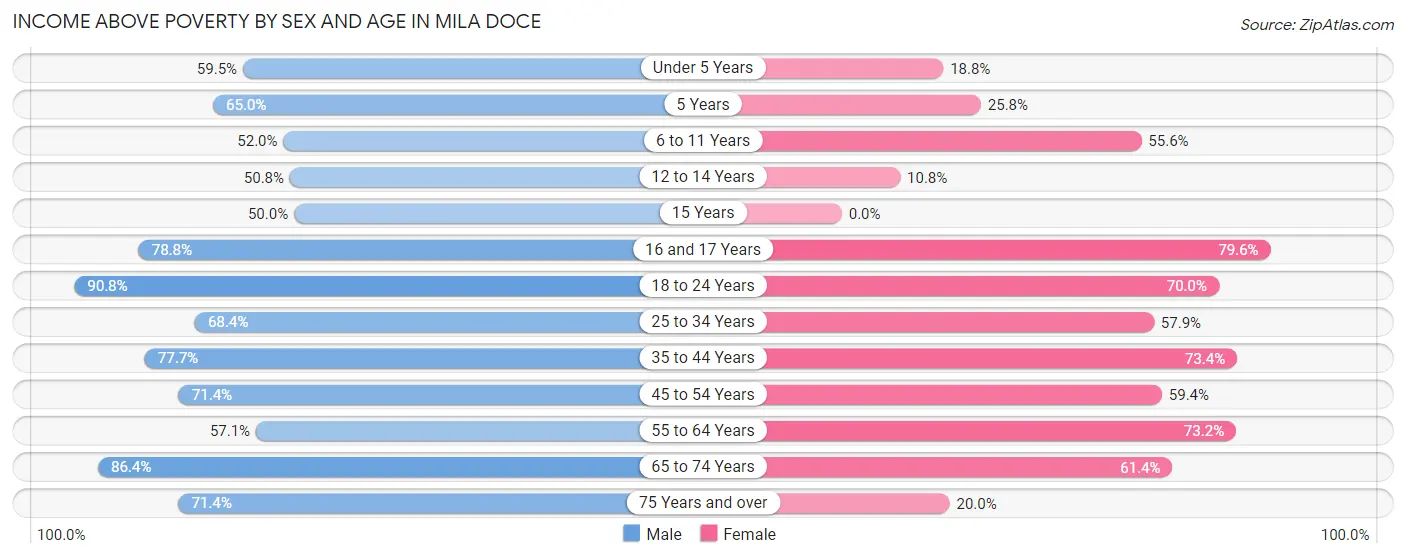
| Age Bracket | Male | Female |
| Under 5 Years | 207 (59.5%) | 54 (18.8%) |
| 5 Years | 26 (65.0%) | 16 (25.8%) |
| 6 to 11 Years | 330 (52.0%) | 486 (55.6%) |
| 12 to 14 Years | 166 (50.8%) | 33 (10.8%) |
| 15 Years | 49 (50.0%) | 0 (0.0%) |
| 16 and 17 Years | 197 (78.8%) | 109 (79.6%) |
| 18 to 24 Years | 334 (90.8%) | 410 (70.0%) |
| 25 to 34 Years | 322 (68.4%) | 230 (57.9%) |
| 35 to 44 Years | 379 (77.7%) | 391 (73.4%) |
| 45 to 54 Years | 137 (71.4%) | 161 (59.4%) |
| 55 to 64 Years | 93 (57.1%) | 248 (73.2%) |
| 65 to 74 Years | 95 (86.4%) | 54 (61.4%) |
| 75 Years and over | 55 (71.4%) | 15 (20.0%) |
| Total | 2,390 (67.0%) | 2,207 (55.8%) |
Income Below Poverty Among Married-Couple Families in Mila Doce
The poverty statistics for married-couple families in Mila Doce show that 33.0% or 284 of the total 862 families live below the poverty line. Families with 5 or more children have the highest poverty rate of 60.2%, comprising of 62 families. On the other hand, families with no children have the lowest poverty rate of 15.0%, which includes 34 families.
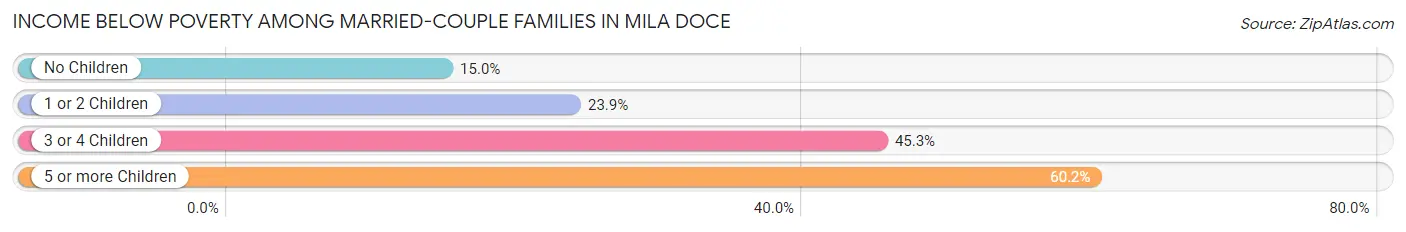
| Children | Above Poverty | Below Poverty |
| No Children | 193 (85.0%) | 34 (15.0%) |
| 1 or 2 Children | 188 (76.1%) | 59 (23.9%) |
| 3 or 4 Children | 156 (54.7%) | 129 (45.3%) |
| 5 or more Children | 41 (39.8%) | 62 (60.2%) |
| Total | 578 (67.0%) | 284 (33.0%) |
Income Below Poverty Among Single-Parent Households in Mila Doce
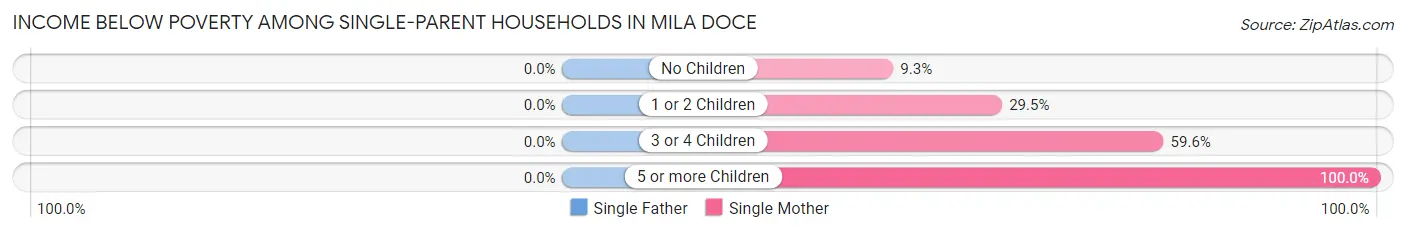
| Children | Single Father | Single Mother |
| No Children | 0 (0.0%) | 5 (9.3%) |
| 1 or 2 Children | 0 (0.0%) | 88 (29.5%) |
| 3 or 4 Children | 0 (0.0%) | 59 (59.6%) |
| 5 or more Children | 0 (0.0%) | 37 (100.0%) |
| Total | 0 (0.0%) | 189 (38.7%) |
Income Below Poverty Among Married-Couple vs Single-Parent Households in Mila Doce
The poverty data for Mila Doce shows that 284 of the married-couple family households (33.0%) and 189 of the single-parent households (37.1%) are living below the poverty level. Within the married-couple family households, those with 5 or more children have the highest poverty rate, with 62 households (60.2%) falling below the poverty line. Among the single-parent households, those with 5 or more children have the highest poverty rate, with 37 household (90.2%) living below poverty.
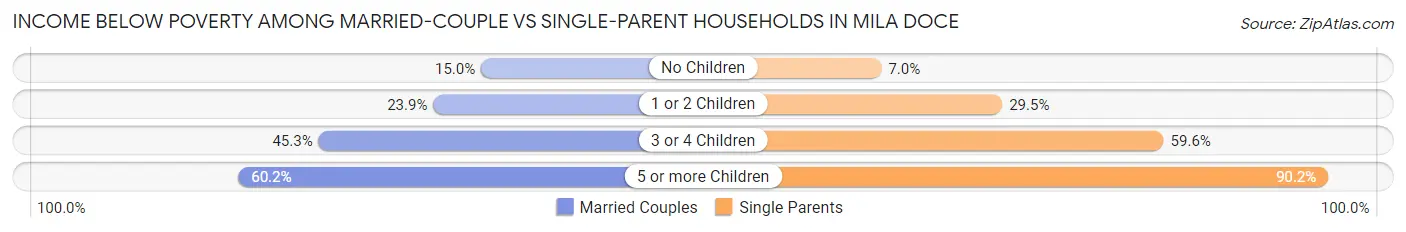
| Children | Married-Couple Families | Single-Parent Households |
| No Children | 34 (15.0%) | 5 (7.0%) |
| 1 or 2 Children | 59 (23.9%) | 88 (29.5%) |
| 3 or 4 Children | 129 (45.3%) | 59 (59.6%) |
| 5 or more Children | 62 (60.2%) | 37 (90.2%) |
| Total | 284 (33.0%) | 189 (37.1%) |
Race in Mila Doce
The most populous races in Mila Doce are Hispanic or Latino (7,403 | 98.0%), White / Caucasian (3,403 | 45.1%), and Two or more Races (3,268 | 43.3%).
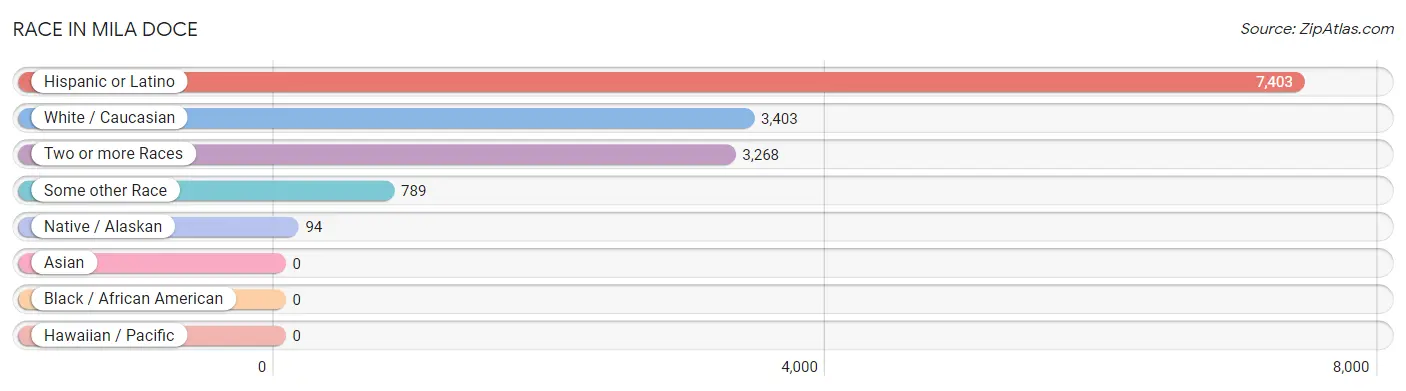
| Race | # Population | % Population |
| Asian | 0 | 0.0% |
| Black / African American | 0 | 0.0% |
| Hawaiian / Pacific | 0 | 0.0% |
| Hispanic or Latino | 7,403 | 98.0% |
| Native / Alaskan | 94 | 1.2% |
| White / Caucasian | 3,403 | 45.1% |
| Two or more Races | 3,268 | 43.3% |
| Some other Race | 789 | 10.4% |
| Total | 7,554 | 100.0% |
Ancestry in Mila Doce
The most populous ancestries reported in Mila Doce are Mexican (6,911 | 91.5%), American (535 | 7.1%), Cherokee (94 | 1.2%), Irish (29 | 0.4%), and Mexican American Indian (24 | 0.3%), together accounting for 100.5% of all Mila Doce residents.
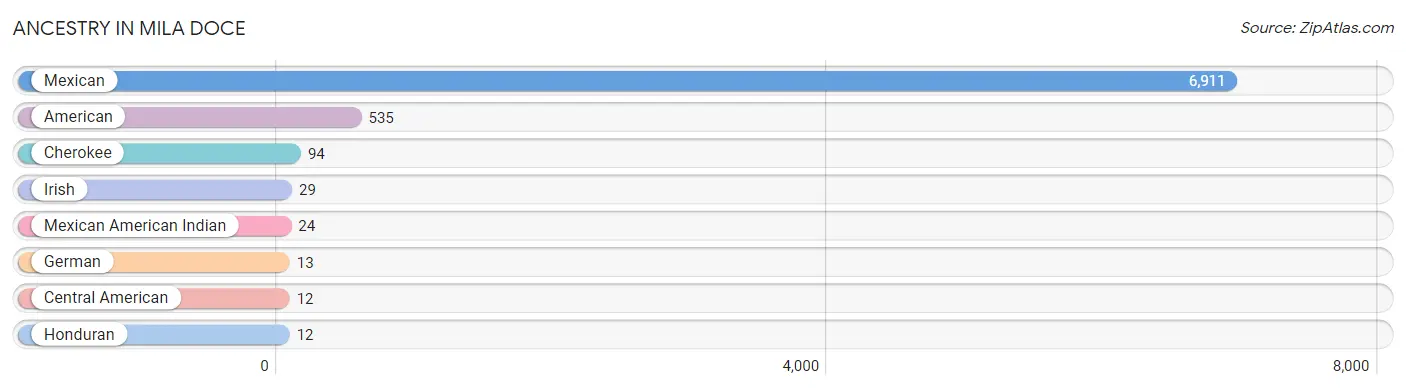
| Ancestry | # Population | % Population |
| American | 535 | 7.1% |
| Central American | 12 | 0.2% |
| Cherokee | 94 | 1.2% |
| German | 13 | 0.2% |
| Honduran | 12 | 0.2% |
| Irish | 29 | 0.4% |
| Mexican | 6,911 | 91.5% |
| Mexican American Indian | 24 | 0.3% | View All 8 Rows |
Immigrants in Mila Doce
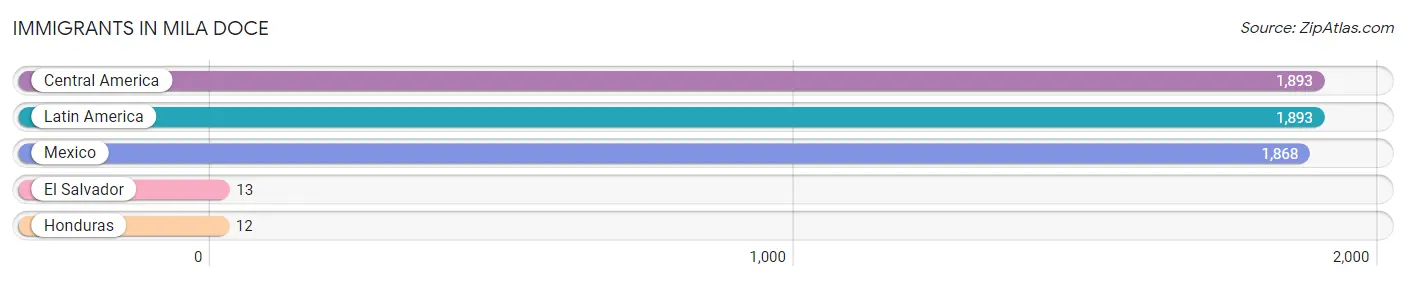
The most numerous immigrant groups reported in Mila Doce came from Central America (1,893 | 25.1%), Latin America (1,893 | 25.1%), Mexico (1,868 | 24.7%), El Salvador (13 | 0.2%), and Honduras (12 | 0.2%), together accounting for 75.2% of all Mila Doce residents.
| Immigration Origin | # Population | % Population |
| Central America | 1,893 | 25.1% |
| El Salvador | 13 | 0.2% |
| Honduras | 12 | 0.2% |
| Latin America | 1,893 | 25.1% |
| Mexico | 1,868 | 24.7% | View All 5 Rows |
Sex and Age in Mila Doce
Sex and Age in Mila Doce
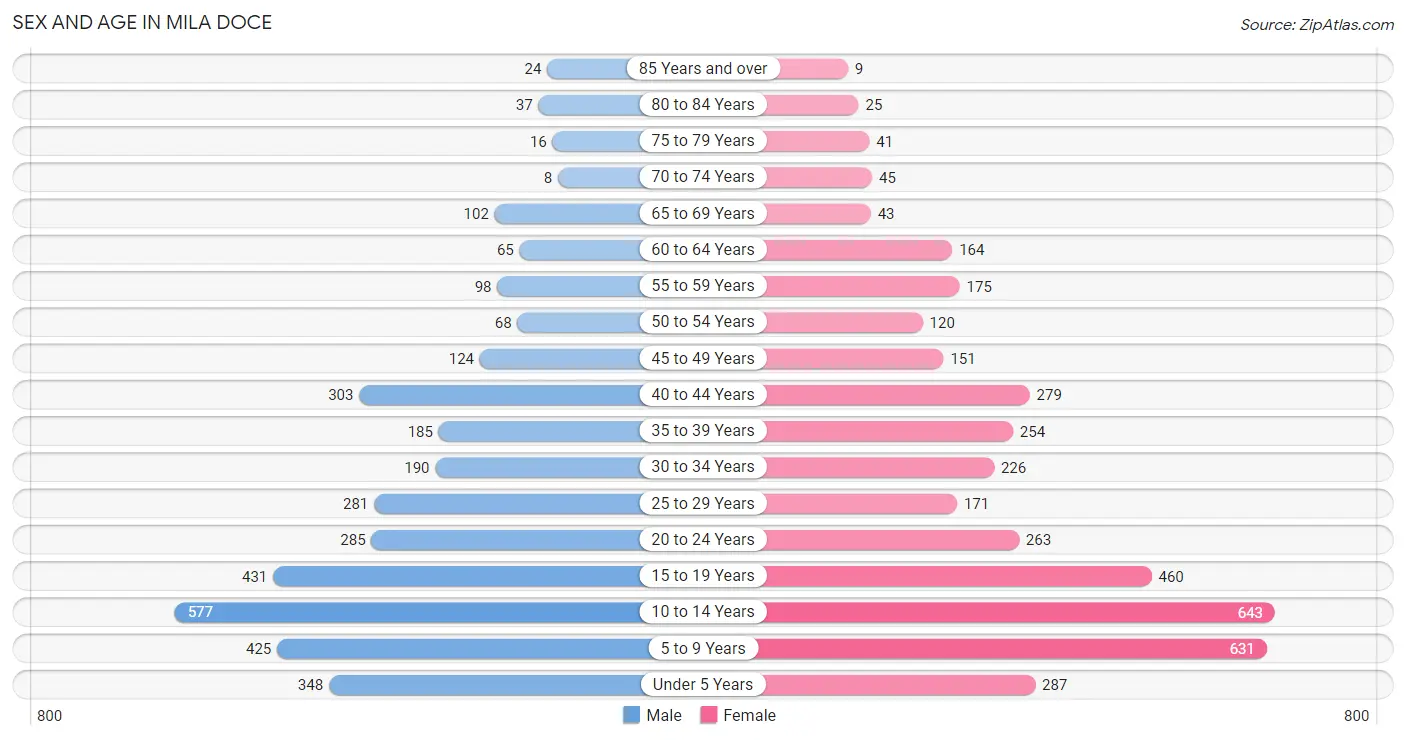
The most populous age groups in Mila Doce are 10 to 14 Years (577 | 16.2%) for men and 10 to 14 Years (643 | 16.1%) for women.
| Age Bracket | Male | Female |
| Under 5 Years | 348 (9.8%) | 287 (7.2%) |
| 5 to 9 Years | 425 (11.9%) | 631 (15.8%) |
| 10 to 14 Years | 577 (16.2%) | 643 (16.1%) |
| 15 to 19 Years | 431 (12.1%) | 460 (11.5%) |
| 20 to 24 Years | 285 (8.0%) | 263 (6.6%) |
| 25 to 29 Years | 281 (7.9%) | 171 (4.3%) |
| 30 to 34 Years | 190 (5.3%) | 226 (5.7%) |
| 35 to 39 Years | 185 (5.2%) | 254 (6.4%) |
| 40 to 44 Years | 303 (8.5%) | 279 (7.0%) |
| 45 to 49 Years | 124 (3.5%) | 151 (3.8%) |
| 50 to 54 Years | 68 (1.9%) | 120 (3.0%) |
| 55 to 59 Years | 98 (2.8%) | 175 (4.4%) |
| 60 to 64 Years | 65 (1.8%) | 164 (4.1%) |
| 65 to 69 Years | 102 (2.9%) | 43 (1.1%) |
| 70 to 74 Years | 8 (0.2%) | 45 (1.1%) |
| 75 to 79 Years | 16 (0.4%) | 41 (1.0%) |
| 80 to 84 Years | 37 (1.0%) | 25 (0.6%) |
| 85 Years and over | 24 (0.7%) | 9 (0.2%) |
| Total | 3,567 (100.0%) | 3,987 (100.0%) |
Families and Households in Mila Doce
Median Family Size in Mila Doce
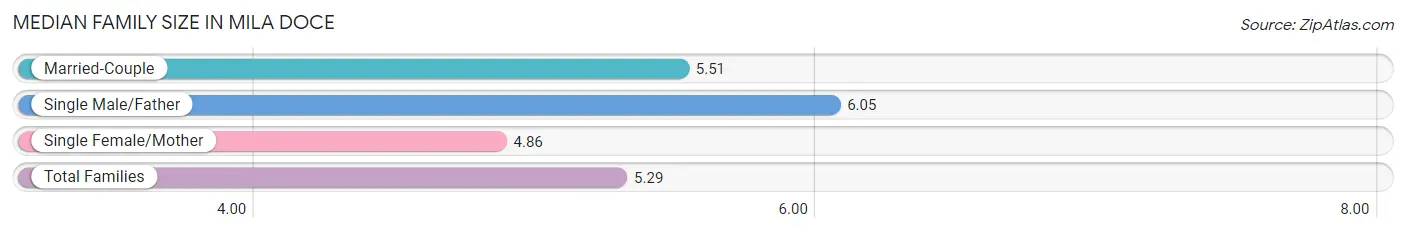
The median family size in Mila Doce is 5.29 persons per family, with single male/father families (21 | 1.5%) accounting for the largest median family size of 6.05 persons per family. On the other hand, single female/mother families (488 | 35.6%) represent the smallest median family size with 4.86 persons per family.
| Family Type | # Families | Family Size |
| Married-Couple | 862 (62.9%) | 5.51 |
| Single Male/Father | 21 (1.5%) | 6.05 |
| Single Female/Mother | 488 (35.6%) | 4.86 |
| Total Families | 1,371 (100.0%) | 5.29 |
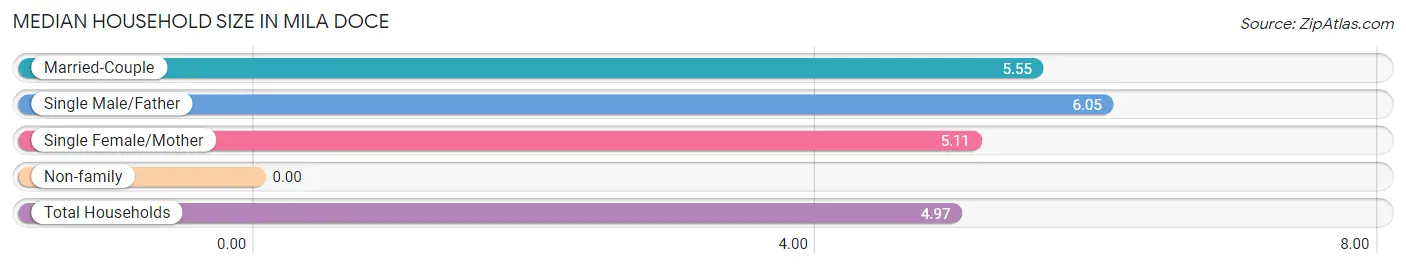
Median Household Size in Mila Doce
| Household Type | # Households | Household Size |
| Married-Couple | 862 (56.7%) | 5.55 |
| Single Male/Father | 21 (1.4%) | 6.05 |
| Single Female/Mother | 488 (32.1%) | 5.11 |
| Non-family | 149 (9.8%) | - |
| Total Households | 1,520 (100.0%) | 4.97 |
Household Size by Marriage Status in Mila Doce
Out of a total of 1,520 households in Mila Doce, 1,371 (90.2%) are family households, while 149 (9.8%) are nonfamily households. The most numerous type of family households are 7+ person households, comprising 321, and the most common type of nonfamily households are 1-person households, comprising 149.
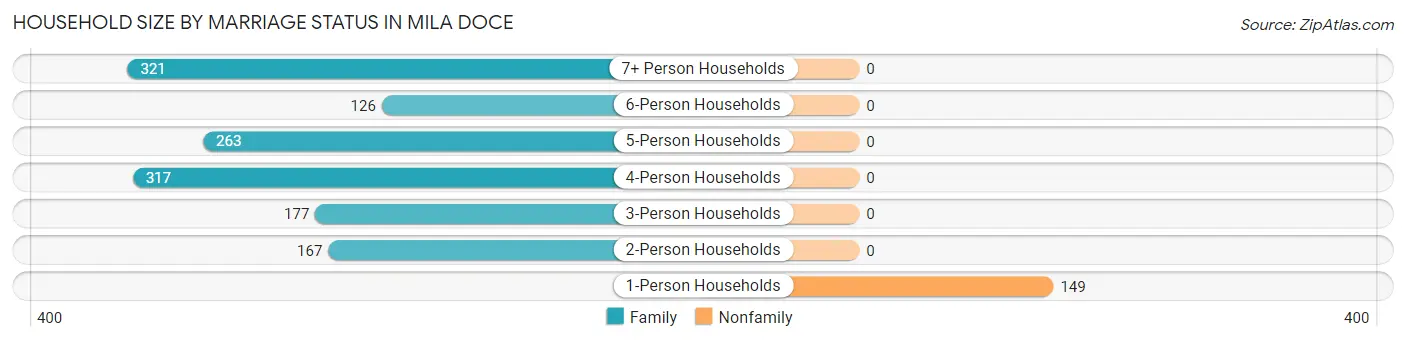
| Household Size | Family Households | Nonfamily Households |
| 1-Person Households | - | 149 (9.8%) |
| 2-Person Households | 167 (11.0%) | 0 (0.0%) |
| 3-Person Households | 177 (11.6%) | 0 (0.0%) |
| 4-Person Households | 317 (20.9%) | 0 (0.0%) |
| 5-Person Households | 263 (17.3%) | 0 (0.0%) |
| 6-Person Households | 126 (8.3%) | 0 (0.0%) |
| 7+ Person Households | 321 (21.1%) | 0 (0.0%) |
| Total | 1,371 (90.2%) | 149 (9.8%) |
Female Fertility in Mila Doce
Fertility by Age in Mila Doce
Average fertility rate in Mila Doce is 56.0 births per 1,000 women. Women in the age bracket of 20 to 34 years have the highest fertility rate with 156.0 births per 1,000 women. Women in the age bracket of 20 to 34 years acount for 100.0% of all women with births.
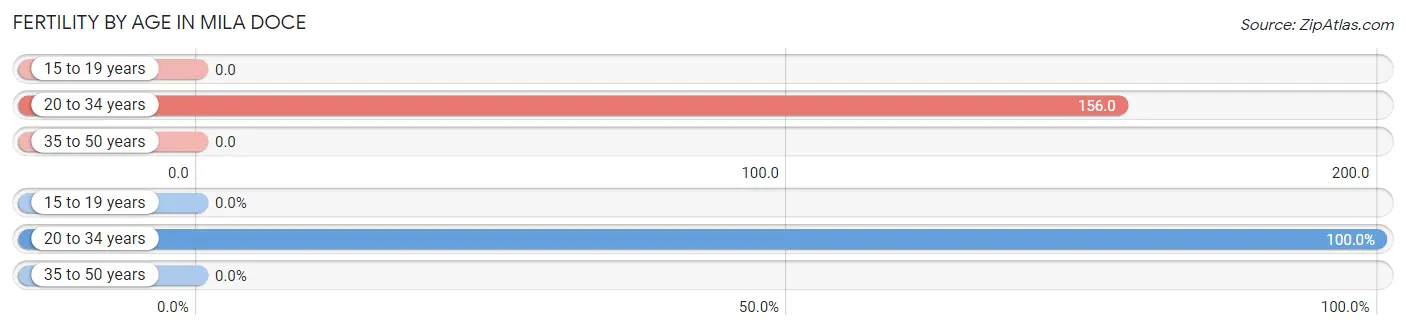
| Age Bracket | Women with Births | Births / 1,000 Women |
| 15 to 19 years | 0 (0.0%) | 0.0 |
| 20 to 34 years | 103 (100.0%) | 156.0 |
| 35 to 50 years | 0 (0.0%) | 0.0 |
| Total | 103 (100.0%) | 56.0 |
Fertility by Age by Marriage Status in Mila Doce
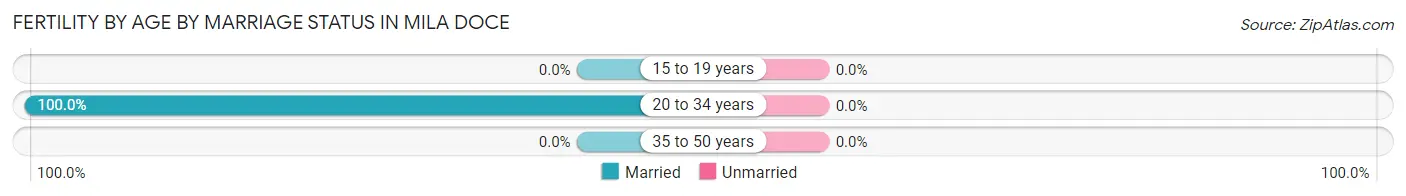
| Age Bracket | Married | Unmarried |
| 15 to 19 years | 0 (0.0%) | 0 (0.0%) |
| 20 to 34 years | 103 (100.0%) | 0 (0.0%) |
| 35 to 50 years | 0 (0.0%) | 0 (0.0%) |
| Total | 103 (100.0%) | 0 (0.0%) |
Fertility by Education in Mila Doce
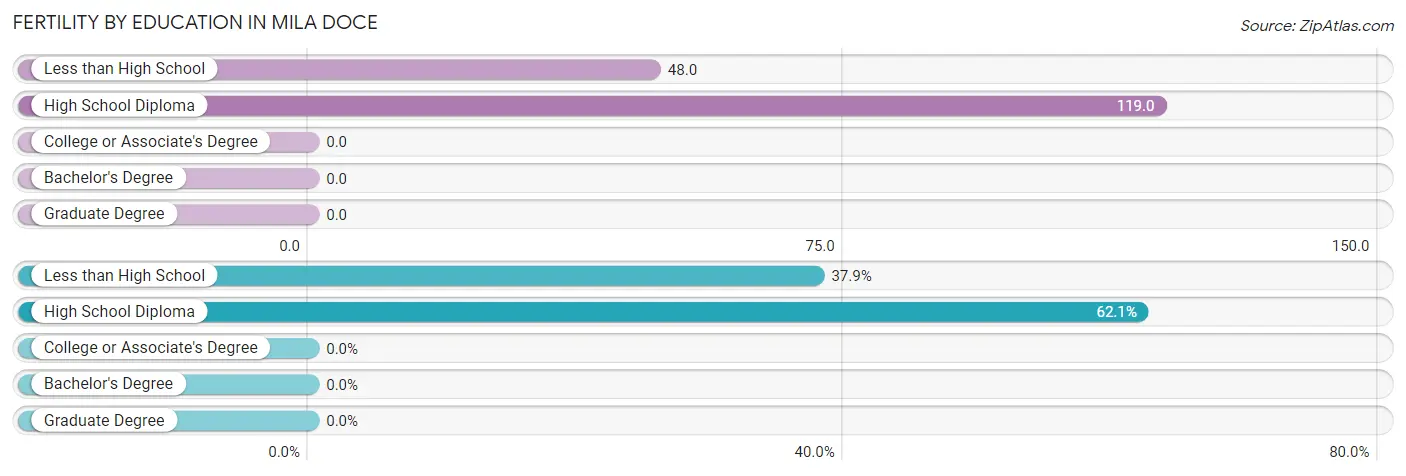
| Educational Attainment | Women with Births | Births / 1,000 Women |
| Less than High School | 39 (37.9%) | 48.0 |
| High School Diploma | 64 (62.1%) | 119.0 |
| College or Associate's Degree | 0 (0.0%) | 0.0 |
| Bachelor's Degree | 0 (0.0%) | 0.0 |
| Graduate Degree | 0 (0.0%) | 0.0 |
| Total | 103 (100.0%) | 56.0 |
Fertility by Education by Marriage Status in Mila Doce
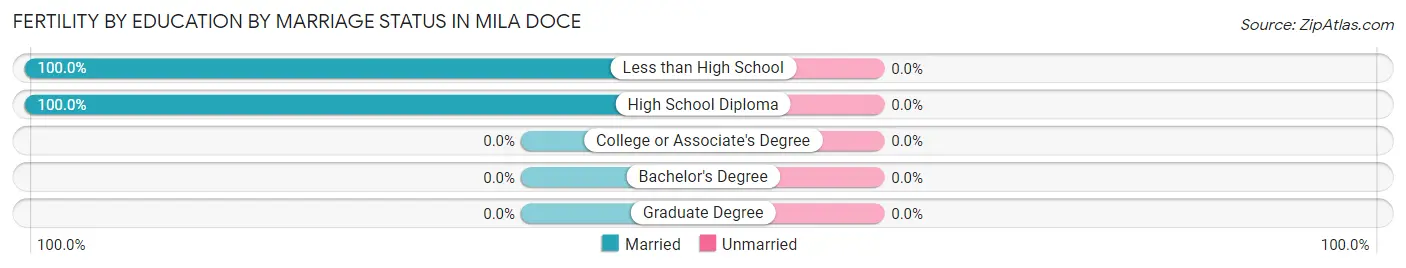
| Educational Attainment | Married | Unmarried |
| Less than High School | 39 (100.0%) | 0 (0.0%) |
| High School Diploma | 64 (100.0%) | 0 (0.0%) |
| College or Associate's Degree | 0 (0.0%) | 0 (0.0%) |
| Bachelor's Degree | 0 (0.0%) | 0 (0.0%) |
| Graduate Degree | 0 (0.0%) | 0 (0.0%) |
| Total | 103 (100.0%) | 0 (0.0%) |
Employment Characteristics in Mila Doce
Employment by Class of Employer in Mila Doce
Among the 2,480 employed individuals in Mila Doce, private company employees (1,865 | 75.2%), self-employed (not incorporated) (208 | 8.4%), and local government employees (127 | 5.1%) make up the most common classes of employment.
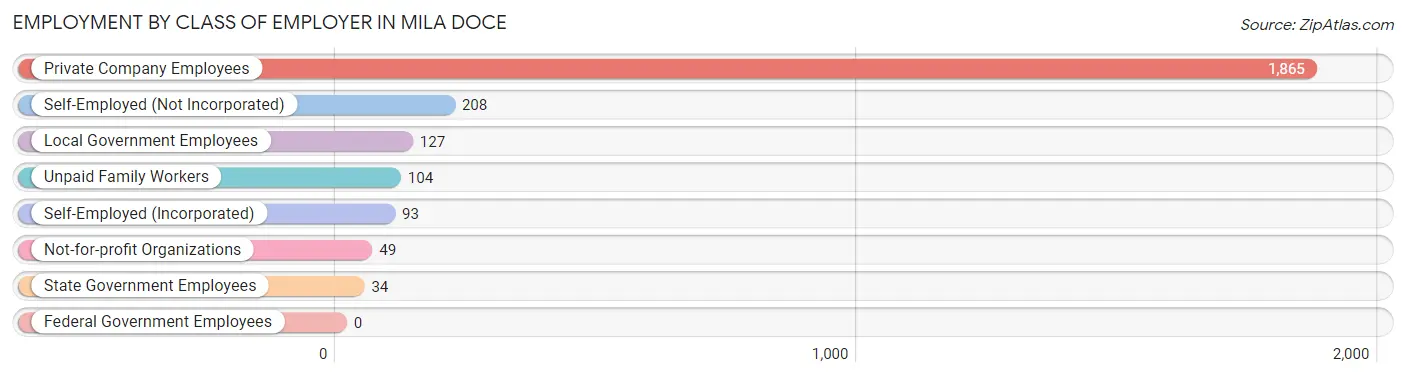
| Employer Class | # Employees | % Employees |
| Private Company Employees | 1,865 | 75.2% |
| Self-Employed (Incorporated) | 93 | 3.7% |
| Self-Employed (Not Incorporated) | 208 | 8.4% |
| Not-for-profit Organizations | 49 | 2.0% |
| Local Government Employees | 127 | 5.1% |
| State Government Employees | 34 | 1.4% |
| Federal Government Employees | 0 | 0.0% |
| Unpaid Family Workers | 104 | 4.2% |
| Total | 2,480 | 100.0% |
Employment Status by Age in Mila Doce
According to the labor force statistics for Mila Doce, out of the total population over 16 years of age (4,545), 60.4% or 2,745 individuals are in the labor force, with 6.4% or 176 of them unemployed. The age group with the highest labor force participation rate is 30 to 34 years, with 79.3% or 330 individuals in the labor force. Within the labor force, the 30 to 34 years age range has the highest percentage of unemployed individuals, with 14.5% or 48 of them being unemployed.
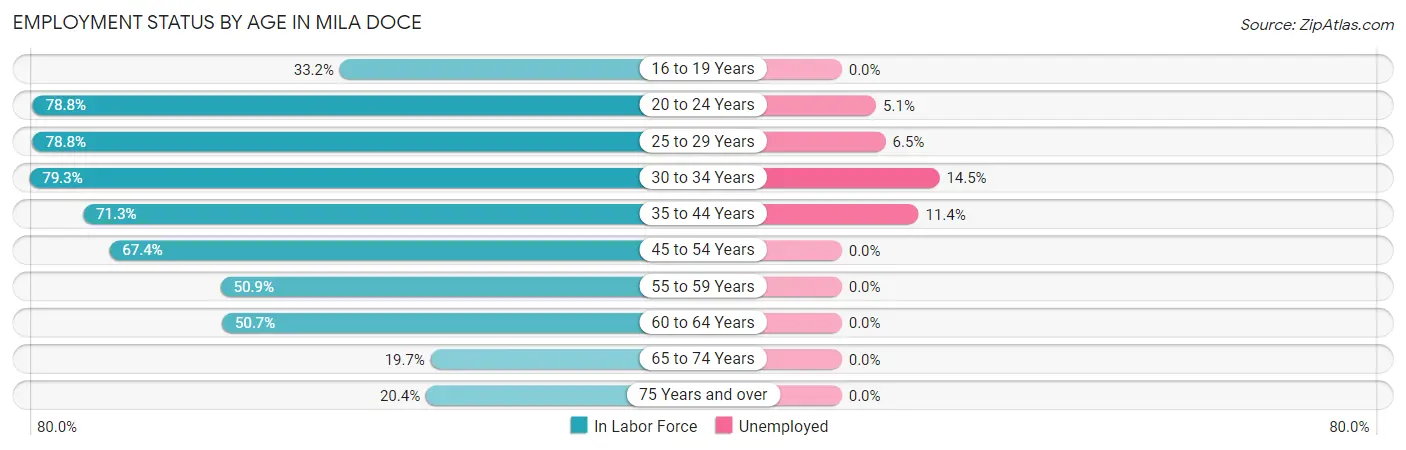
| Age Bracket | In Labor Force | Unemployed |
| 16 to 19 Years | 263 (33.2%) | 0 (0.0%) |
| 20 to 24 Years | 432 (78.8%) | 22 (5.1%) |
| 25 to 29 Years | 356 (78.8%) | 23 (6.5%) |
| 30 to 34 Years | 330 (79.3%) | 48 (14.5%) |
| 35 to 44 Years | 728 (71.3%) | 83 (11.4%) |
| 45 to 54 Years | 312 (67.4%) | 0 (0.0%) |
| 55 to 59 Years | 139 (50.9%) | 0 (0.0%) |
| 60 to 64 Years | 116 (50.7%) | 0 (0.0%) |
| 65 to 74 Years | 39 (19.7%) | 0 (0.0%) |
| 75 Years and over | 31 (20.4%) | 0 (0.0%) |
| Total | 2,745 (60.4%) | 176 (6.4%) |
Employment Status by Educational Attainment in Mila Doce
According to labor force statistics for Mila Doce, 69.4% of individuals (1,981) out of the total population between 25 and 64 years of age (2,854) are in the labor force, with 7.8% or 155 of them being unemployed. The group with the highest labor force participation rate are those with the educational attainment of college / associate degree, with 90.3% or 514 individuals in the labor force. Within the labor force, individuals with less than high school education have the highest percentage of unemployment, with 16.3% or 154 of them being unemployed.
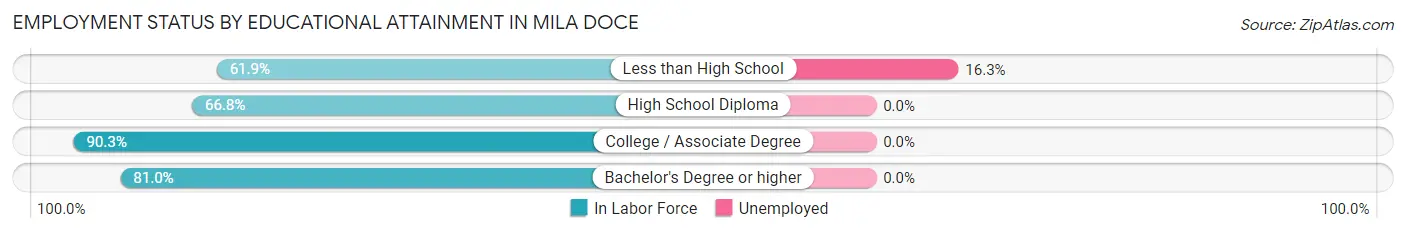
| Educational Attainment | In Labor Force | Unemployed |
| Less than High School | 943 (61.9%) | 248 (16.3%) |
| High School Diploma | 438 (66.8%) | 0 (0.0%) |
| College / Associate Degree | 514 (90.3%) | 0 (0.0%) |
| Bachelor's Degree or higher | 85 (81.0%) | 0 (0.0%) |
| Total | 1,981 (69.4%) | 223 (7.8%) |
Employment Occupations by Sex in Mila Doce
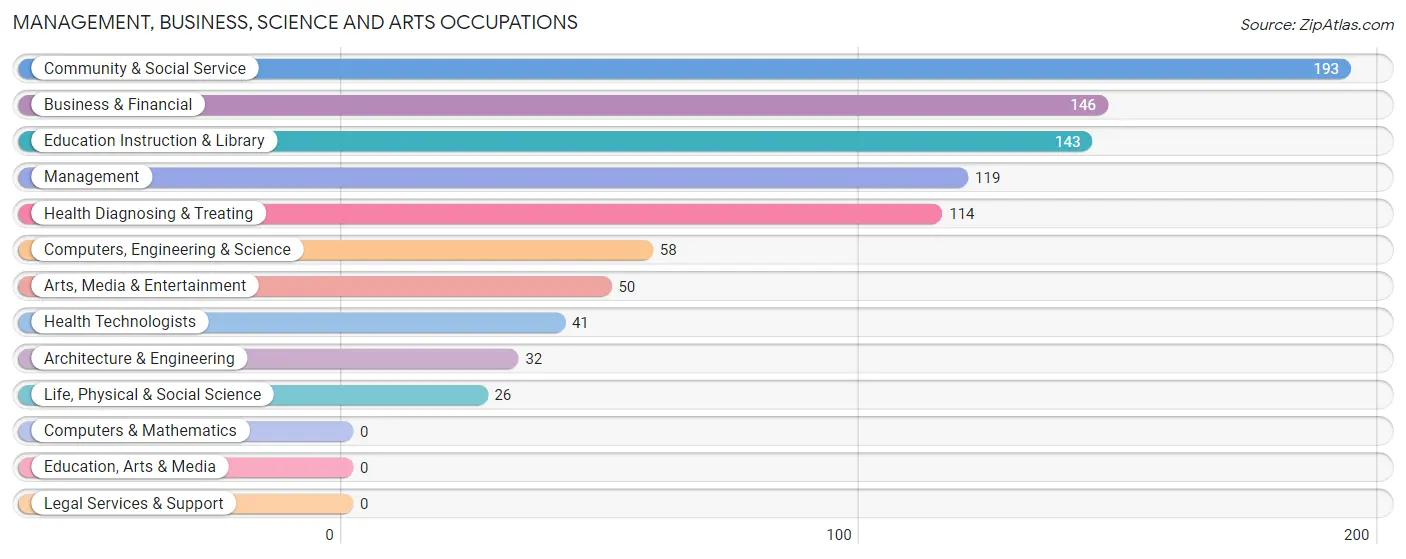
Management, Business, Science and Arts Occupations
The most common Management, Business, Science and Arts occupations in Mila Doce are Community & Social Service (193 | 7.5%), Business & Financial (146 | 5.7%), Education Instruction & Library (143 | 5.6%), Management (119 | 4.6%), and Health Diagnosing & Treating (114 | 4.4%).
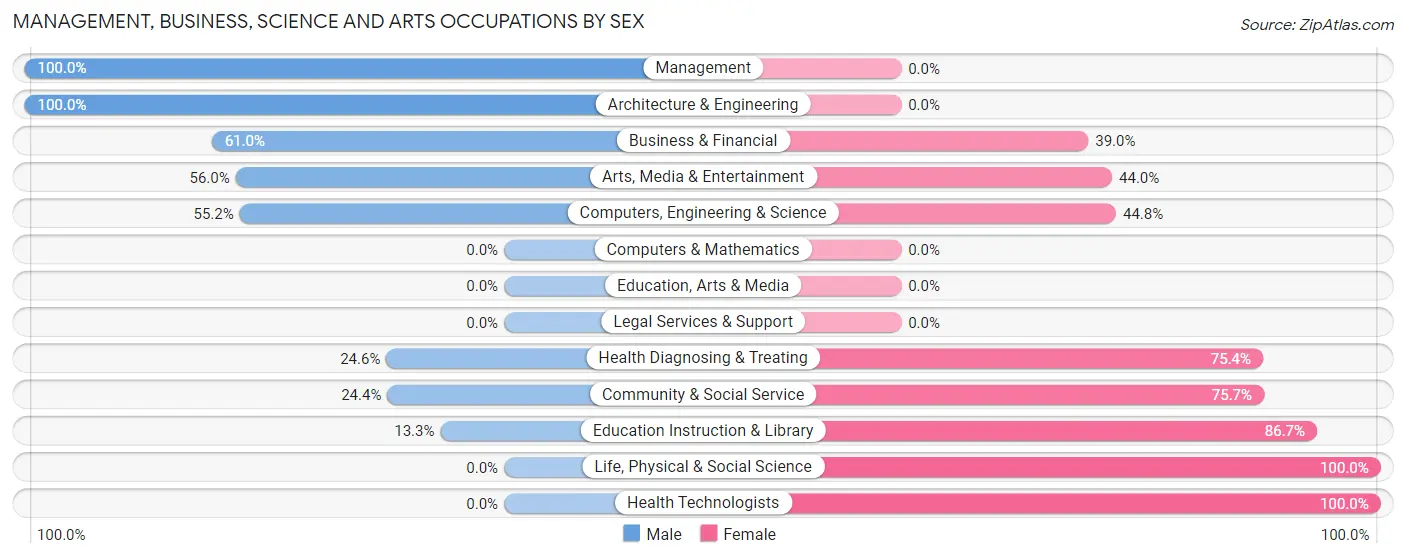
Management, Business, Science and Arts Occupations by Sex
Within the Management, Business, Science and Arts occupations in Mila Doce, the most male-oriented occupations are Management (100.0%), Architecture & Engineering (100.0%), and Business & Financial (61.0%), while the most female-oriented occupations are Life, Physical & Social Science (100.0%), Health Technologists (100.0%), and Education Instruction & Library (86.7%).
| Occupation | Male | Female |
| Management | 119 (100.0%) | 0 (0.0%) |
| Business & Financial | 89 (61.0%) | 57 (39.0%) |
| Computers, Engineering & Science | 32 (55.2%) | 26 (44.8%) |
| Computers & Mathematics | 0 (0.0%) | 0 (0.0%) |
| Architecture & Engineering | 32 (100.0%) | 0 (0.0%) |
| Life, Physical & Social Science | 0 (0.0%) | 26 (100.0%) |
| Community & Social Service | 47 (24.3%) | 146 (75.6%) |
| Education, Arts & Media | 0 (0.0%) | 0 (0.0%) |
| Legal Services & Support | 0 (0.0%) | 0 (0.0%) |
| Education Instruction & Library | 19 (13.3%) | 124 (86.7%) |
| Arts, Media & Entertainment | 28 (56.0%) | 22 (44.0%) |
| Health Diagnosing & Treating | 28 (24.6%) | 86 (75.4%) |
| Health Technologists | 0 (0.0%) | 41 (100.0%) |
| Total (Category) | 315 (50.0%) | 315 (50.0%) |
| Total (Overall) | 1,438 (55.9%) | 1,132 (44.1%) |
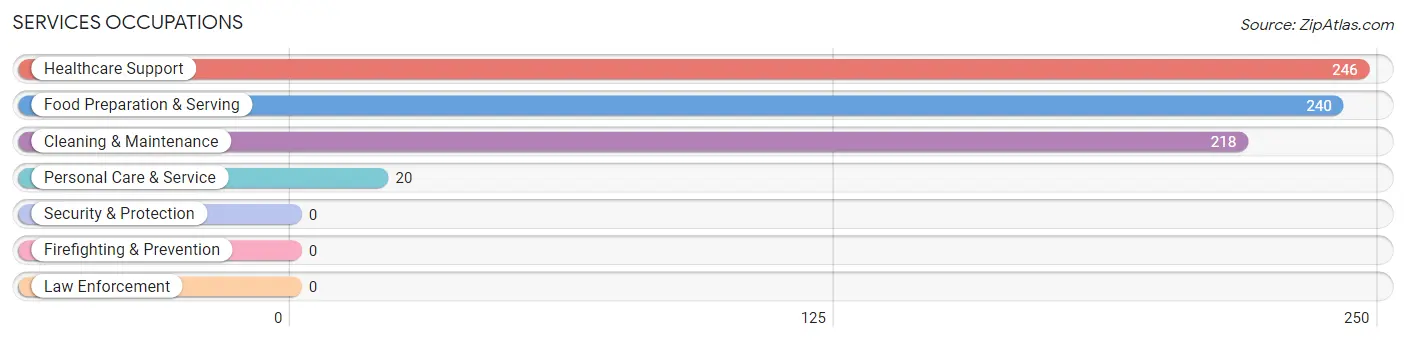
Services Occupations
The most common Services occupations in Mila Doce are Healthcare Support (246 | 9.6%), Food Preparation & Serving (240 | 9.3%), Cleaning & Maintenance (218 | 8.5%), and Personal Care & Service (20 | 0.8%).
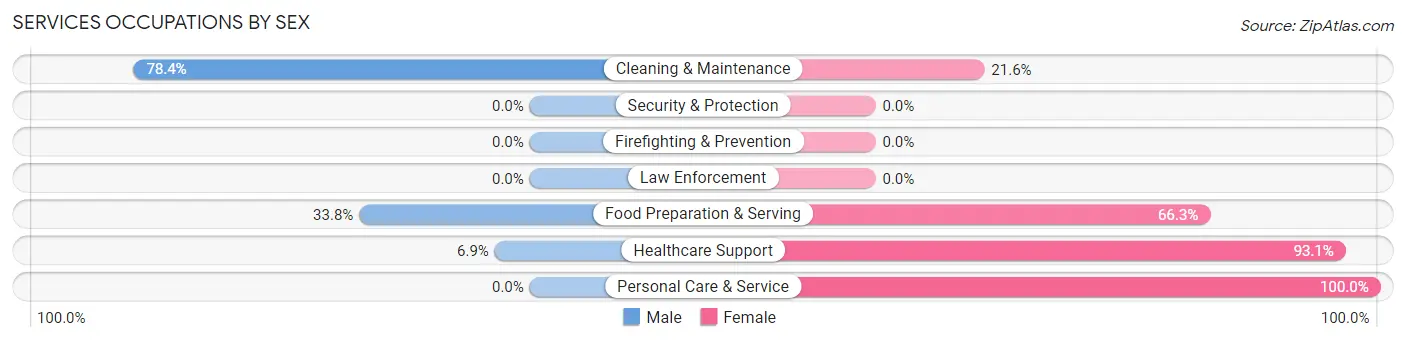
Services Occupations by Sex
Within the Services occupations in Mila Doce, the most male-oriented occupations are Cleaning & Maintenance (78.4%), Food Preparation & Serving (33.8%), and Healthcare Support (6.9%), while the most female-oriented occupations are Personal Care & Service (100.0%), Healthcare Support (93.1%), and Food Preparation & Serving (66.2%).
| Occupation | Male | Female |
| Healthcare Support | 17 (6.9%) | 229 (93.1%) |
| Security & Protection | 0 (0.0%) | 0 (0.0%) |
| Firefighting & Prevention | 0 (0.0%) | 0 (0.0%) |
| Law Enforcement | 0 (0.0%) | 0 (0.0%) |
| Food Preparation & Serving | 81 (33.8%) | 159 (66.2%) |
| Cleaning & Maintenance | 171 (78.4%) | 47 (21.6%) |
| Personal Care & Service | 0 (0.0%) | 20 (100.0%) |
| Total (Category) | 269 (37.1%) | 455 (62.8%) |
| Total (Overall) | 1,438 (55.9%) | 1,132 (44.1%) |
Sales and Office Occupations
The most common Sales and Office occupations in Mila Doce are Sales & Related (384 | 14.9%), and Office & Administration (99 | 3.8%).
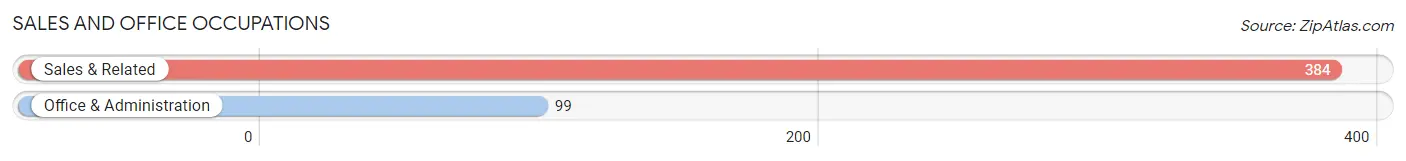
Sales and Office Occupations by Sex
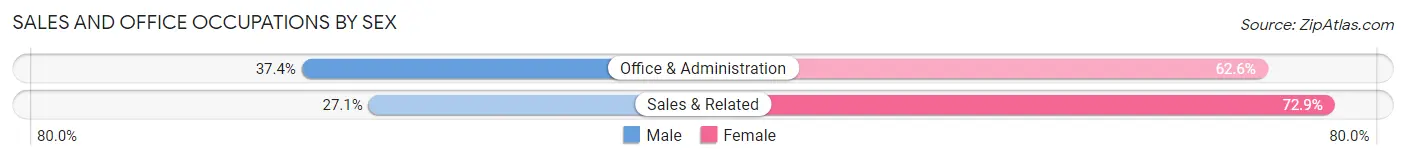
| Occupation | Male | Female |
| Sales & Related | 104 (27.1%) | 280 (72.9%) |
| Office & Administration | 37 (37.4%) | 62 (62.6%) |
| Total (Category) | 141 (29.2%) | 342 (70.8%) |
| Total (Overall) | 1,438 (55.9%) | 1,132 (44.1%) |
Natural Resources, Construction and Maintenance Occupations
The most common Natural Resources, Construction and Maintenance occupations in Mila Doce are Construction & Extraction (227 | 8.8%), Installation, Maintenance & Repair (166 | 6.5%), and Farming, Fishing & Forestry (94 | 3.7%).
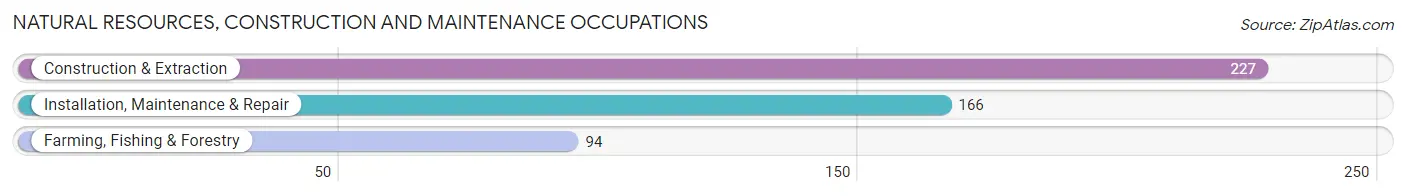
Natural Resources, Construction and Maintenance Occupations by Sex
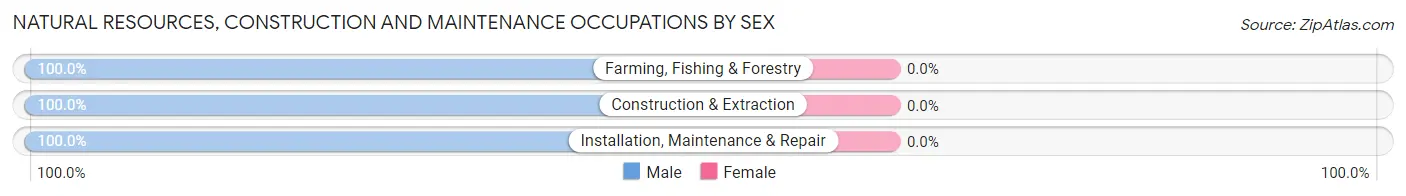
| Occupation | Male | Female |
| Farming, Fishing & Forestry | 94 (100.0%) | 0 (0.0%) |
| Construction & Extraction | 227 (100.0%) | 0 (0.0%) |
| Installation, Maintenance & Repair | 166 (100.0%) | 0 (0.0%) |
| Total (Category) | 487 (100.0%) | 0 (0.0%) |
| Total (Overall) | 1,438 (55.9%) | 1,132 (44.1%) |
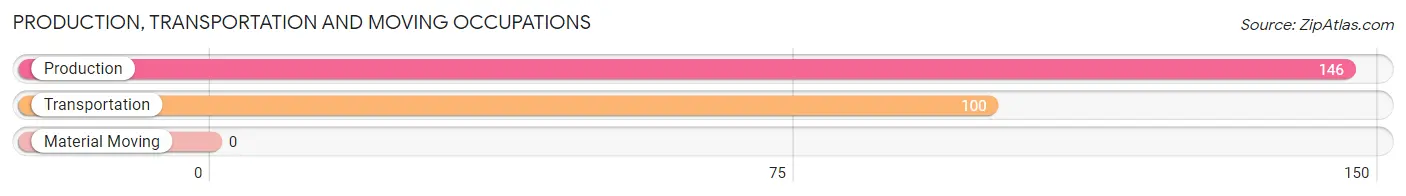
Production, Transportation and Moving Occupations
The most common Production, Transportation and Moving occupations in Mila Doce are Production (146 | 5.7%), and Transportation (100 | 3.9%).
Production, Transportation and Moving Occupations by Sex
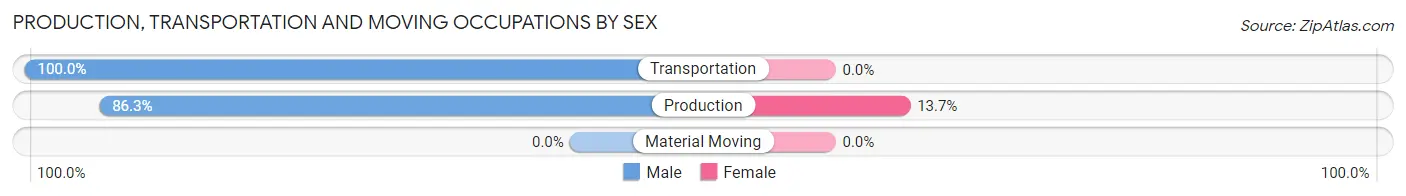
| Occupation | Male | Female |
| Production | 126 (86.3%) | 20 (13.7%) |
| Transportation | 100 (100.0%) | 0 (0.0%) |
| Material Moving | 0 (0.0%) | 0 (0.0%) |
| Total (Category) | 226 (91.9%) | 20 (8.1%) |
| Total (Overall) | 1,438 (55.9%) | 1,132 (44.1%) |
Employment Industries by Sex in Mila Doce
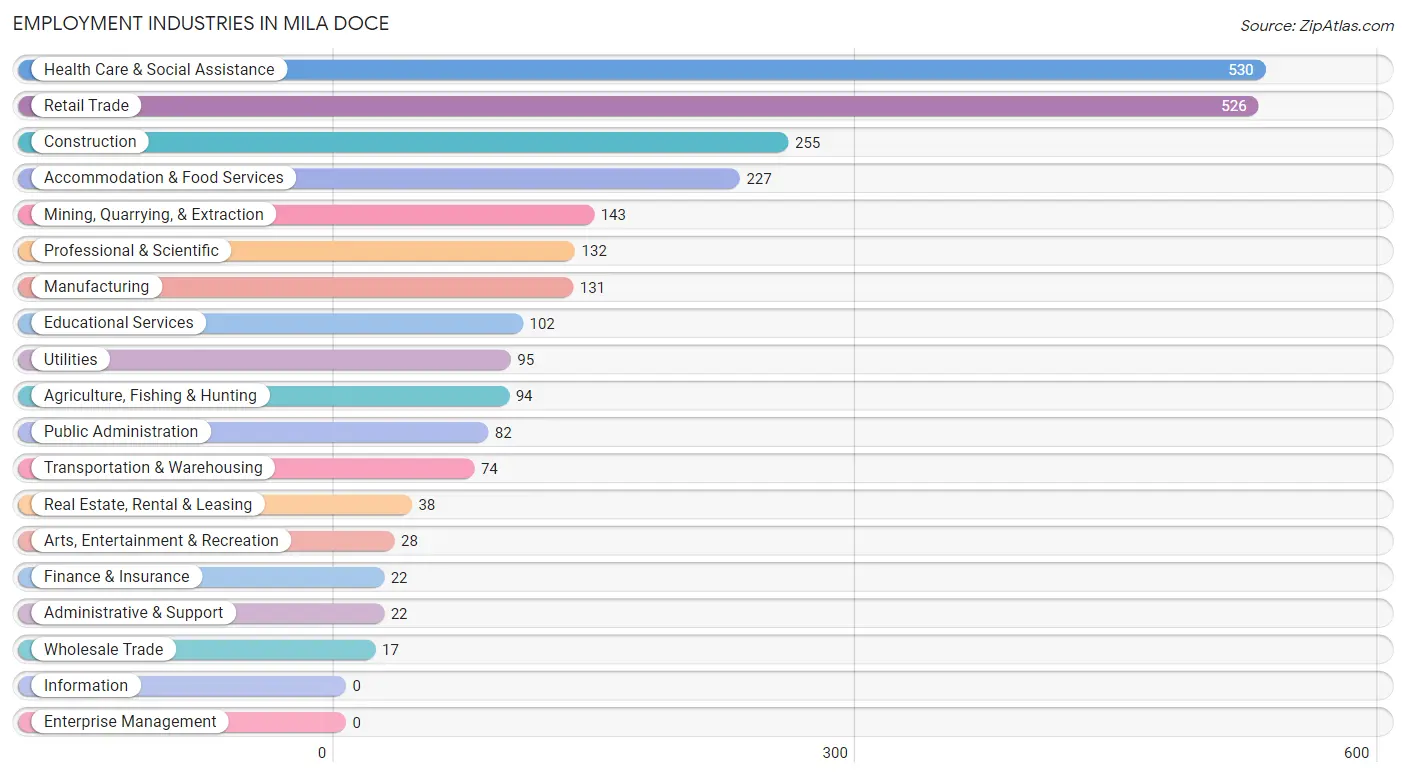
Employment Industries in Mila Doce
The major employment industries in Mila Doce include Health Care & Social Assistance (530 | 20.6%), Retail Trade (526 | 20.5%), Construction (255 | 9.9%), Accommodation & Food Services (227 | 8.8%), and Mining, Quarrying, & Extraction (143 | 5.6%).
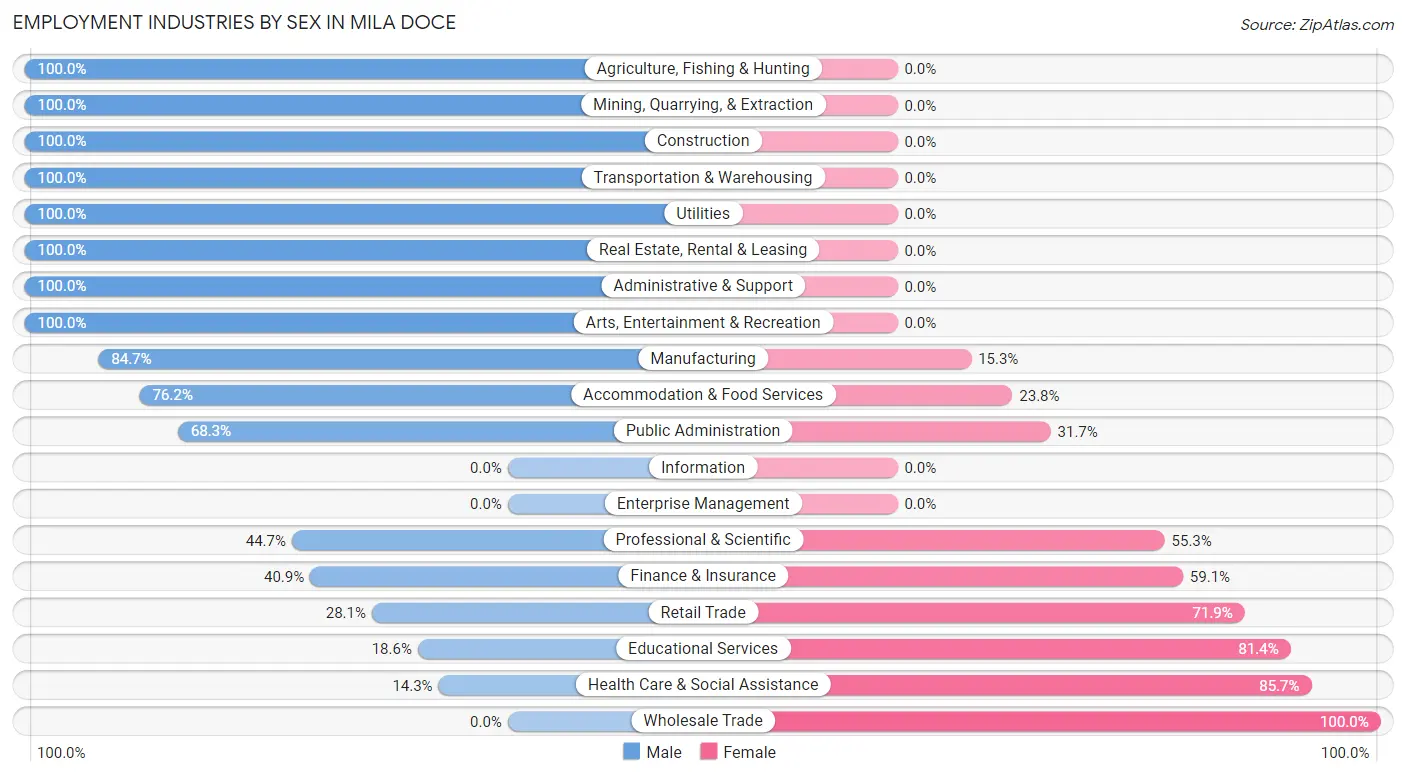
Employment Industries by Sex in Mila Doce
The Mila Doce industries that see more men than women are Agriculture, Fishing & Hunting (100.0%), Mining, Quarrying, & Extraction (100.0%), and Construction (100.0%), whereas the industries that tend to have a higher number of women are Wholesale Trade (100.0%), Health Care & Social Assistance (85.7%), and Educational Services (81.4%).
| Industry | Male | Female |
| Agriculture, Fishing & Hunting | 94 (100.0%) | 0 (0.0%) |
| Mining, Quarrying, & Extraction | 143 (100.0%) | 0 (0.0%) |
| Construction | 255 (100.0%) | 0 (0.0%) |
| Manufacturing | 111 (84.7%) | 20 (15.3%) |
| Wholesale Trade | 0 (0.0%) | 17 (100.0%) |
| Retail Trade | 148 (28.1%) | 378 (71.9%) |
| Transportation & Warehousing | 74 (100.0%) | 0 (0.0%) |
| Utilities | 95 (100.0%) | 0 (0.0%) |
| Information | 0 (0.0%) | 0 (0.0%) |
| Finance & Insurance | 9 (40.9%) | 13 (59.1%) |
| Real Estate, Rental & Leasing | 38 (100.0%) | 0 (0.0%) |
| Professional & Scientific | 59 (44.7%) | 73 (55.3%) |
| Enterprise Management | 0 (0.0%) | 0 (0.0%) |
| Administrative & Support | 22 (100.0%) | 0 (0.0%) |
| Educational Services | 19 (18.6%) | 83 (81.4%) |
| Health Care & Social Assistance | 76 (14.3%) | 454 (85.7%) |
| Arts, Entertainment & Recreation | 28 (100.0%) | 0 (0.0%) |
| Accommodation & Food Services | 173 (76.2%) | 54 (23.8%) |
| Public Administration | 56 (68.3%) | 26 (31.7%) |
| Total | 1,438 (55.9%) | 1,132 (44.1%) |
Education in Mila Doce
School Enrollment in Mila Doce
The most common levels of schooling among the 3,346 students in Mila Doce are middle school (1,083 | 32.4%), elementary school (888 | 26.5%), and high school (795 | 23.8%).
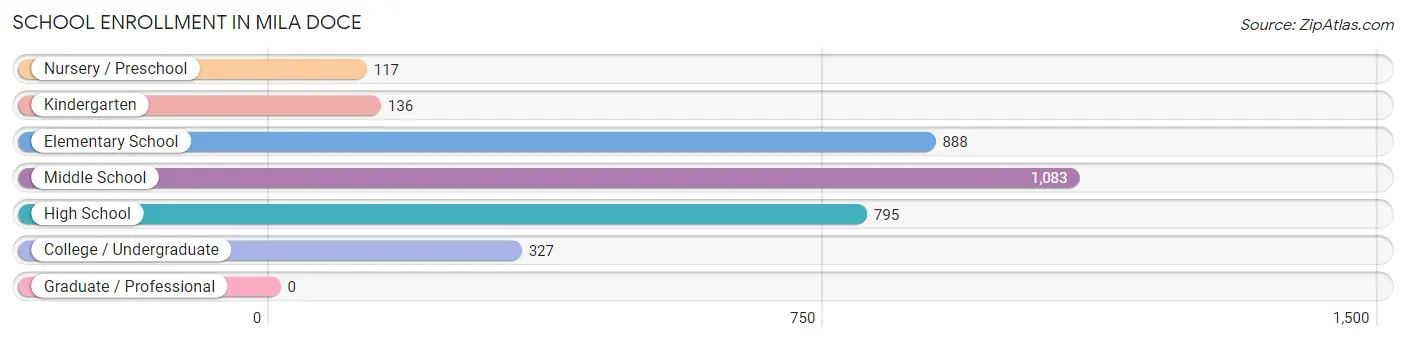
| School Level | # Students | % Students |
| Nursery / Preschool | 117 | 3.5% |
| Kindergarten | 136 | 4.1% |
| Elementary School | 888 | 26.5% |
| Middle School | 1,083 | 32.4% |
| High School | 795 | 23.8% |
| College / Undergraduate | 327 | 9.8% |
| Graduate / Professional | 0 | 0.0% |
| Total | 3,346 | 100.0% |
School Enrollment by Age by Funding Source in Mila Doce
Out of a total of 3,346 students who are enrolled in schools in Mila Doce, 80 (2.4%) attend a private institution, while the remaining 3,266 (97.6%) are enrolled in public schools. The age group of 20 to 24 year olds has the highest likelihood of being enrolled in private schools, with 62 (33.3% in the age bracket) enrolled. Conversely, the age group of 3 to 4 year olds has the lowest likelihood of being enrolled in a private school, with 117 (100.0% in the age bracket) attending a public institution.
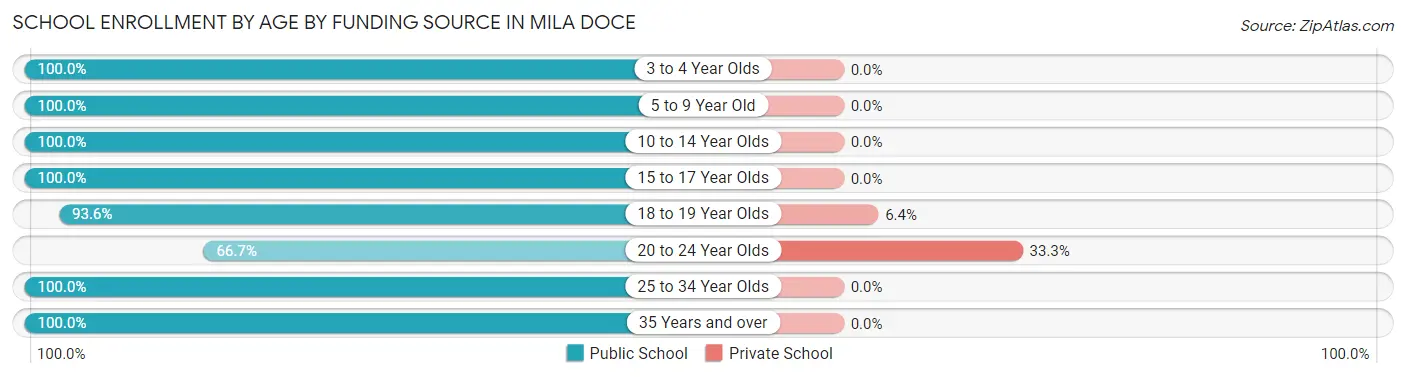
| Age Bracket | Public School | Private School |
| 3 to 4 Year Olds | 117 (100.0%) | 0 (0.0%) |
| 5 to 9 Year Old | 1,030 (100.0%) | 0 (0.0%) |
| 10 to 14 Year Olds | 1,220 (100.0%) | 0 (0.0%) |
| 15 to 17 Year Olds | 436 (100.0%) | 0 (0.0%) |
| 18 to 19 Year Olds | 262 (93.6%) | 18 (6.4%) |
| 20 to 24 Year Olds | 124 (66.7%) | 62 (33.3%) |
| 25 to 34 Year Olds | 43 (100.0%) | 0 (0.0%) |
| 35 Years and over | 34 (100.0%) | 0 (0.0%) |
| Total | 3,266 (97.6%) | 80 (2.4%) |
Educational Attainment by Field of Study in Mila Doce
Business (48 | 42.5%), psychology (29 | 25.7%), physical & health sciences (14 | 12.4%), computers & mathematics (8 | 7.1%), and arts & humanities (8 | 7.1%) are the most common fields of study among 113 individuals in Mila Doce who have obtained a bachelor's degree or higher.
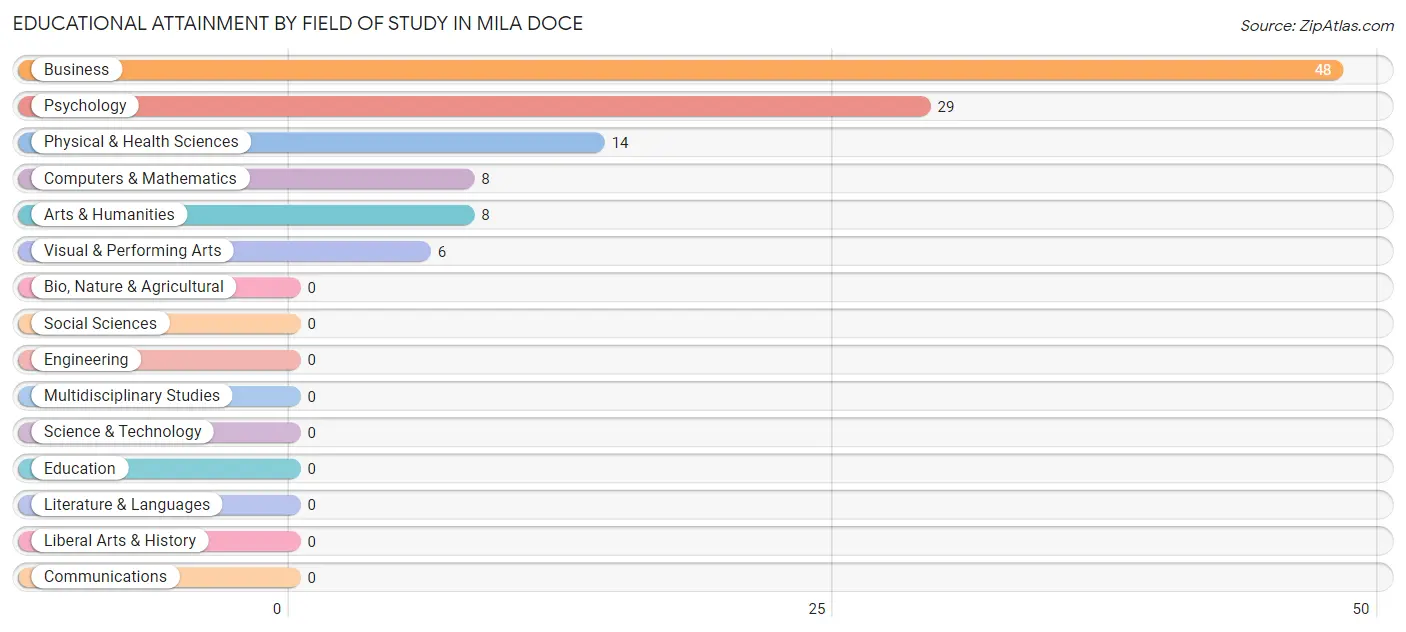
| Field of Study | # Graduates | % Graduates |
| Computers & Mathematics | 8 | 7.1% |
| Bio, Nature & Agricultural | 0 | 0.0% |
| Physical & Health Sciences | 14 | 12.4% |
| Psychology | 29 | 25.7% |
| Social Sciences | 0 | 0.0% |
| Engineering | 0 | 0.0% |
| Multidisciplinary Studies | 0 | 0.0% |
| Science & Technology | 0 | 0.0% |
| Business | 48 | 42.5% |
| Education | 0 | 0.0% |
| Literature & Languages | 0 | 0.0% |
| Liberal Arts & History | 0 | 0.0% |
| Visual & Performing Arts | 6 | 5.3% |
| Communications | 0 | 0.0% |
| Arts & Humanities | 8 | 7.1% |
| Total | 113 | 100.0% |
Transportation & Commute in Mila Doce
Vehicle Availability by Sex in Mila Doce
The most prevalent vehicle ownership categories in Mila Doce are males with 3 vehicles (409, accounting for 29.3%) and females with 3 vehicles (378, making up 37.7%).
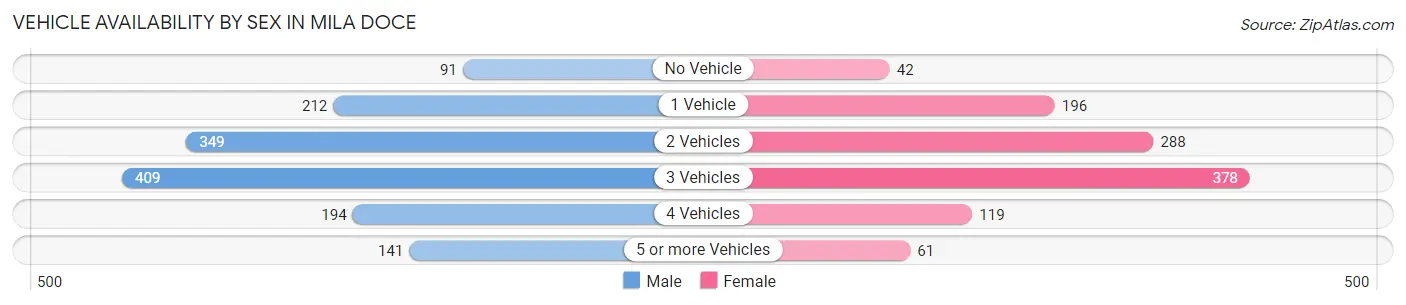
| Vehicles Available | Male | Female |
| No Vehicle | 91 (6.5%) | 42 (3.9%) |
| 1 Vehicle | 212 (15.2%) | 196 (18.1%) |
| 2 Vehicles | 349 (25.0%) | 288 (26.6%) |
| 3 Vehicles | 409 (29.3%) | 378 (34.9%) |
| 4 Vehicles | 194 (13.9%) | 119 (11.0%) |
| 5 or more Vehicles | 141 (10.1%) | 61 (5.6%) |
| Total | 1,396 (100.0%) | 1,084 (100.0%) |
Commute Time in Mila Doce
The most frequently occuring commute durations in Mila Doce are 30 to 34 minutes (379 commuters, 17.4%), 15 to 19 minutes (375 commuters, 17.2%), and 10 to 14 minutes (369 commuters, 16.9%).
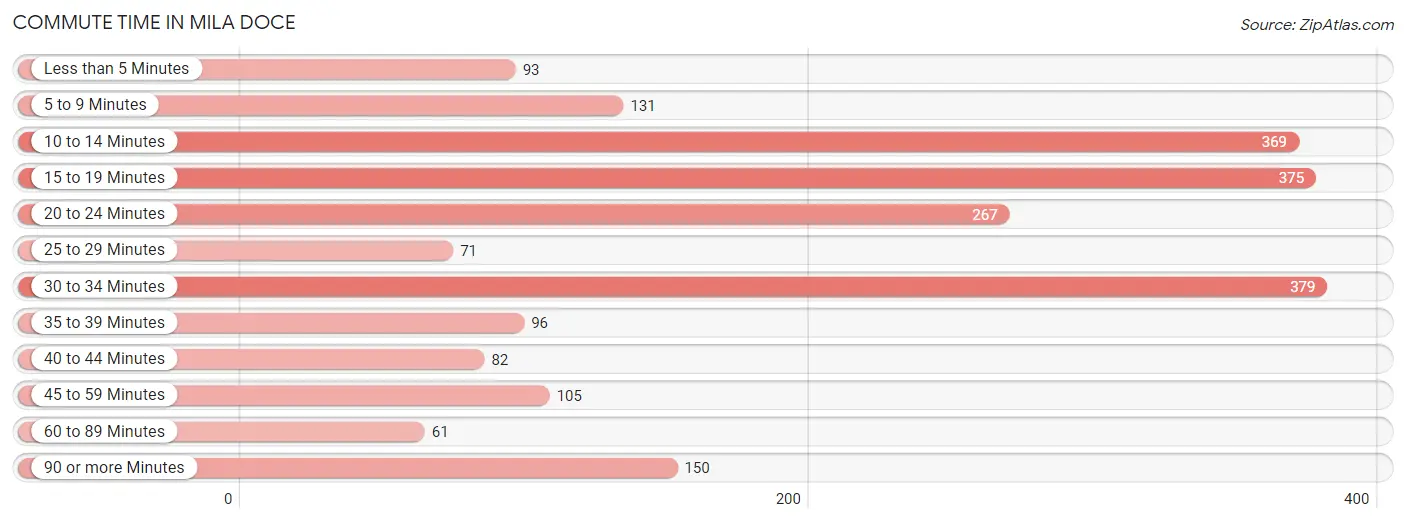
| Commute Time | # Commuters | % Commuters |
| Less than 5 Minutes | 93 | 4.3% |
| 5 to 9 Minutes | 131 | 6.0% |
| 10 to 14 Minutes | 369 | 16.9% |
| 15 to 19 Minutes | 375 | 17.2% |
| 20 to 24 Minutes | 267 | 12.2% |
| 25 to 29 Minutes | 71 | 3.3% |
| 30 to 34 Minutes | 379 | 17.4% |
| 35 to 39 Minutes | 96 | 4.4% |
| 40 to 44 Minutes | 82 | 3.8% |
| 45 to 59 Minutes | 105 | 4.8% |
| 60 to 89 Minutes | 61 | 2.8% |
| 90 or more Minutes | 150 | 6.9% |
Commute Time by Sex in Mila Doce
The most common commute times in Mila Doce are 30 to 34 minutes (231 commuters, 18.4%) for males and 10 to 14 minutes (259 commuters, 27.9%) for females.
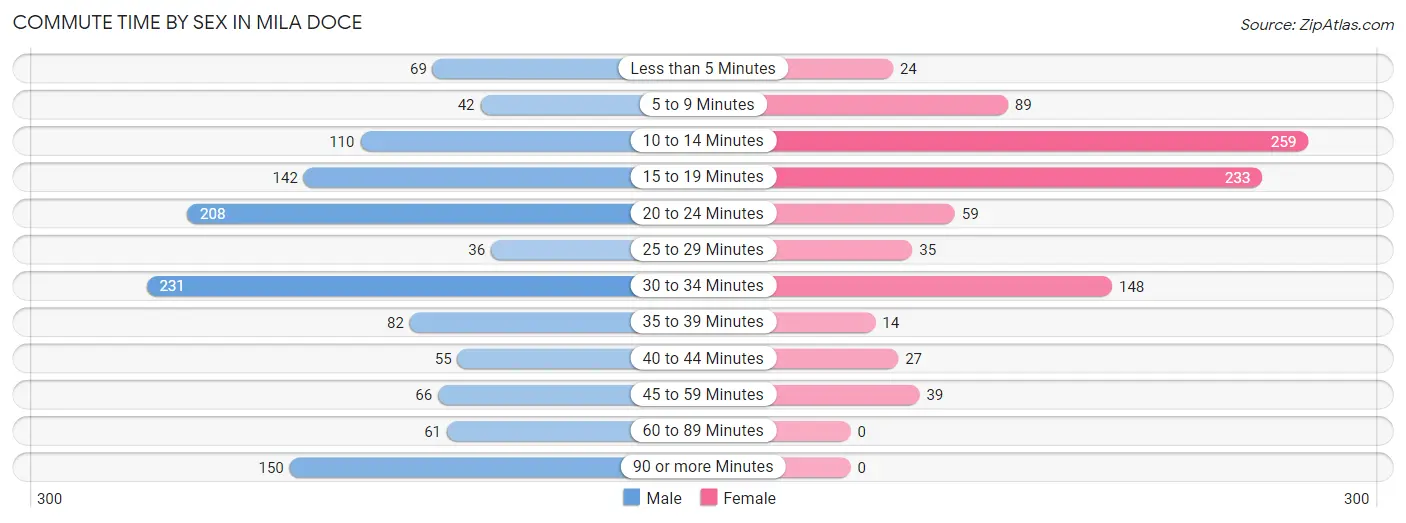
| Commute Time | Male | Female |
| Less than 5 Minutes | 69 (5.5%) | 24 (2.6%) |
| 5 to 9 Minutes | 42 (3.4%) | 89 (9.6%) |
| 10 to 14 Minutes | 110 (8.8%) | 259 (27.9%) |
| 15 to 19 Minutes | 142 (11.3%) | 233 (25.1%) |
| 20 to 24 Minutes | 208 (16.6%) | 59 (6.4%) |
| 25 to 29 Minutes | 36 (2.9%) | 35 (3.8%) |
| 30 to 34 Minutes | 231 (18.4%) | 148 (16.0%) |
| 35 to 39 Minutes | 82 (6.6%) | 14 (1.5%) |
| 40 to 44 Minutes | 55 (4.4%) | 27 (2.9%) |
| 45 to 59 Minutes | 66 (5.3%) | 39 (4.2%) |
| 60 to 89 Minutes | 61 (4.9%) | 0 (0.0%) |
| 90 or more Minutes | 150 (12.0%) | 0 (0.0%) |
Time of Departure to Work by Sex in Mila Doce
The most frequent times of departure to work in Mila Doce are 4:00 PM to 11:59 PM (175, 14.0%) for males and 10:00 AM to 10:59 AM (159, 17.2%) for females.
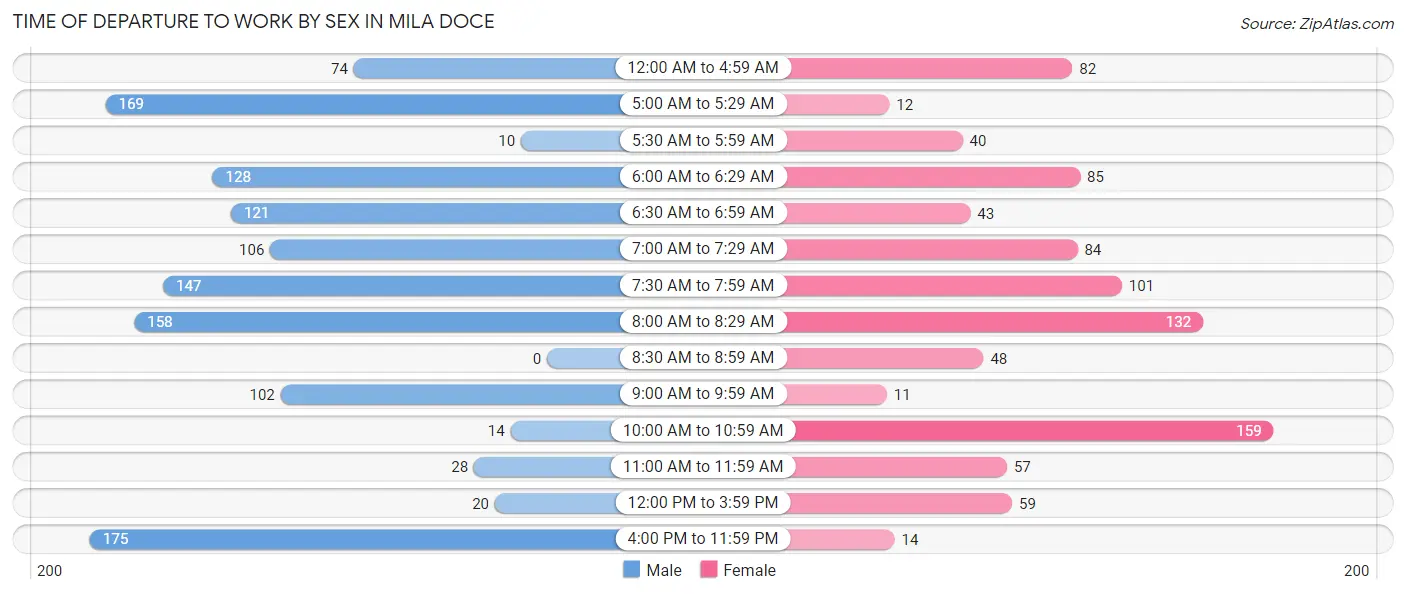
| Time of Departure | Male | Female |
| 12:00 AM to 4:59 AM | 74 (5.9%) | 82 (8.8%) |
| 5:00 AM to 5:29 AM | 169 (13.5%) | 12 (1.3%) |
| 5:30 AM to 5:59 AM | 10 (0.8%) | 40 (4.3%) |
| 6:00 AM to 6:29 AM | 128 (10.2%) | 85 (9.2%) |
| 6:30 AM to 6:59 AM | 121 (9.7%) | 43 (4.6%) |
| 7:00 AM to 7:29 AM | 106 (8.5%) | 84 (9.1%) |
| 7:30 AM to 7:59 AM | 147 (11.7%) | 101 (10.9%) |
| 8:00 AM to 8:29 AM | 158 (12.6%) | 132 (14.2%) |
| 8:30 AM to 8:59 AM | 0 (0.0%) | 48 (5.2%) |
| 9:00 AM to 9:59 AM | 102 (8.2%) | 11 (1.2%) |
| 10:00 AM to 10:59 AM | 14 (1.1%) | 159 (17.2%) |
| 11:00 AM to 11:59 AM | 28 (2.2%) | 57 (6.1%) |
| 12:00 PM to 3:59 PM | 20 (1.6%) | 59 (6.4%) |
| 4:00 PM to 11:59 PM | 175 (14.0%) | 14 (1.5%) |
| Total | 1,252 (100.0%) | 927 (100.0%) |
Housing Occupancy in Mila Doce
Occupancy by Ownership in Mila Doce
Of the total 1,520 dwellings in Mila Doce, owner-occupied units account for 1,133 (74.5%), while renter-occupied units make up 387 (25.5%).
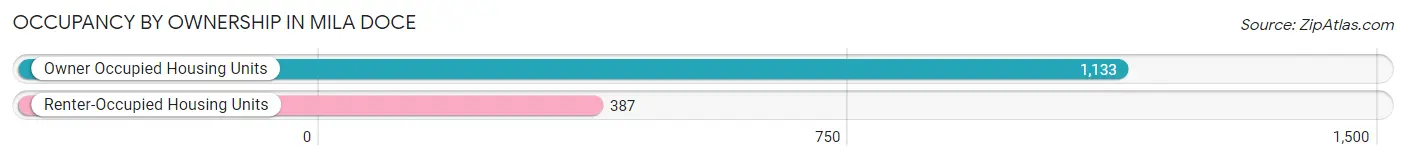
| Occupancy | # Housing Units | % Housing Units |
| Owner Occupied Housing Units | 1,133 | 74.5% |
| Renter-Occupied Housing Units | 387 | 25.5% |
| Total Occupied Housing Units | 1,520 | 100.0% |
Occupancy by Household Size in Mila Doce
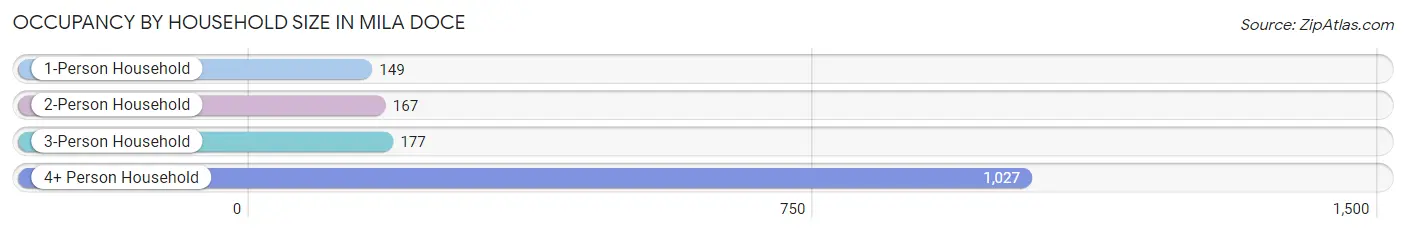
| Household Size | # Housing Units | % Housing Units |
| 1-Person Household | 149 | 9.8% |
| 2-Person Household | 167 | 11.0% |
| 3-Person Household | 177 | 11.6% |
| 4+ Person Household | 1,027 | 67.6% |
| Total Housing Units | 1,520 | 100.0% |
Occupancy by Ownership by Household Size in Mila Doce
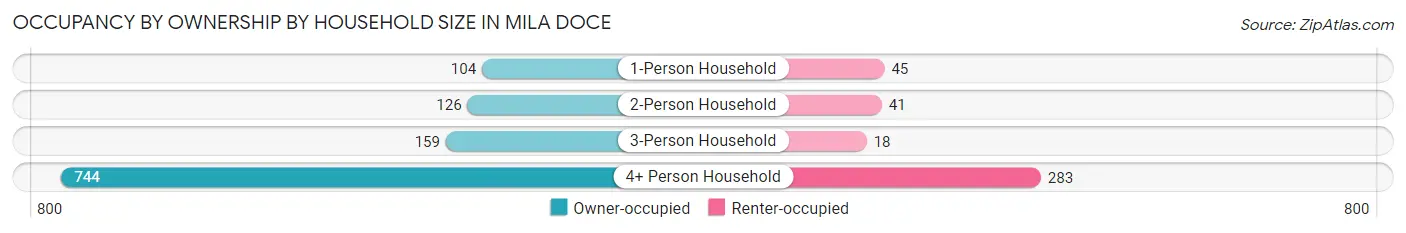
| Household Size | Owner-occupied | Renter-occupied |
| 1-Person Household | 104 (69.8%) | 45 (30.2%) |
| 2-Person Household | 126 (75.4%) | 41 (24.5%) |
| 3-Person Household | 159 (89.8%) | 18 (10.2%) |
| 4+ Person Household | 744 (72.4%) | 283 (27.6%) |
| Total Housing Units | 1,133 (74.5%) | 387 (25.5%) |
Occupancy by Educational Attainment in Mila Doce
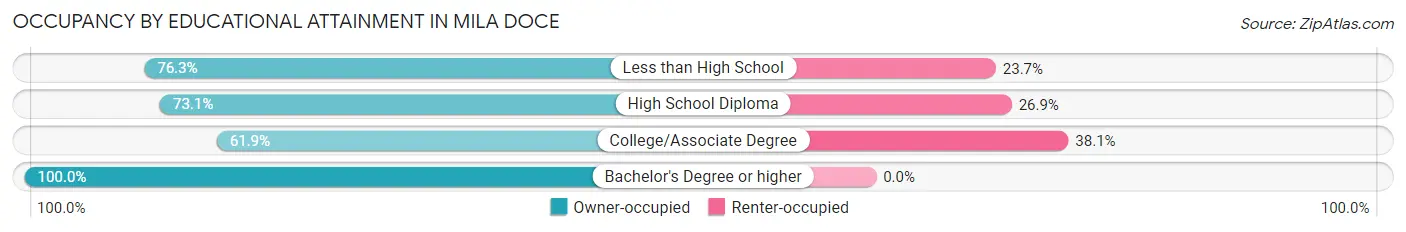
| Household Size | Owner-occupied | Renter-occupied |
| Less than High School | 691 (76.3%) | 215 (23.7%) |
| High School Diploma | 215 (73.1%) | 79 (26.9%) |
| College/Associate Degree | 151 (61.9%) | 93 (38.1%) |
| Bachelor's Degree or higher | 76 (100.0%) | 0 (0.0%) |
Occupancy by Age of Householder in Mila Doce
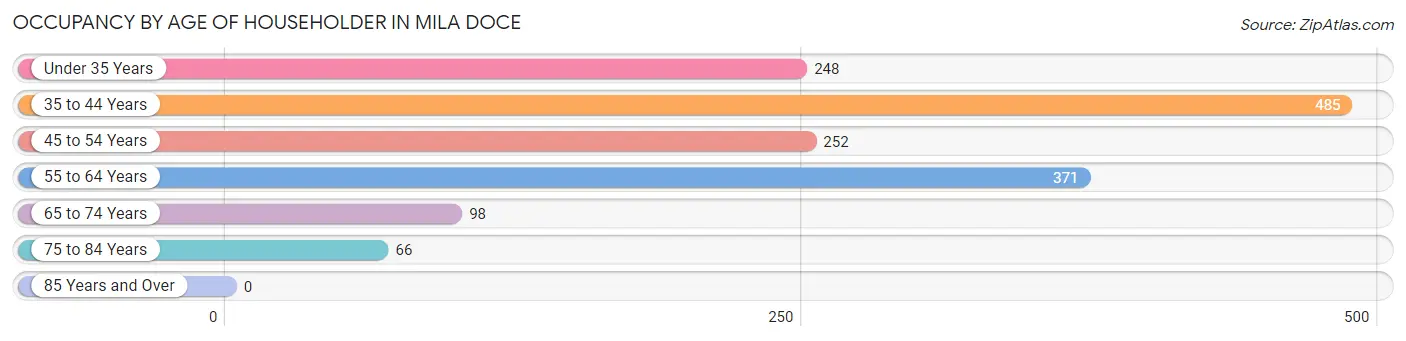
| Age Bracket | # Households | % Households |
| Under 35 Years | 248 | 16.3% |
| 35 to 44 Years | 485 | 31.9% |
| 45 to 54 Years | 252 | 16.6% |
| 55 to 64 Years | 371 | 24.4% |
| 65 to 74 Years | 98 | 6.5% |
| 75 to 84 Years | 66 | 4.3% |
| 85 Years and Over | 0 | 0.0% |
| Total | 1,520 | 100.0% |
Housing Finances in Mila Doce
Median Income by Occupancy in Mila Doce
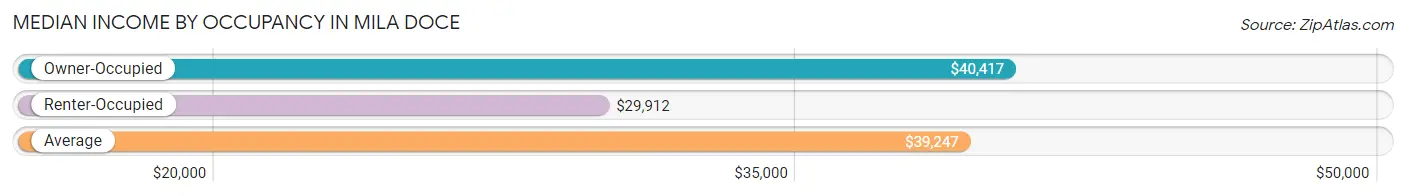
| Occupancy Type | # Households | Median Income |
| Owner-Occupied | 1,133 (74.5%) | $40,417 |
| Renter-Occupied | 387 (25.5%) | $29,912 |
| Average | 1,520 (100.0%) | $39,247 |
Occupancy by Householder Income Bracket in Mila Doce
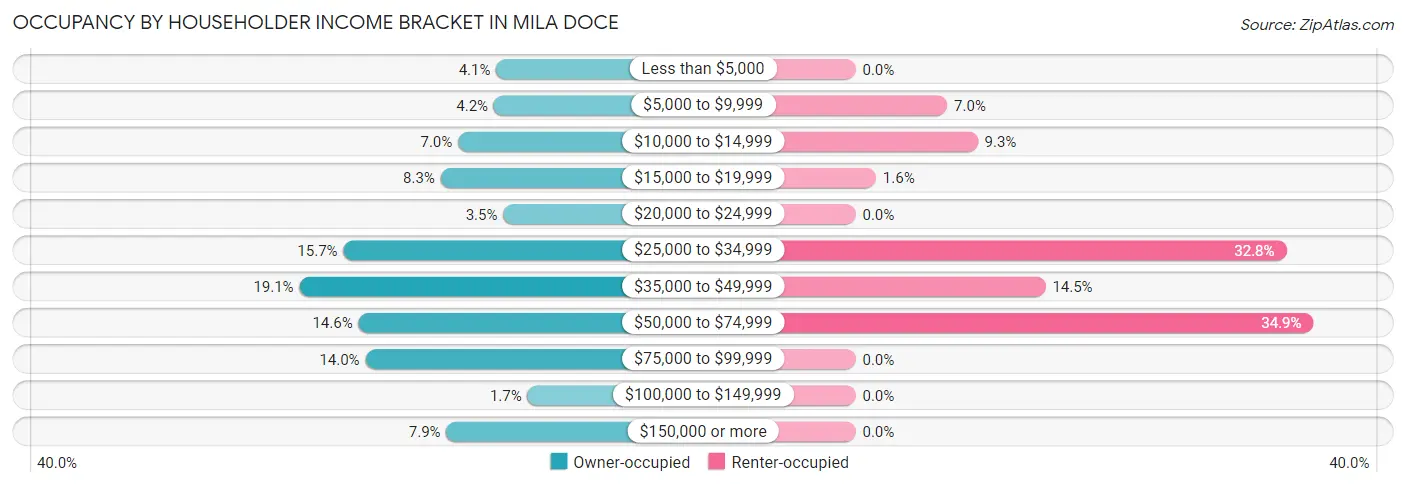
| Income Bracket | Owner-occupied | Renter-occupied |
| Less than $5,000 | 46 (4.1%) | 0 (0.0%) |
| $5,000 to $9,999 | 48 (4.2%) | 27 (7.0%) |
| $10,000 to $14,999 | 79 (7.0%) | 36 (9.3%) |
| $15,000 to $19,999 | 94 (8.3%) | 6 (1.5%) |
| $20,000 to $24,999 | 40 (3.5%) | 0 (0.0%) |
| $25,000 to $34,999 | 178 (15.7%) | 127 (32.8%) |
| $35,000 to $49,999 | 216 (19.1%) | 56 (14.5%) |
| $50,000 to $74,999 | 165 (14.6%) | 135 (34.9%) |
| $75,000 to $99,999 | 159 (14.0%) | 0 (0.0%) |
| $100,000 to $149,999 | 19 (1.7%) | 0 (0.0%) |
| $150,000 or more | 89 (7.9%) | 0 (0.0%) |
| Total | 1,133 (100.0%) | 387 (100.0%) |
Monthly Housing Cost Tiers in Mila Doce
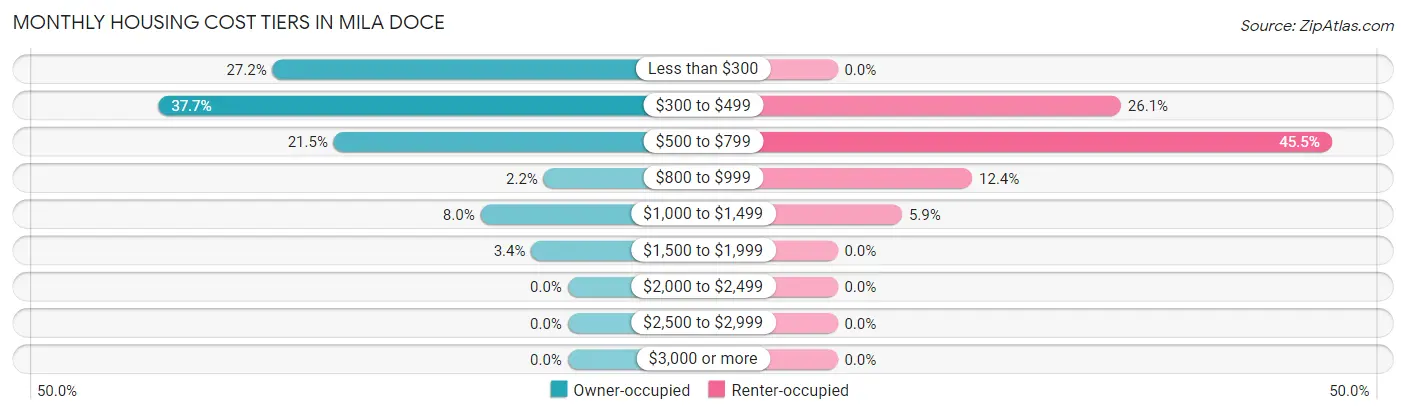
| Monthly Cost | Owner-occupied | Renter-occupied |
| Less than $300 | 308 (27.2%) | 0 (0.0%) |
| $300 to $499 | 427 (37.7%) | 101 (26.1%) |
| $500 to $799 | 244 (21.5%) | 176 (45.5%) |
| $800 to $999 | 25 (2.2%) | 48 (12.4%) |
| $1,000 to $1,499 | 91 (8.0%) | 23 (5.9%) |
| $1,500 to $1,999 | 38 (3.4%) | 0 (0.0%) |
| $2,000 to $2,499 | 0 (0.0%) | 0 (0.0%) |
| $2,500 to $2,999 | 0 (0.0%) | 0 (0.0%) |
| $3,000 or more | 0 (0.0%) | 0 (0.0%) |
| Total | 1,133 (100.0%) | 387 (100.0%) |
Physical Housing Characteristics in Mila Doce
Housing Structures in Mila Doce
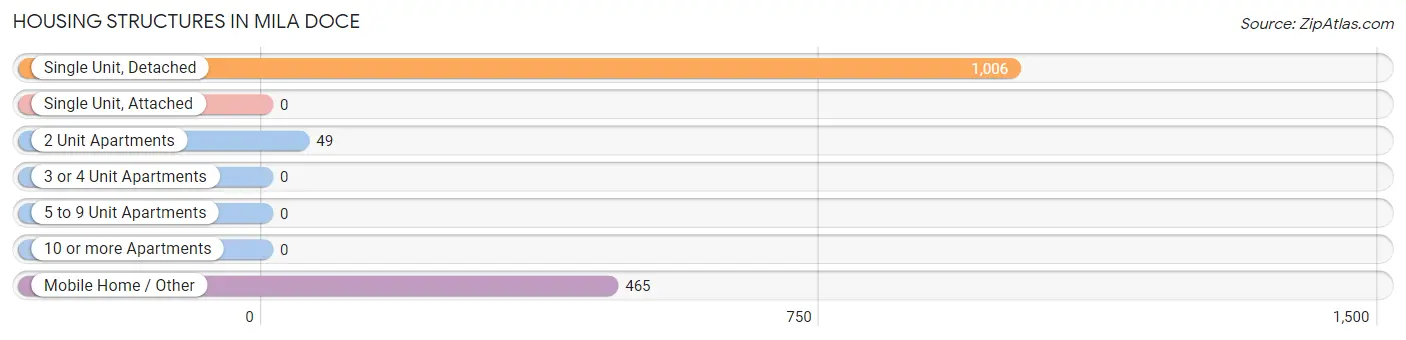
| Structure Type | # Housing Units | % Housing Units |
| Single Unit, Detached | 1,006 | 66.2% |
| Single Unit, Attached | 0 | 0.0% |
| 2 Unit Apartments | 49 | 3.2% |
| 3 or 4 Unit Apartments | 0 | 0.0% |
| 5 to 9 Unit Apartments | 0 | 0.0% |
| 10 or more Apartments | 0 | 0.0% |
| Mobile Home / Other | 465 | 30.6% |
| Total | 1,520 | 100.0% |
Housing Structures by Occupancy in Mila Doce
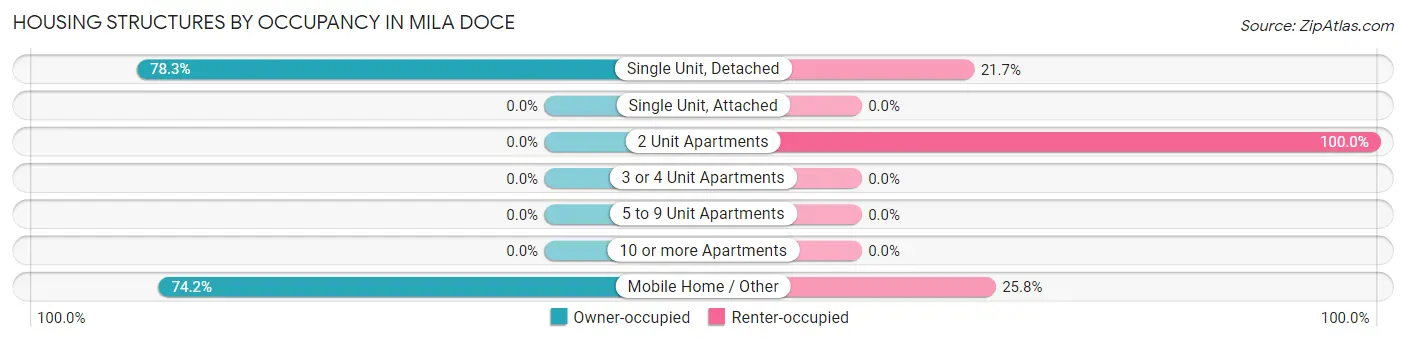
| Structure Type | Owner-occupied | Renter-occupied |
| Single Unit, Detached | 788 (78.3%) | 218 (21.7%) |
| Single Unit, Attached | 0 (0.0%) | 0 (0.0%) |
| 2 Unit Apartments | 0 (0.0%) | 49 (100.0%) |
| 3 or 4 Unit Apartments | 0 (0.0%) | 0 (0.0%) |
| 5 to 9 Unit Apartments | 0 (0.0%) | 0 (0.0%) |
| 10 or more Apartments | 0 (0.0%) | 0 (0.0%) |
| Mobile Home / Other | 345 (74.2%) | 120 (25.8%) |
| Total | 1,133 (74.5%) | 387 (25.5%) |
Housing Structures by Number of Rooms in Mila Doce
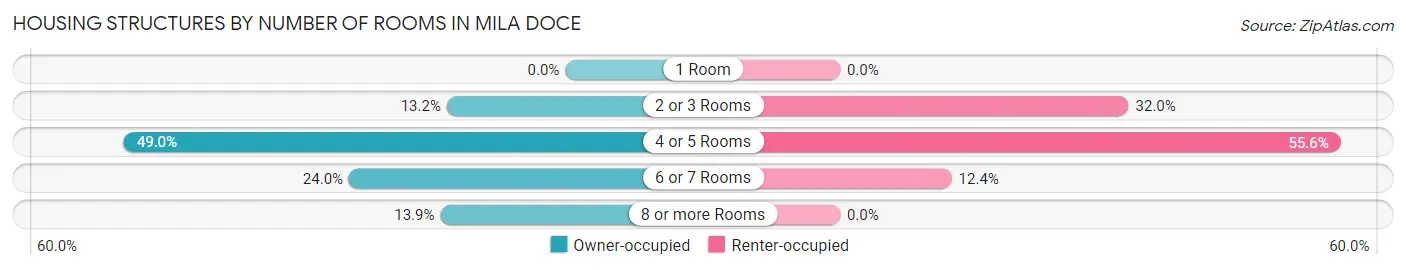
| Number of Rooms | Owner-occupied | Renter-occupied |
| 1 Room | 0 (0.0%) | 0 (0.0%) |
| 2 or 3 Rooms | 149 (13.2%) | 124 (32.0%) |
| 4 or 5 Rooms | 555 (49.0%) | 215 (55.6%) |
| 6 or 7 Rooms | 272 (24.0%) | 48 (12.4%) |
| 8 or more Rooms | 157 (13.9%) | 0 (0.0%) |
| Total | 1,133 (100.0%) | 387 (100.0%) |
Housing Structure by Heating Type in Mila Doce
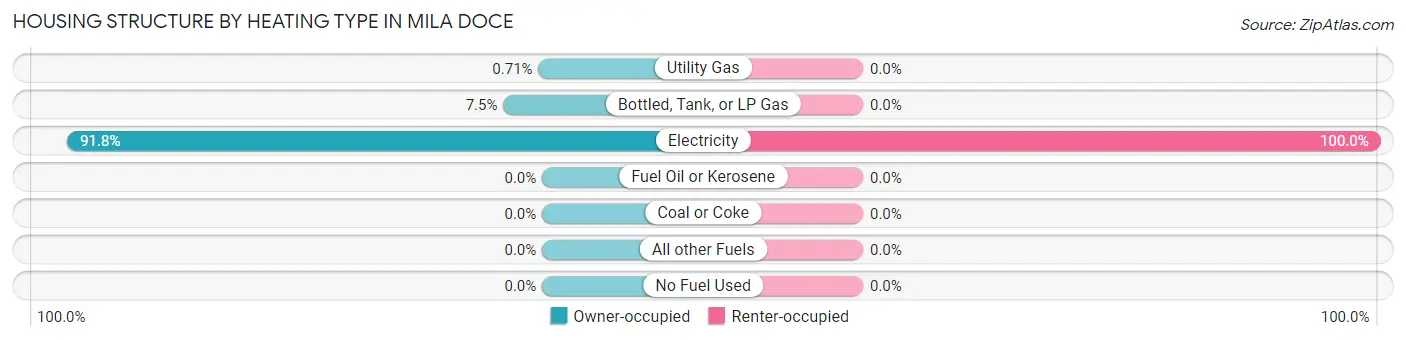
| Heating Type | Owner-occupied | Renter-occupied |
| Utility Gas | 8 (0.7%) | 0 (0.0%) |
| Bottled, Tank, or LP Gas | 85 (7.5%) | 0 (0.0%) |
| Electricity | 1,040 (91.8%) | 387 (100.0%) |
| Fuel Oil or Kerosene | 0 (0.0%) | 0 (0.0%) |
| Coal or Coke | 0 (0.0%) | 0 (0.0%) |
| All other Fuels | 0 (0.0%) | 0 (0.0%) |
| No Fuel Used | 0 (0.0%) | 0 (0.0%) |
| Total | 1,133 (100.0%) | 387 (100.0%) |
Household Vehicle Usage in Mila Doce
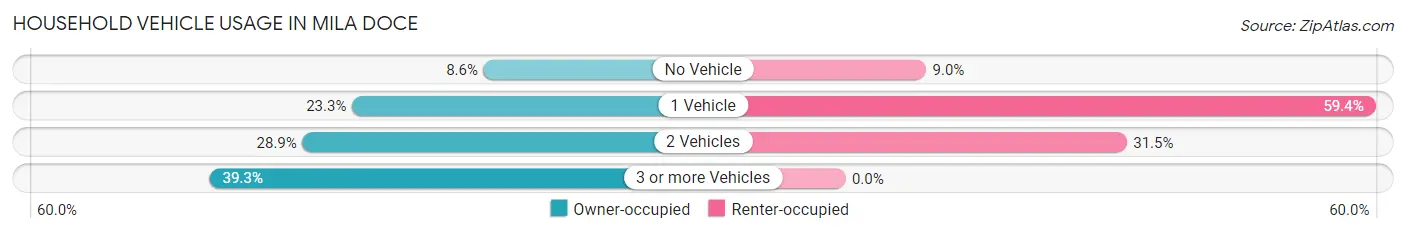
| Vehicles per Household | Owner-occupied | Renter-occupied |
| No Vehicle | 97 (8.6%) | 35 (9.0%) |
| 1 Vehicle | 264 (23.3%) | 230 (59.4%) |
| 2 Vehicles | 327 (28.9%) | 122 (31.5%) |
| 3 or more Vehicles | 445 (39.3%) | 0 (0.0%) |
| Total | 1,133 (100.0%) | 387 (100.0%) |
Real Estate & Mortgages in Mila Doce
Real Estate and Mortgage Overview in Mila Doce
| Characteristic | Without Mortgage | With Mortgage |
| Housing Units | 831 | 302 |
| Median Property Value | $57,000 | $56,700 |
| Median Household Income | $42,628 | $41 |
| Monthly Housing Costs | $327 | $0 |
| Real Estate Taxes | $877 | $14 |
Property Value by Mortgage Status in Mila Doce
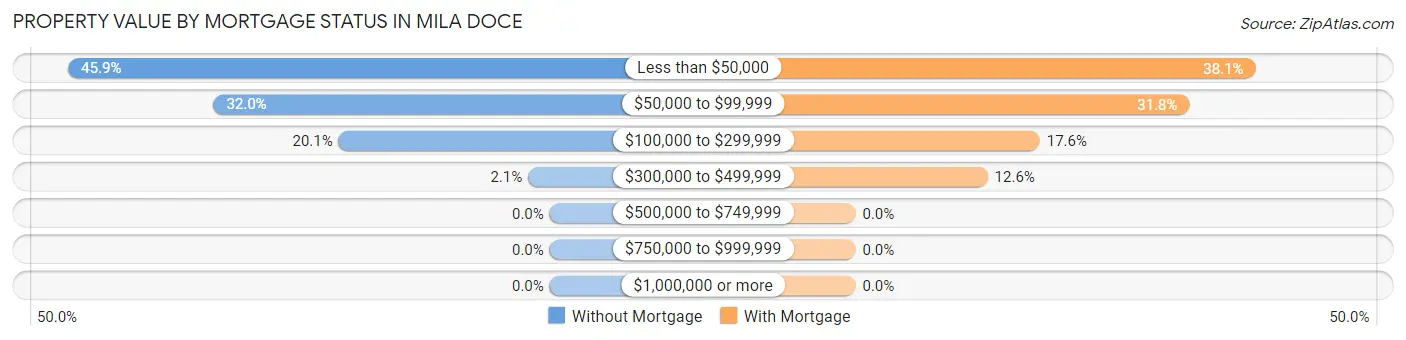
| Property Value | Without Mortgage | With Mortgage |
| Less than $50,000 | 381 (45.9%) | 115 (38.1%) |
| $50,000 to $99,999 | 266 (32.0%) | 96 (31.8%) |
| $100,000 to $299,999 | 167 (20.1%) | 53 (17.5%) |
| $300,000 to $499,999 | 17 (2.1%) | 38 (12.6%) |
| $500,000 to $749,999 | 0 (0.0%) | 0 (0.0%) |
| $750,000 to $999,999 | 0 (0.0%) | 0 (0.0%) |
| $1,000,000 or more | 0 (0.0%) | 0 (0.0%) |
| Total | 831 (100.0%) | 302 (100.0%) |
Household Income by Mortgage Status in Mila Doce
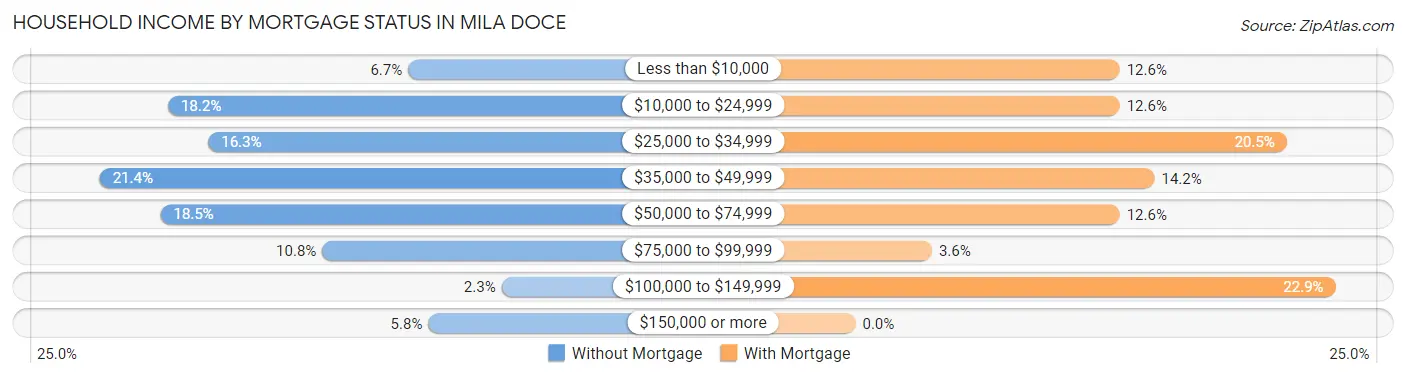
| Household Income | Without Mortgage | With Mortgage |
| Less than $10,000 | 56 (6.7%) | 38 (12.6%) |
| $10,000 to $24,999 | 151 (18.2%) | 38 (12.6%) |
| $25,000 to $34,999 | 135 (16.3%) | 62 (20.5%) |
| $35,000 to $49,999 | 178 (21.4%) | 43 (14.2%) |
| $50,000 to $74,999 | 154 (18.5%) | 38 (12.6%) |
| $75,000 to $99,999 | 90 (10.8%) | 11 (3.6%) |
| $100,000 to $149,999 | 19 (2.3%) | 69 (22.9%) |
| $150,000 or more | 48 (5.8%) | 0 (0.0%) |
| Total | 831 (100.0%) | 302 (100.0%) |
Property Value to Household Income Ratio in Mila Doce
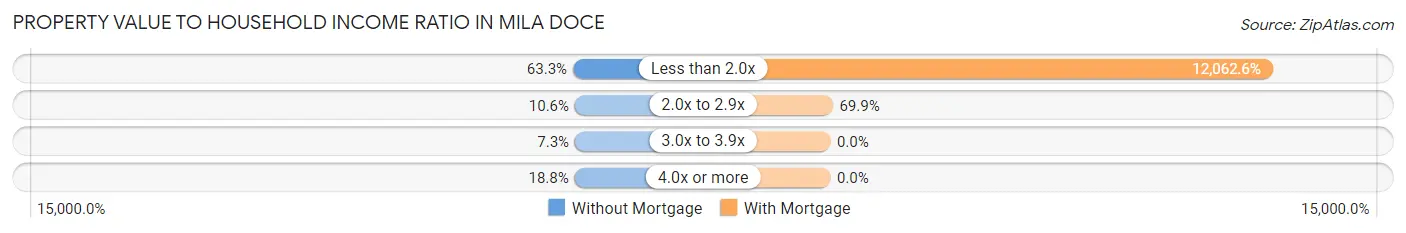
| Value-to-Income Ratio | Without Mortgage | With Mortgage |
| Less than 2.0x | 526 (63.3%) | 36,429 (12,062.6%) |
| 2.0x to 2.9x | 88 (10.6%) | 211 (69.9%) |
| 3.0x to 3.9x | 61 (7.3%) | 0 (0.0%) |
| 4.0x or more | 156 (18.8%) | 0 (0.0%) |
| Total | 831 (100.0%) | 302 (100.0%) |
Real Estate Taxes by Mortgage Status in Mila Doce
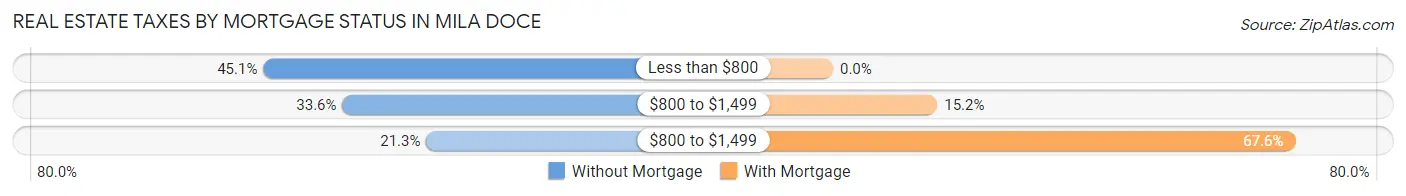
| Property Taxes | Without Mortgage | With Mortgage |
| Less than $800 | 375 (45.1%) | 0 (0.0%) |
| $800 to $1,499 | 279 (33.6%) | 46 (15.2%) |
| $800 to $1,499 | 177 (21.3%) | 204 (67.5%) |
| Total | 831 (100.0%) | 302 (100.0%) |
Health & Disability in Mila Doce
Health Insurance Coverage by Age in Mila Doce
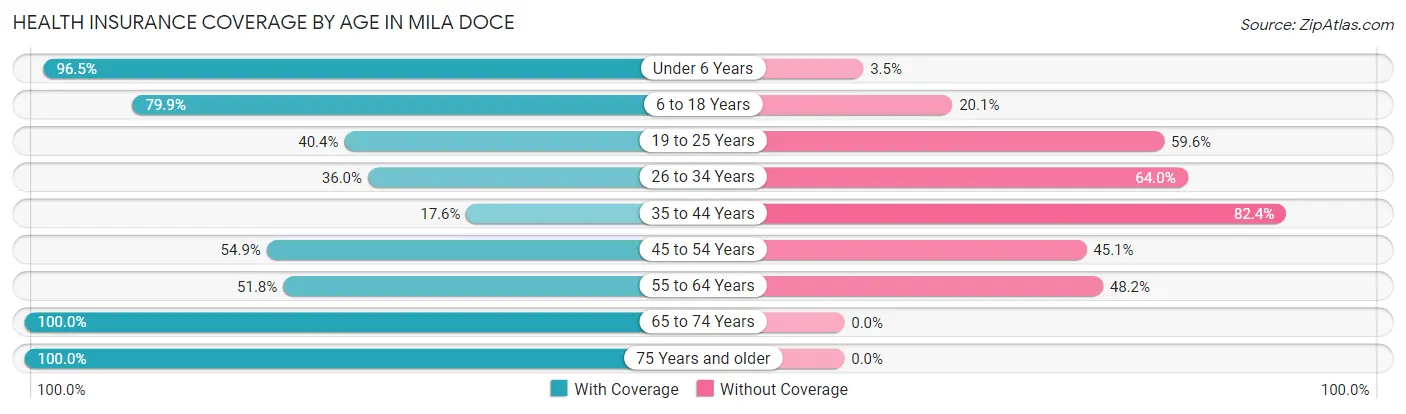
| Age Bracket | With Coverage | Without Coverage |
| Under 6 Years | 711 (96.5%) | 26 (3.5%) |
| 6 to 18 Years | 2,349 (79.9%) | 592 (20.1%) |
| 19 to 25 Years | 328 (40.4%) | 484 (59.6%) |
| 26 to 34 Years | 262 (36.0%) | 466 (64.0%) |
| 35 to 44 Years | 180 (17.6%) | 841 (82.4%) |
| 45 to 54 Years | 254 (54.9%) | 209 (45.1%) |
| 55 to 64 Years | 260 (51.8%) | 242 (48.2%) |
| 65 to 74 Years | 198 (100.0%) | 0 (0.0%) |
| 75 Years and older | 152 (100.0%) | 0 (0.0%) |
| Total | 4,694 (62.1%) | 2,860 (37.9%) |
Health Insurance Coverage by Citizenship Status in Mila Doce
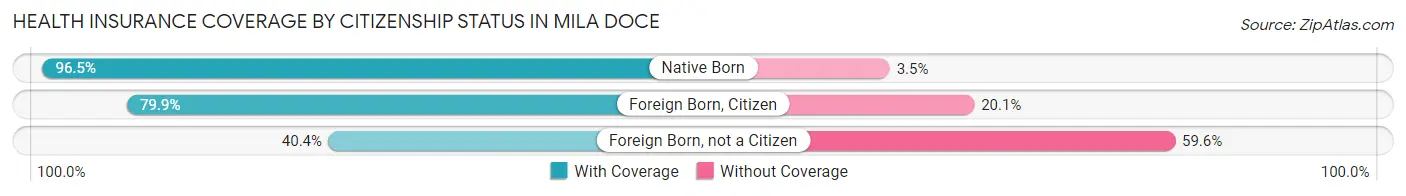
| Citizenship Status | With Coverage | Without Coverage |
| Native Born | 711 (96.5%) | 26 (3.5%) |
| Foreign Born, Citizen | 2,349 (79.9%) | 592 (20.1%) |
| Foreign Born, not a Citizen | 328 (40.4%) | 484 (59.6%) |
Health Insurance Coverage by Household Income in Mila Doce
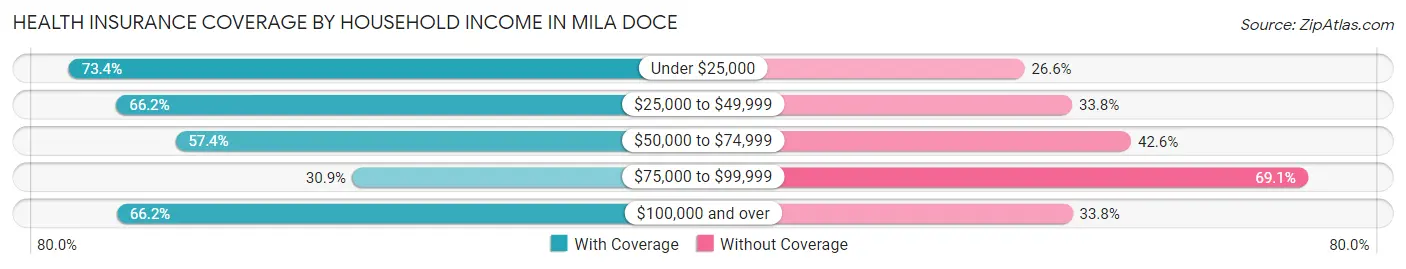
| Household Income | With Coverage | Without Coverage |
| Under $25,000 | 1,058 (73.4%) | 384 (26.6%) |
| $25,000 to $49,999 | 1,999 (66.2%) | 1,019 (33.8%) |
| $50,000 to $74,999 | 919 (57.4%) | 682 (42.6%) |
| $75,000 to $99,999 | 237 (30.9%) | 529 (69.1%) |
| $100,000 and over | 481 (66.2%) | 246 (33.8%) |
Public vs Private Health Insurance Coverage by Age in Mila Doce
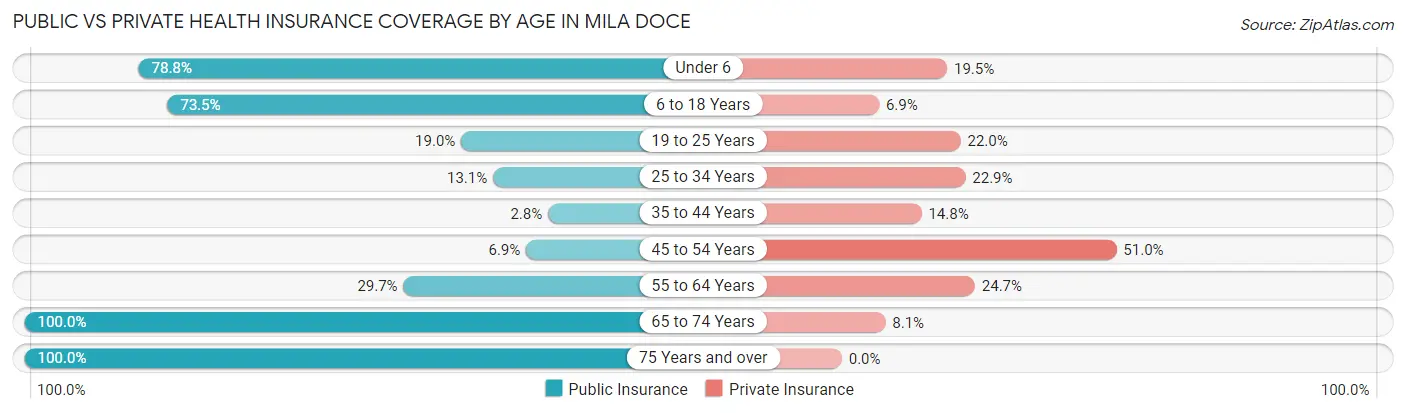
| Age Bracket | Public Insurance | Private Insurance |
| Under 6 | 581 (78.8%) | 144 (19.5%) |
| 6 to 18 Years | 2,162 (73.5%) | 203 (6.9%) |
| 19 to 25 Years | 154 (19.0%) | 179 (22.0%) |
| 25 to 34 Years | 95 (13.1%) | 167 (22.9%) |
| 35 to 44 Years | 29 (2.8%) | 151 (14.8%) |
| 45 to 54 Years | 32 (6.9%) | 236 (51.0%) |
| 55 to 64 Years | 149 (29.7%) | 124 (24.7%) |
| 65 to 74 Years | 198 (100.0%) | 16 (8.1%) |
| 75 Years and over | 152 (100.0%) | 0 (0.0%) |
| Total | 3,552 (47.0%) | 1,220 (16.2%) |
Disability Status by Sex by Age in Mila Doce
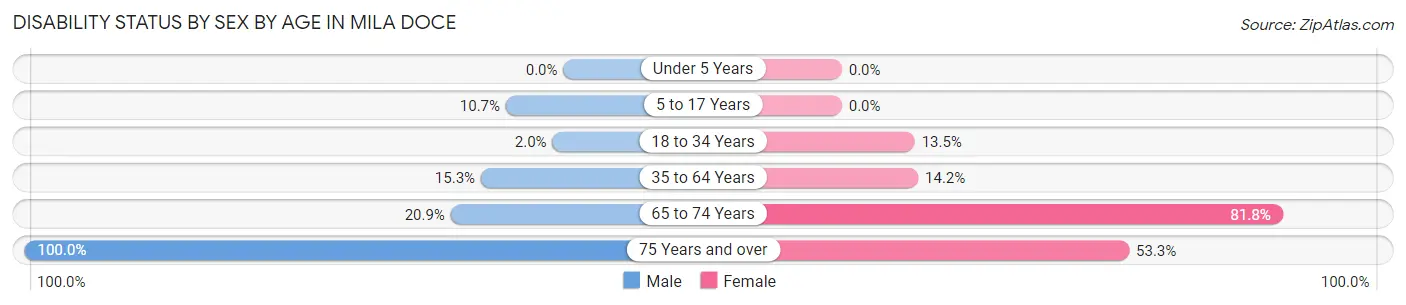
| Age Bracket | Male | Female |
| Under 5 Years | 0 (0.0%) | 0 (0.0%) |
| 5 to 17 Years | 144 (10.7%) | 0 (0.0%) |
| 18 to 34 Years | 17 (2.0%) | 133 (13.5%) |
| 35 to 64 Years | 129 (15.3%) | 162 (14.2%) |
| 65 to 74 Years | 23 (20.9%) | 72 (81.8%) |
| 75 Years and over | 77 (100.0%) | 40 (53.3%) |
Disability Class by Sex by Age in Mila Doce
Disability Class: Hearing Difficulty
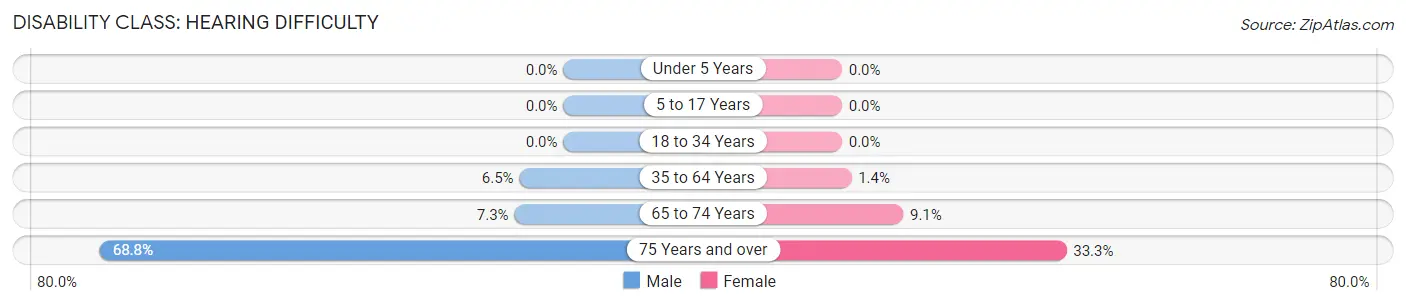
| Age Bracket | Male | Female |
| Under 5 Years | 0 (0.0%) | 0 (0.0%) |
| 5 to 17 Years | 0 (0.0%) | 0 (0.0%) |
| 18 to 34 Years | 0 (0.0%) | 0 (0.0%) |
| 35 to 64 Years | 55 (6.5%) | 16 (1.4%) |
| 65 to 74 Years | 8 (7.3%) | 8 (9.1%) |
| 75 Years and over | 53 (68.8%) | 25 (33.3%) |
Disability Class: Vision Difficulty
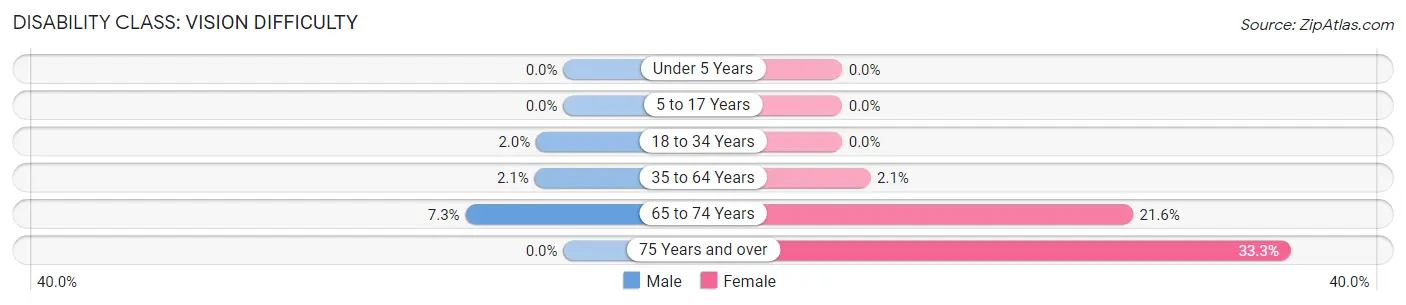
| Age Bracket | Male | Female |
| Under 5 Years | 0 (0.0%) | 0 (0.0%) |
| 5 to 17 Years | 0 (0.0%) | 0 (0.0%) |
| 18 to 34 Years | 17 (2.0%) | 0 (0.0%) |
| 35 to 64 Years | 18 (2.1%) | 24 (2.1%) |
| 65 to 74 Years | 8 (7.3%) | 19 (21.6%) |
| 75 Years and over | 0 (0.0%) | 25 (33.3%) |
Disability Class: Cognitive Difficulty
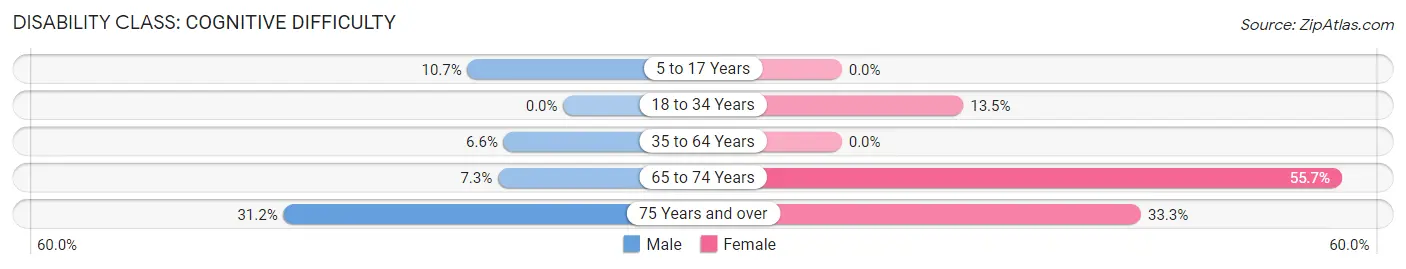
| Age Bracket | Male | Female |
| 5 to 17 Years | 144 (10.7%) | 0 (0.0%) |
| 18 to 34 Years | 0 (0.0%) | 133 (13.5%) |
| 35 to 64 Years | 56 (6.6%) | 0 (0.0%) |
| 65 to 74 Years | 8 (7.3%) | 49 (55.7%) |
| 75 Years and over | 24 (31.2%) | 25 (33.3%) |
Disability Class: Ambulatory Difficulty
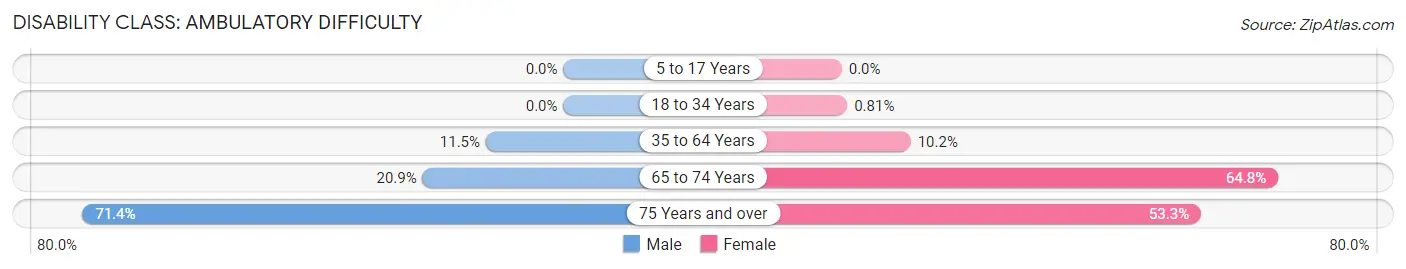
| Age Bracket | Male | Female |
| 5 to 17 Years | 0 (0.0%) | 0 (0.0%) |
| 18 to 34 Years | 0 (0.0%) | 8 (0.8%) |
| 35 to 64 Years | 97 (11.5%) | 117 (10.2%) |
| 65 to 74 Years | 23 (20.9%) | 57 (64.8%) |
| 75 Years and over | 55 (71.4%) | 40 (53.3%) |
Disability Class: Self-Care Difficulty
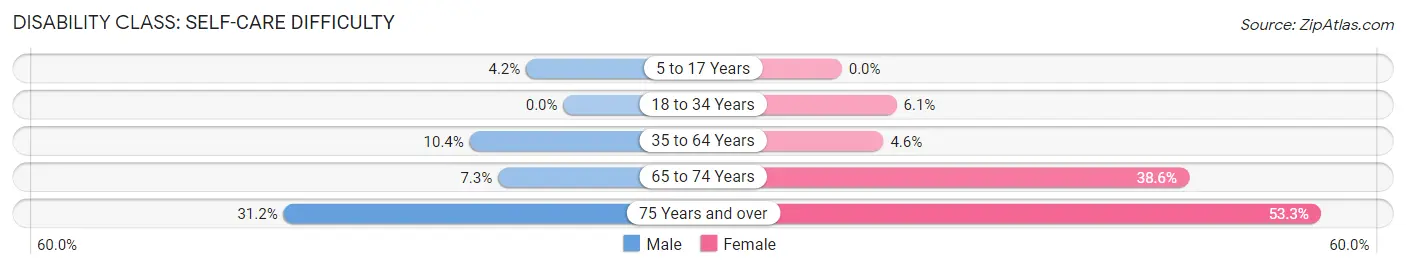
| Age Bracket | Male | Female |
| 5 to 17 Years | 56 (4.2%) | 0 (0.0%) |
| 18 to 34 Years | 0 (0.0%) | 60 (6.1%) |
| 35 to 64 Years | 88 (10.4%) | 53 (4.6%) |
| 65 to 74 Years | 8 (7.3%) | 34 (38.6%) |
| 75 Years and over | 24 (31.2%) | 40 (53.3%) |
Technology Access in Mila Doce
Computing Device Access in Mila Doce
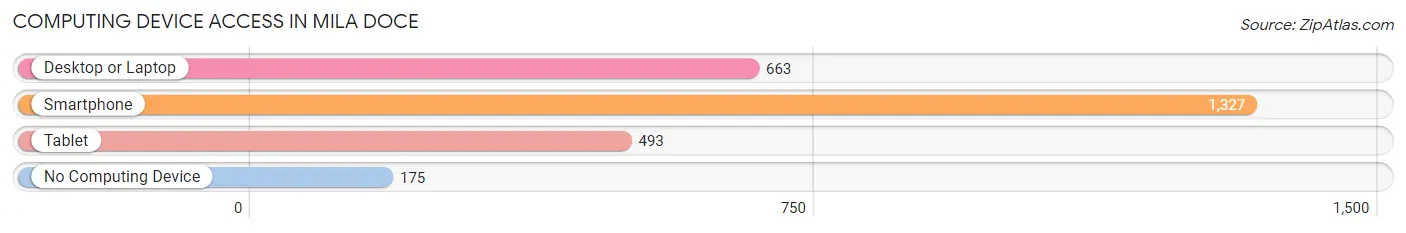
| Device Type | # Households | % Households |
| Desktop or Laptop | 663 | 43.6% |
| Smartphone | 1,327 | 87.3% |
| Tablet | 493 | 32.4% |
| No Computing Device | 175 | 11.5% |
| Total | 1,520 | 100.0% |
Internet Access in Mila Doce
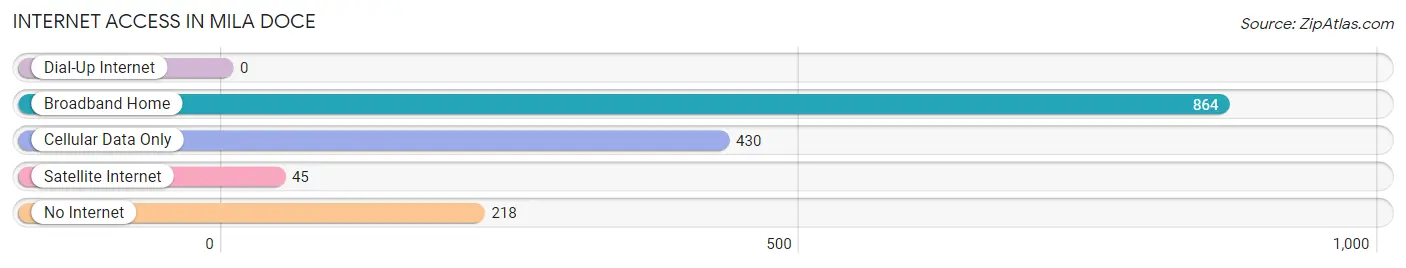
| Internet Type | # Households | % Households |
| Dial-Up Internet | 0 | 0.0% |
| Broadband Home | 864 | 56.8% |
| Cellular Data Only | 430 | 28.3% |
| Satellite Internet | 45 | 3.0% |
| No Internet | 218 | 14.3% |
| Total | 1,520 | 100.0% |
Mila Doce Summary
Mila Doce is a small town located in the state of Texas, in the United States. It is situated in the county of Hidalgo, and is part of the McAllen-Edinburg-Mission Metropolitan Statistical Area. The town has a population of approximately 1,000 people, and is known for its rural atmosphere and small-town charm.
Geography
Mila Doce is located in the Rio Grande Valley of South Texas, near the border with Mexico. The town is situated on the banks of the Rio Grande River, and is surrounded by agricultural fields and citrus groves. The climate in Mila Doce is subtropical, with hot summers and mild winters. The average annual temperature is around 75 degrees Fahrenheit.
Economy
Mila Doce’s economy is largely based on agriculture. The town is home to several large farms, which produce a variety of crops, including cotton, corn, sorghum, and citrus fruits. The town also has a number of small businesses, including restaurants, grocery stores, and gas stations.
Demographics
As of the 2010 census, the population of Mila Doce was 1,000 people. The racial makeup of the town was 94.2% Hispanic or Latino, 4.2% White, and 1.6% Other. The median household income was $25,000, and the median age was 28.
History
Mila Doce was founded in the late 19th century by a group of Mexican settlers. The town was originally called “Mila Doce”, which means “twelve miles” in Spanish. The name was chosen to reflect the distance between the town and the nearest larger settlement.
In the early 20th century, Mila Doce became a popular destination for tourists, who were drawn to the town’s rural atmosphere and small-town charm. The town also became a popular destination for Mexican immigrants, who were drawn to the area’s agricultural opportunities.
In the late 20th century, Mila Doce experienced a period of rapid growth, as the town’s population increased and new businesses opened. Today, Mila Doce is a thriving small town, with a vibrant economy and a diverse population.
Common Questions
What is Per Capita Income in Mila Doce?
Per Capita income in Mila Doce is $11,138.
What is the Median Family Income in Mila Doce?
Median Family Income in Mila Doce is $36,997.
What is the Median Household income in Mila Doce?
Median Household Income in Mila Doce is $39,247.
What is Income or Wage Gap in Mila Doce?
Income or Wage Gap in Mila Doce is 41.8%.
Women in Mila Doce earn 58.2 cents for every dollar earned by a man.
What is Family Income Deficit in Mila Doce?
Family Income Deficit in Mila Doce is $14,507.
Families that are below poverty line in Mila Doce earn $14,507 less on average than the poverty threshold level.
What is Inequality or Gini Index in Mila Doce?
Inequality or Gini Index in Mila Doce is 0.43.
What is the Total Population of Mila Doce?
Total Population of Mila Doce is 7,554.
What is the Total Male Population of Mila Doce?
Total Male Population of Mila Doce is 3,567.
What is the Total Female Population of Mila Doce?
Total Female Population of Mila Doce is 3,987.
What is the Ratio of Males per 100 Females in Mila Doce?
There are 89.47 Males per 100 Females in Mila Doce.
What is the Ratio of Females per 100 Males in Mila Doce?
There are 111.77 Females per 100 Males in Mila Doce.
What is the Median Population Age in Mila Doce?
Median Population Age in Mila Doce is 19.8 Years.
What is the Average Family Size in Mila Doce
Average Family Size in Mila Doce is 5.3 People.
What is the Average Household Size in Mila Doce
Average Household Size in Mila Doce is 5.0 People.
How Large is the Labor Force in Mila Doce?
There are 2,745 People in the Labor Forcein in Mila Doce.
What is the Percentage of People in the Labor Force in Mila Doce?
60.4% of People are in the Labor Force in Mila Doce.
What is the Unemployment Rate in Mila Doce?
Unemployment Rate in Mila Doce is 6.4%.