Boiling Springs, SC Map & Demographics
Boiling Springs Map
Boiling Springs Overview
$34,688
PER CAPITA INCOME
$85,705
AVG FAMILY INCOME
$68,993
AVG HOUSEHOLD INCOME
32.8%
WAGE / INCOME GAP [ % ]
67.2¢/ $1
WAGE / INCOME GAP [ $ ]
$8,758
FAMILY INCOME DEFICIT
0.42
INEQUALITY / GINI INDEX
11,191
TOTAL POPULATION
5,248
MALE POPULATION
5,943
FEMALE POPULATION
88.31
MALES / 100 FEMALES
113.24
FEMALES / 100 MALES
36.6
MEDIAN AGE
3.1
AVG FAMILY SIZE
2.5
AVG HOUSEHOLD SIZE
5,476
LABOR FORCE [ PEOPLE ]
64.0%
PERCENT IN LABOR FORCE
3.9%
UNEMPLOYMENT RATE
Boiling Springs Zip Codes
Boiling Springs Area Codes
Income in Boiling Springs
Income Overview in Boiling Springs
Per Capita Income in Boiling Springs is $34,688, while median incomes of families and households are $85,705 and $68,993 respectively.
| Characteristic | Number | Measure |
| Per Capita Income | 11,191 | $34,688 |
| Median Family Income | 3,175 | $85,705 |
| Mean Family Income | 3,175 | $102,753 |
| Median Household Income | 4,378 | $68,993 |
| Mean Household Income | 4,378 | $87,399 |
| Income Deficit | 3,175 | $8,758 |
| Wage / Income Gap (%) | 11,191 | 32.76% |
| Wage / Income Gap ($) | 11,191 | 67.24¢ per $1 |
| Gini / Inequality Index | 11,191 | 0.42 |
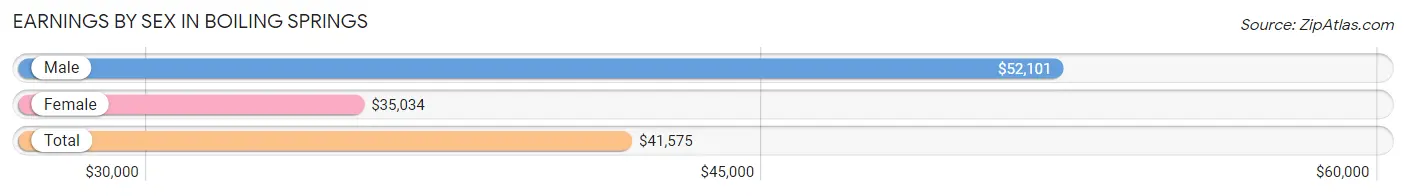
Earnings by Sex in Boiling Springs
Average Earnings in Boiling Springs are $41,575, $52,101 for men and $35,034 for women, a difference of 32.8%.
| Sex | Number | Average Earnings |
| Male | 2,922 (50.5%) | $52,101 |
| Female | 2,863 (49.5%) | $35,034 |
| Total | 5,785 (100.0%) | $41,575 |
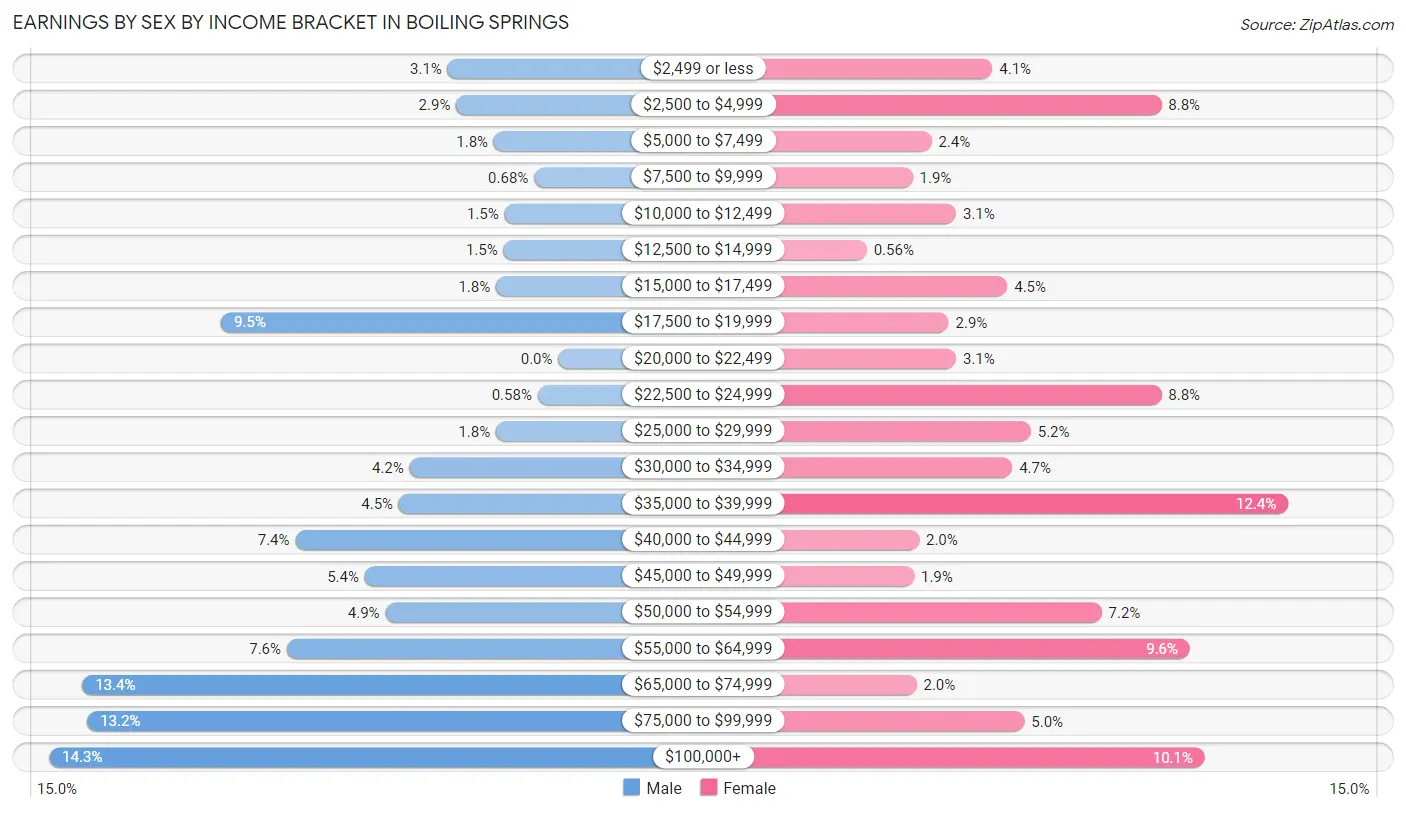
Earnings by Sex by Income Bracket in Boiling Springs
The most common earnings brackets in Boiling Springs are $100,000+ for men (418 | 14.3%) and $35,000 to $39,999 for women (355 | 12.4%).
| Income | Male | Female |
| $2,499 or less | 91 (3.1%) | 117 (4.1%) |
| $2,500 to $4,999 | 84 (2.9%) | 253 (8.8%) |
| $5,000 to $7,499 | 53 (1.8%) | 68 (2.4%) |
| $7,500 to $9,999 | 20 (0.7%) | 53 (1.8%) |
| $10,000 to $12,499 | 44 (1.5%) | 88 (3.1%) |
| $12,500 to $14,999 | 45 (1.5%) | 16 (0.6%) |
| $15,000 to $17,499 | 51 (1.8%) | 129 (4.5%) |
| $17,500 to $19,999 | 277 (9.5%) | 82 (2.9%) |
| $20,000 to $22,499 | 0 (0.0%) | 88 (3.1%) |
| $22,500 to $24,999 | 17 (0.6%) | 253 (8.8%) |
| $25,000 to $29,999 | 51 (1.8%) | 148 (5.2%) |
| $30,000 to $34,999 | 122 (4.2%) | 133 (4.6%) |
| $35,000 to $39,999 | 131 (4.5%) | 355 (12.4%) |
| $40,000 to $44,999 | 216 (7.4%) | 58 (2.0%) |
| $45,000 to $49,999 | 159 (5.4%) | 54 (1.9%) |
| $50,000 to $54,999 | 142 (4.9%) | 205 (7.2%) |
| $55,000 to $64,999 | 223 (7.6%) | 276 (9.6%) |
| $65,000 to $74,999 | 391 (13.4%) | 56 (2.0%) |
| $75,000 to $99,999 | 387 (13.2%) | 143 (5.0%) |
| $100,000+ | 418 (14.3%) | 288 (10.1%) |
| Total | 2,922 (100.0%) | 2,863 (100.0%) |
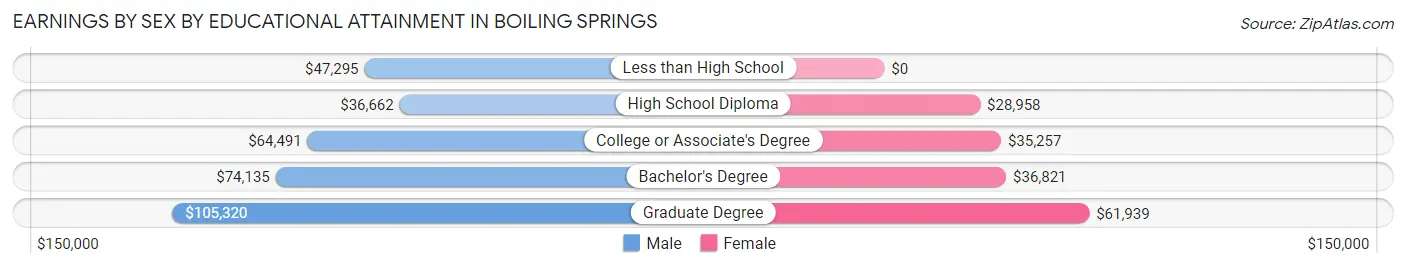
Earnings by Sex by Educational Attainment in Boiling Springs
Average earnings in Boiling Springs are $63,630 for men and $35,990 for women, a difference of 43.4%. Men with an educational attainment of graduate degree enjoy the highest average annual earnings of $105,320, while those with high school diploma education earn the least with $36,662. Women with an educational attainment of graduate degree earn the most with the average annual earnings of $61,939, while those with high school diploma education have the smallest earnings of $28,958.
| Educational Attainment | Male Income | Female Income |
| Less than High School | $47,295 | $0 |
| High School Diploma | $36,662 | $28,958 |
| College or Associate's Degree | $64,491 | $35,257 |
| Bachelor's Degree | $74,135 | $36,821 |
| Graduate Degree | $105,320 | $61,939 |
| Total | $63,630 | $35,990 |
Family Income in Boiling Springs
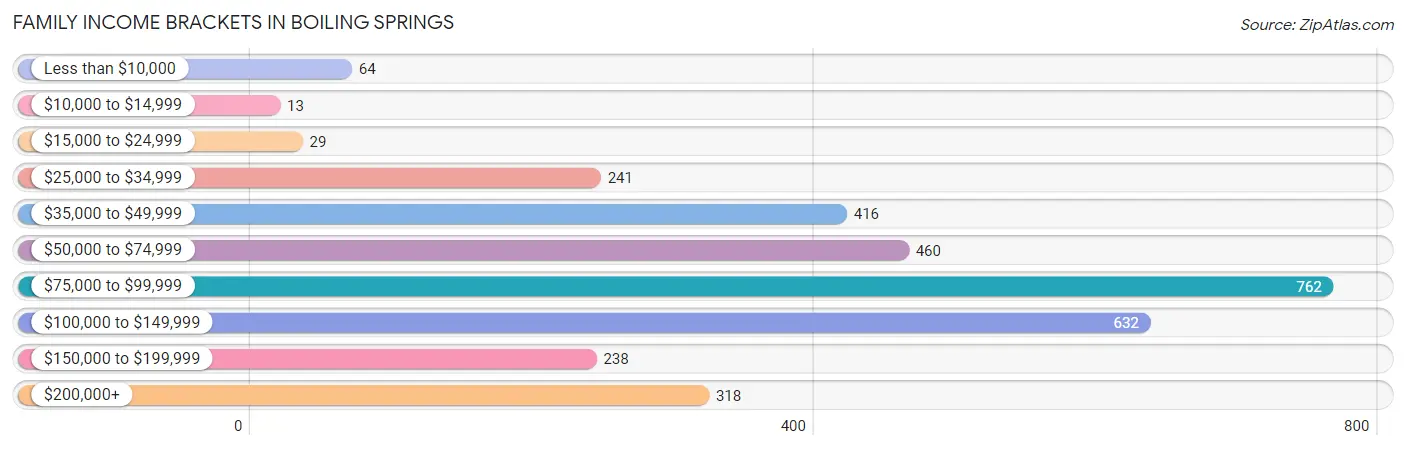
Family Income Brackets in Boiling Springs
According to the Boiling Springs family income data, there are 762 families falling into the $75,000 to $99,999 income range, which is the most common income bracket and makes up 24.0% of all families. Conversely, the $10,000 to $14,999 income bracket is the least frequent group with only 13 families (0.4%) belonging to this category.
| Income Bracket | # Families | % Families |
| Less than $10,000 | 64 | 2.0% |
| $10,000 to $14,999 | 13 | 0.4% |
| $15,000 to $24,999 | 29 | 0.9% |
| $25,000 to $34,999 | 241 | 7.6% |
| $35,000 to $49,999 | 416 | 13.1% |
| $50,000 to $74,999 | 460 | 14.5% |
| $75,000 to $99,999 | 762 | 24.0% |
| $100,000 to $149,999 | 632 | 19.9% |
| $150,000 to $199,999 | 238 | 7.5% |
| $200,000+ | 318 | 10.0% |
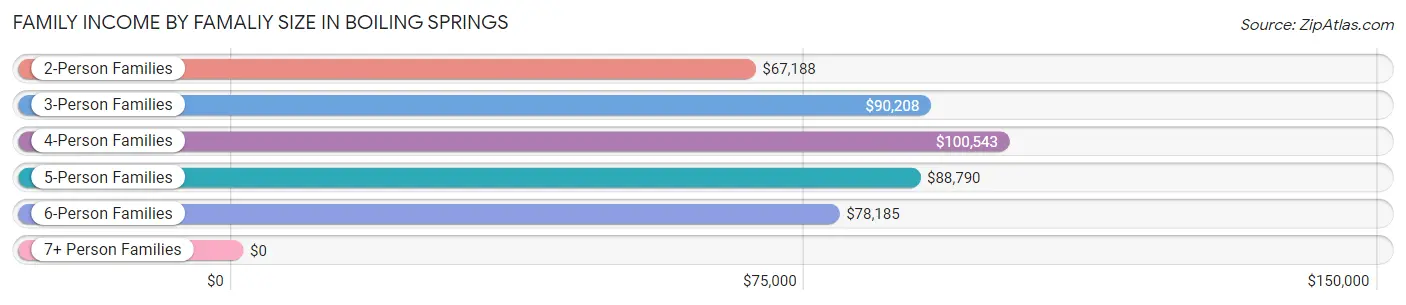
Family Income by Famaliy Size in Boiling Springs
4-person families (870 | 27.4%) account for the highest median family income in Boiling Springs with $100,543 per family, while 2-person families (1,207 | 38.0%) have the highest median income of $33,594 per family member.
| Income Bracket | # Families | Median Income |
| 2-Person Families | 1,207 (38.0%) | $67,188 |
| 3-Person Families | 603 (19.0%) | $90,208 |
| 4-Person Families | 870 (27.4%) | $100,543 |
| 5-Person Families | 292 (9.2%) | $88,790 |
| 6-Person Families | 203 (6.4%) | $78,185 |
| 7+ Person Families | 0 (0.0%) | $0 |
| Total | 3,175 (100.0%) | $85,705 |
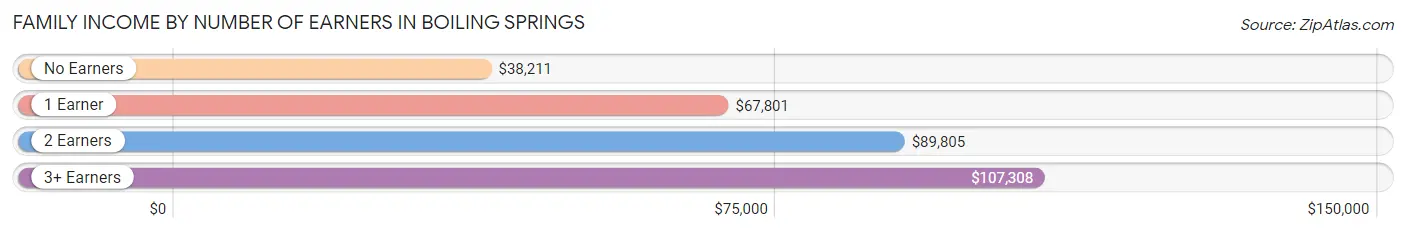
Family Income by Number of Earners in Boiling Springs
The median family income in Boiling Springs is $85,705, with families comprising 3+ earners (276) having the highest median family income of $107,308, while families with no earners (457) have the lowest median family income of $38,211, accounting for 8.7% and 14.4% of families, respectively.
| Number of Earners | # Families | Median Income |
| No Earners | 457 (14.4%) | $38,211 |
| 1 Earner | 573 (18.0%) | $67,801 |
| 2 Earners | 1,869 (58.9%) | $89,805 |
| 3+ Earners | 276 (8.7%) | $107,308 |
| Total | 3,175 (100.0%) | $85,705 |
Household Income in Boiling Springs
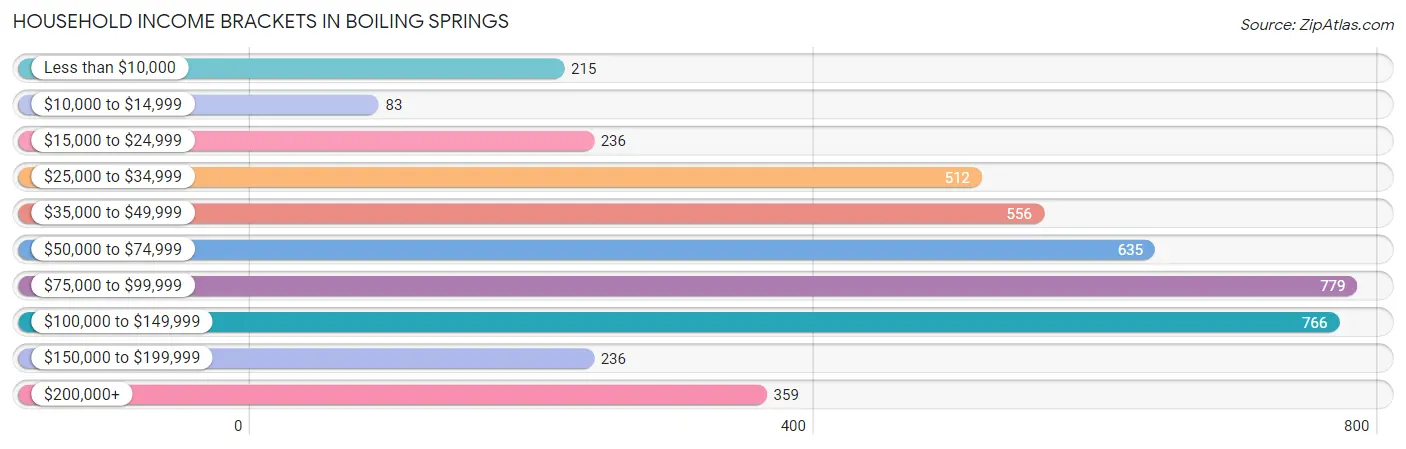
Household Income Brackets in Boiling Springs
With 779 households falling in the category, the $75,000 to $99,999 income range is the most frequent in Boiling Springs, accounting for 17.8% of all households. In contrast, only 83 households (1.9%) fall into the $10,000 to $14,999 income bracket, making it the least populous group.
| Income Bracket | # Households | % Households |
| Less than $10,000 | 215 | 4.9% |
| $10,000 to $14,999 | 83 | 1.9% |
| $15,000 to $24,999 | 236 | 5.4% |
| $25,000 to $34,999 | 512 | 11.7% |
| $35,000 to $49,999 | 556 | 12.7% |
| $50,000 to $74,999 | 635 | 14.5% |
| $75,000 to $99,999 | 779 | 17.8% |
| $100,000 to $149,999 | 766 | 17.5% |
| $150,000 to $199,999 | 236 | 5.4% |
| $200,000+ | 359 | 8.2% |
Household Income by Householder Age in Boiling Springs
The median household income in Boiling Springs is $68,993, with the highest median household income of $87,743 found in the 25 to 44 years age bracket for the primary householder. A total of 1,621 households (37.0%) fall into this category. Meanwhile, the 15 to 24 years age bracket for the primary householder has the lowest median household income of $0, with 88 households (2.0%) in this group.
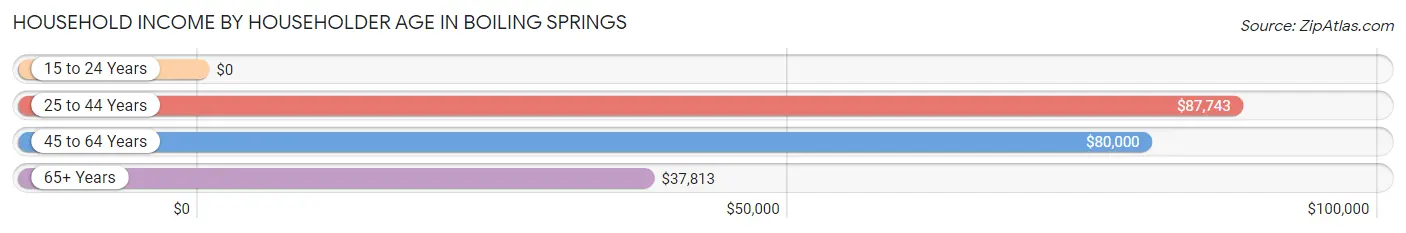
| Income Bracket | # Households | Median Income |
| 15 to 24 Years | 88 (2.0%) | $0 |
| 25 to 44 Years | 1,621 (37.0%) | $87,743 |
| 45 to 64 Years | 1,640 (37.5%) | $80,000 |
| 65+ Years | 1,029 (23.5%) | $37,813 |
| Total | 4,378 (100.0%) | $68,993 |
Poverty in Boiling Springs
Income Below Poverty by Sex and Age in Boiling Springs
With 10.0% poverty level for males and 8.3% for females among the residents of Boiling Springs, 16 and 17 year old males and 6 to 11 year old females are the most vulnerable to poverty, with 58 males (50.4%) and 82 females (16.1%) in their respective age groups living below the poverty level.
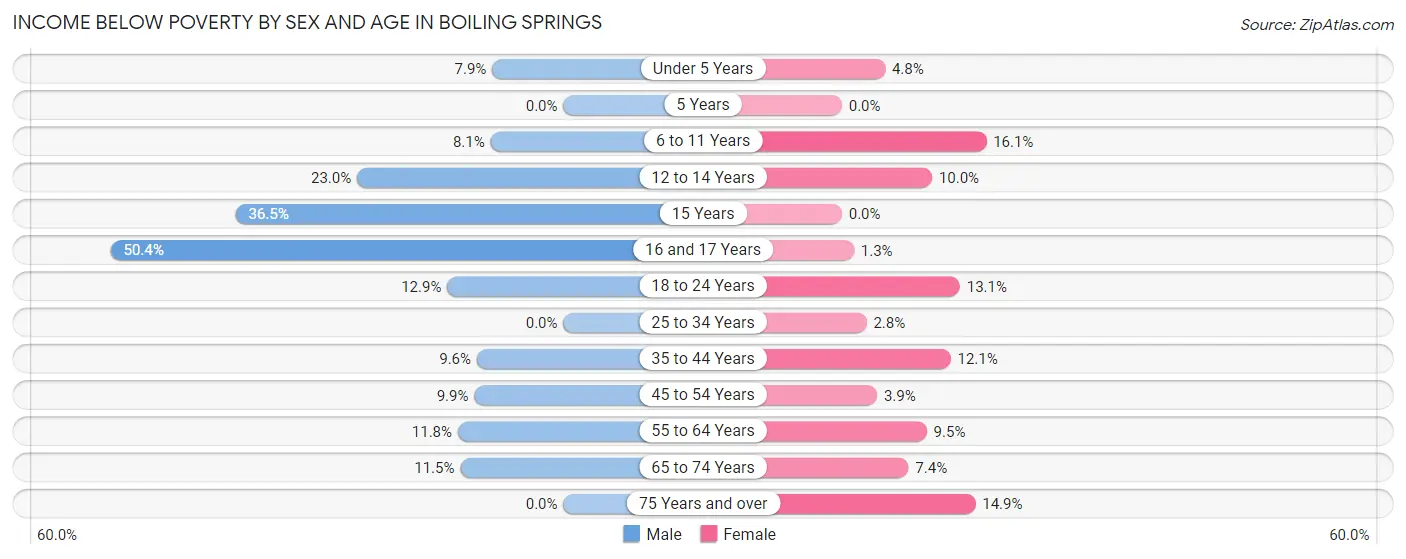
| Age Bracket | Male | Female |
| Under 5 Years | 18 (7.9%) | 22 (4.8%) |
| 5 Years | 0 (0.0%) | 0 (0.0%) |
| 6 to 11 Years | 63 (8.1%) | 82 (16.1%) |
| 12 to 14 Years | 54 (23.0%) | 27 (10.0%) |
| 15 Years | 23 (36.5%) | 0 (0.0%) |
| 16 and 17 Years | 58 (50.4%) | 4 (1.3%) |
| 18 to 24 Years | 53 (12.9%) | 41 (13.1%) |
| 25 to 34 Years | 0 (0.0%) | 24 (2.8%) |
| 35 to 44 Years | 63 (9.6%) | 100 (12.1%) |
| 45 to 54 Years | 76 (9.9%) | 28 (3.9%) |
| 55 to 64 Years | 63 (11.7%) | 75 (9.5%) |
| 65 to 74 Years | 48 (11.5%) | 33 (7.4%) |
| 75 Years and over | 0 (0.0%) | 58 (14.9%) |
| Total | 519 (10.0%) | 494 (8.3%) |
Income Above Poverty by Sex and Age in Boiling Springs
According to the poverty statistics in Boiling Springs, males aged 5 years and females aged 5 years are the age groups that are most secure financially, with 100.0% of males and 100.0% of females in these age groups living above the poverty line.
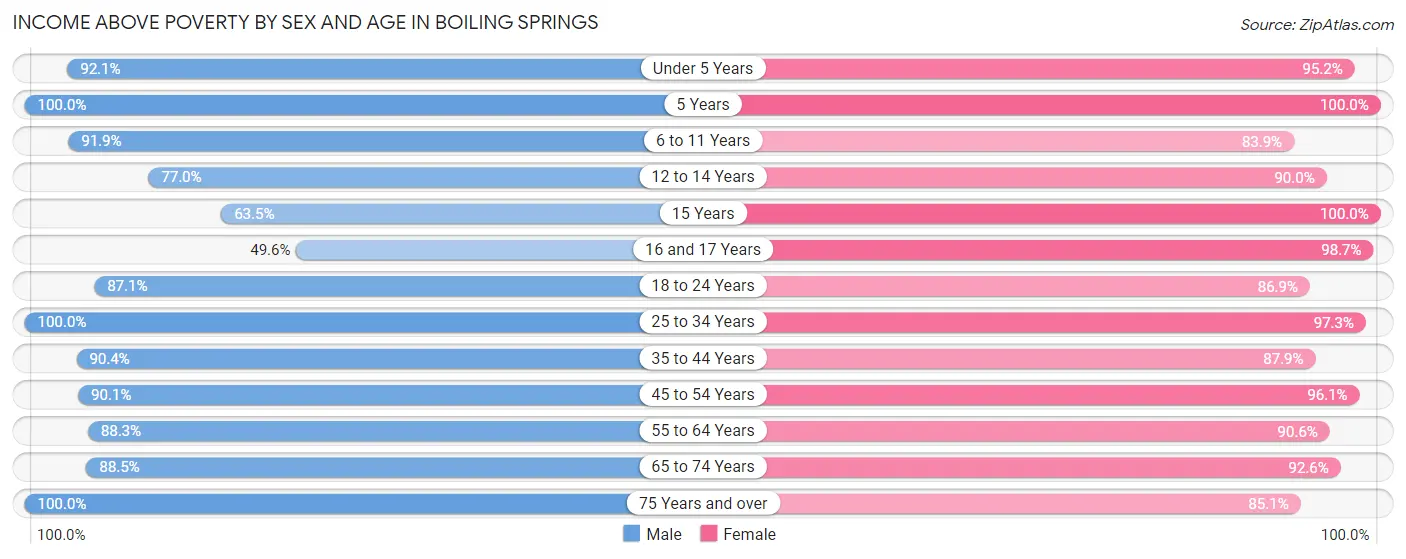
| Age Bracket | Male | Female |
| Under 5 Years | 209 (92.1%) | 435 (95.2%) |
| 5 Years | 56 (100.0%) | 26 (100.0%) |
| 6 to 11 Years | 714 (91.9%) | 428 (83.9%) |
| 12 to 14 Years | 181 (77.0%) | 242 (90.0%) |
| 15 Years | 40 (63.5%) | 14 (100.0%) |
| 16 and 17 Years | 57 (49.6%) | 295 (98.7%) |
| 18 to 24 Years | 357 (87.1%) | 271 (86.9%) |
| 25 to 34 Years | 663 (100.0%) | 849 (97.3%) |
| 35 to 44 Years | 591 (90.4%) | 726 (87.9%) |
| 45 to 54 Years | 690 (90.1%) | 687 (96.1%) |
| 55 to 64 Years | 473 (88.2%) | 719 (90.5%) |
| 65 to 74 Years | 370 (88.5%) | 412 (92.6%) |
| 75 Years and over | 288 (100.0%) | 332 (85.1%) |
| Total | 4,689 (90.0%) | 5,436 (91.7%) |
Income Below Poverty Among Married-Couple Families in Boiling Springs
The poverty statistics for married-couple families in Boiling Springs show that 6.7% or 183 of the total 2,745 families live below the poverty line. Families with 3 or 4 children have the highest poverty rate of 13.7%, comprising of 62 families. On the other hand, families with no children have the lowest poverty rate of 4.6%, which includes 55 families.
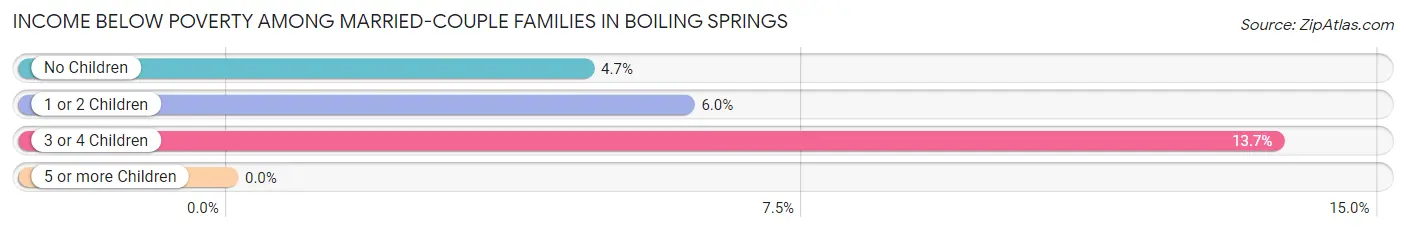
| Children | Above Poverty | Below Poverty |
| No Children | 1,128 (95.4%) | 55 (4.6%) |
| 1 or 2 Children | 1,042 (94.0%) | 66 (6.0%) |
| 3 or 4 Children | 392 (86.3%) | 62 (13.7%) |
| 5 or more Children | 0 (0.0%) | 0 (0.0%) |
| Total | 2,562 (93.3%) | 183 (6.7%) |
Income Below Poverty Among Single-Parent Households in Boiling Springs
| Children | Single Father | Single Mother |
| No Children | 0 (0.0%) | 0 (0.0%) |
| 1 or 2 Children | 0 (0.0%) | 0 (0.0%) |
| 3 or 4 Children | 0 (0.0%) | 0 (0.0%) |
| 5 or more Children | 0 (0.0%) | 0 (0.0%) |
| Total | 0 (0.0%) | 0 (0.0%) |
Income Below Poverty Among Married-Couple vs Single-Parent Households in Boiling Springs
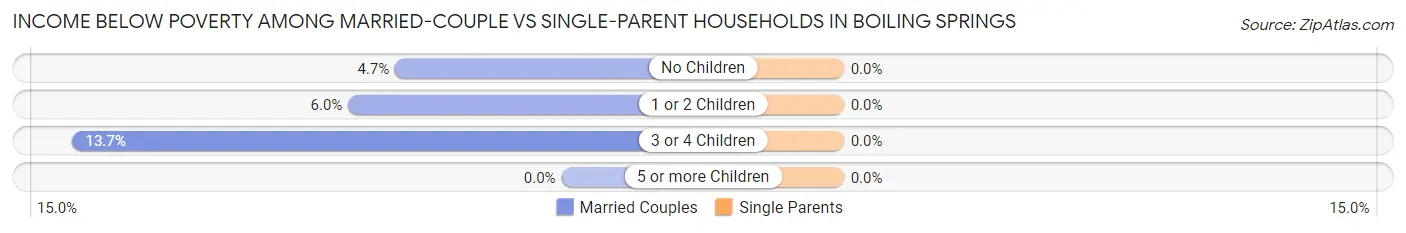
| Children | Married-Couple Families | Single-Parent Households |
| No Children | 55 (4.6%) | 0 (0.0%) |
| 1 or 2 Children | 66 (6.0%) | 0 (0.0%) |
| 3 or 4 Children | 62 (13.7%) | 0 (0.0%) |
| 5 or more Children | 0 (0.0%) | 0 (0.0%) |
| Total | 183 (6.7%) | 0 (0.0%) |
Race in Boiling Springs
The most populous races in Boiling Springs are White / Caucasian (8,137 | 72.7%), Black / African American (1,540 | 13.8%), and Two or more Races (1,022 | 9.1%).
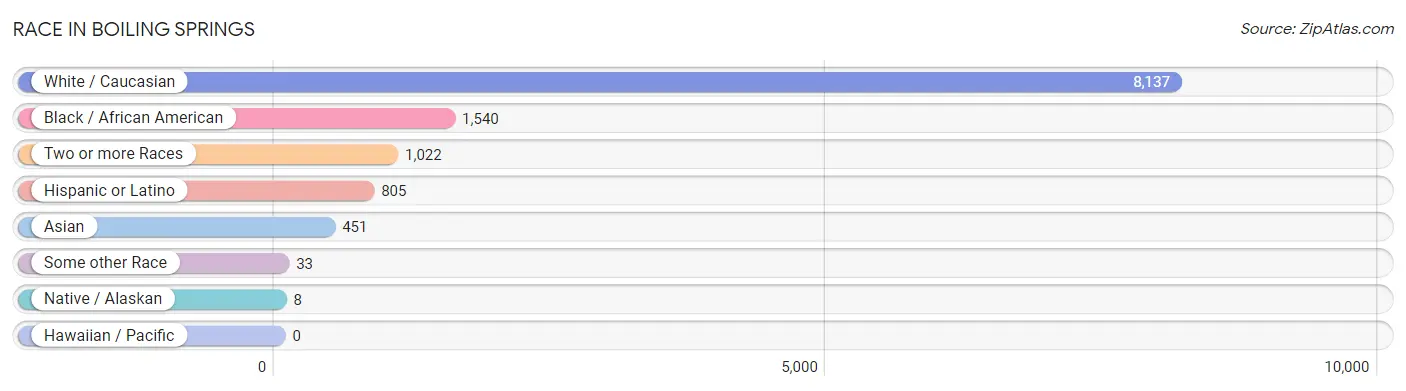
| Race | # Population | % Population |
| Asian | 451 | 4.0% |
| Black / African American | 1,540 | 13.8% |
| Hawaiian / Pacific | 0 | 0.0% |
| Hispanic or Latino | 805 | 7.2% |
| Native / Alaskan | 8 | 0.1% |
| White / Caucasian | 8,137 | 72.7% |
| Two or more Races | 1,022 | 9.1% |
| Some other Race | 33 | 0.3% |
| Total | 11,191 | 100.0% |
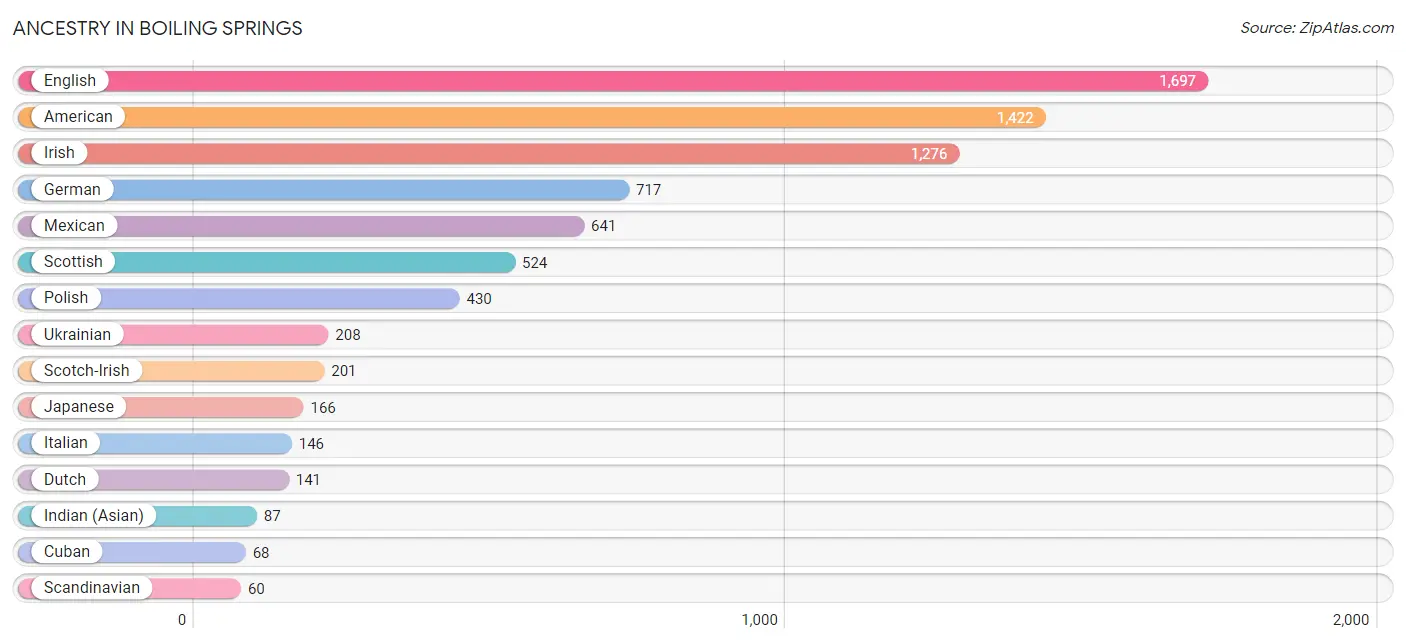
Ancestry in Boiling Springs
The most populous ancestries reported in Boiling Springs are English (1,697 | 15.2%), American (1,422 | 12.7%), Irish (1,276 | 11.4%), German (717 | 6.4%), and Mexican (641 | 5.7%), together accounting for 51.4% of all Boiling Springs residents.
| Ancestry | # Population | % Population |
| American | 1,422 | 12.7% |
| Arab | 26 | 0.2% |
| Argentinean | 26 | 0.2% |
| Austrian | 28 | 0.3% |
| British | 36 | 0.3% |
| Burmese | 32 | 0.3% |
| Central American | 27 | 0.2% |
| Cherokee | 10 | 0.1% |
| Cuban | 68 | 0.6% |
| Dutch | 141 | 1.3% |
| English | 1,697 | 15.2% |
| Ethiopian | 58 | 0.5% |
| European | 21 | 0.2% |
| French | 53 | 0.5% |
| German | 717 | 6.4% |
| Greek | 20 | 0.2% |
| Honduran | 27 | 0.2% |
| Indian (Asian) | 87 | 0.8% |
| Iranian | 35 | 0.3% |
| Irish | 1,276 | 11.4% |
| Italian | 146 | 1.3% |
| Japanese | 166 | 1.5% |
| Lebanese | 26 | 0.2% |
| Malaysian | 42 | 0.4% |
| Mexican | 641 | 5.7% |
| Mexican American Indian | 8 | 0.1% |
| Northern European | 21 | 0.2% |
| Norwegian | 15 | 0.1% |
| Pakistani | 31 | 0.3% |
| Polish | 430 | 3.8% |
| Portuguese | 21 | 0.2% |
| Puerto Rican | 43 | 0.4% |
| Romanian | 21 | 0.2% |
| Russian | 51 | 0.5% |
| Scandinavian | 60 | 0.5% |
| Scotch-Irish | 201 | 1.8% |
| Scottish | 524 | 4.7% |
| Slovene | 11 | 0.1% |
| South American | 26 | 0.2% |
| Sri Lankan | 28 | 0.3% |
| Subsaharan African | 58 | 0.5% |
| Swedish | 19 | 0.2% |
| Swiss | 4 | 0.0% |
| Thai | 58 | 0.5% |
| Ukrainian | 208 | 1.9% |
| Welsh | 11 | 0.1% | View All 46 Rows |
Immigrants in Boiling Springs
The most numerous immigrant groups reported in Boiling Springs came from Latin America (392 | 3.5%), Central America (324 | 2.9%), Mexico (297 | 2.6%), Asia (249 | 2.2%), and Europe (238 | 2.1%), together accounting for 13.4% of all Boiling Springs residents.
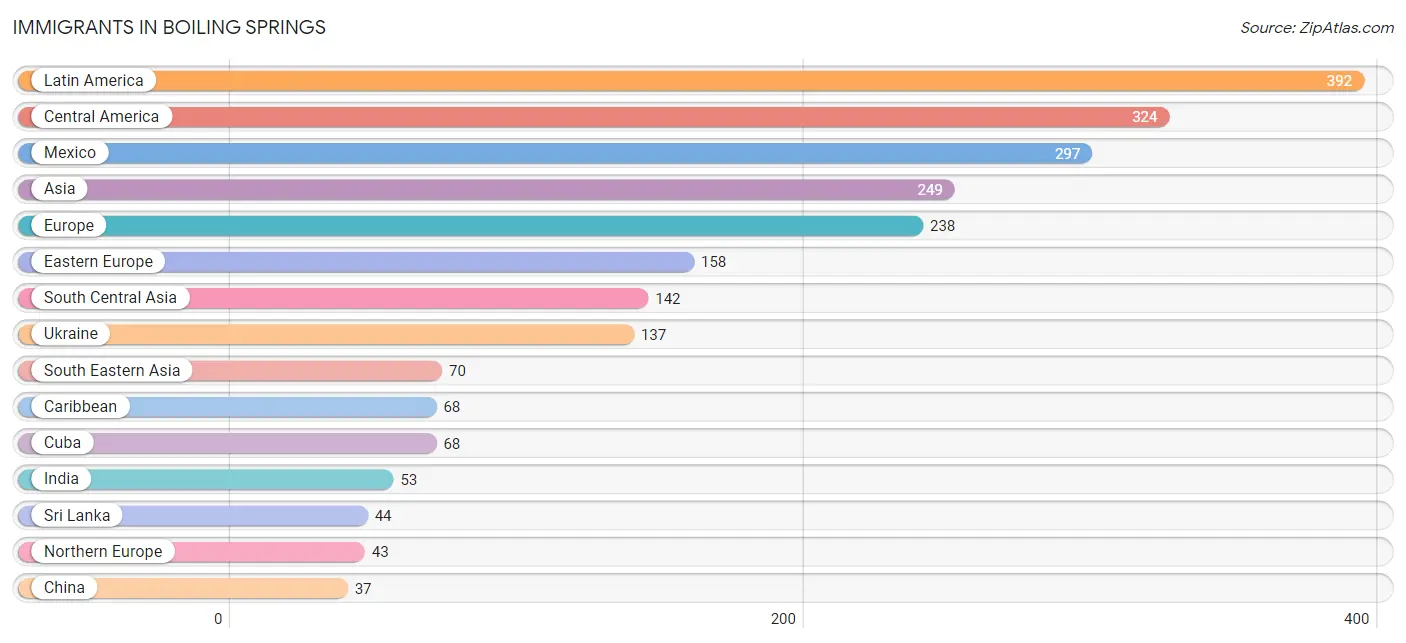
| Immigration Origin | # Population | % Population |
| Asia | 249 | 2.2% |
| Austria | 13 | 0.1% |
| Cambodia | 11 | 0.1% |
| Canada | 10 | 0.1% |
| Caribbean | 68 | 0.6% |
| Central America | 324 | 2.9% |
| China | 37 | 0.3% |
| Cuba | 68 | 0.6% |
| Eastern Asia | 37 | 0.3% |
| Eastern Europe | 158 | 1.4% |
| Europe | 238 | 2.1% |
| Germany | 20 | 0.2% |
| Honduras | 27 | 0.2% |
| India | 53 | 0.5% |
| Iran | 26 | 0.2% |
| Italy | 4 | 0.0% |
| Kazakhstan | 19 | 0.2% |
| Latin America | 392 | 3.5% |
| Mexico | 297 | 2.6% |
| Northern Europe | 43 | 0.4% |
| Russia | 21 | 0.2% |
| South Central Asia | 142 | 1.3% |
| South Eastern Asia | 70 | 0.6% |
| Southern Europe | 4 | 0.0% |
| Sri Lanka | 44 | 0.4% |
| Taiwan | 9 | 0.1% |
| Thailand | 31 | 0.3% |
| Ukraine | 137 | 1.2% |
| Vietnam | 28 | 0.3% |
| Western Europe | 33 | 0.3% | View All 30 Rows |
Sex and Age in Boiling Springs
Sex and Age in Boiling Springs
The most populous age groups in Boiling Springs are 5 to 9 Years (582 | 11.1%) for men and 60 to 64 Years (546 | 9.2%) for women.
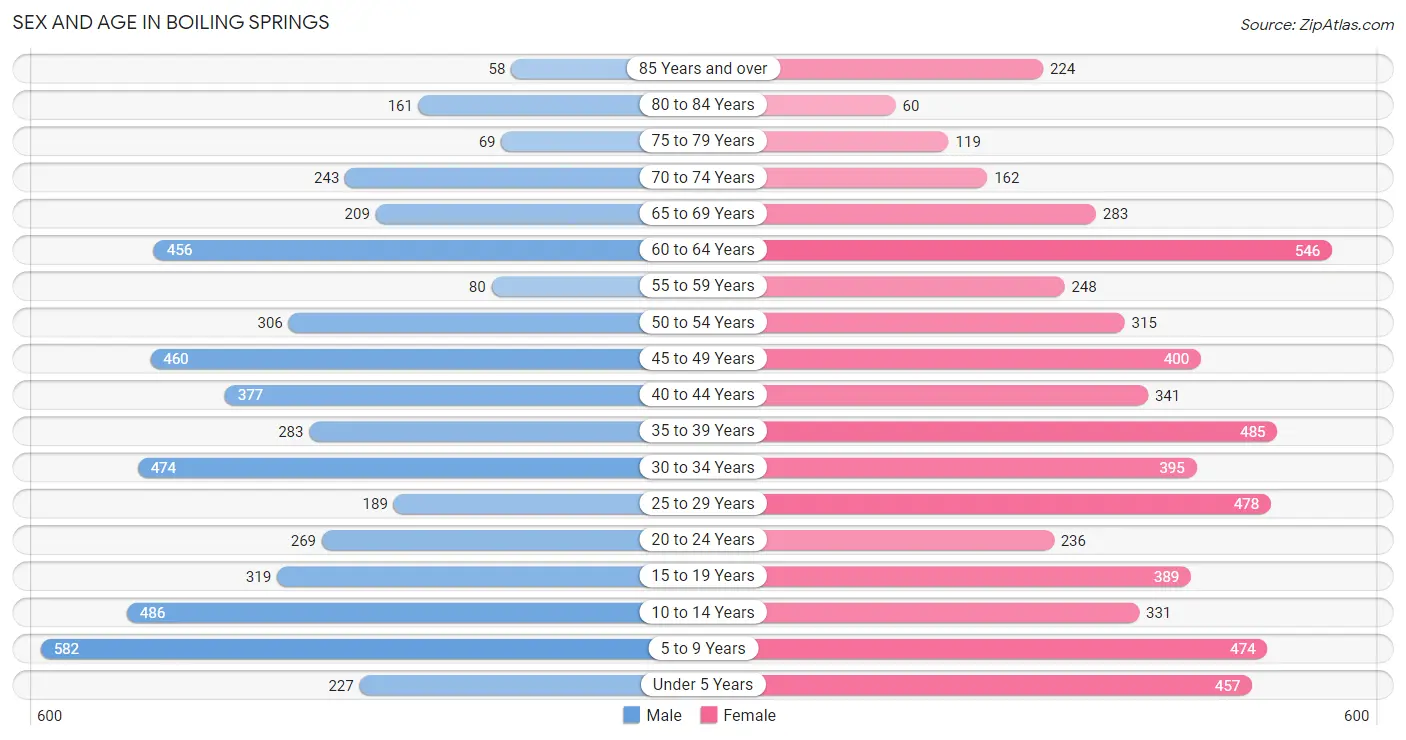
| Age Bracket | Male | Female |
| Under 5 Years | 227 (4.3%) | 457 (7.7%) |
| 5 to 9 Years | 582 (11.1%) | 474 (8.0%) |
| 10 to 14 Years | 486 (9.3%) | 331 (5.6%) |
| 15 to 19 Years | 319 (6.1%) | 389 (6.6%) |
| 20 to 24 Years | 269 (5.1%) | 236 (4.0%) |
| 25 to 29 Years | 189 (3.6%) | 478 (8.0%) |
| 30 to 34 Years | 474 (9.0%) | 395 (6.7%) |
| 35 to 39 Years | 283 (5.4%) | 485 (8.2%) |
| 40 to 44 Years | 377 (7.2%) | 341 (5.7%) |
| 45 to 49 Years | 460 (8.8%) | 400 (6.7%) |
| 50 to 54 Years | 306 (5.8%) | 315 (5.3%) |
| 55 to 59 Years | 80 (1.5%) | 248 (4.2%) |
| 60 to 64 Years | 456 (8.7%) | 546 (9.2%) |
| 65 to 69 Years | 209 (4.0%) | 283 (4.8%) |
| 70 to 74 Years | 243 (4.6%) | 162 (2.7%) |
| 75 to 79 Years | 69 (1.3%) | 119 (2.0%) |
| 80 to 84 Years | 161 (3.1%) | 60 (1.0%) |
| 85 Years and over | 58 (1.1%) | 224 (3.8%) |
| Total | 5,248 (100.0%) | 5,943 (100.0%) |
Families and Households in Boiling Springs
Median Family Size in Boiling Springs
The median family size in Boiling Springs is 3.11 persons per family, with married-couple families (2,745 | 86.5%) accounting for the largest median family size of 3.18 persons per family. On the other hand, single male/father families (63 | 2.0%) represent the smallest median family size with 1.81 persons per family.
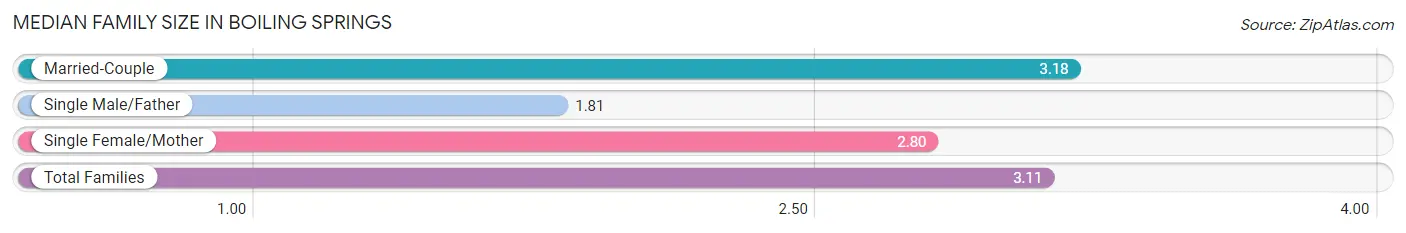
| Family Type | # Families | Family Size |
| Married-Couple | 2,745 (86.5%) | 3.18 |
| Single Male/Father | 63 (2.0%) | 1.81 |
| Single Female/Mother | 367 (11.6%) | 2.80 |
| Total Families | 3,175 (100.0%) | 3.11 |
Median Household Size in Boiling Springs
The median household size in Boiling Springs is 2.54 persons per household, with married-couple households (2,745 | 62.7%) accounting for the largest median household size of 3.18 persons per household. non-family households (1,203 | 27.5%) represent the smallest median household size with 1.04 persons per household.
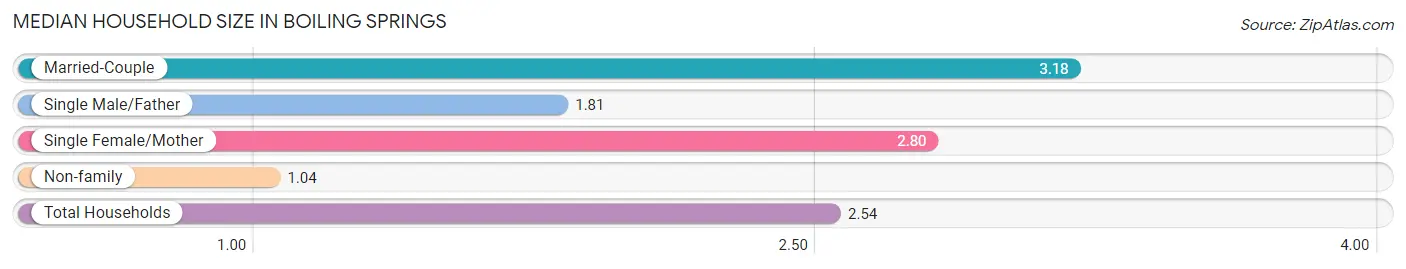
| Household Type | # Households | Household Size |
| Married-Couple | 2,745 (62.7%) | 3.18 |
| Single Male/Father | 63 (1.4%) | 1.81 |
| Single Female/Mother | 367 (8.4%) | 2.80 |
| Non-family | 1,203 (27.5%) | 1.04 |
| Total Households | 4,378 (100.0%) | 2.54 |
Household Size by Marriage Status in Boiling Springs
Out of a total of 4,378 households in Boiling Springs, 3,175 (72.5%) are family households, while 1,203 (27.5%) are nonfamily households. The most numerous type of family households are 2-person households, comprising 1,207, and the most common type of nonfamily households are 1-person households, comprising 1,155.
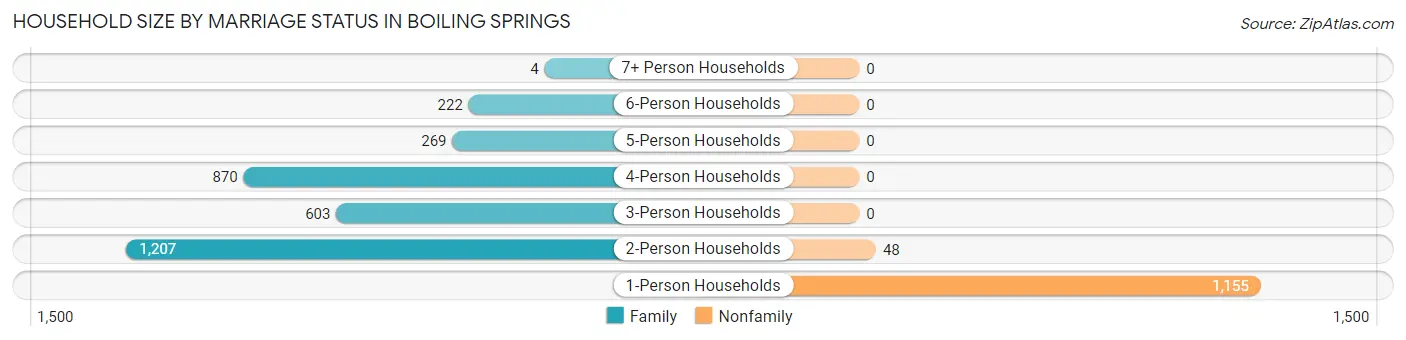
| Household Size | Family Households | Nonfamily Households |
| 1-Person Households | - | 1,155 (26.4%) |
| 2-Person Households | 1,207 (27.6%) | 48 (1.1%) |
| 3-Person Households | 603 (13.8%) | 0 (0.0%) |
| 4-Person Households | 870 (19.9%) | 0 (0.0%) |
| 5-Person Households | 269 (6.1%) | 0 (0.0%) |
| 6-Person Households | 222 (5.1%) | 0 (0.0%) |
| 7+ Person Households | 4 (0.1%) | 0 (0.0%) |
| Total | 3,175 (72.5%) | 1,203 (27.5%) |
Female Fertility in Boiling Springs
Fertility by Age in Boiling Springs
Average fertility rate in Boiling Springs is 29.0 births per 1,000 women. Women in the age bracket of 20 to 34 years have the highest fertility rate with 71.0 births per 1,000 women. Women in the age bracket of 20 to 34 years acount for 100.0% of all women with births.
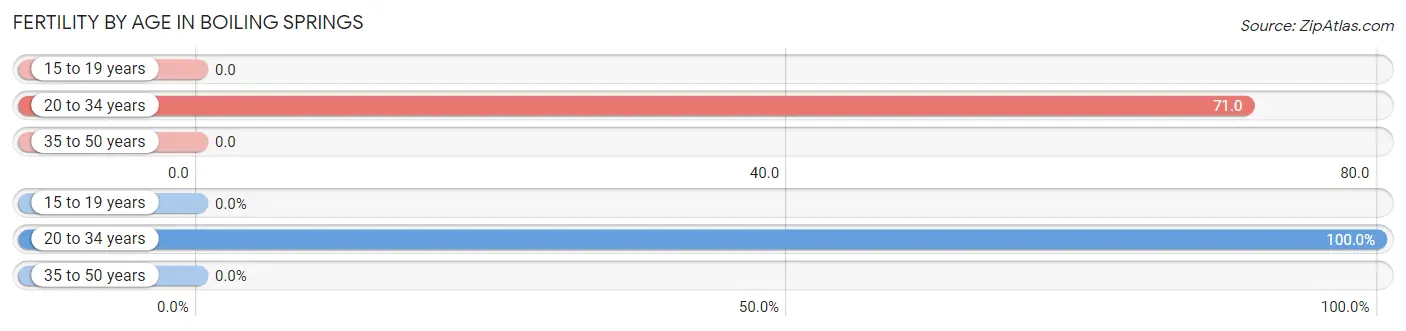
| Age Bracket | Women with Births | Births / 1,000 Women |
| 15 to 19 years | 0 (0.0%) | 0.0 |
| 20 to 34 years | 79 (100.0%) | 71.0 |
| 35 to 50 years | 0 (0.0%) | 0.0 |
| Total | 79 (100.0%) | 29.0 |
Fertility by Age by Marriage Status in Boiling Springs
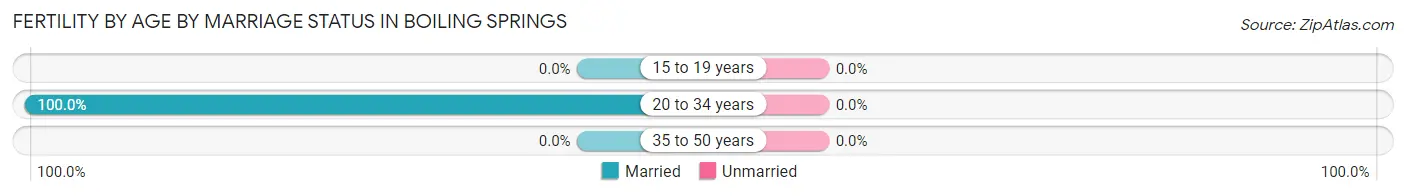
| Age Bracket | Married | Unmarried |
| 15 to 19 years | 0 (0.0%) | 0 (0.0%) |
| 20 to 34 years | 79 (100.0%) | 0 (0.0%) |
| 35 to 50 years | 0 (0.0%) | 0 (0.0%) |
| Total | 79 (100.0%) | 0 (0.0%) |
Fertility by Education in Boiling Springs
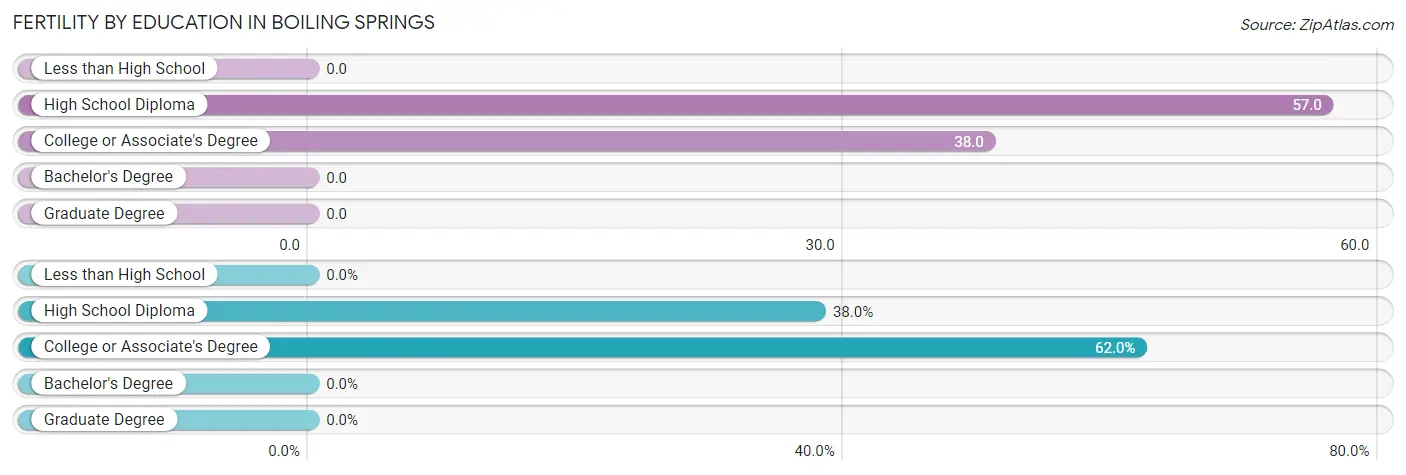
| Educational Attainment | Women with Births | Births / 1,000 Women |
| Less than High School | 0 (0.0%) | 0.0 |
| High School Diploma | 30 (38.0%) | 57.0 |
| College or Associate's Degree | 49 (62.0%) | 38.0 |
| Bachelor's Degree | 0 (0.0%) | 0.0 |
| Graduate Degree | 0 (0.0%) | 0.0 |
| Total | 79 (100.0%) | 29.0 |
Fertility by Education by Marriage Status in Boiling Springs
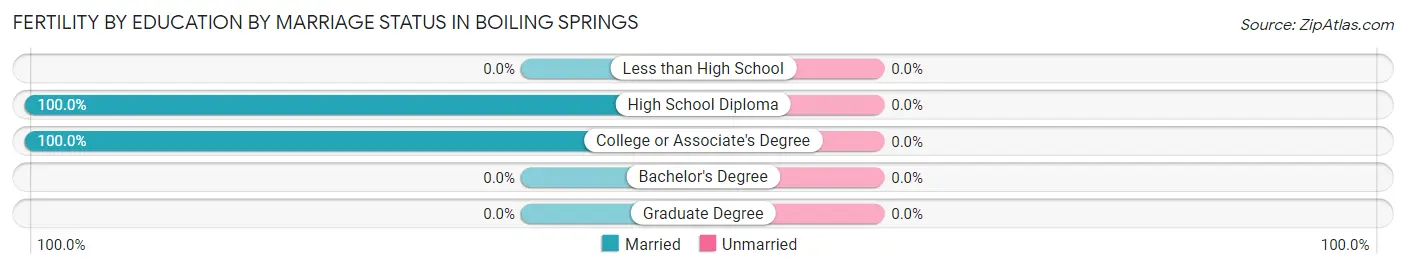
| Educational Attainment | Married | Unmarried |
| Less than High School | 0 (0.0%) | 0 (0.0%) |
| High School Diploma | 30 (100.0%) | 0 (0.0%) |
| College or Associate's Degree | 49 (100.0%) | 0 (0.0%) |
| Bachelor's Degree | 0 (0.0%) | 0 (0.0%) |
| Graduate Degree | 0 (0.0%) | 0 (0.0%) |
| Total | 79 (100.0%) | 0 (0.0%) |
Employment Characteristics in Boiling Springs
Employment by Class of Employer in Boiling Springs
Among the 5,181 employed individuals in Boiling Springs, private company employees (3,742 | 72.2%), local government employees (417 | 8.1%), and state government employees (355 | 6.9%) make up the most common classes of employment.
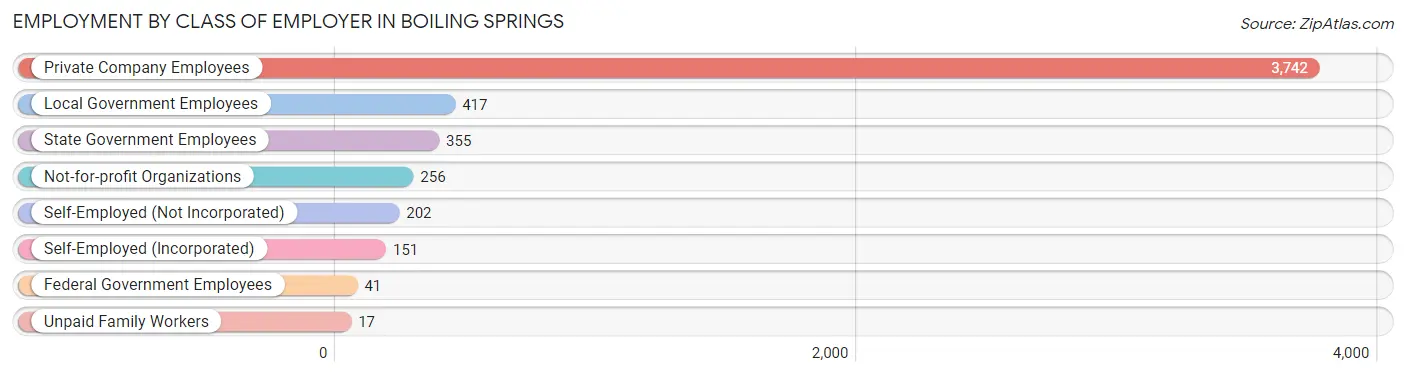
| Employer Class | # Employees | % Employees |
| Private Company Employees | 3,742 | 72.2% |
| Self-Employed (Incorporated) | 151 | 2.9% |
| Self-Employed (Not Incorporated) | 202 | 3.9% |
| Not-for-profit Organizations | 256 | 4.9% |
| Local Government Employees | 417 | 8.1% |
| State Government Employees | 355 | 6.9% |
| Federal Government Employees | 41 | 0.8% |
| Unpaid Family Workers | 17 | 0.3% |
| Total | 5,181 | 100.0% |
Employment Status by Age in Boiling Springs
According to the labor force statistics for Boiling Springs, out of the total population over 16 years of age (8,557), 64.0% or 5,476 individuals are in the labor force, with 3.9% or 214 of them unemployed. The age group with the highest labor force participation rate is 25 to 29 years, with 94.3% or 629 individuals in the labor force. Within the labor force, the 25 to 29 years age range has the highest percentage of unemployed individuals, with 29.9% or 188 of them being unemployed.
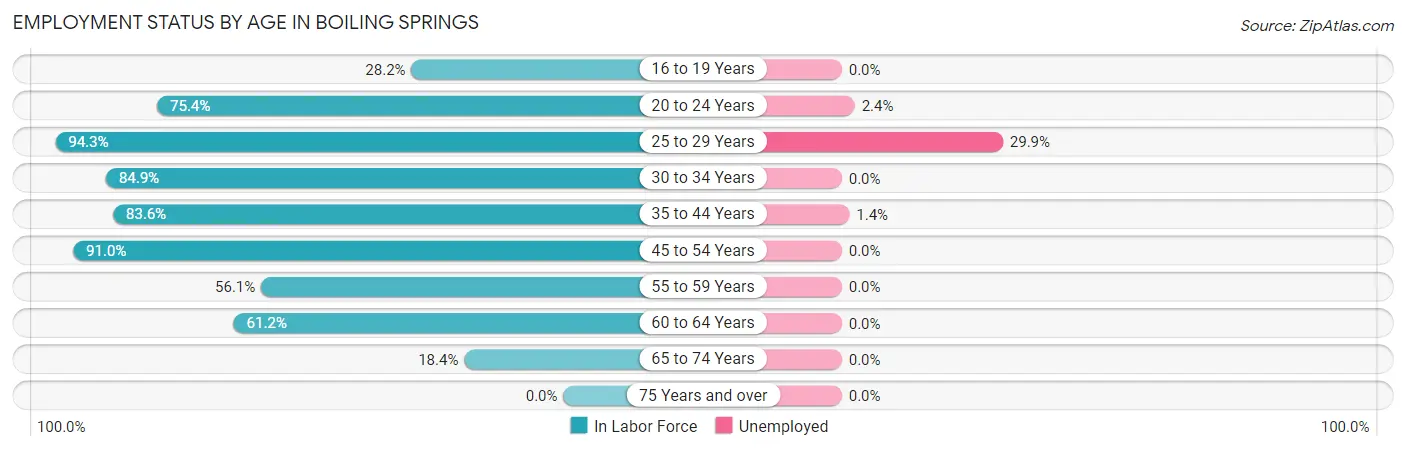
| Age Bracket | In Labor Force | Unemployed |
| 16 to 19 Years | 178 (28.2%) | 0 (0.0%) |
| 20 to 24 Years | 381 (75.4%) | 9 (2.4%) |
| 25 to 29 Years | 629 (94.3%) | 188 (29.9%) |
| 30 to 34 Years | 738 (84.9%) | 0 (0.0%) |
| 35 to 44 Years | 1,242 (83.6%) | 17 (1.4%) |
| 45 to 54 Years | 1,348 (91.0%) | 0 (0.0%) |
| 55 to 59 Years | 184 (56.1%) | 0 (0.0%) |
| 60 to 64 Years | 613 (61.2%) | 0 (0.0%) |
| 65 to 74 Years | 165 (18.4%) | 0 (0.0%) |
| 75 Years and over | 0 (0.0%) | 0 (0.0%) |
| Total | 5,476 (64.0%) | 214 (3.9%) |
Employment Status by Educational Attainment in Boiling Springs
According to labor force statistics for Boiling Springs, 81.5% of individuals (4,754) out of the total population between 25 and 64 years of age (5,833) are in the labor force, with 4.3% or 204 of them being unemployed. The group with the highest labor force participation rate are those with the educational attainment of bachelor's degree or higher, with 86.6% or 1,387 individuals in the labor force. Within the labor force, individuals with college / associate degree education have the highest percentage of unemployment, with 9.4% or 188 of them being unemployed.
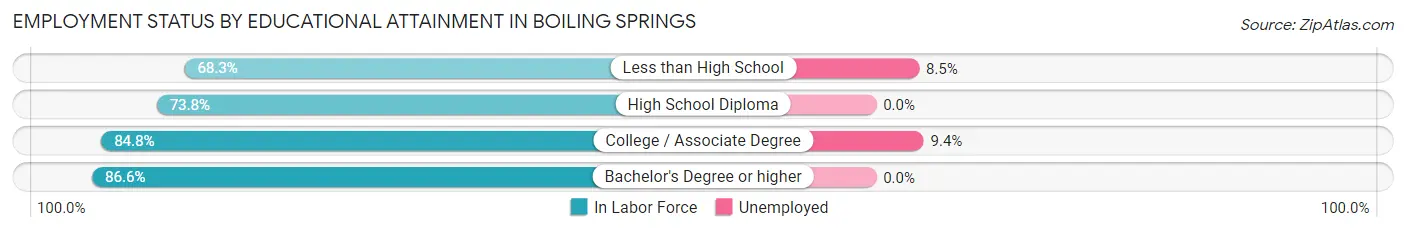
| Educational Attainment | In Labor Force | Unemployed |
| Less than High School | 213 (68.3%) | 27 (8.5%) |
| High School Diploma | 1,155 (73.8%) | 0 (0.0%) |
| College / Associate Degree | 1,996 (84.8%) | 221 (9.4%) |
| Bachelor's Degree or higher | 1,387 (86.6%) | 0 (0.0%) |
| Total | 4,754 (81.5%) | 251 (4.3%) |
Employment Occupations by Sex in Boiling Springs
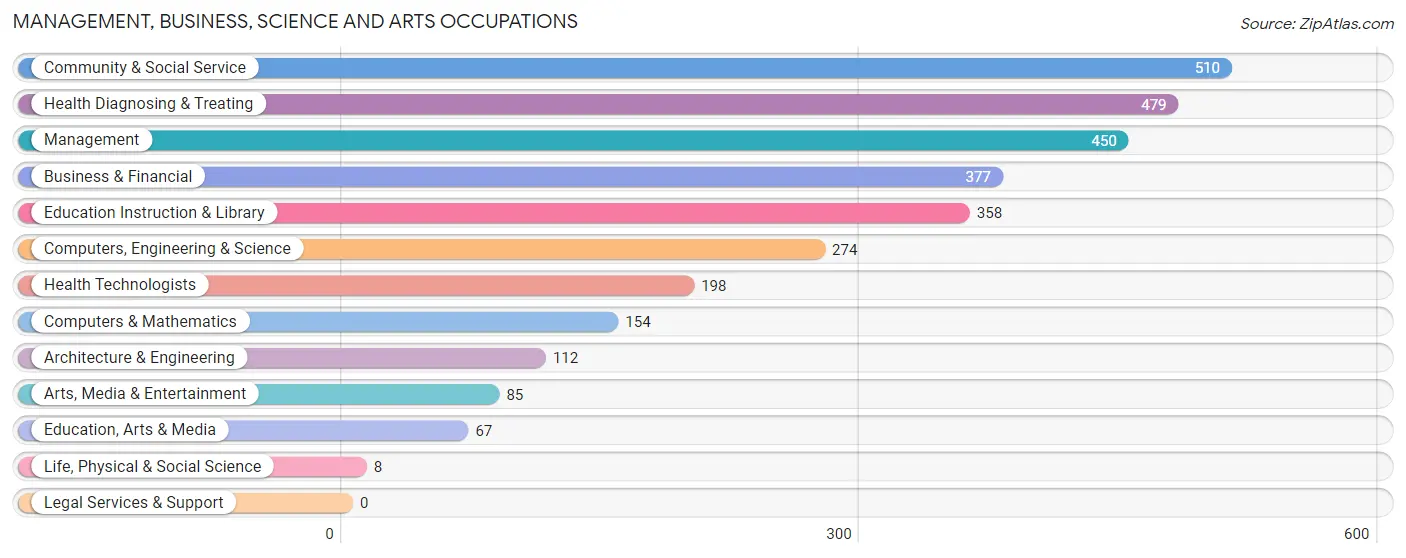
Management, Business, Science and Arts Occupations
The most common Management, Business, Science and Arts occupations in Boiling Springs are Community & Social Service (510 | 9.7%), Health Diagnosing & Treating (479 | 9.1%), Management (450 | 8.6%), Business & Financial (377 | 7.2%), and Education Instruction & Library (358 | 6.8%).
Management, Business, Science and Arts Occupations by Sex
Within the Management, Business, Science and Arts occupations in Boiling Springs, the most male-oriented occupations are Architecture & Engineering (100.0%), Life, Physical & Social Science (100.0%), and Computers, Engineering & Science (92.3%), while the most female-oriented occupations are Health Diagnosing & Treating (90.2%), Education Instruction & Library (88.8%), and Health Technologists (76.3%).
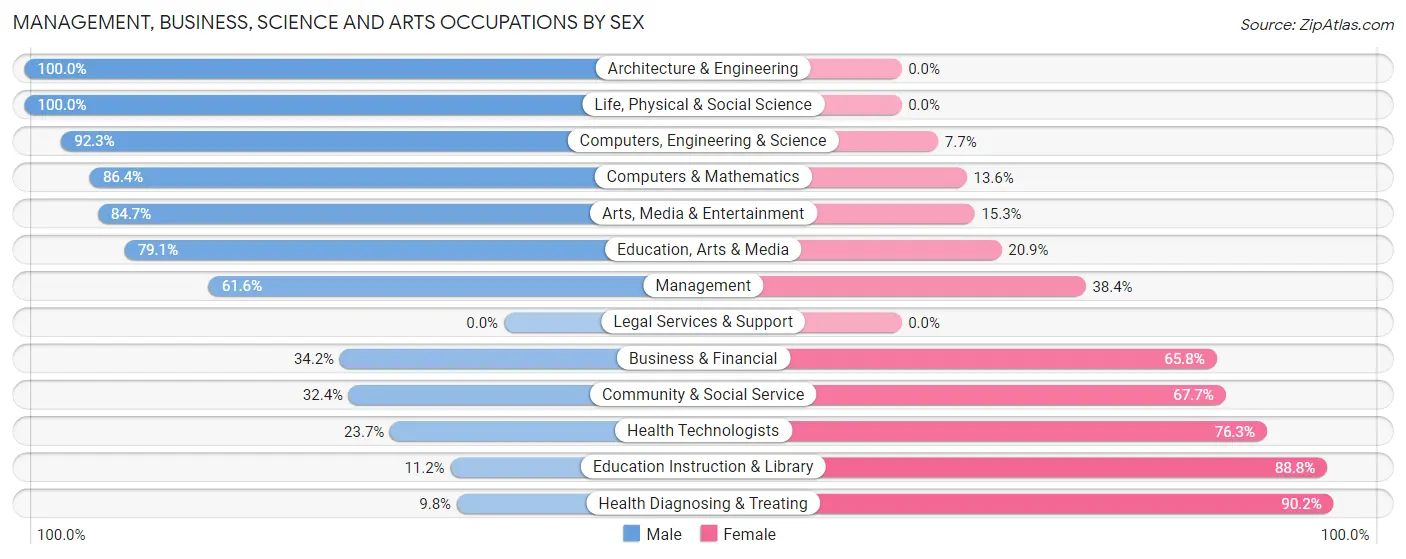
| Occupation | Male | Female |
| Management | 277 (61.6%) | 173 (38.4%) |
| Business & Financial | 129 (34.2%) | 248 (65.8%) |
| Computers, Engineering & Science | 253 (92.3%) | 21 (7.7%) |
| Computers & Mathematics | 133 (86.4%) | 21 (13.6%) |
| Architecture & Engineering | 112 (100.0%) | 0 (0.0%) |
| Life, Physical & Social Science | 8 (100.0%) | 0 (0.0%) |
| Community & Social Service | 165 (32.4%) | 345 (67.6%) |
| Education, Arts & Media | 53 (79.1%) | 14 (20.9%) |
| Legal Services & Support | 0 (0.0%) | 0 (0.0%) |
| Education Instruction & Library | 40 (11.2%) | 318 (88.8%) |
| Arts, Media & Entertainment | 72 (84.7%) | 13 (15.3%) |
| Health Diagnosing & Treating | 47 (9.8%) | 432 (90.2%) |
| Health Technologists | 47 (23.7%) | 151 (76.3%) |
| Total (Category) | 871 (41.7%) | 1,219 (58.3%) |
| Total (Overall) | 2,778 (52.8%) | 2,484 (47.2%) |
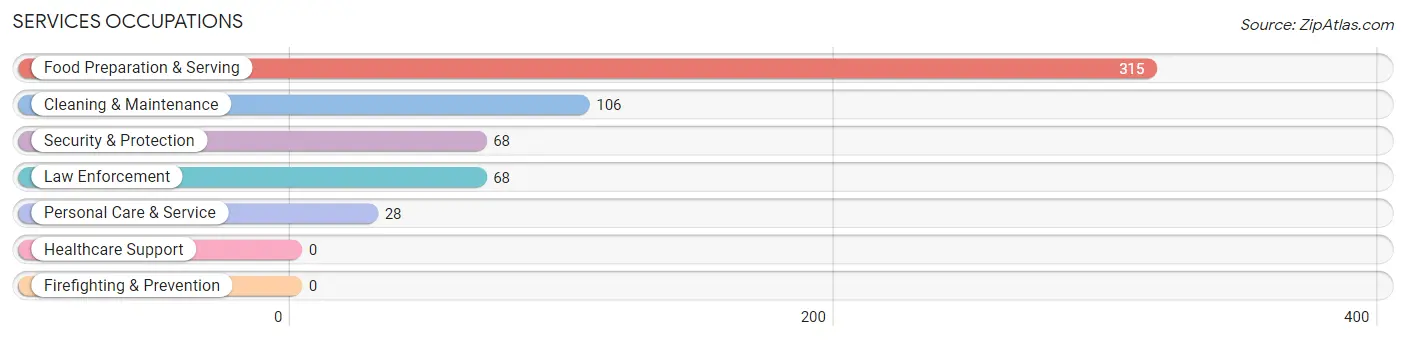
Services Occupations
The most common Services occupations in Boiling Springs are Food Preparation & Serving (315 | 6.0%), Cleaning & Maintenance (106 | 2.0%), Security & Protection (68 | 1.3%), Law Enforcement (68 | 1.3%), and Personal Care & Service (28 | 0.5%).
Services Occupations by Sex
Within the Services occupations in Boiling Springs, the most male-oriented occupations are Security & Protection (88.2%), Law Enforcement (88.2%), and Food Preparation & Serving (68.2%), while the most female-oriented occupations are Personal Care & Service (100.0%), Cleaning & Maintenance (34.0%), and Food Preparation & Serving (31.8%).
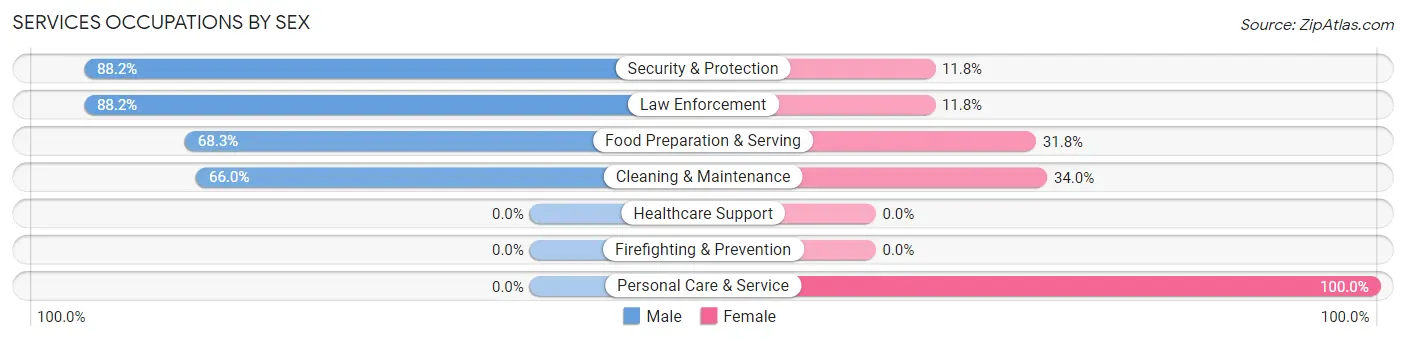
| Occupation | Male | Female |
| Healthcare Support | 0 (0.0%) | 0 (0.0%) |
| Security & Protection | 60 (88.2%) | 8 (11.8%) |
| Firefighting & Prevention | 0 (0.0%) | 0 (0.0%) |
| Law Enforcement | 60 (88.2%) | 8 (11.8%) |
| Food Preparation & Serving | 215 (68.2%) | 100 (31.8%) |
| Cleaning & Maintenance | 70 (66.0%) | 36 (34.0%) |
| Personal Care & Service | 0 (0.0%) | 28 (100.0%) |
| Total (Category) | 345 (66.7%) | 172 (33.3%) |
| Total (Overall) | 2,778 (52.8%) | 2,484 (47.2%) |
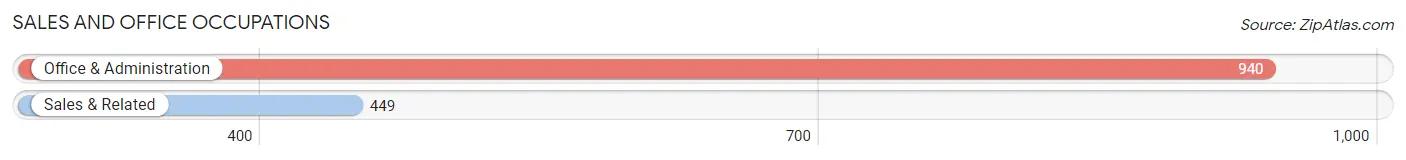
Sales and Office Occupations
The most common Sales and Office occupations in Boiling Springs are Office & Administration (940 | 17.9%), and Sales & Related (449 | 8.5%).
Sales and Office Occupations by Sex
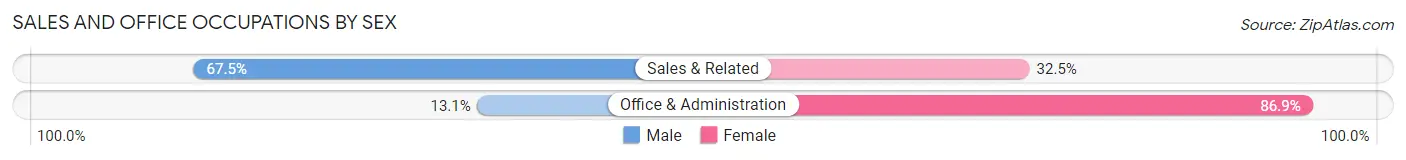
| Occupation | Male | Female |
| Sales & Related | 303 (67.5%) | 146 (32.5%) |
| Office & Administration | 123 (13.1%) | 817 (86.9%) |
| Total (Category) | 426 (30.7%) | 963 (69.3%) |
| Total (Overall) | 2,778 (52.8%) | 2,484 (47.2%) |
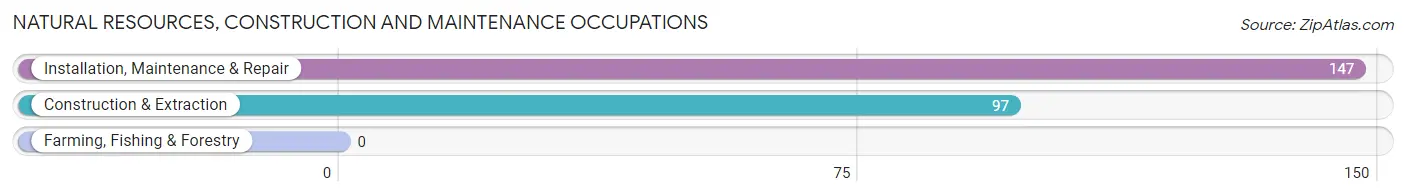
Natural Resources, Construction and Maintenance Occupations
The most common Natural Resources, Construction and Maintenance occupations in Boiling Springs are Installation, Maintenance & Repair (147 | 2.8%), and Construction & Extraction (97 | 1.8%).
Natural Resources, Construction and Maintenance Occupations by Sex
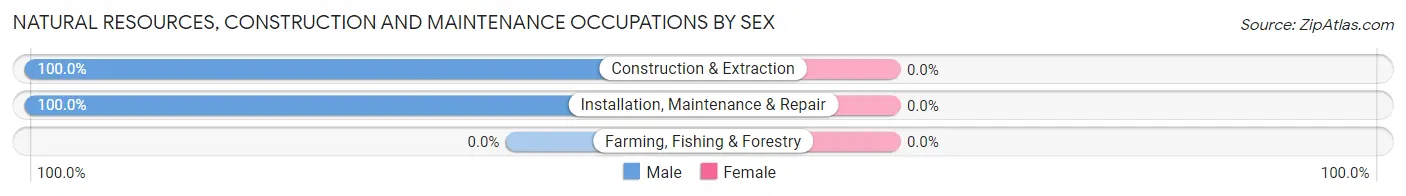
| Occupation | Male | Female |
| Farming, Fishing & Forestry | 0 (0.0%) | 0 (0.0%) |
| Construction & Extraction | 97 (100.0%) | 0 (0.0%) |
| Installation, Maintenance & Repair | 147 (100.0%) | 0 (0.0%) |
| Total (Category) | 244 (100.0%) | 0 (0.0%) |
| Total (Overall) | 2,778 (52.8%) | 2,484 (47.2%) |
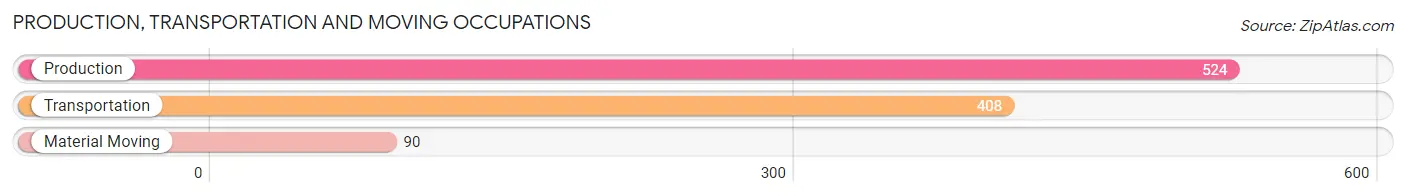
Production, Transportation and Moving Occupations
The most common Production, Transportation and Moving occupations in Boiling Springs are Production (524 | 10.0%), Transportation (408 | 7.7%), and Material Moving (90 | 1.7%).
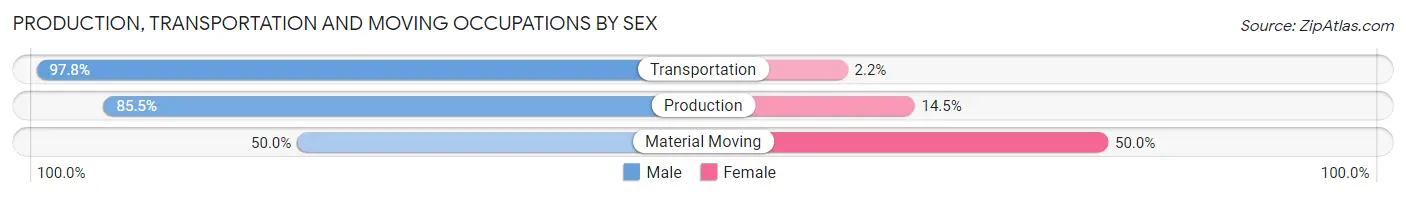
Production, Transportation and Moving Occupations by Sex
| Occupation | Male | Female |
| Production | 448 (85.5%) | 76 (14.5%) |
| Transportation | 399 (97.8%) | 9 (2.2%) |
| Material Moving | 45 (50.0%) | 45 (50.0%) |
| Total (Category) | 892 (87.3%) | 130 (12.7%) |
| Total (Overall) | 2,778 (52.8%) | 2,484 (47.2%) |
Employment Industries by Sex in Boiling Springs
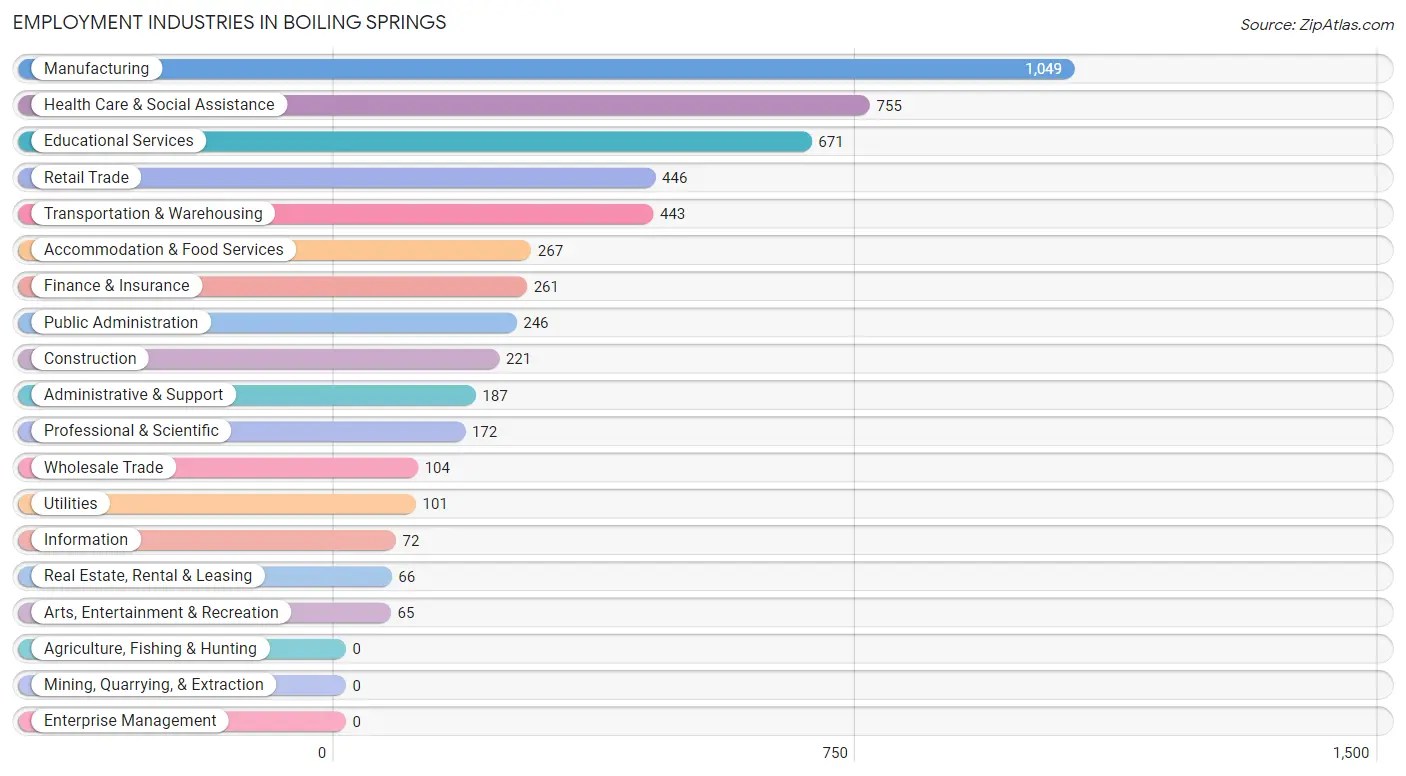
Employment Industries in Boiling Springs
The major employment industries in Boiling Springs include Manufacturing (1,049 | 19.9%), Health Care & Social Assistance (755 | 14.3%), Educational Services (671 | 12.8%), Retail Trade (446 | 8.5%), and Transportation & Warehousing (443 | 8.4%).
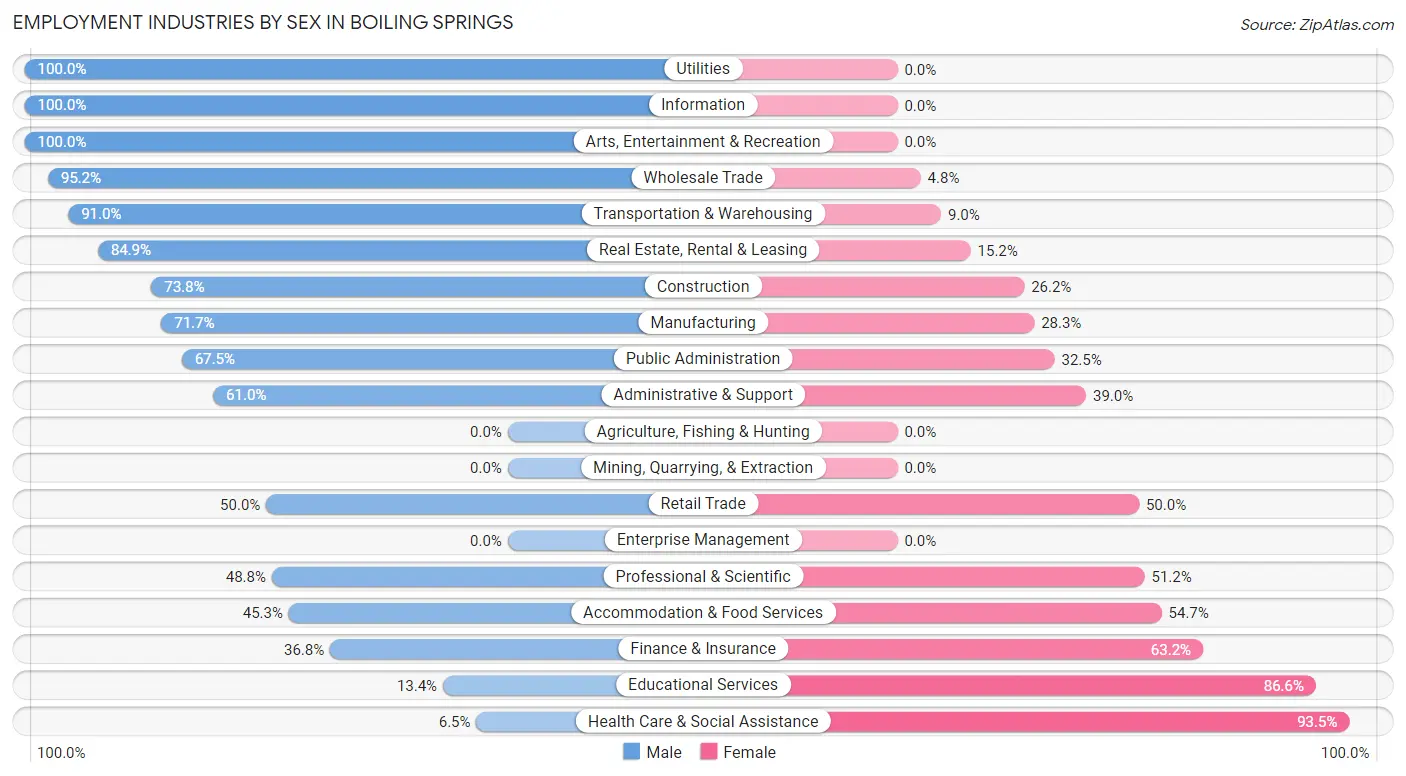
Employment Industries by Sex in Boiling Springs
The Boiling Springs industries that see more men than women are Utilities (100.0%), Information (100.0%), and Arts, Entertainment & Recreation (100.0%), whereas the industries that tend to have a higher number of women are Health Care & Social Assistance (93.5%), Educational Services (86.6%), and Finance & Insurance (63.2%).
| Industry | Male | Female |
| Agriculture, Fishing & Hunting | 0 (0.0%) | 0 (0.0%) |
| Mining, Quarrying, & Extraction | 0 (0.0%) | 0 (0.0%) |
| Construction | 163 (73.8%) | 58 (26.2%) |
| Manufacturing | 752 (71.7%) | 297 (28.3%) |
| Wholesale Trade | 99 (95.2%) | 5 (4.8%) |
| Retail Trade | 223 (50.0%) | 223 (50.0%) |
| Transportation & Warehousing | 403 (91.0%) | 40 (9.0%) |
| Utilities | 101 (100.0%) | 0 (0.0%) |
| Information | 72 (100.0%) | 0 (0.0%) |
| Finance & Insurance | 96 (36.8%) | 165 (63.2%) |
| Real Estate, Rental & Leasing | 56 (84.9%) | 10 (15.1%) |
| Professional & Scientific | 84 (48.8%) | 88 (51.2%) |
| Enterprise Management | 0 (0.0%) | 0 (0.0%) |
| Administrative & Support | 114 (61.0%) | 73 (39.0%) |
| Educational Services | 90 (13.4%) | 581 (86.6%) |
| Health Care & Social Assistance | 49 (6.5%) | 706 (93.5%) |
| Arts, Entertainment & Recreation | 65 (100.0%) | 0 (0.0%) |
| Accommodation & Food Services | 121 (45.3%) | 146 (54.7%) |
| Public Administration | 166 (67.5%) | 80 (32.5%) |
| Total | 2,778 (52.8%) | 2,484 (47.2%) |
Education in Boiling Springs
School Enrollment in Boiling Springs
The most common levels of schooling among the 3,218 students in Boiling Springs are elementary school (935 | 29.1%), middle school (646 | 20.1%), and college / undergraduate (600 | 18.6%).
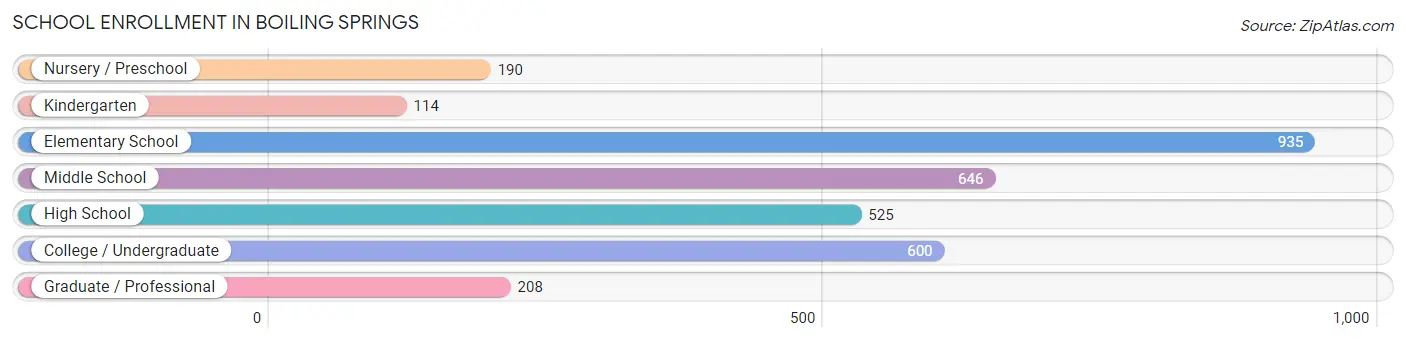
| School Level | # Students | % Students |
| Nursery / Preschool | 190 | 5.9% |
| Kindergarten | 114 | 3.5% |
| Elementary School | 935 | 29.1% |
| Middle School | 646 | 20.1% |
| High School | 525 | 16.3% |
| College / Undergraduate | 600 | 18.6% |
| Graduate / Professional | 208 | 6.5% |
| Total | 3,218 | 100.0% |
School Enrollment by Age by Funding Source in Boiling Springs
Out of a total of 3,218 students who are enrolled in schools in Boiling Springs, 586 (18.2%) attend a private institution, while the remaining 2,632 (81.8%) are enrolled in public schools. The age group of 25 to 34 year olds has the highest likelihood of being enrolled in private schools, with 212 (66.9% in the age bracket) enrolled. Conversely, the age group of 35 years and over has the lowest likelihood of being enrolled in a private school, with 174 (100.0% in the age bracket) attending a public institution.
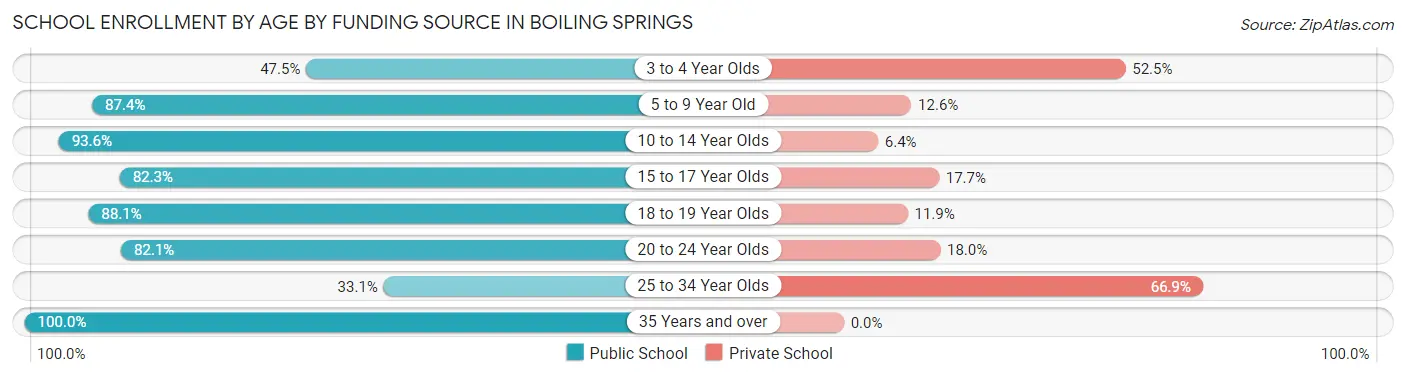
| Age Bracket | Public School | Private School |
| 3 to 4 Year Olds | 58 (47.5%) | 64 (52.5%) |
| 5 to 9 Year Old | 911 (87.4%) | 131 (12.6%) |
| 10 to 14 Year Olds | 721 (93.6%) | 49 (6.4%) |
| 15 to 17 Year Olds | 404 (82.3%) | 87 (17.7%) |
| 18 to 19 Year Olds | 163 (88.1%) | 22 (11.9%) |
| 20 to 24 Year Olds | 96 (82.1%) | 21 (17.9%) |
| 25 to 34 Year Olds | 105 (33.1%) | 212 (66.9%) |
| 35 Years and over | 174 (100.0%) | 0 (0.0%) |
| Total | 2,632 (81.8%) | 586 (18.2%) |
Educational Attainment by Field of Study in Boiling Springs
Science & technology (352 | 18.4%), business (299 | 15.6%), education (278 | 14.5%), arts & humanities (202 | 10.6%), and psychology (174 | 9.1%) are the most common fields of study among 1,913 individuals in Boiling Springs who have obtained a bachelor's degree or higher.
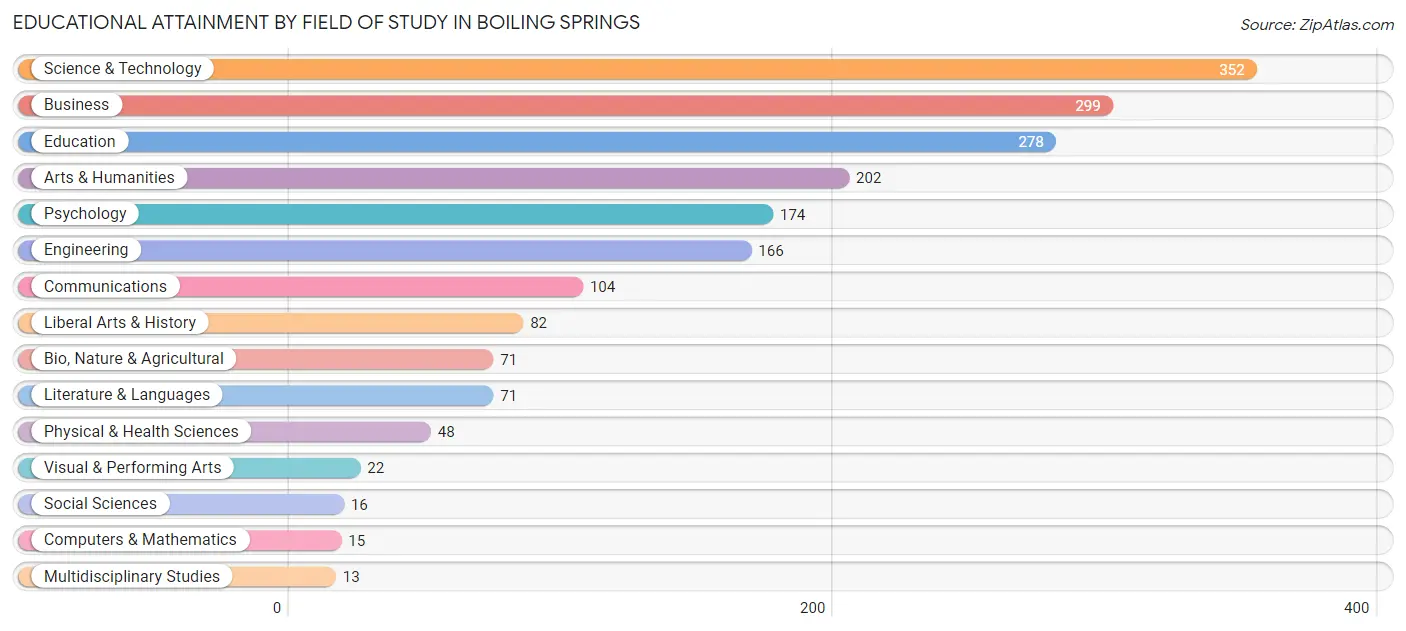
| Field of Study | # Graduates | % Graduates |
| Computers & Mathematics | 15 | 0.8% |
| Bio, Nature & Agricultural | 71 | 3.7% |
| Physical & Health Sciences | 48 | 2.5% |
| Psychology | 174 | 9.1% |
| Social Sciences | 16 | 0.8% |
| Engineering | 166 | 8.7% |
| Multidisciplinary Studies | 13 | 0.7% |
| Science & Technology | 352 | 18.4% |
| Business | 299 | 15.6% |
| Education | 278 | 14.5% |
| Literature & Languages | 71 | 3.7% |
| Liberal Arts & History | 82 | 4.3% |
| Visual & Performing Arts | 22 | 1.1% |
| Communications | 104 | 5.4% |
| Arts & Humanities | 202 | 10.6% |
| Total | 1,913 | 100.0% |
Transportation & Commute in Boiling Springs
Vehicle Availability by Sex in Boiling Springs
The most prevalent vehicle ownership categories in Boiling Springs are males with 2 vehicles (1,536, accounting for 55.4%) and females with 2 vehicles (1,092, making up 63.9%).
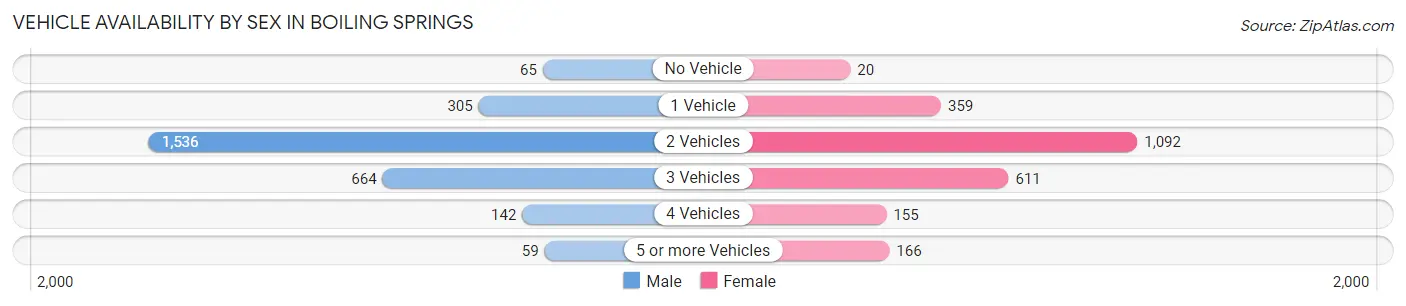
| Vehicles Available | Male | Female |
| No Vehicle | 65 (2.4%) | 20 (0.8%) |
| 1 Vehicle | 305 (11.0%) | 359 (14.9%) |
| 2 Vehicles | 1,536 (55.4%) | 1,092 (45.4%) |
| 3 Vehicles | 664 (24.0%) | 611 (25.4%) |
| 4 Vehicles | 142 (5.1%) | 155 (6.5%) |
| 5 or more Vehicles | 59 (2.1%) | 166 (6.9%) |
| Total | 2,771 (100.0%) | 2,403 (100.0%) |
Commute Time in Boiling Springs
The most frequently occuring commute durations in Boiling Springs are 15 to 19 minutes (1,219 commuters, 26.3%), 20 to 24 minutes (931 commuters, 20.1%), and 30 to 34 minutes (777 commuters, 16.8%).
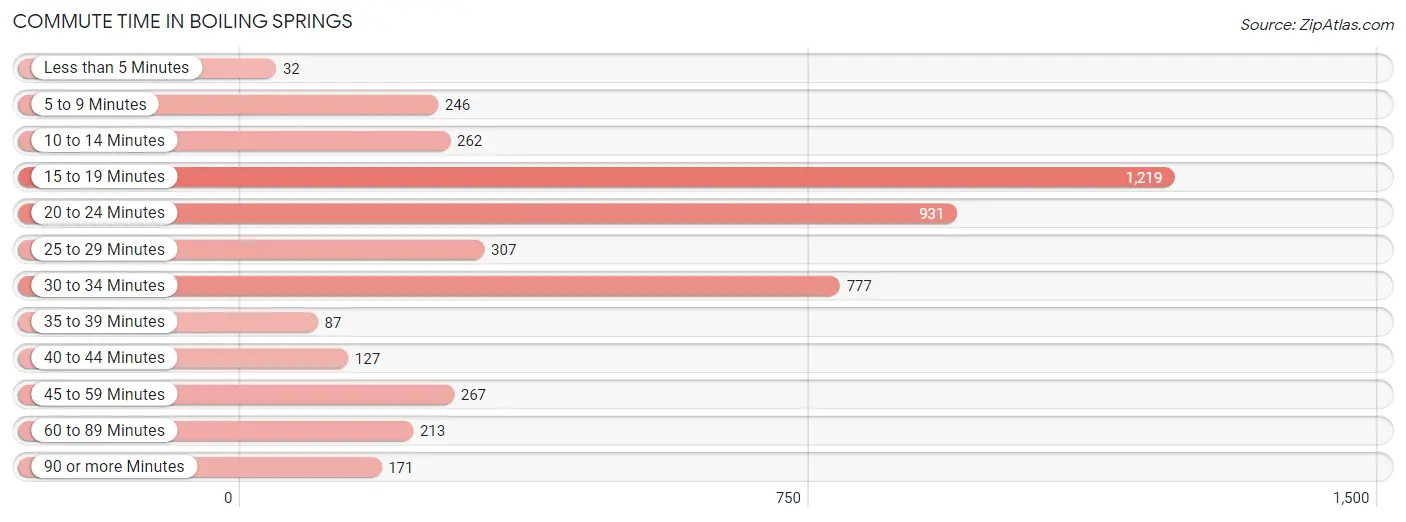
| Commute Time | # Commuters | % Commuters |
| Less than 5 Minutes | 32 | 0.7% |
| 5 to 9 Minutes | 246 | 5.3% |
| 10 to 14 Minutes | 262 | 5.7% |
| 15 to 19 Minutes | 1,219 | 26.3% |
| 20 to 24 Minutes | 931 | 20.1% |
| 25 to 29 Minutes | 307 | 6.6% |
| 30 to 34 Minutes | 777 | 16.8% |
| 35 to 39 Minutes | 87 | 1.9% |
| 40 to 44 Minutes | 127 | 2.7% |
| 45 to 59 Minutes | 267 | 5.8% |
| 60 to 89 Minutes | 213 | 4.6% |
| 90 or more Minutes | 171 | 3.7% |
Commute Time by Sex in Boiling Springs
The most common commute times in Boiling Springs are 15 to 19 minutes (646 commuters, 25.9%) for males and 15 to 19 minutes (573 commuters, 26.8%) for females.
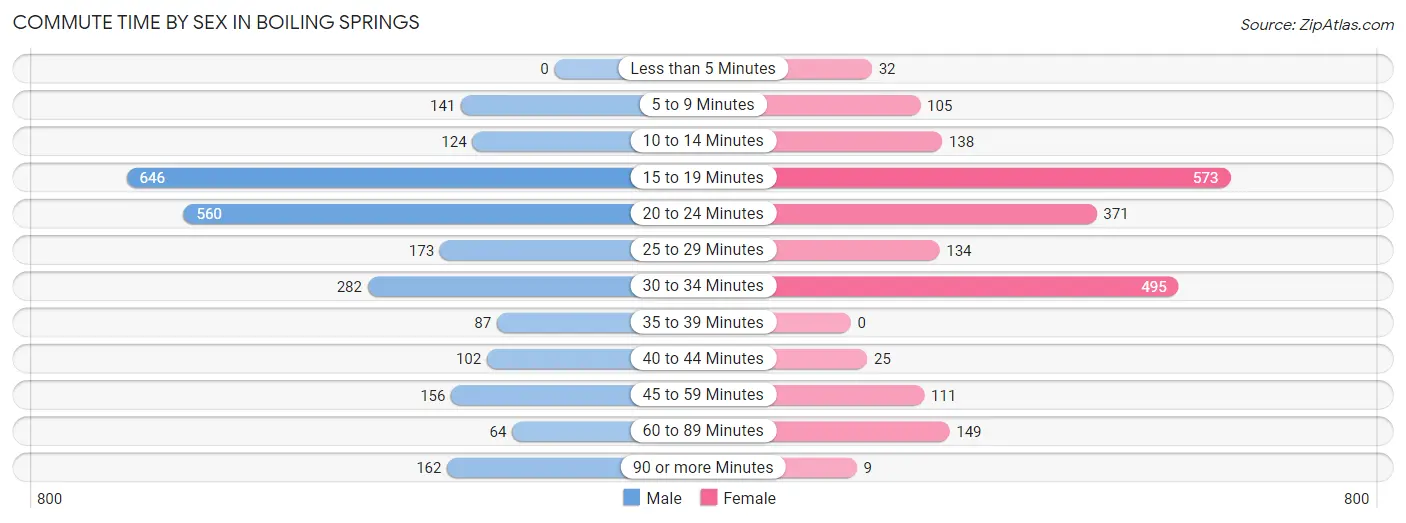
| Commute Time | Male | Female |
| Less than 5 Minutes | 0 (0.0%) | 32 (1.5%) |
| 5 to 9 Minutes | 141 (5.7%) | 105 (4.9%) |
| 10 to 14 Minutes | 124 (5.0%) | 138 (6.4%) |
| 15 to 19 Minutes | 646 (25.9%) | 573 (26.8%) |
| 20 to 24 Minutes | 560 (22.4%) | 371 (17.3%) |
| 25 to 29 Minutes | 173 (6.9%) | 134 (6.3%) |
| 30 to 34 Minutes | 282 (11.3%) | 495 (23.1%) |
| 35 to 39 Minutes | 87 (3.5%) | 0 (0.0%) |
| 40 to 44 Minutes | 102 (4.1%) | 25 (1.2%) |
| 45 to 59 Minutes | 156 (6.2%) | 111 (5.2%) |
| 60 to 89 Minutes | 64 (2.6%) | 149 (7.0%) |
| 90 or more Minutes | 162 (6.5%) | 9 (0.4%) |
Time of Departure to Work by Sex in Boiling Springs
The most frequent times of departure to work in Boiling Springs are 7:30 AM to 7:59 AM (443, 17.7%) for males and 7:00 AM to 7:29 AM (470, 21.9%) for females.
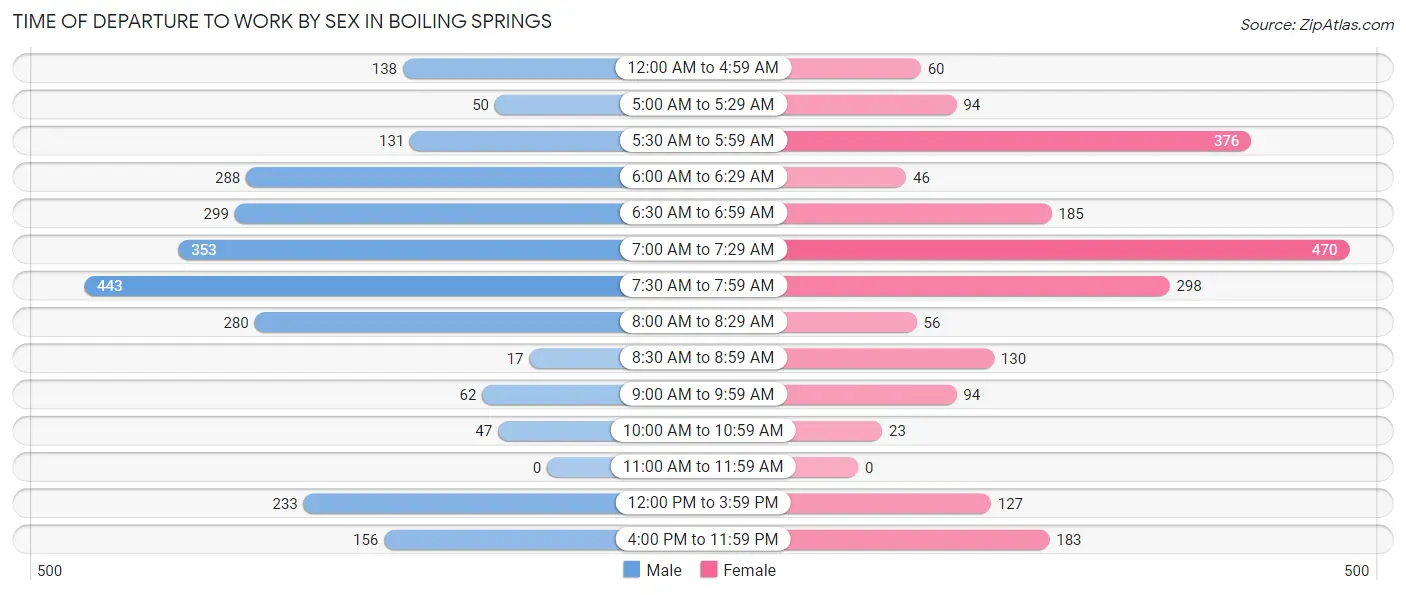
| Time of Departure | Male | Female |
| 12:00 AM to 4:59 AM | 138 (5.5%) | 60 (2.8%) |
| 5:00 AM to 5:29 AM | 50 (2.0%) | 94 (4.4%) |
| 5:30 AM to 5:59 AM | 131 (5.2%) | 376 (17.5%) |
| 6:00 AM to 6:29 AM | 288 (11.5%) | 46 (2.1%) |
| 6:30 AM to 6:59 AM | 299 (12.0%) | 185 (8.6%) |
| 7:00 AM to 7:29 AM | 353 (14.1%) | 470 (21.9%) |
| 7:30 AM to 7:59 AM | 443 (17.7%) | 298 (13.9%) |
| 8:00 AM to 8:29 AM | 280 (11.2%) | 56 (2.6%) |
| 8:30 AM to 8:59 AM | 17 (0.7%) | 130 (6.1%) |
| 9:00 AM to 9:59 AM | 62 (2.5%) | 94 (4.4%) |
| 10:00 AM to 10:59 AM | 47 (1.9%) | 23 (1.1%) |
| 11:00 AM to 11:59 AM | 0 (0.0%) | 0 (0.0%) |
| 12:00 PM to 3:59 PM | 233 (9.3%) | 127 (5.9%) |
| 4:00 PM to 11:59 PM | 156 (6.2%) | 183 (8.5%) |
| Total | 2,497 (100.0%) | 2,142 (100.0%) |
Housing Occupancy in Boiling Springs
Occupancy by Ownership in Boiling Springs
Of the total 4,378 dwellings in Boiling Springs, owner-occupied units account for 3,605 (82.3%), while renter-occupied units make up 773 (17.7%).
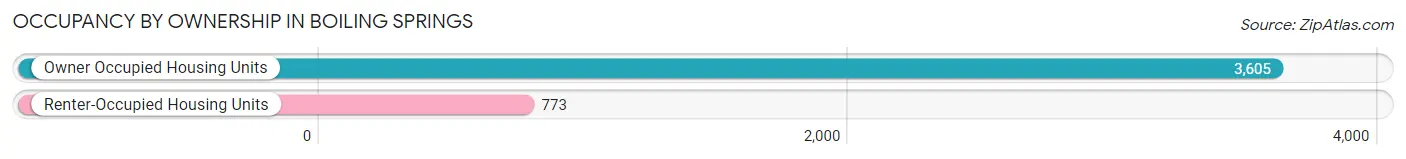
| Occupancy | # Housing Units | % Housing Units |
| Owner Occupied Housing Units | 3,605 | 82.3% |
| Renter-Occupied Housing Units | 773 | 17.7% |
| Total Occupied Housing Units | 4,378 | 100.0% |
Occupancy by Household Size in Boiling Springs
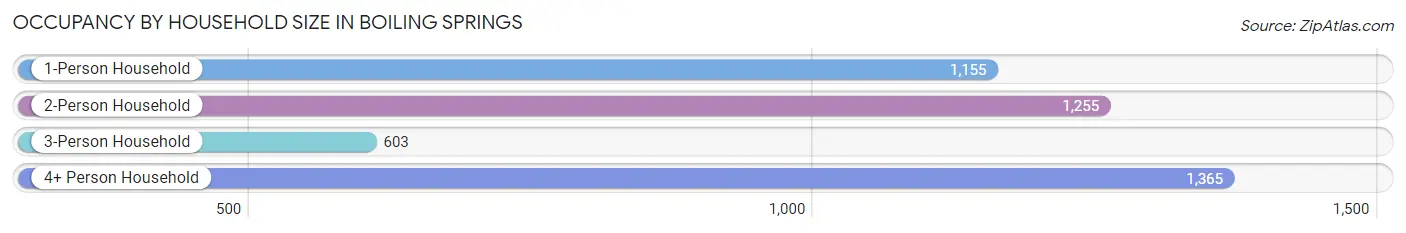
| Household Size | # Housing Units | % Housing Units |
| 1-Person Household | 1,155 | 26.4% |
| 2-Person Household | 1,255 | 28.7% |
| 3-Person Household | 603 | 13.8% |
| 4+ Person Household | 1,365 | 31.2% |
| Total Housing Units | 4,378 | 100.0% |
Occupancy by Ownership by Household Size in Boiling Springs
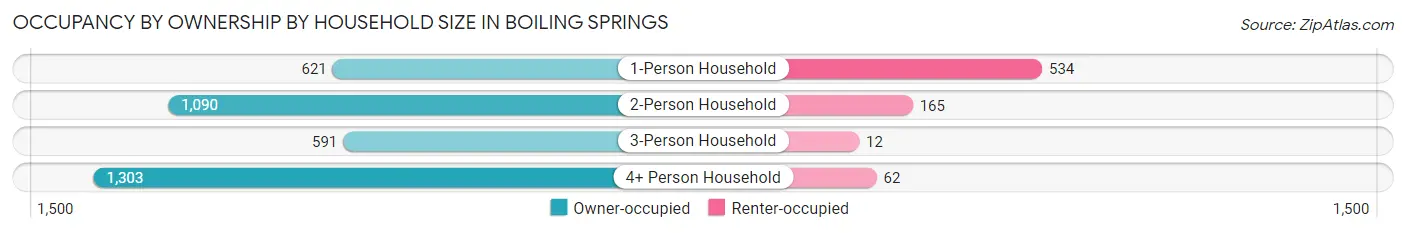
| Household Size | Owner-occupied | Renter-occupied |
| 1-Person Household | 621 (53.8%) | 534 (46.2%) |
| 2-Person Household | 1,090 (86.9%) | 165 (13.2%) |
| 3-Person Household | 591 (98.0%) | 12 (2.0%) |
| 4+ Person Household | 1,303 (95.5%) | 62 (4.5%) |
| Total Housing Units | 3,605 (82.3%) | 773 (17.7%) |
Occupancy by Educational Attainment in Boiling Springs
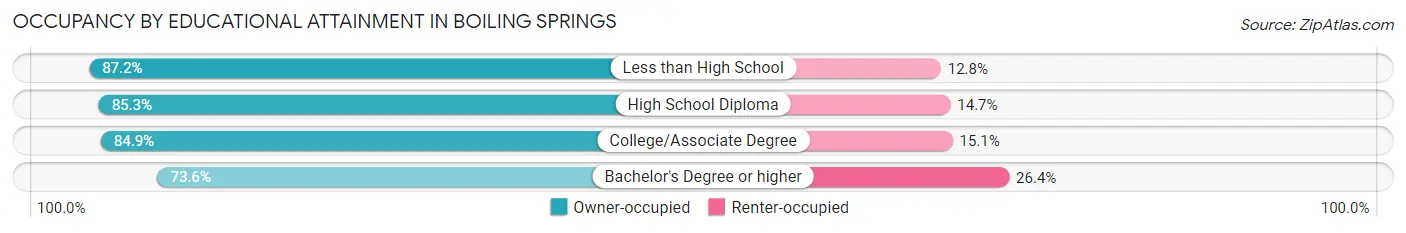
| Household Size | Owner-occupied | Renter-occupied |
| Less than High School | 313 (87.2%) | 46 (12.8%) |
| High School Diploma | 887 (85.3%) | 153 (14.7%) |
| College/Associate Degree | 1,598 (84.9%) | 285 (15.1%) |
| Bachelor's Degree or higher | 807 (73.6%) | 289 (26.4%) |
Occupancy by Age of Householder in Boiling Springs
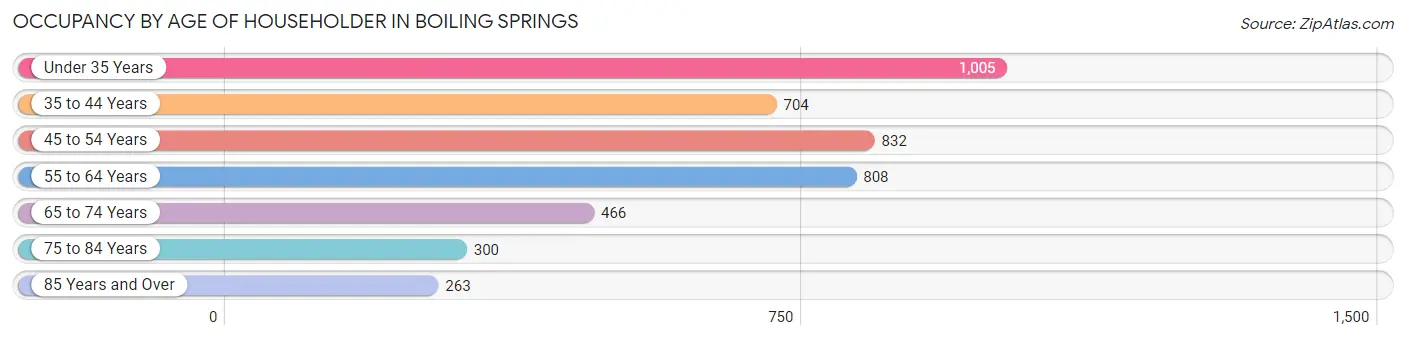
| Age Bracket | # Households | % Households |
| Under 35 Years | 1,005 | 23.0% |
| 35 to 44 Years | 704 | 16.1% |
| 45 to 54 Years | 832 | 19.0% |
| 55 to 64 Years | 808 | 18.5% |
| 65 to 74 Years | 466 | 10.6% |
| 75 to 84 Years | 300 | 6.9% |
| 85 Years and Over | 263 | 6.0% |
| Total | 4,378 | 100.0% |
Housing Finances in Boiling Springs
Median Income by Occupancy in Boiling Springs
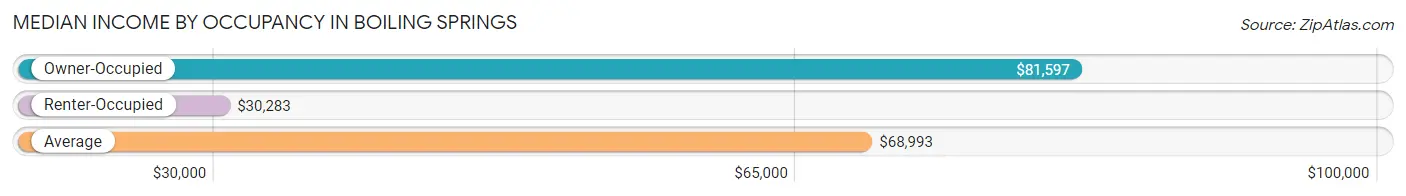
| Occupancy Type | # Households | Median Income |
| Owner-Occupied | 3,605 (82.3%) | $81,597 |
| Renter-Occupied | 773 (17.7%) | $30,283 |
| Average | 4,378 (100.0%) | $68,993 |
Occupancy by Householder Income Bracket in Boiling Springs
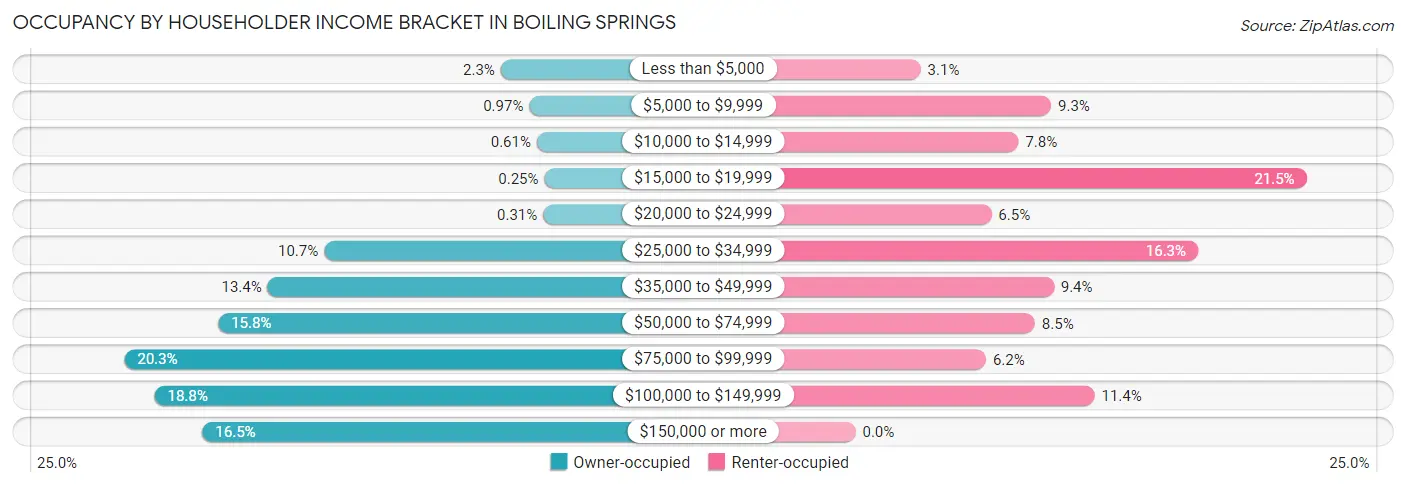
| Income Bracket | Owner-occupied | Renter-occupied |
| Less than $5,000 | 84 (2.3%) | 24 (3.1%) |
| $5,000 to $9,999 | 35 (1.0%) | 72 (9.3%) |
| $10,000 to $14,999 | 22 (0.6%) | 60 (7.8%) |
| $15,000 to $19,999 | 9 (0.3%) | 166 (21.5%) |
| $20,000 to $24,999 | 11 (0.3%) | 50 (6.5%) |
| $25,000 to $34,999 | 387 (10.7%) | 126 (16.3%) |
| $35,000 to $49,999 | 484 (13.4%) | 73 (9.4%) |
| $50,000 to $74,999 | 569 (15.8%) | 66 (8.5%) |
| $75,000 to $99,999 | 730 (20.3%) | 48 (6.2%) |
| $100,000 to $149,999 | 678 (18.8%) | 88 (11.4%) |
| $150,000 or more | 596 (16.5%) | 0 (0.0%) |
| Total | 3,605 (100.0%) | 773 (100.0%) |
Monthly Housing Cost Tiers in Boiling Springs
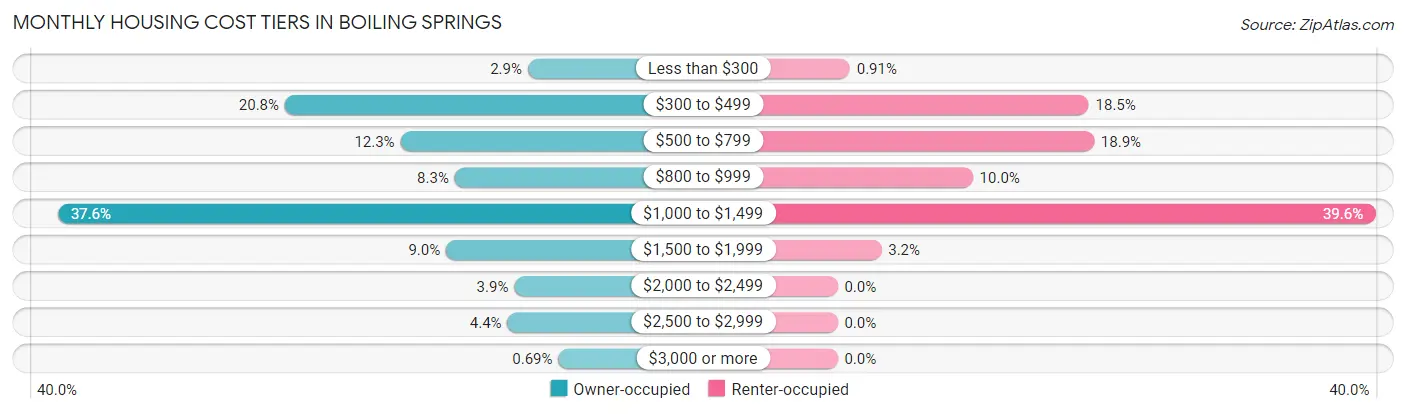
| Monthly Cost | Owner-occupied | Renter-occupied |
| Less than $300 | 106 (2.9%) | 7 (0.9%) |
| $300 to $499 | 751 (20.8%) | 143 (18.5%) |
| $500 to $799 | 444 (12.3%) | 146 (18.9%) |
| $800 to $999 | 300 (8.3%) | 77 (10.0%) |
| $1,000 to $1,499 | 1,354 (37.6%) | 306 (39.6%) |
| $1,500 to $1,999 | 323 (9.0%) | 25 (3.2%) |
| $2,000 to $2,499 | 142 (3.9%) | 0 (0.0%) |
| $2,500 to $2,999 | 160 (4.4%) | 0 (0.0%) |
| $3,000 or more | 25 (0.7%) | 0 (0.0%) |
| Total | 3,605 (100.0%) | 773 (100.0%) |
Physical Housing Characteristics in Boiling Springs
Housing Structures in Boiling Springs
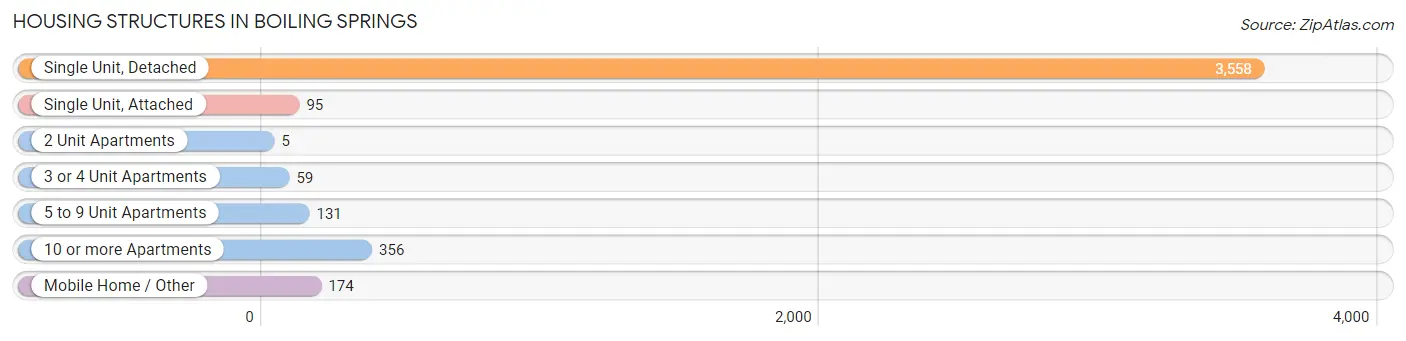
| Structure Type | # Housing Units | % Housing Units |
| Single Unit, Detached | 3,558 | 81.3% |
| Single Unit, Attached | 95 | 2.2% |
| 2 Unit Apartments | 5 | 0.1% |
| 3 or 4 Unit Apartments | 59 | 1.3% |
| 5 to 9 Unit Apartments | 131 | 3.0% |
| 10 or more Apartments | 356 | 8.1% |
| Mobile Home / Other | 174 | 4.0% |
| Total | 4,378 | 100.0% |
Housing Structures by Occupancy in Boiling Springs
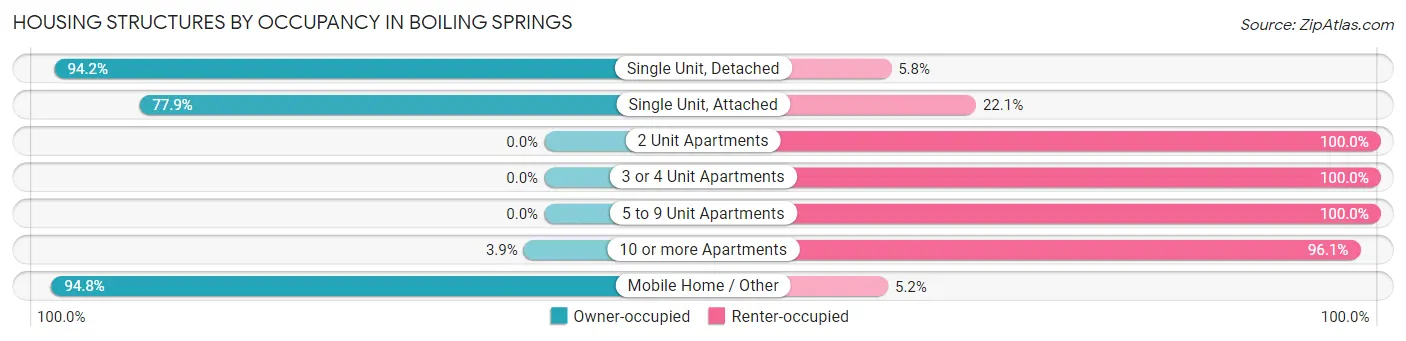
| Structure Type | Owner-occupied | Renter-occupied |
| Single Unit, Detached | 3,352 (94.2%) | 206 (5.8%) |
| Single Unit, Attached | 74 (77.9%) | 21 (22.1%) |
| 2 Unit Apartments | 0 (0.0%) | 5 (100.0%) |
| 3 or 4 Unit Apartments | 0 (0.0%) | 59 (100.0%) |
| 5 to 9 Unit Apartments | 0 (0.0%) | 131 (100.0%) |
| 10 or more Apartments | 14 (3.9%) | 342 (96.1%) |
| Mobile Home / Other | 165 (94.8%) | 9 (5.2%) |
| Total | 3,605 (82.3%) | 773 (17.7%) |
Housing Structures by Number of Rooms in Boiling Springs
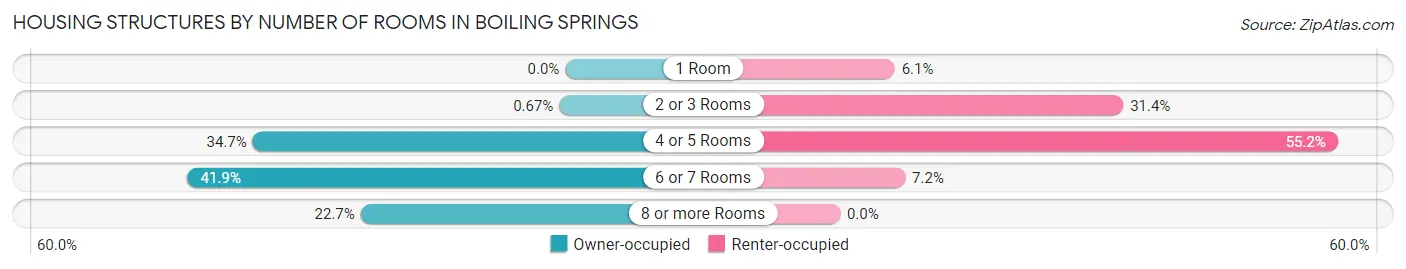
| Number of Rooms | Owner-occupied | Renter-occupied |
| 1 Room | 0 (0.0%) | 47 (6.1%) |
| 2 or 3 Rooms | 24 (0.7%) | 243 (31.4%) |
| 4 or 5 Rooms | 1,251 (34.7%) | 427 (55.2%) |
| 6 or 7 Rooms | 1,511 (41.9%) | 56 (7.2%) |
| 8 or more Rooms | 819 (22.7%) | 0 (0.0%) |
| Total | 3,605 (100.0%) | 773 (100.0%) |
Housing Structure by Heating Type in Boiling Springs
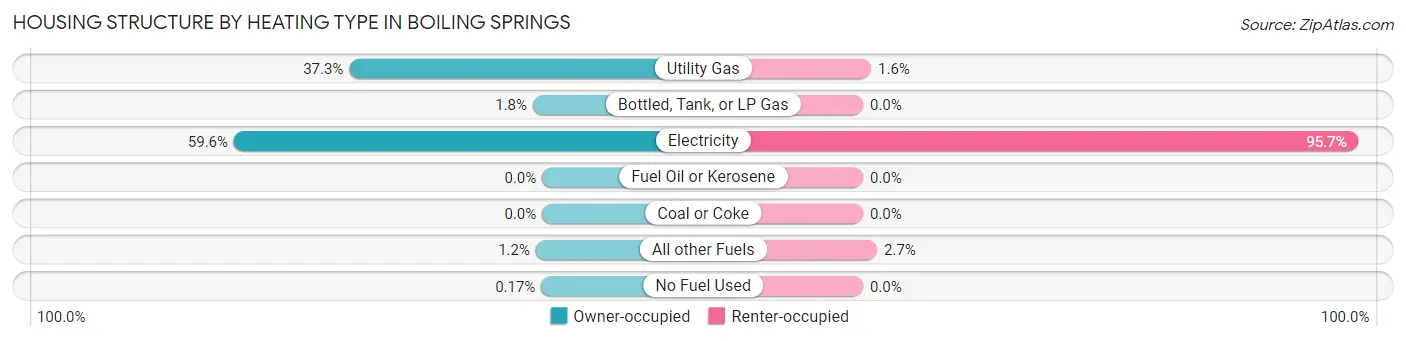
| Heating Type | Owner-occupied | Renter-occupied |
| Utility Gas | 1,344 (37.3%) | 12 (1.5%) |
| Bottled, Tank, or LP Gas | 64 (1.8%) | 0 (0.0%) |
| Electricity | 2,147 (59.6%) | 740 (95.7%) |
| Fuel Oil or Kerosene | 0 (0.0%) | 0 (0.0%) |
| Coal or Coke | 0 (0.0%) | 0 (0.0%) |
| All other Fuels | 44 (1.2%) | 21 (2.7%) |
| No Fuel Used | 6 (0.2%) | 0 (0.0%) |
| Total | 3,605 (100.0%) | 773 (100.0%) |
Household Vehicle Usage in Boiling Springs
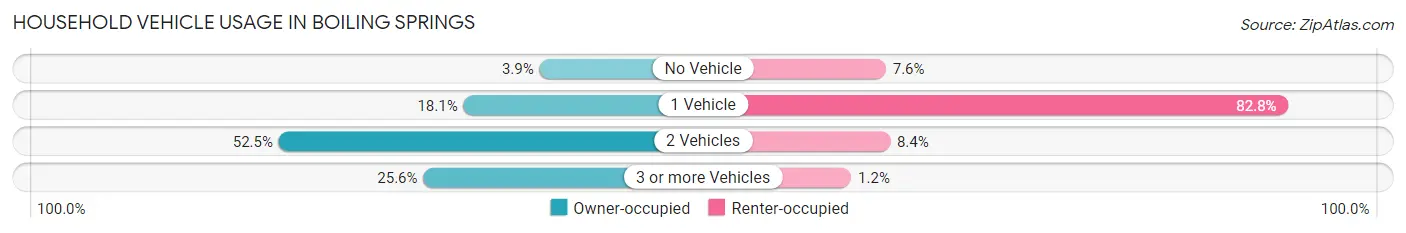
| Vehicles per Household | Owner-occupied | Renter-occupied |
| No Vehicle | 139 (3.9%) | 59 (7.6%) |
| 1 Vehicle | 651 (18.1%) | 640 (82.8%) |
| 2 Vehicles | 1,894 (52.5%) | 65 (8.4%) |
| 3 or more Vehicles | 921 (25.6%) | 9 (1.2%) |
| Total | 3,605 (100.0%) | 773 (100.0%) |
Real Estate & Mortgages in Boiling Springs
Real Estate and Mortgage Overview in Boiling Springs
| Characteristic | Without Mortgage | With Mortgage |
| Housing Units | 1,171 | 2,434 |
| Median Property Value | $192,500 | $201,300 |
| Median Household Income | $48,807 | $463 |
| Monthly Housing Costs | $431 | $25 |
| Real Estate Taxes | $1,008 | $39 |
Property Value by Mortgage Status in Boiling Springs
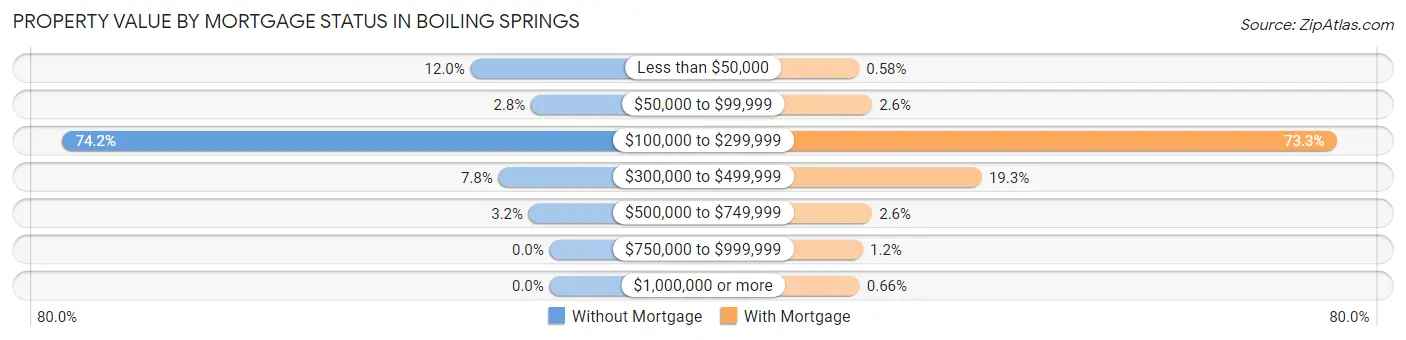
| Property Value | Without Mortgage | With Mortgage |
| Less than $50,000 | 141 (12.0%) | 14 (0.6%) |
| $50,000 to $99,999 | 33 (2.8%) | 62 (2.5%) |
| $100,000 to $299,999 | 869 (74.2%) | 1,783 (73.3%) |
| $300,000 to $499,999 | 91 (7.8%) | 469 (19.3%) |
| $500,000 to $749,999 | 37 (3.2%) | 62 (2.5%) |
| $750,000 to $999,999 | 0 (0.0%) | 28 (1.1%) |
| $1,000,000 or more | 0 (0.0%) | 16 (0.7%) |
| Total | 1,171 (100.0%) | 2,434 (100.0%) |
Household Income by Mortgage Status in Boiling Springs
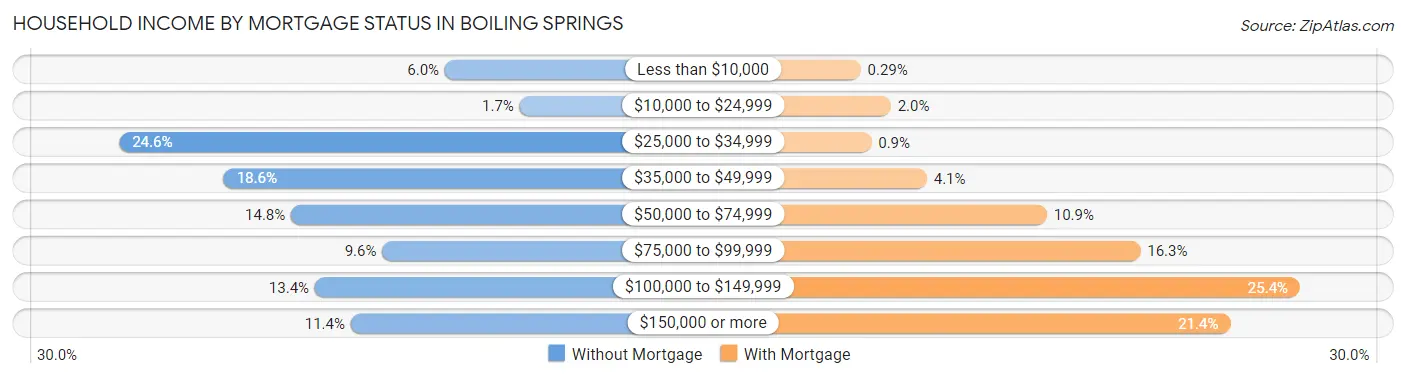
| Household Income | Without Mortgage | With Mortgage |
| Less than $10,000 | 70 (6.0%) | 7 (0.3%) |
| $10,000 to $24,999 | 20 (1.7%) | 49 (2.0%) |
| $25,000 to $34,999 | 288 (24.6%) | 22 (0.9%) |
| $35,000 to $49,999 | 218 (18.6%) | 99 (4.1%) |
| $50,000 to $74,999 | 173 (14.8%) | 266 (10.9%) |
| $75,000 to $99,999 | 112 (9.6%) | 396 (16.3%) |
| $100,000 to $149,999 | 157 (13.4%) | 618 (25.4%) |
| $150,000 or more | 133 (11.4%) | 521 (21.4%) |
| Total | 1,171 (100.0%) | 2,434 (100.0%) |
Property Value to Household Income Ratio in Boiling Springs
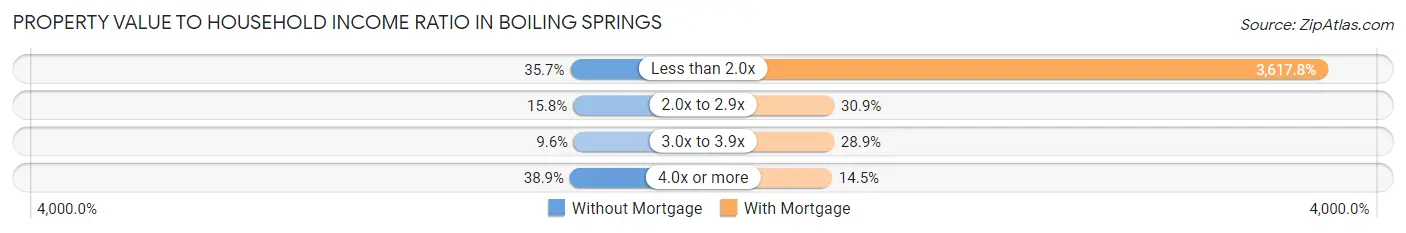
| Value-to-Income Ratio | Without Mortgage | With Mortgage |
| Less than 2.0x | 418 (35.7%) | 88,057 (3,617.8%) |
| 2.0x to 2.9x | 185 (15.8%) | 751 (30.8%) |
| 3.0x to 3.9x | 112 (9.6%) | 703 (28.9%) |
| 4.0x or more | 456 (38.9%) | 352 (14.5%) |
| Total | 1,171 (100.0%) | 2,434 (100.0%) |
Real Estate Taxes by Mortgage Status in Boiling Springs
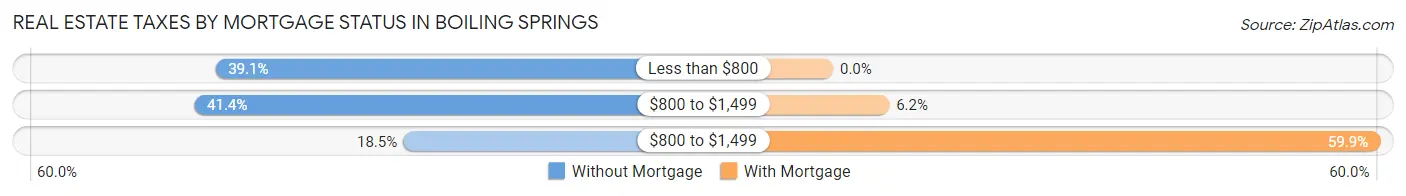
| Property Taxes | Without Mortgage | With Mortgage |
| Less than $800 | 458 (39.1%) | 0 (0.0%) |
| $800 to $1,499 | 485 (41.4%) | 150 (6.2%) |
| $800 to $1,499 | 217 (18.5%) | 1,459 (59.9%) |
| Total | 1,171 (100.0%) | 2,434 (100.0%) |
Health & Disability in Boiling Springs
Health Insurance Coverage by Age in Boiling Springs
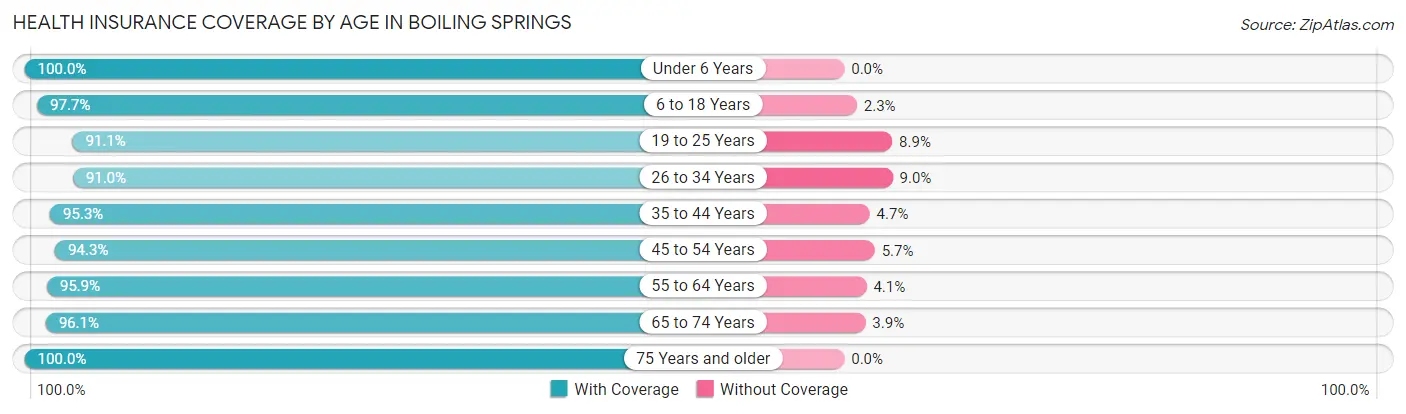
| Age Bracket | With Coverage | Without Coverage |
| Under 6 Years | 766 (100.0%) | 0 (0.0%) |
| 6 to 18 Years | 2,293 (97.7%) | 55 (2.3%) |
| 19 to 25 Years | 622 (91.1%) | 61 (8.9%) |
| 26 to 34 Years | 1,373 (91.0%) | 136 (9.0%) |
| 35 to 44 Years | 1,410 (95.3%) | 70 (4.7%) |
| 45 to 54 Years | 1,397 (94.3%) | 84 (5.7%) |
| 55 to 64 Years | 1,275 (95.9%) | 55 (4.1%) |
| 65 to 74 Years | 829 (96.1%) | 34 (3.9%) |
| 75 Years and older | 678 (100.0%) | 0 (0.0%) |
| Total | 10,643 (95.6%) | 495 (4.4%) |
Health Insurance Coverage by Citizenship Status in Boiling Springs
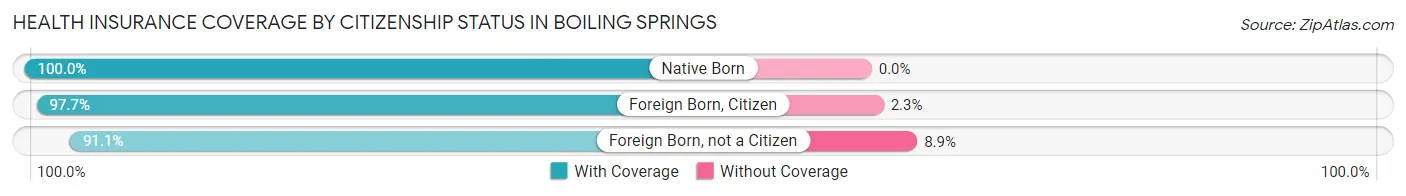
| Citizenship Status | With Coverage | Without Coverage |
| Native Born | 766 (100.0%) | 0 (0.0%) |
| Foreign Born, Citizen | 2,293 (97.7%) | 55 (2.3%) |
| Foreign Born, not a Citizen | 622 (91.1%) | 61 (8.9%) |
Health Insurance Coverage by Household Income in Boiling Springs
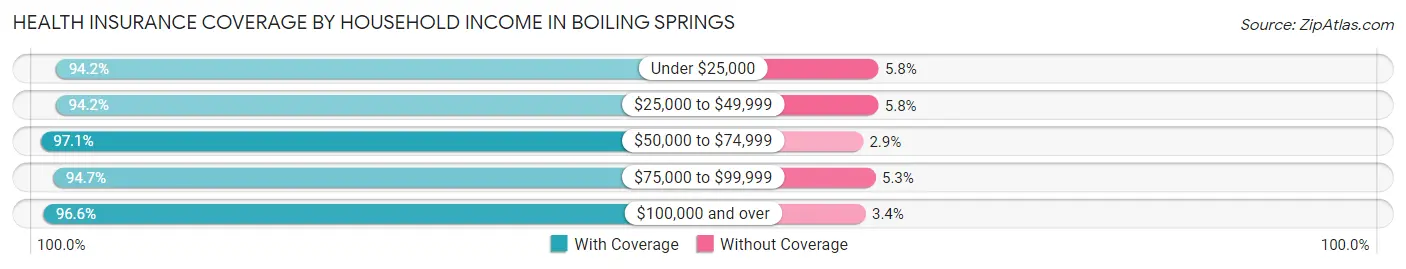
| Household Income | With Coverage | Without Coverage |
| Under $25,000 | 725 (94.2%) | 45 (5.8%) |
| $25,000 to $49,999 | 2,136 (94.2%) | 132 (5.8%) |
| $50,000 to $74,999 | 1,584 (97.1%) | 48 (2.9%) |
| $75,000 to $99,999 | 2,077 (94.7%) | 116 (5.3%) |
| $100,000 and over | 4,119 (96.6%) | 146 (3.4%) |
Public vs Private Health Insurance Coverage by Age in Boiling Springs
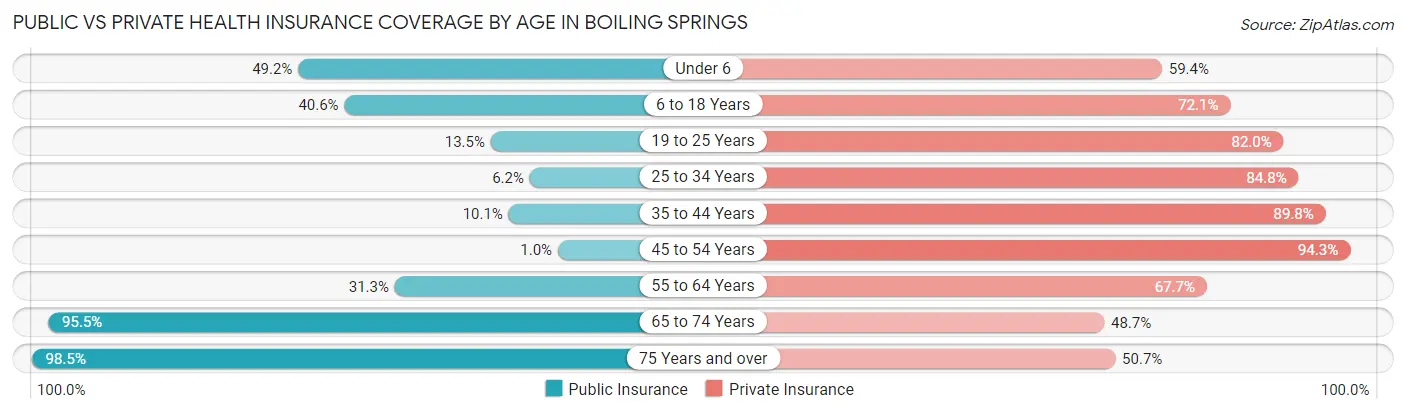
| Age Bracket | Public Insurance | Private Insurance |
| Under 6 | 377 (49.2%) | 455 (59.4%) |
| 6 to 18 Years | 954 (40.6%) | 1,693 (72.1%) |
| 19 to 25 Years | 92 (13.5%) | 560 (82.0%) |
| 25 to 34 Years | 94 (6.2%) | 1,279 (84.8%) |
| 35 to 44 Years | 150 (10.1%) | 1,329 (89.8%) |
| 45 to 54 Years | 15 (1.0%) | 1,397 (94.3%) |
| 55 to 64 Years | 416 (31.3%) | 901 (67.7%) |
| 65 to 74 Years | 824 (95.5%) | 420 (48.7%) |
| 75 Years and over | 668 (98.5%) | 344 (50.7%) |
| Total | 3,590 (32.2%) | 8,378 (75.2%) |
Disability Status by Sex by Age in Boiling Springs
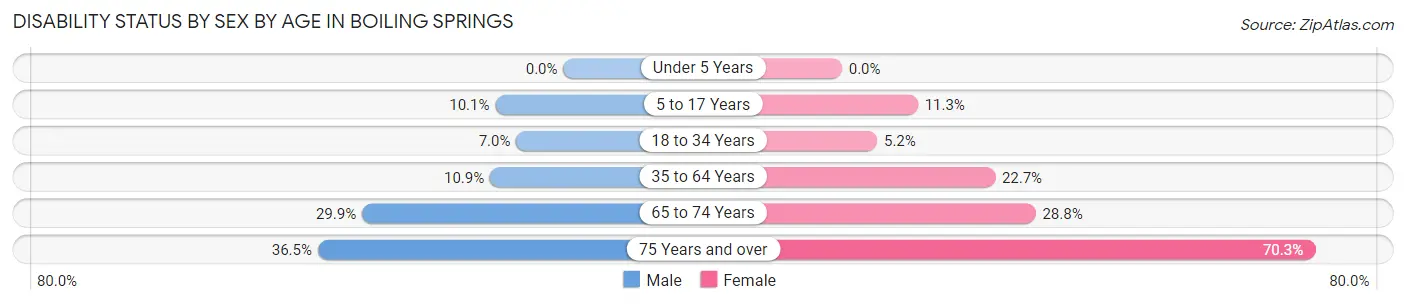
| Age Bracket | Male | Female |
| Under 5 Years | 0 (0.0%) | 0 (0.0%) |
| 5 to 17 Years | 126 (10.1%) | 126 (11.3%) |
| 18 to 34 Years | 75 (7.0%) | 62 (5.2%) |
| 35 to 64 Years | 213 (10.9%) | 531 (22.7%) |
| 65 to 74 Years | 125 (29.9%) | 128 (28.8%) |
| 75 Years and over | 105 (36.5%) | 274 (70.3%) |
Disability Class by Sex by Age in Boiling Springs
Disability Class: Hearing Difficulty
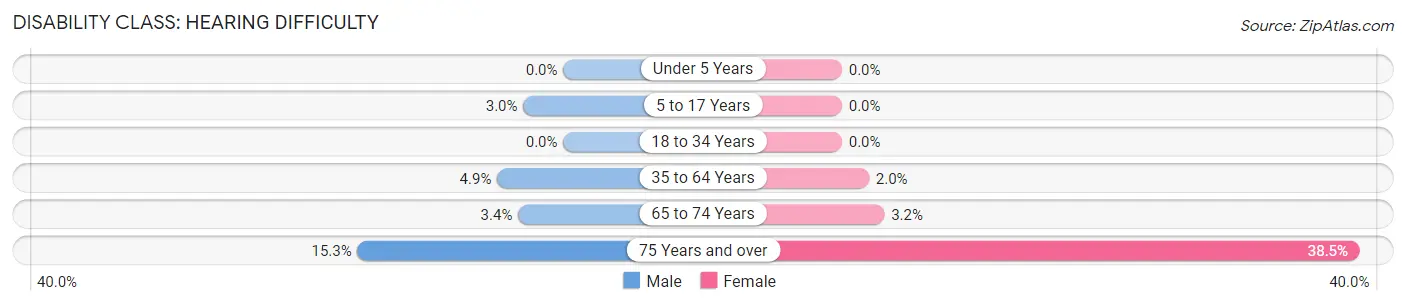
| Age Bracket | Male | Female |
| Under 5 Years | 0 (0.0%) | 0 (0.0%) |
| 5 to 17 Years | 37 (3.0%) | 0 (0.0%) |
| 18 to 34 Years | 0 (0.0%) | 0 (0.0%) |
| 35 to 64 Years | 96 (4.9%) | 47 (2.0%) |
| 65 to 74 Years | 14 (3.4%) | 14 (3.2%) |
| 75 Years and over | 44 (15.3%) | 150 (38.5%) |
Disability Class: Vision Difficulty
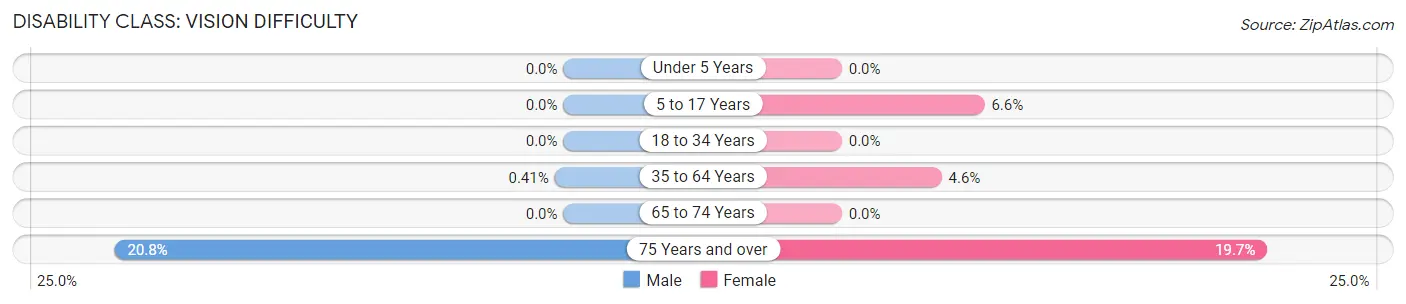
| Age Bracket | Male | Female |
| Under 5 Years | 0 (0.0%) | 0 (0.0%) |
| 5 to 17 Years | 0 (0.0%) | 74 (6.6%) |
| 18 to 34 Years | 0 (0.0%) | 0 (0.0%) |
| 35 to 64 Years | 8 (0.4%) | 108 (4.6%) |
| 65 to 74 Years | 0 (0.0%) | 0 (0.0%) |
| 75 Years and over | 60 (20.8%) | 77 (19.7%) |
Disability Class: Cognitive Difficulty
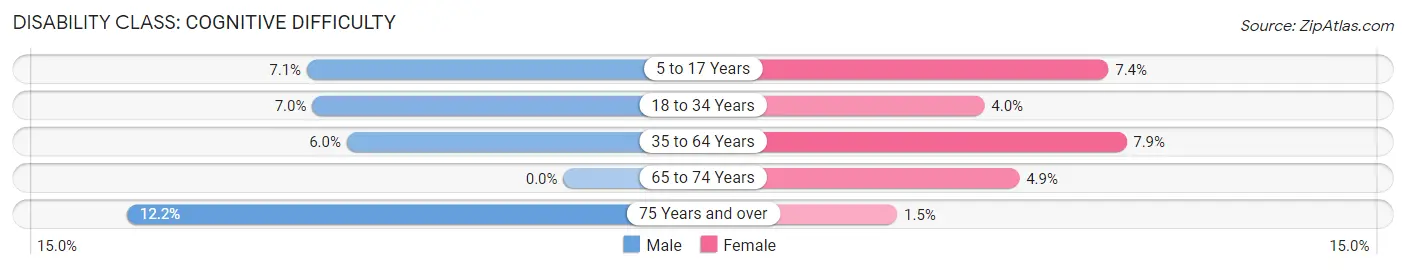
| Age Bracket | Male | Female |
| 5 to 17 Years | 89 (7.1%) | 83 (7.4%) |
| 18 to 34 Years | 75 (7.0%) | 47 (4.0%) |
| 35 to 64 Years | 118 (6.0%) | 185 (7.9%) |
| 65 to 74 Years | 0 (0.0%) | 22 (4.9%) |
| 75 Years and over | 35 (12.1%) | 6 (1.5%) |
Disability Class: Ambulatory Difficulty
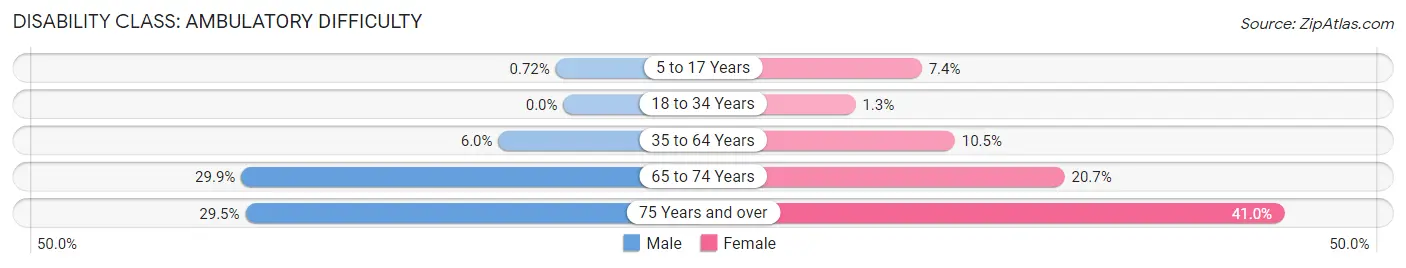
| Age Bracket | Male | Female |
| 5 to 17 Years | 9 (0.7%) | 83 (7.4%) |
| 18 to 34 Years | 0 (0.0%) | 15 (1.3%) |
| 35 to 64 Years | 118 (6.0%) | 245 (10.5%) |
| 65 to 74 Years | 125 (29.9%) | 92 (20.7%) |
| 75 Years and over | 85 (29.5%) | 160 (41.0%) |
Disability Class: Self-Care Difficulty
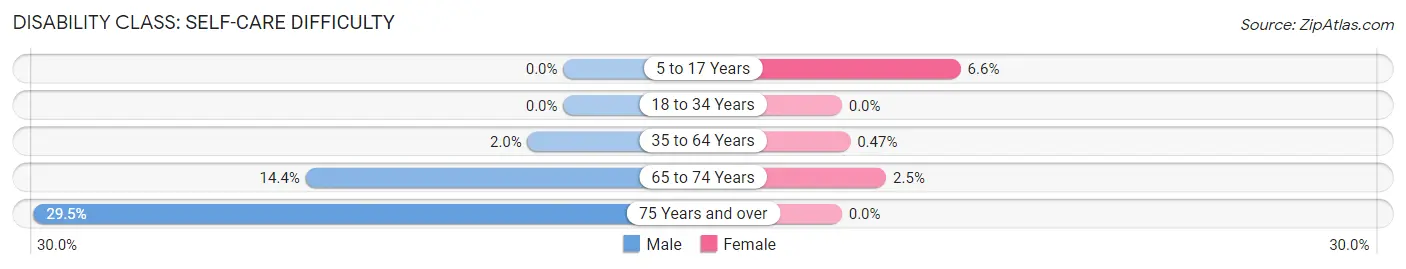
| Age Bracket | Male | Female |
| 5 to 17 Years | 0 (0.0%) | 74 (6.6%) |
| 18 to 34 Years | 0 (0.0%) | 0 (0.0%) |
| 35 to 64 Years | 39 (2.0%) | 11 (0.5%) |
| 65 to 74 Years | 60 (14.3%) | 11 (2.5%) |
| 75 Years and over | 85 (29.5%) | 0 (0.0%) |
Technology Access in Boiling Springs
Computing Device Access in Boiling Springs
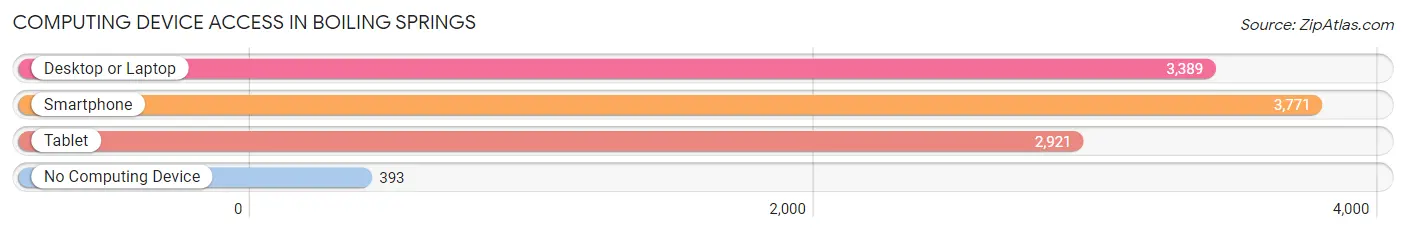
| Device Type | # Households | % Households |
| Desktop or Laptop | 3,389 | 77.4% |
| Smartphone | 3,771 | 86.1% |
| Tablet | 2,921 | 66.7% |
| No Computing Device | 393 | 9.0% |
| Total | 4,378 | 100.0% |
Internet Access in Boiling Springs
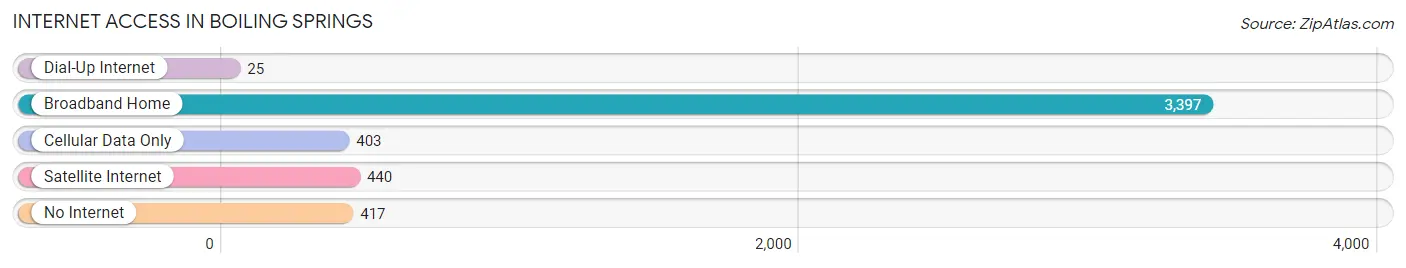
| Internet Type | # Households | % Households |
| Dial-Up Internet | 25 | 0.6% |
| Broadband Home | 3,397 | 77.6% |
| Cellular Data Only | 403 | 9.2% |
| Satellite Internet | 440 | 10.1% |
| No Internet | 417 | 9.5% |
| Total | 4,378 | 100.0% |
Boiling Springs Summary
Boiling Springs, South Carolina is a small town located in Spartanburg County, South Carolina. It is situated in the foothills of the Blue Ridge Mountains and is part of the greater Spartanburg metropolitan area. The town has a population of approximately 4,000 people and is known for its rural charm and small-town atmosphere.
History
Boiling Springs was founded in 1776 by a group of settlers from the nearby town of Spartanburg. The town was named after a nearby spring that was said to boil due to the high mineral content of the water. The town was originally a farming community and was home to several mills and factories. In the late 19th century, the town began to grow and develop as a resort destination. The town was home to several hotels and resorts, as well as a golf course.
Geography
Boiling Springs is located in the foothills of the Blue Ridge Mountains in Spartanburg County, South Carolina. The town is situated at an elevation of 890 feet above sea level. The town is located approximately 25 miles from the city of Spartanburg and is part of the greater Spartanburg metropolitan area. The town is bordered by the towns of Chesnee, Inman, and Landrum.
Economy
Boiling Springs is a small town with a population of approximately 4,000 people. The town is home to several small businesses, including restaurants, retail stores, and professional services. The town is also home to several manufacturing companies, including a paper mill and a textile mill. The town is also home to a golf course and several resorts.
Demographics
As of the 2010 census, Boiling Springs had a population of 4,000 people. The racial makeup of the town was 87.3% White, 8.2% African American, 0.3% Native American, 0.7% Asian, and 3.5% from other races. The median household income in Boiling Springs was $41,250, and the median family income was $50,000. The town has a poverty rate of 15.3%.
Boiling Springs is a small town with a rural charm and a small-town atmosphere. The town is home to several businesses and manufacturing companies, as well as a golf course and several resorts. The town has a population of approximately 4,000 people and is part of the greater Spartanburg metropolitan area. Boiling Springs is a great place to live and work, and it is a great place to visit.
Common Questions
What is Per Capita Income in Boiling Springs?
Per Capita income in Boiling Springs is $34,688.
What is the Median Family Income in Boiling Springs?
Median Family Income in Boiling Springs is $85,705.
What is the Median Household income in Boiling Springs?
Median Household Income in Boiling Springs is $68,993.
What is Income or Wage Gap in Boiling Springs?
Income or Wage Gap in Boiling Springs is 32.8%.
Women in Boiling Springs earn 67.2 cents for every dollar earned by a man.
What is Family Income Deficit in Boiling Springs?
Family Income Deficit in Boiling Springs is $8,758.
Families that are below poverty line in Boiling Springs earn $8,758 less on average than the poverty threshold level.
What is Inequality or Gini Index in Boiling Springs?
Inequality or Gini Index in Boiling Springs is 0.42.
What is the Total Population of Boiling Springs?
Total Population of Boiling Springs is 11,191.
What is the Total Male Population of Boiling Springs?
Total Male Population of Boiling Springs is 5,248.
What is the Total Female Population of Boiling Springs?
Total Female Population of Boiling Springs is 5,943.
What is the Ratio of Males per 100 Females in Boiling Springs?
There are 88.31 Males per 100 Females in Boiling Springs.
What is the Ratio of Females per 100 Males in Boiling Springs?
There are 113.24 Females per 100 Males in Boiling Springs.
What is the Median Population Age in Boiling Springs?
Median Population Age in Boiling Springs is 36.6 Years.
What is the Average Family Size in Boiling Springs
Average Family Size in Boiling Springs is 3.1 People.
What is the Average Household Size in Boiling Springs
Average Household Size in Boiling Springs is 2.5 People.
How Large is the Labor Force in Boiling Springs?
There are 5,476 People in the Labor Forcein in Boiling Springs.
What is the Percentage of People in the Labor Force in Boiling Springs?
64.0% of People are in the Labor Force in Boiling Springs.
What is the Unemployment Rate in Boiling Springs?
Unemployment Rate in Boiling Springs is 3.9%.