Zip Codes with the Highest Percentage of Population with a Degree in Engineering in Greer, SC
RELATED REPORTS & OPTIONS
Engineering
Greer
Compare Zip Codes
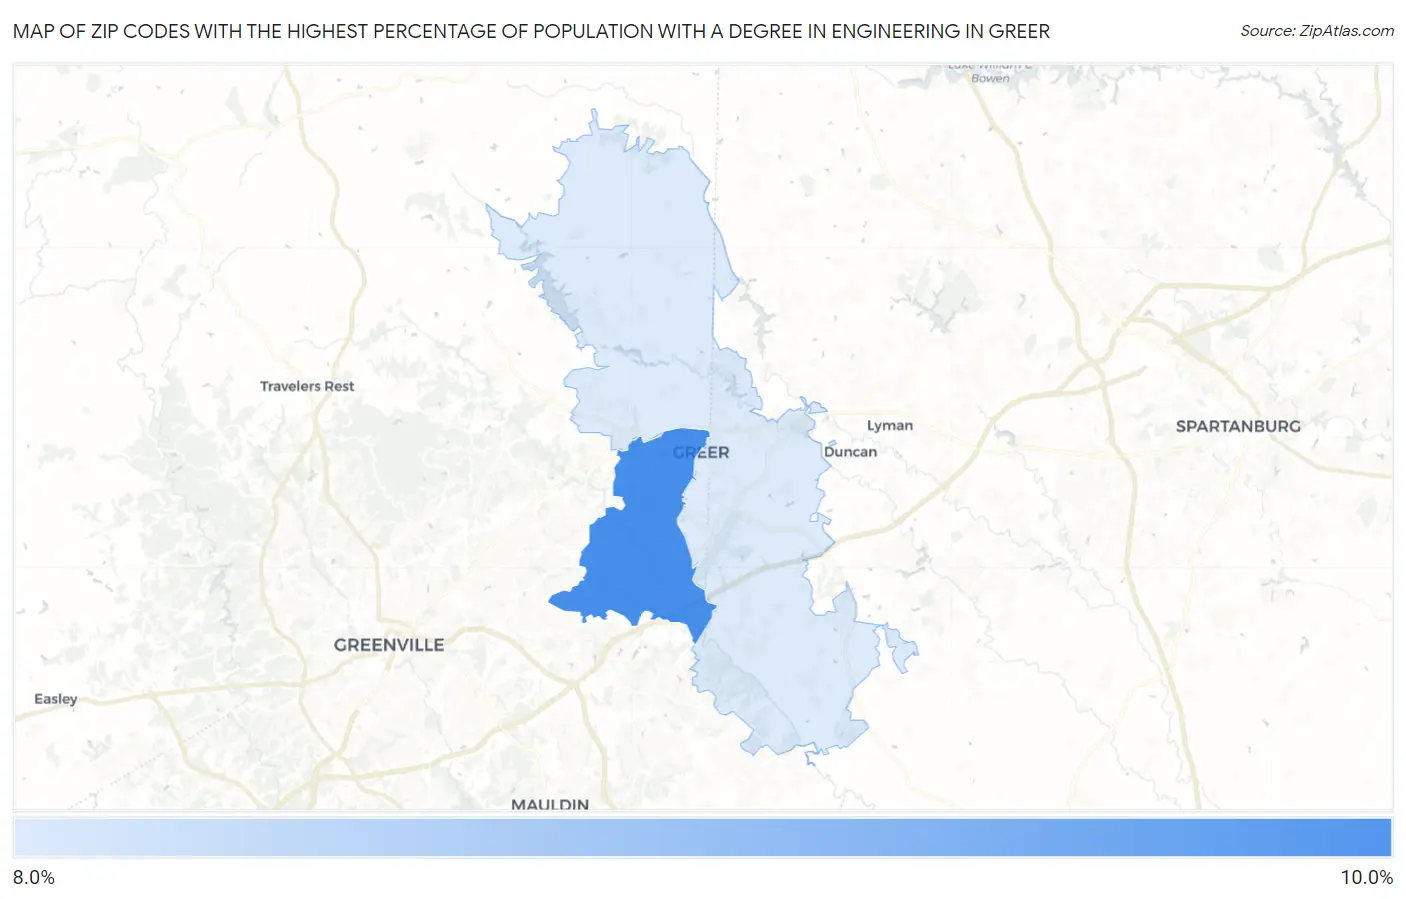
Map of Zip Codes with the Highest Percentage of Population with a Degree in Engineering in Greer
8.8%
10.0%
Zip Codes with the Highest Percentage of Population with a Degree in Engineering in Greer, SC
| Zip Code | % Graduates | vs State | vs National | |
| 1. | 29650 | 10.0% | 7.0%(+2.94)#61 | 7.6%(+2.31)#4,489 |
| 2. | 29651 | 8.8% | 7.0%(+1.76)#82 | 7.6%(+1.12)#5,915 |
1
Common Questions
What are the Top Zip Codes with the Highest Percentage of Population with a Degree in Engineering in Greer, SC?
Top Zip Codes with the Highest Percentage of Population with a Degree in Engineering in Greer, SC are:
What zip code has the Highest Percentage of Population with a Degree in Engineering in Greer, SC?
29650 has the Highest Percentage of Population with a Degree in Engineering in Greer, SC with 10.0%.
What is the Percentage of Population with a Degree in Engineering in Greer, SC?
Percentage of Population with a Degree in Engineering in Greer is 7.8%.
What is the Percentage of Population with a Degree in Engineering in South Carolina?
Percentage of Population with a Degree in Engineering in South Carolina is 7.0%.
What is the Percentage of Population with a Degree in Engineering in the United States?
Percentage of Population with a Degree in Engineering in the United States is 7.6%.