Zip Codes with the Highest Percentage of Population with a Degree in Engineering in Seneca, SC
RELATED REPORTS & OPTIONS
Engineering
Seneca
Compare Zip Codes
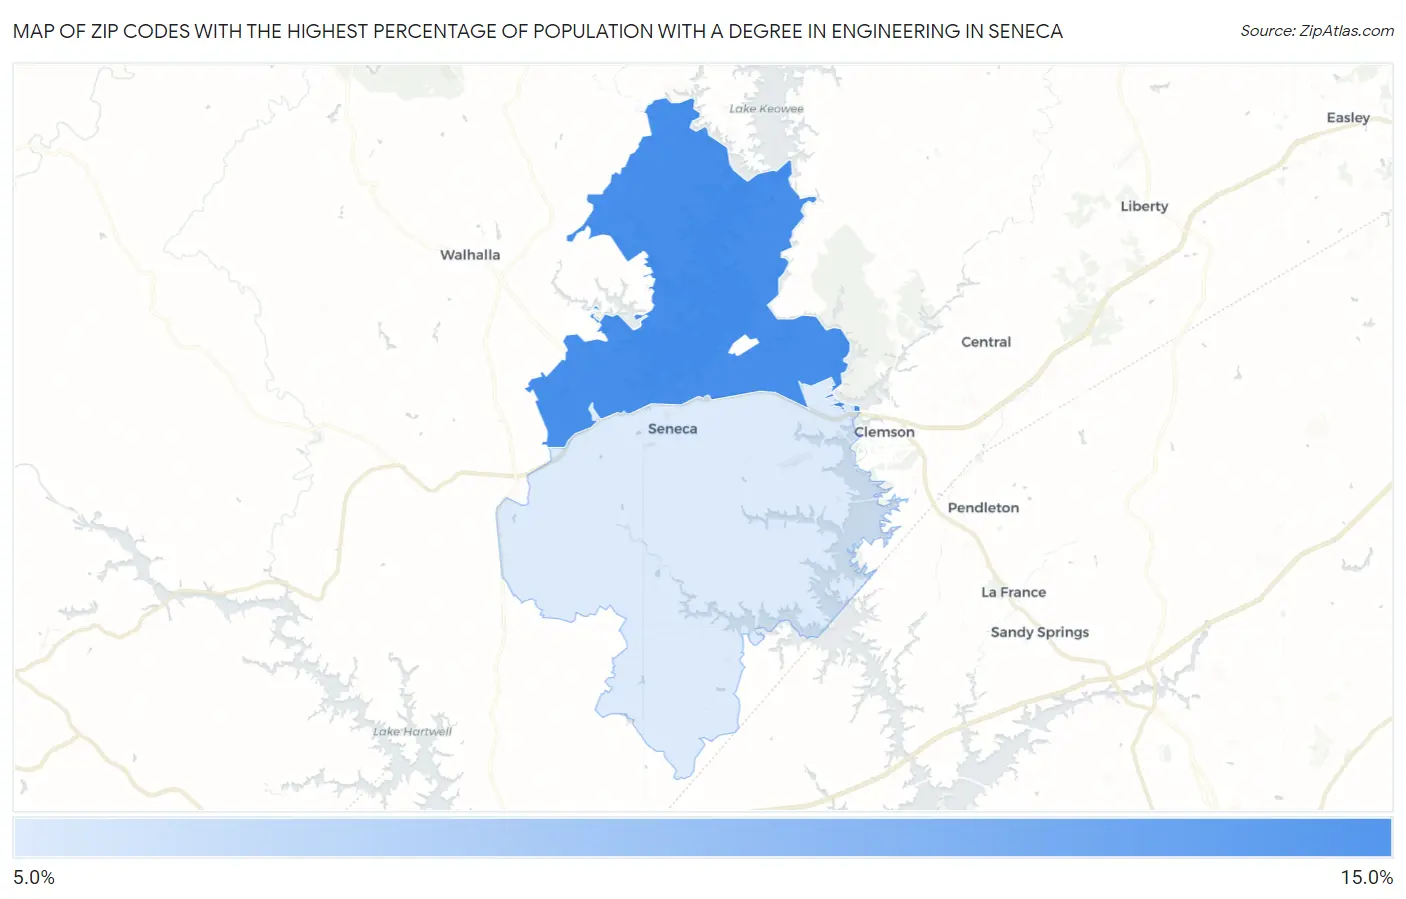
Map of Zip Codes with the Highest Percentage of Population with a Degree in Engineering in Seneca
10.3%
12.5%
Zip Codes with the Highest Percentage of Population with a Degree in Engineering in Seneca, SC
| Zip Code | % Graduates | vs State | vs National | |
| 1. | 29672 | 12.5% | 7.0%(+5.53)#33 | 7.6%(+4.89)#2,600 |
| 2. | 29678 | 10.3% | 7.0%(+3.31)#54 | 7.6%(+2.67)#4,156 |
1
Common Questions
What are the Top Zip Codes with the Highest Percentage of Population with a Degree in Engineering in Seneca, SC?
Top Zip Codes with the Highest Percentage of Population with a Degree in Engineering in Seneca, SC are:
What zip code has the Highest Percentage of Population with a Degree in Engineering in Seneca, SC?
29672 has the Highest Percentage of Population with a Degree in Engineering in Seneca, SC with 12.5%.
What is the Percentage of Population with a Degree in Engineering in Seneca, SC?
Percentage of Population with a Degree in Engineering in Seneca is 16.9%.
What is the Percentage of Population with a Degree in Engineering in South Carolina?
Percentage of Population with a Degree in Engineering in South Carolina is 7.0%.
What is the Percentage of Population with a Degree in Engineering in the United States?
Percentage of Population with a Degree in Engineering in the United States is 7.6%.