Irwin, SC Map & Demographics
Irwin Map
Irwin Overview
$22,048
PER CAPITA INCOME
$42,188
AVG FAMILY INCOME
$40,139
AVG HOUSEHOLD INCOME
46.7%
WAGE / INCOME GAP [ % ]
53.3¢/ $1
WAGE / INCOME GAP [ $ ]
$11,996
FAMILY INCOME DEFICIT
0.47
INEQUALITY / GINI INDEX
1,868
TOTAL POPULATION
936
MALE POPULATION
932
FEMALE POPULATION
100.43
MALES / 100 FEMALES
99.57
FEMALES / 100 MALES
45.2
MEDIAN AGE
3.0
AVG FAMILY SIZE
2.7
AVG HOUSEHOLD SIZE
854
LABOR FORCE [ PEOPLE ]
57.0%
PERCENT IN LABOR FORCE
11.6%
UNEMPLOYMENT RATE
Income in Irwin
Income Overview in Irwin
Per Capita Income in Irwin is $22,048, while median incomes of families and households are $42,188 and $40,139 respectively.
| Characteristic | Number | Measure |
| Per Capita Income | 1,868 | $22,048 |
| Median Family Income | 485 | $42,188 |
| Mean Family Income | 485 | $58,397 |
| Median Household Income | 702 | $40,139 |
| Mean Household Income | 702 | $50,078 |
| Income Deficit | 485 | $11,996 |
| Wage / Income Gap (%) | 1,868 | 46.69% |
| Wage / Income Gap ($) | 1,868 | 53.31¢ per $1 |
| Gini / Inequality Index | 1,868 | 0.47 |
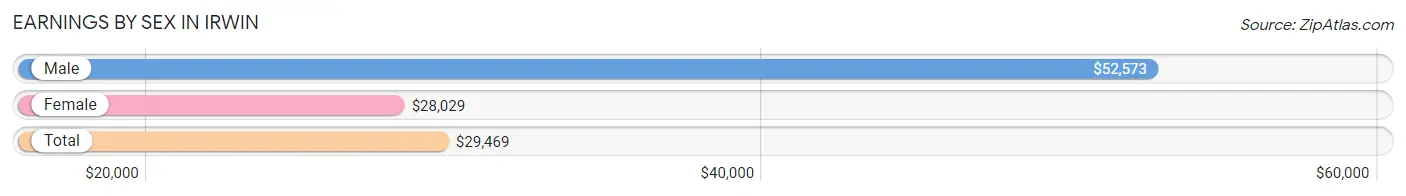
Earnings by Sex in Irwin
Average Earnings in Irwin are $29,469, $52,573 for men and $28,029 for women, a difference of 46.7%.
| Sex | Number | Average Earnings |
| Male | 465 (56.3%) | $52,573 |
| Female | 361 (43.7%) | $28,029 |
| Total | 826 (100.0%) | $29,469 |
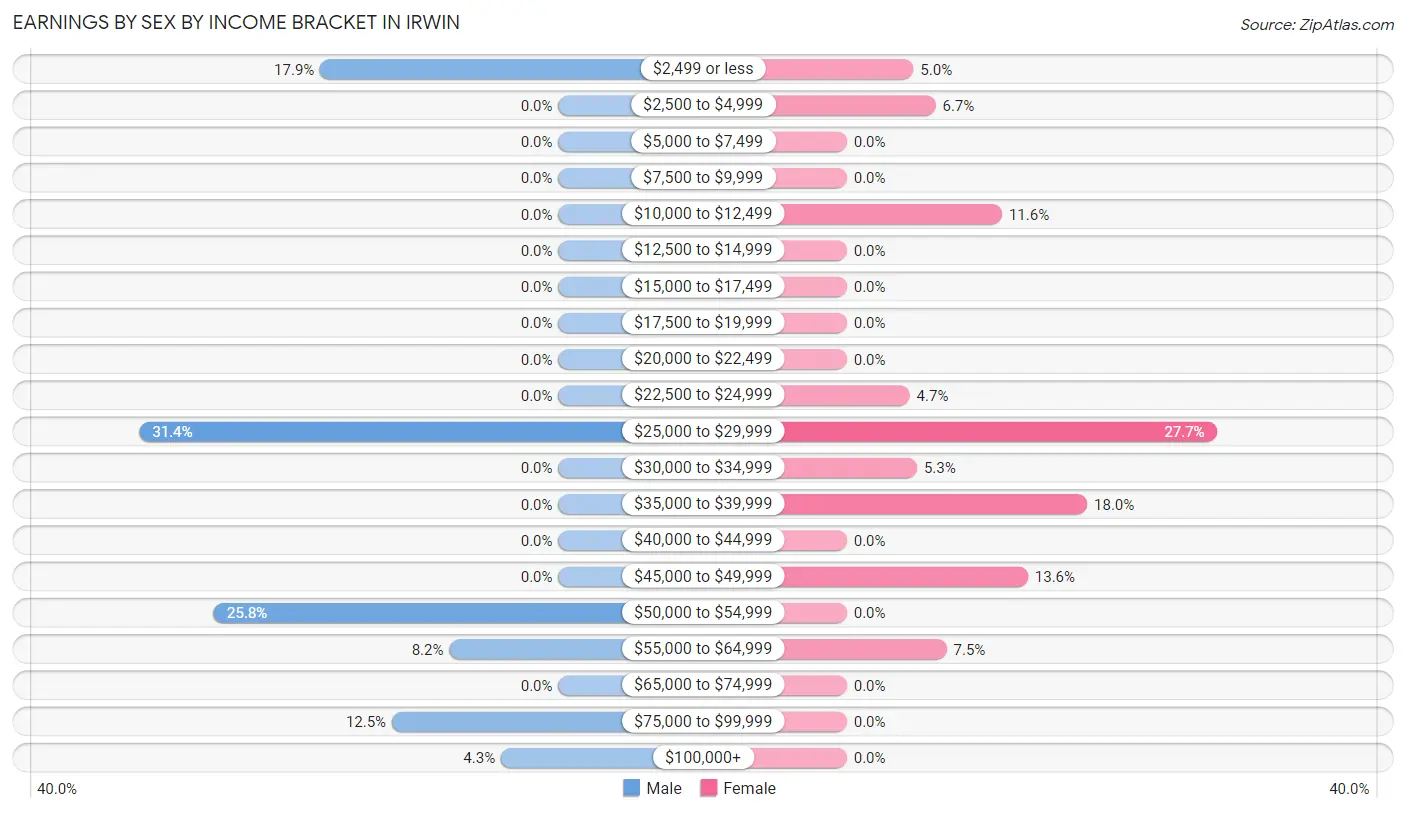
Earnings by Sex by Income Bracket in Irwin
The most common earnings brackets in Irwin are $25,000 to $29,999 for men (146 | 31.4%) and $25,000 to $29,999 for women (100 | 27.7%).
| Income | Male | Female |
| $2,499 or less | 83 (17.8%) | 18 (5.0%) |
| $2,500 to $4,999 | 0 (0.0%) | 24 (6.7%) |
| $5,000 to $7,499 | 0 (0.0%) | 0 (0.0%) |
| $7,500 to $9,999 | 0 (0.0%) | 0 (0.0%) |
| $10,000 to $12,499 | 0 (0.0%) | 42 (11.6%) |
| $12,500 to $14,999 | 0 (0.0%) | 0 (0.0%) |
| $15,000 to $17,499 | 0 (0.0%) | 0 (0.0%) |
| $17,500 to $19,999 | 0 (0.0%) | 0 (0.0%) |
| $20,000 to $22,499 | 0 (0.0%) | 0 (0.0%) |
| $22,500 to $24,999 | 0 (0.0%) | 17 (4.7%) |
| $25,000 to $29,999 | 146 (31.4%) | 100 (27.7%) |
| $30,000 to $34,999 | 0 (0.0%) | 19 (5.3%) |
| $35,000 to $39,999 | 0 (0.0%) | 65 (18.0%) |
| $40,000 to $44,999 | 0 (0.0%) | 0 (0.0%) |
| $45,000 to $49,999 | 0 (0.0%) | 49 (13.6%) |
| $50,000 to $54,999 | 120 (25.8%) | 0 (0.0%) |
| $55,000 to $64,999 | 38 (8.2%) | 27 (7.5%) |
| $65,000 to $74,999 | 0 (0.0%) | 0 (0.0%) |
| $75,000 to $99,999 | 58 (12.5%) | 0 (0.0%) |
| $100,000+ | 20 (4.3%) | 0 (0.0%) |
| Total | 465 (100.0%) | 361 (100.0%) |
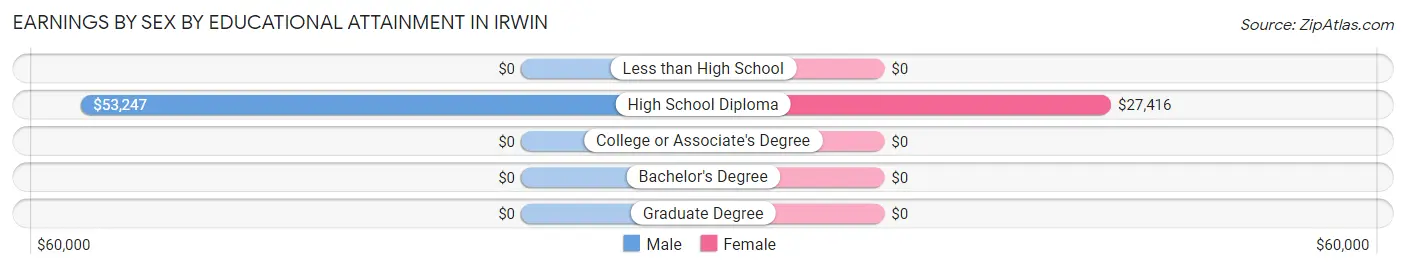
Earnings by Sex by Educational Attainment in Irwin
| Educational Attainment | Male Income | Female Income |
| Less than High School | - | - |
| High School Diploma | $53,247 | $27,416 |
| College or Associate's Degree | - | - |
| Bachelor's Degree | - | - |
| Graduate Degree | - | - |
| Total | - | - |
Family Income in Irwin
Family Income Brackets in Irwin
According to the Irwin family income data, there are 112 families falling into the $25,000 to $34,999 income range, which is the most common income bracket and makes up 23.1% of all families.
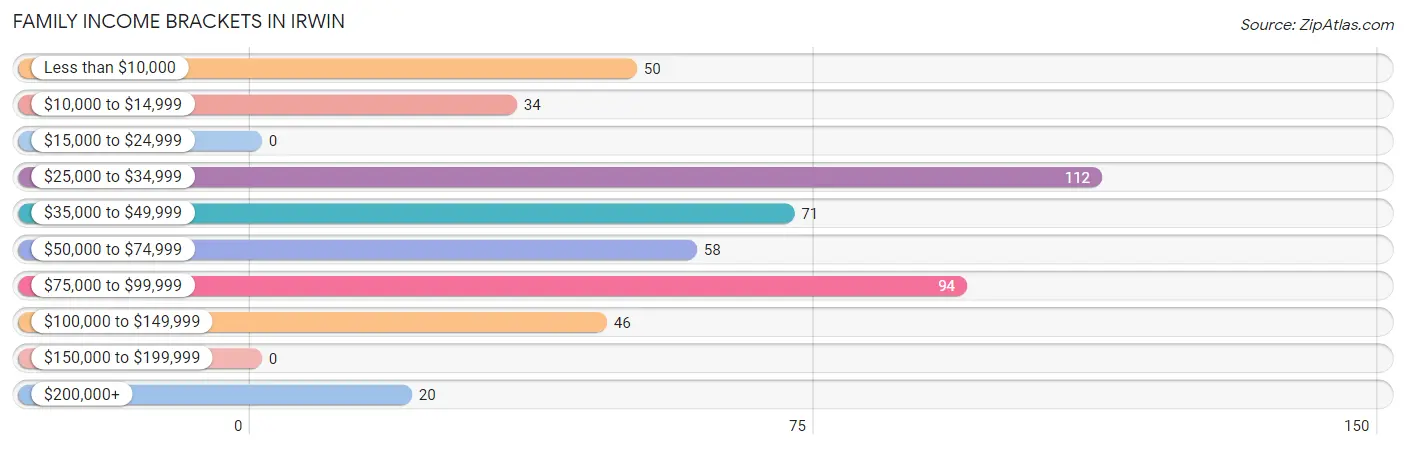
| Income Bracket | # Families | % Families |
| Less than $10,000 | 50 | 10.3% |
| $10,000 to $14,999 | 34 | 7.0% |
| $15,000 to $24,999 | 0 | 0.0% |
| $25,000 to $34,999 | 112 | 23.1% |
| $35,000 to $49,999 | 71 | 14.6% |
| $50,000 to $74,999 | 58 | 12.0% |
| $75,000 to $99,999 | 94 | 19.4% |
| $100,000 to $149,999 | 46 | 9.5% |
| $150,000 to $199,999 | 0 | 0.0% |
| $200,000+ | 20 | 4.1% |
Family Income by Famaliy Size in Irwin
3-person families (115 | 23.7%) account for the highest median family income in Irwin with $94,129 per family, while 3-person families (115 | 23.7%) have the highest median income of $31,376 per family member.
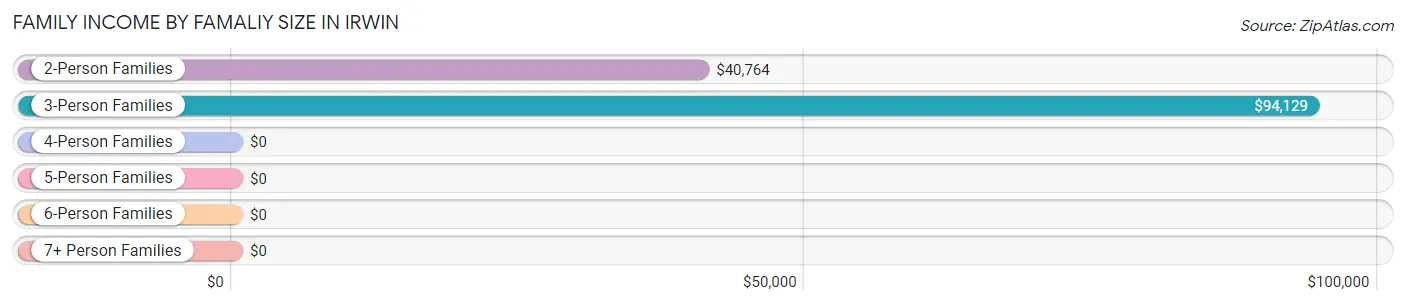
| Income Bracket | # Families | Median Income |
| 2-Person Families | 272 (56.1%) | $40,764 |
| 3-Person Families | 115 (23.7%) | $94,129 |
| 4-Person Families | 12 (2.5%) | $0 |
| 5-Person Families | 86 (17.7%) | $0 |
| 6-Person Families | 0 (0.0%) | $0 |
| 7+ Person Families | 0 (0.0%) | $0 |
| Total | 485 (100.0%) | $42,188 |
Family Income by Number of Earners in Irwin
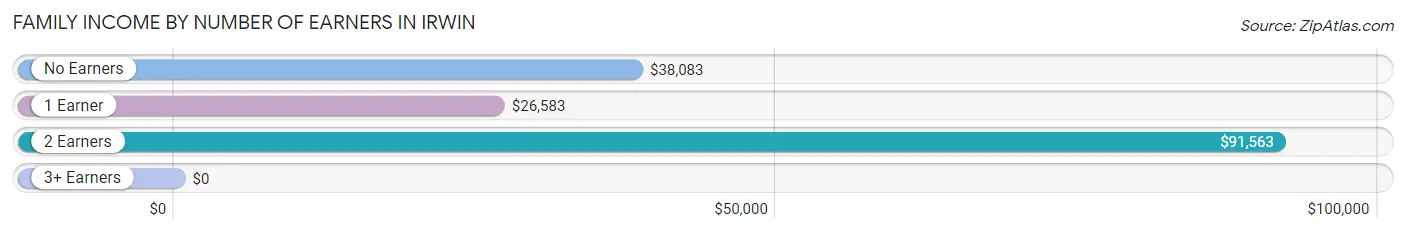
| Number of Earners | # Families | Median Income |
| No Earners | 51 (10.5%) | $38,083 |
| 1 Earner | 282 (58.1%) | $26,583 |
| 2 Earners | 131 (27.0%) | $91,563 |
| 3+ Earners | 21 (4.3%) | $0 |
| Total | 485 (100.0%) | $42,188 |
Household Income in Irwin
Household Income Brackets in Irwin
With 122 households falling in the category, the $10,000 to $14,999 income range is the most frequent in Irwin, accounting for 17.4% of all households.
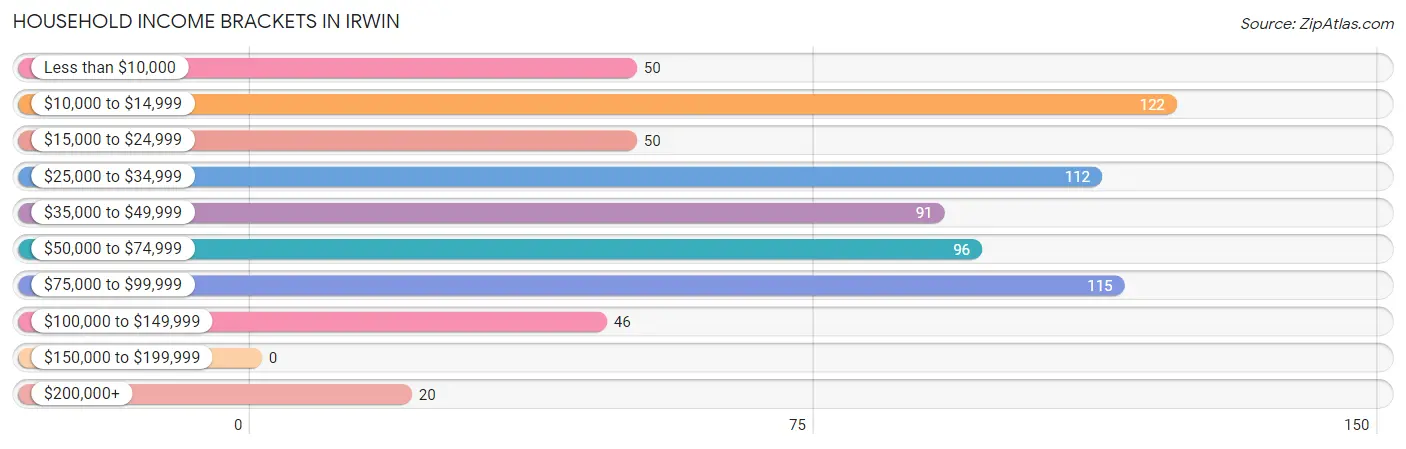
| Income Bracket | # Households | % Households |
| Less than $10,000 | 50 | 7.1% |
| $10,000 to $14,999 | 122 | 17.4% |
| $15,000 to $24,999 | 50 | 7.1% |
| $25,000 to $34,999 | 112 | 16.0% |
| $35,000 to $49,999 | 91 | 13.0% |
| $50,000 to $74,999 | 96 | 13.7% |
| $75,000 to $99,999 | 115 | 16.4% |
| $100,000 to $149,999 | 46 | 6.6% |
| $150,000 to $199,999 | 0 | 0.0% |
| $200,000+ | 20 | 2.8% |
Household Income by Householder Age in Irwin
The median household income in Irwin is $40,139, with the highest median household income of $39,583 found in the 65+ years age bracket for the primary householder. A total of 277 households (39.5%) fall into this category. Meanwhile, the 15 to 24 years age bracket for the primary householder has the lowest median household income of $0, with 36 households (5.1%) in this group.
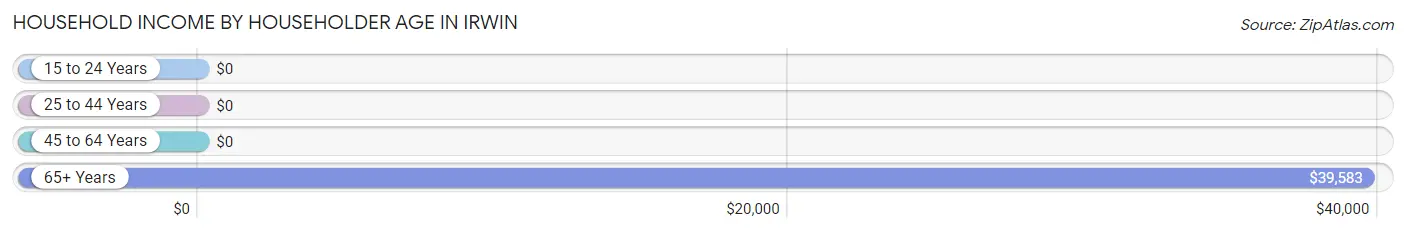
| Income Bracket | # Households | Median Income |
| 15 to 24 Years | 36 (5.1%) | $0 |
| 25 to 44 Years | 150 (21.4%) | $0 |
| 45 to 64 Years | 239 (34.1%) | $0 |
| 65+ Years | 277 (39.5%) | $39,583 |
| Total | 702 (100.0%) | $40,139 |
Poverty in Irwin
Income Below Poverty by Sex and Age in Irwin
With 39.8% poverty level for males and 42.5% for females among the residents of Irwin, under 5 year old males and 6 to 11 year old females are the most vulnerable to poverty, with 9 males (100.0%) and 53 females (80.3%) in their respective age groups living below the poverty level.
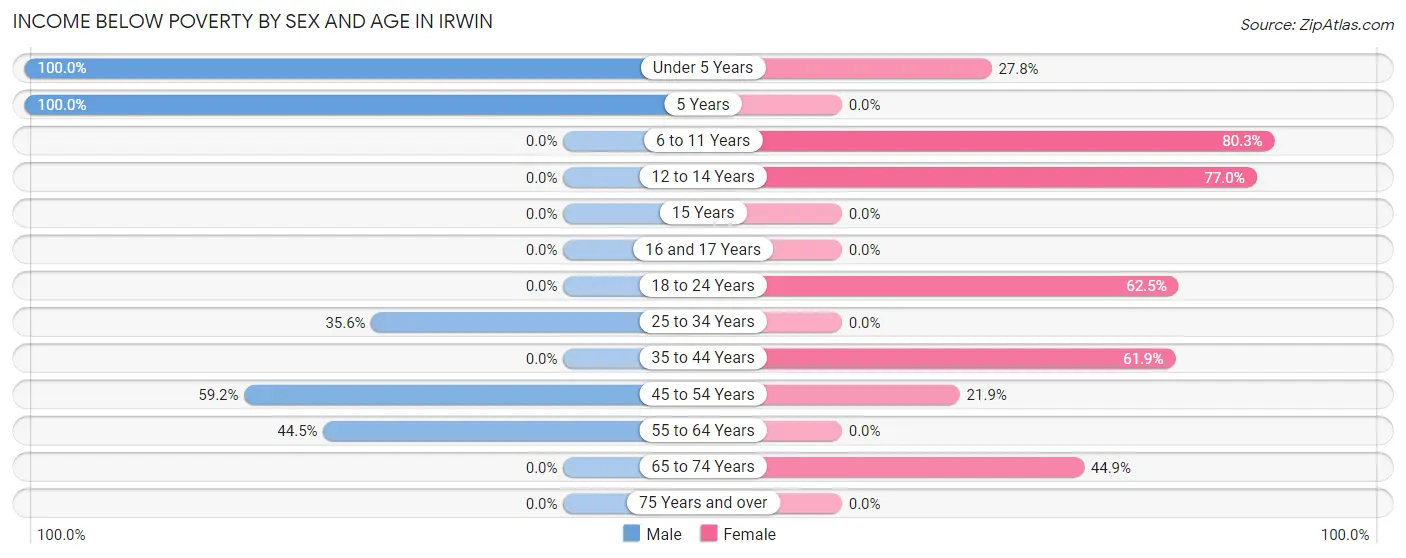
| Age Bracket | Male | Female |
| Under 5 Years | 9 (100.0%) | 15 (27.8%) |
| 5 Years | 63 (100.0%) | 0 (0.0%) |
| 6 to 11 Years | 0 (0.0%) | 53 (80.3%) |
| 12 to 14 Years | 0 (0.0%) | 107 (77.0%) |
| 15 Years | 0 (0.0%) | 0 (0.0%) |
| 16 and 17 Years | 0 (0.0%) | 0 (0.0%) |
| 18 to 24 Years | 0 (0.0%) | 60 (62.5%) |
| 25 to 34 Years | 52 (35.6%) | 0 (0.0%) |
| 35 to 44 Years | 0 (0.0%) | 78 (61.9%) |
| 45 to 54 Years | 180 (59.2%) | 21 (21.9%) |
| 55 to 64 Years | 53 (44.5%) | 0 (0.0%) |
| 65 to 74 Years | 0 (0.0%) | 62 (44.9%) |
| 75 Years and over | 0 (0.0%) | 0 (0.0%) |
| Total | 357 (39.8%) | 396 (42.5%) |
Income Above Poverty by Sex and Age in Irwin
According to the poverty statistics in Irwin, males aged 18 to 24 years and females aged 25 to 34 years are the age groups that are most secure financially, with 100.0% of males and 100.0% of females in these age groups living above the poverty line.
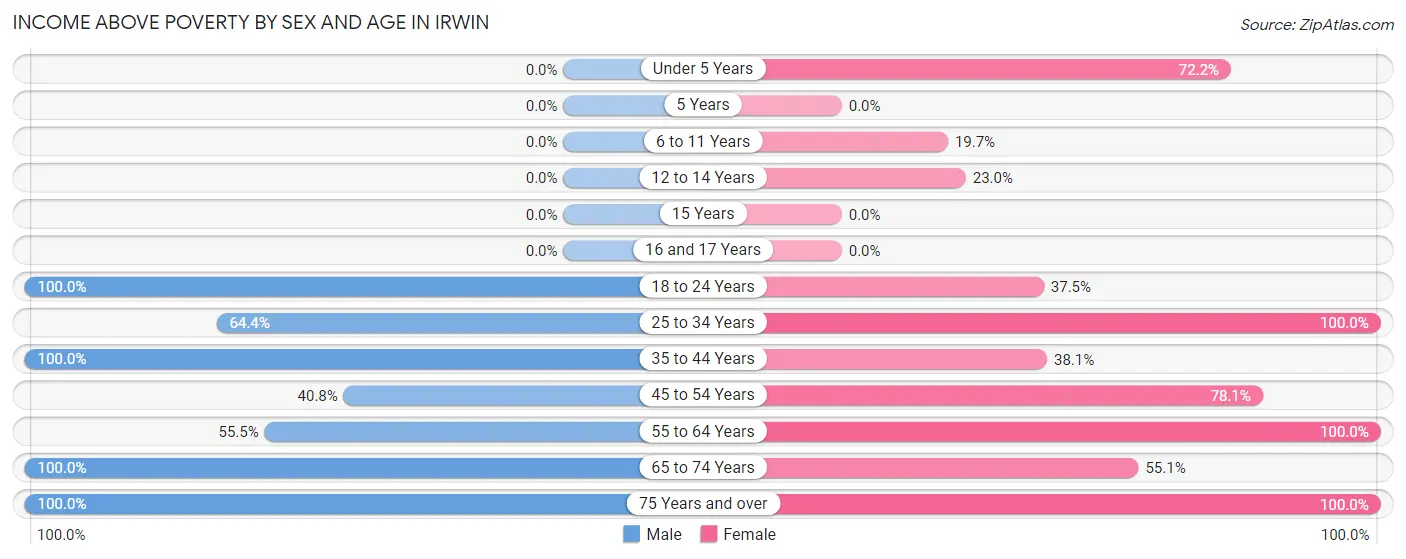
| Age Bracket | Male | Female |
| Under 5 Years | 0 (0.0%) | 39 (72.2%) |
| 5 Years | 0 (0.0%) | 0 (0.0%) |
| 6 to 11 Years | 0 (0.0%) | 13 (19.7%) |
| 12 to 14 Years | 0 (0.0%) | 32 (23.0%) |
| 15 Years | 0 (0.0%) | 0 (0.0%) |
| 16 and 17 Years | 0 (0.0%) | 0 (0.0%) |
| 18 to 24 Years | 78 (100.0%) | 36 (37.5%) |
| 25 to 34 Years | 94 (64.4%) | 19 (100.0%) |
| 35 to 44 Years | 80 (100.0%) | 48 (38.1%) |
| 45 to 54 Years | 124 (40.8%) | 75 (78.1%) |
| 55 to 64 Years | 66 (55.5%) | 98 (100.0%) |
| 65 to 74 Years | 54 (100.0%) | 76 (55.1%) |
| 75 Years and over | 45 (100.0%) | 100 (100.0%) |
| Total | 541 (60.2%) | 536 (57.5%) |
Income Below Poverty Among Married-Couple Families in Irwin
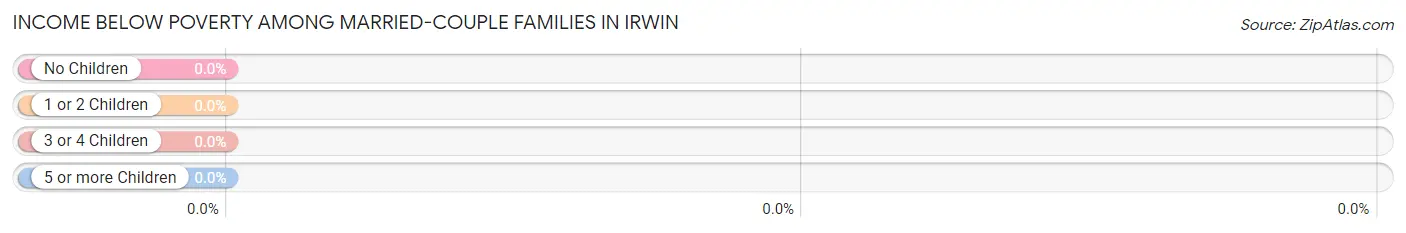
| Children | Above Poverty | Below Poverty |
| No Children | 152 (100.0%) | 0 (0.0%) |
| 1 or 2 Children | 88 (100.0%) | 0 (0.0%) |
| 3 or 4 Children | 0 (0.0%) | 0 (0.0%) |
| 5 or more Children | 0 (0.0%) | 0 (0.0%) |
| Total | 240 (100.0%) | 0 (0.0%) |
Income Below Poverty Among Single-Parent Households in Irwin
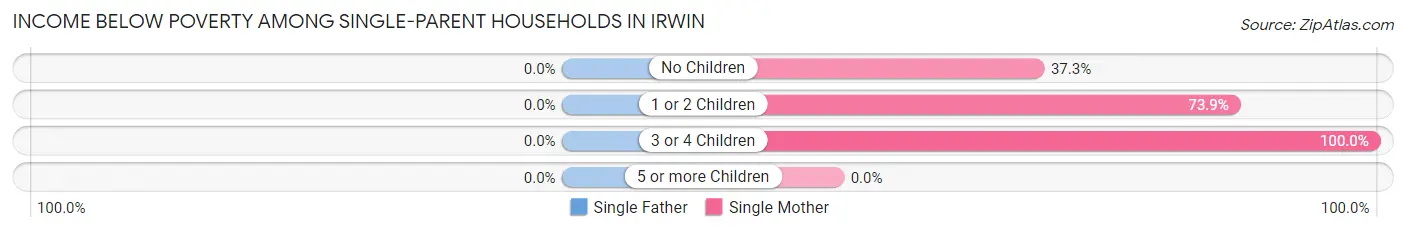
| Children | Single Father | Single Mother |
| No Children | 0 (0.0%) | 50 (37.3%) |
| 1 or 2 Children | 0 (0.0%) | 34 (73.9%) |
| 3 or 4 Children | 0 (0.0%) | 65 (100.0%) |
| 5 or more Children | 0 (0.0%) | 0 (0.0%) |
| Total | 0 (0.0%) | 149 (60.8%) |
Income Below Poverty Among Married-Couple vs Single-Parent Households in Irwin
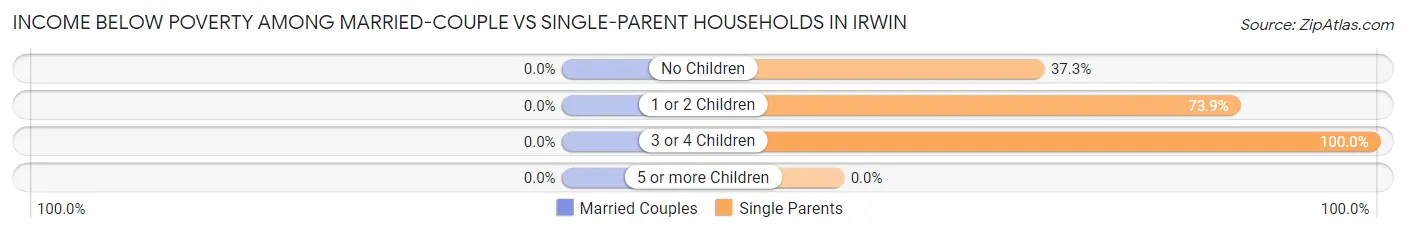
| Children | Married-Couple Families | Single-Parent Households |
| No Children | 0 (0.0%) | 50 (37.3%) |
| 1 or 2 Children | 0 (0.0%) | 34 (73.9%) |
| 3 or 4 Children | 0 (0.0%) | 65 (100.0%) |
| 5 or more Children | 0 (0.0%) | 0 (0.0%) |
| Total | 0 (0.0%) | 149 (60.8%) |
Race in Irwin
The most populous races in Irwin are White / Caucasian (1,170 | 62.6%), Black / African American (538 | 28.8%), and Two or more Races (147 | 7.9%).
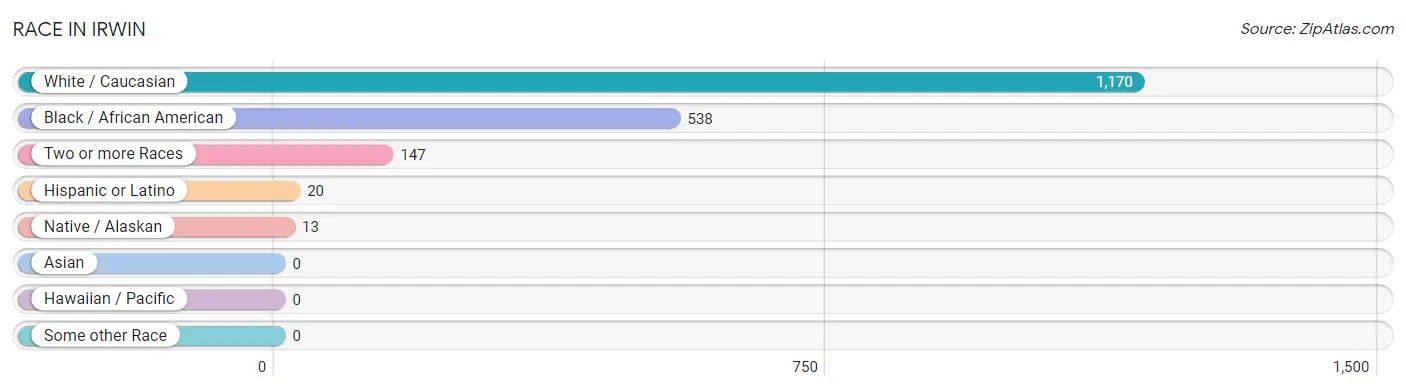
| Race | # Population | % Population |
| Asian | 0 | 0.0% |
| Black / African American | 538 | 28.8% |
| Hawaiian / Pacific | 0 | 0.0% |
| Hispanic or Latino | 20 | 1.1% |
| Native / Alaskan | 13 | 0.7% |
| White / Caucasian | 1,170 | 62.6% |
| Two or more Races | 147 | 7.9% |
| Some other Race | 0 | 0.0% |
| Total | 1,868 | 100.0% |
Ancestry in Irwin
The most populous ancestries reported in Irwin are English (234 | 12.5%), German (199 | 10.6%), American (178 | 9.5%), Irish (105 | 5.6%), and French (58 | 3.1%), together accounting for 41.4% of all Irwin residents.
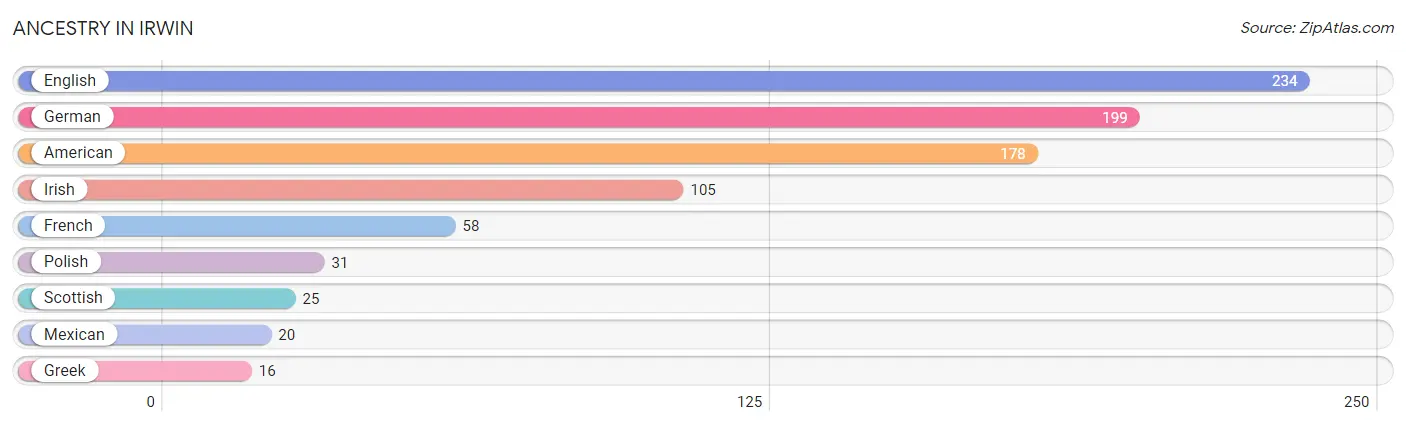
| Ancestry | # Population | % Population |
| American | 178 | 9.5% |
| English | 234 | 12.5% |
| French | 58 | 3.1% |
| German | 199 | 10.6% |
| Greek | 16 | 0.9% |
| Irish | 105 | 5.6% |
| Mexican | 20 | 1.1% |
| Polish | 31 | 1.7% |
| Scottish | 25 | 1.3% | View All 9 Rows |
Immigrants in Irwin
The most numerous immigrant groups reported in Irwin came from Central America (20 | 1.1%), Latin America (20 | 1.1%), and Mexico (20 | 1.1%), together accounting for 3.2% of all Irwin residents.
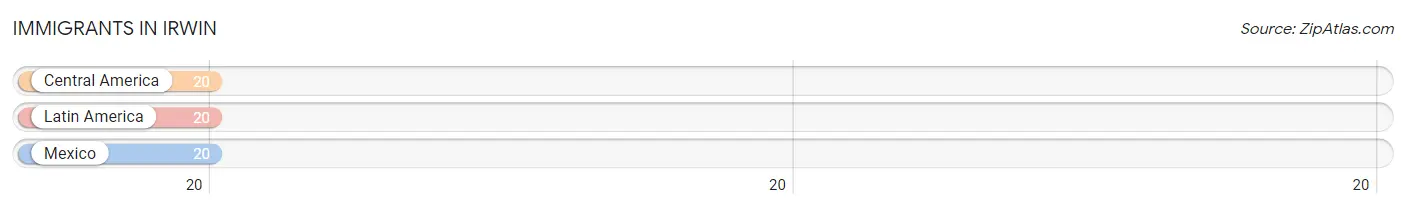
| Immigration Origin | # Population | % Population |
| Central America | 20 | 1.1% |
| Latin America | 20 | 1.1% |
| Mexico | 20 | 1.1% | View All 3 Rows |
Sex and Age in Irwin
Sex and Age in Irwin
The most populous age groups in Irwin are 45 to 49 Years (211 | 22.5%) for men and 10 to 14 Years (139 | 14.9%) for women.
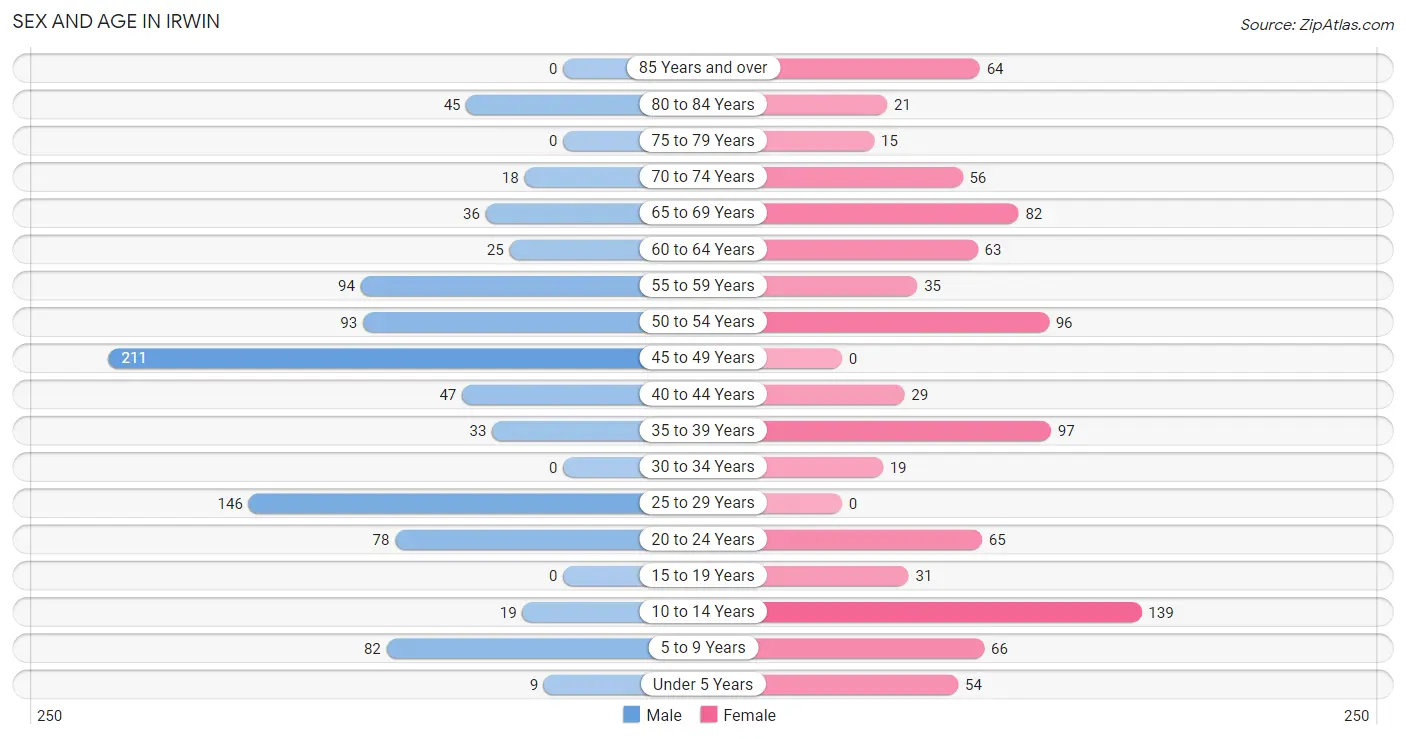
| Age Bracket | Male | Female |
| Under 5 Years | 9 (1.0%) | 54 (5.8%) |
| 5 to 9 Years | 82 (8.8%) | 66 (7.1%) |
| 10 to 14 Years | 19 (2.0%) | 139 (14.9%) |
| 15 to 19 Years | 0 (0.0%) | 31 (3.3%) |
| 20 to 24 Years | 78 (8.3%) | 65 (7.0%) |
| 25 to 29 Years | 146 (15.6%) | 0 (0.0%) |
| 30 to 34 Years | 0 (0.0%) | 19 (2.0%) |
| 35 to 39 Years | 33 (3.5%) | 97 (10.4%) |
| 40 to 44 Years | 47 (5.0%) | 29 (3.1%) |
| 45 to 49 Years | 211 (22.5%) | 0 (0.0%) |
| 50 to 54 Years | 93 (9.9%) | 96 (10.3%) |
| 55 to 59 Years | 94 (10.0%) | 35 (3.8%) |
| 60 to 64 Years | 25 (2.7%) | 63 (6.8%) |
| 65 to 69 Years | 36 (3.8%) | 82 (8.8%) |
| 70 to 74 Years | 18 (1.9%) | 56 (6.0%) |
| 75 to 79 Years | 0 (0.0%) | 15 (1.6%) |
| 80 to 84 Years | 45 (4.8%) | 21 (2.2%) |
| 85 Years and over | 0 (0.0%) | 64 (6.9%) |
| Total | 936 (100.0%) | 932 (100.0%) |
Families and Households in Irwin
Median Family Size in Irwin
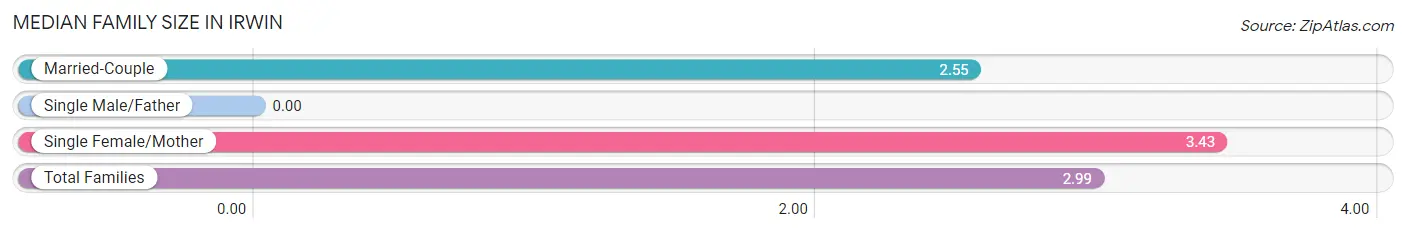
| Family Type | # Families | Family Size |
| Married-Couple | 240 (49.5%) | 2.55 |
| Single Male/Father | 0 (0.0%) | - |
| Single Female/Mother | 245 (50.5%) | 3.43 |
| Total Families | 485 (100.0%) | 2.99 |
Median Household Size in Irwin
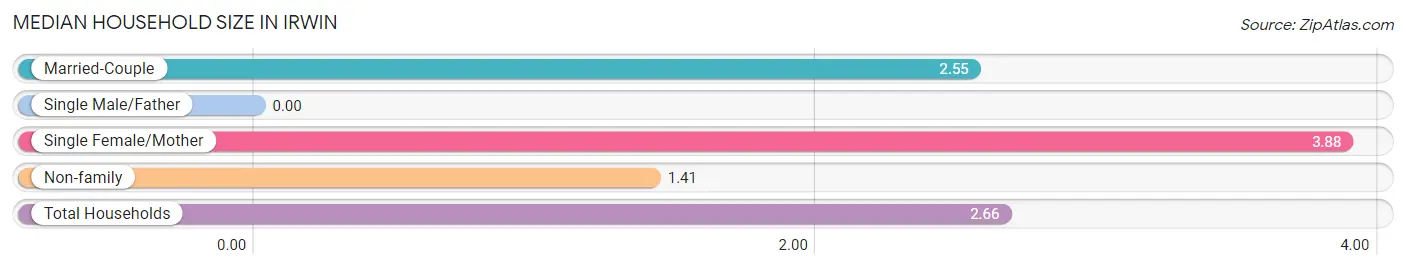
| Household Type | # Households | Household Size |
| Married-Couple | 240 (34.2%) | 2.55 |
| Single Male/Father | 0 (0.0%) | - |
| Single Female/Mother | 245 (34.9%) | 3.88 |
| Non-family | 217 (30.9%) | 1.41 |
| Total Households | 702 (100.0%) | 2.66 |
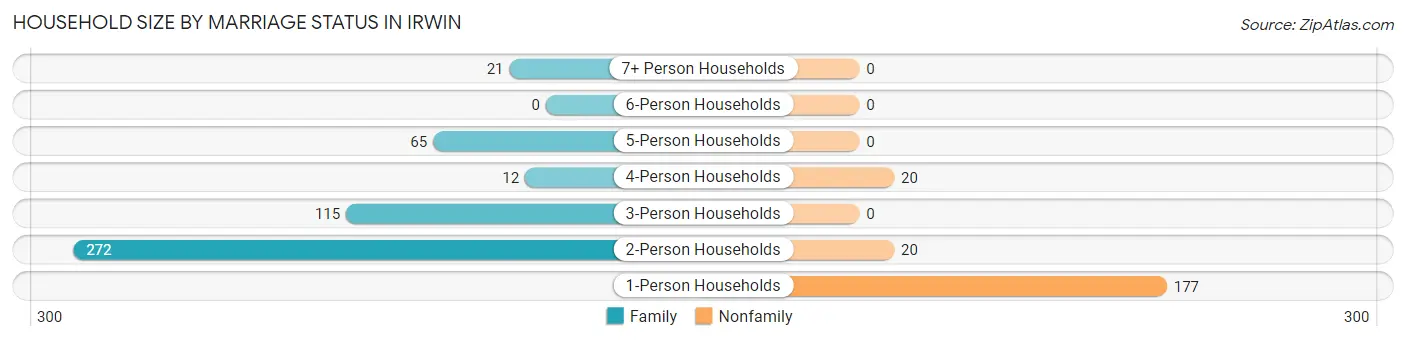
Household Size by Marriage Status in Irwin
Out of a total of 702 households in Irwin, 485 (69.1%) are family households, while 217 (30.9%) are nonfamily households. The most numerous type of family households are 2-person households, comprising 272, and the most common type of nonfamily households are 1-person households, comprising 177.
| Household Size | Family Households | Nonfamily Households |
| 1-Person Households | - | 177 (25.2%) |
| 2-Person Households | 272 (38.8%) | 20 (2.9%) |
| 3-Person Households | 115 (16.4%) | 0 (0.0%) |
| 4-Person Households | 12 (1.7%) | 20 (2.9%) |
| 5-Person Households | 65 (9.3%) | 0 (0.0%) |
| 6-Person Households | 0 (0.0%) | 0 (0.0%) |
| 7+ Person Households | 21 (3.0%) | 0 (0.0%) |
| Total | 485 (69.1%) | 217 (30.9%) |
Female Fertility in Irwin
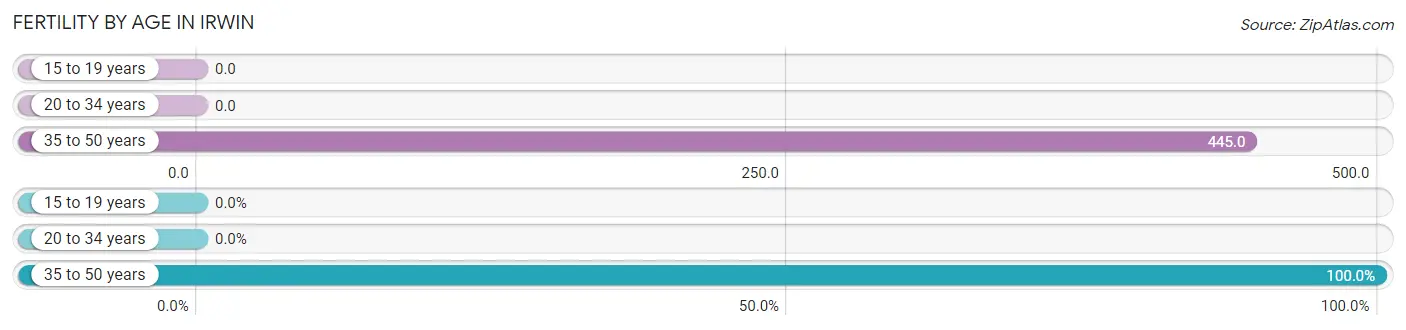
Fertility by Age in Irwin
Average fertility rate in Irwin is 249.0 births per 1,000 women. Women in the age bracket of 35 to 50 years have the highest fertility rate with 445.0 births per 1,000 women. Women in the age bracket of 35 to 50 years acount for 100.0% of all women with births.
| Age Bracket | Women with Births | Births / 1,000 Women |
| 15 to 19 years | 0 (0.0%) | 0.0 |
| 20 to 34 years | 0 (0.0%) | 0.0 |
| 35 to 50 years | 65 (100.0%) | 445.0 |
| Total | 65 (100.0%) | 249.0 |
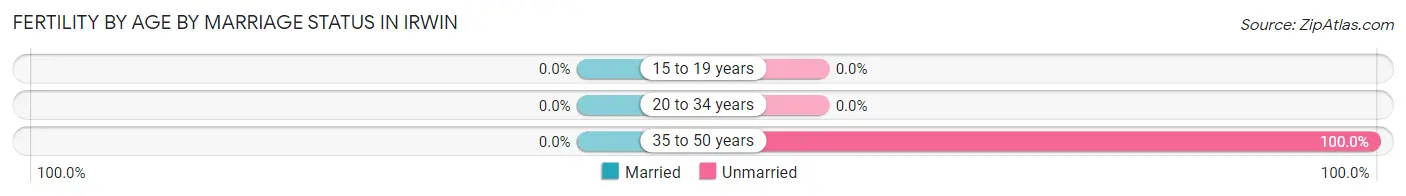
Fertility by Age by Marriage Status in Irwin
| Age Bracket | Married | Unmarried |
| 15 to 19 years | 0 (0.0%) | 0 (0.0%) |
| 20 to 34 years | 0 (0.0%) | 0 (0.0%) |
| 35 to 50 years | 0 (0.0%) | 65 (100.0%) |
| Total | 0 (0.0%) | 65 (100.0%) |
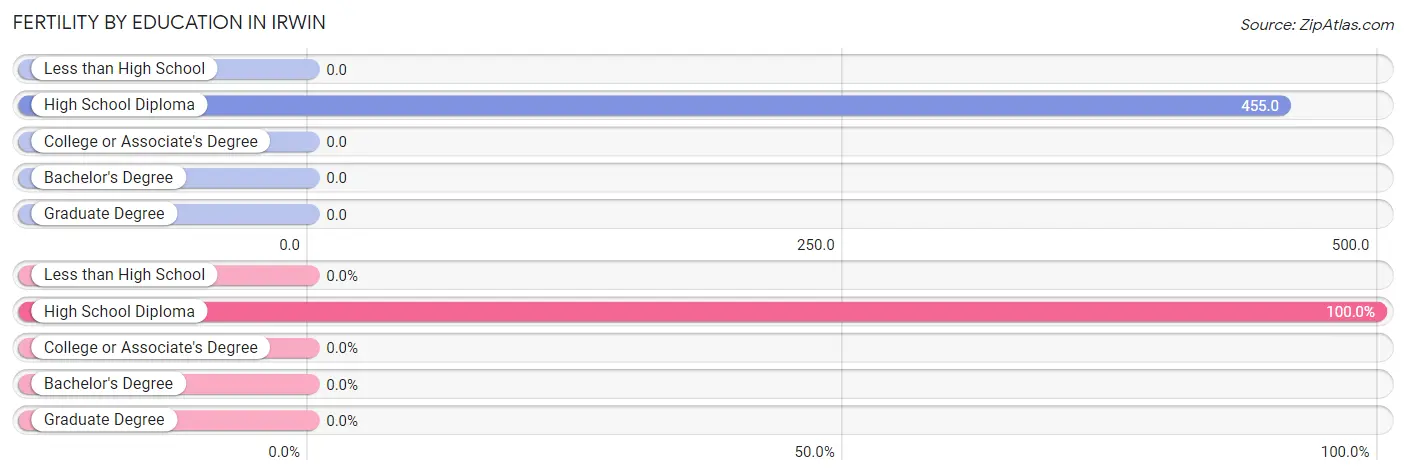
Fertility by Education in Irwin
| Educational Attainment | Women with Births | Births / 1,000 Women |
| Less than High School | 0 (0.0%) | 0.0 |
| High School Diploma | 65 (100.0%) | 455.0 |
| College or Associate's Degree | 0 (0.0%) | 0.0 |
| Bachelor's Degree | 0 (0.0%) | 0.0 |
| Graduate Degree | 0 (0.0%) | 0.0 |
| Total | 65 (100.0%) | 249.0 |
Fertility by Education by Marriage Status in Irwin
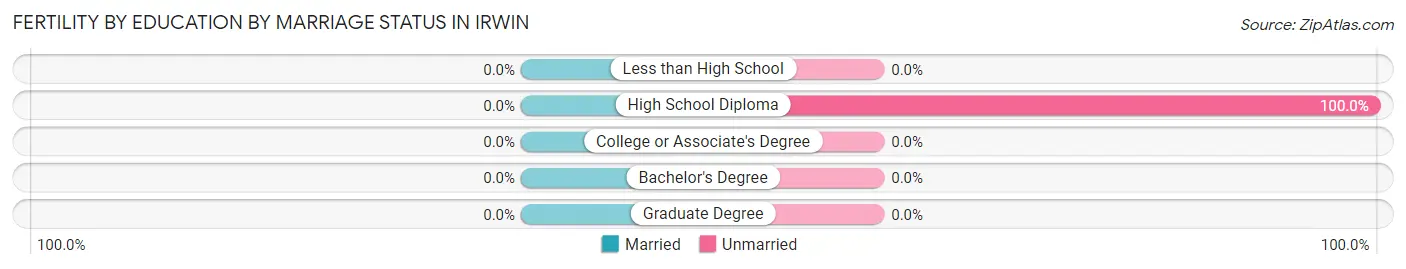
| Educational Attainment | Married | Unmarried |
| Less than High School | 0 (0.0%) | 0 (0.0%) |
| High School Diploma | 0 (0.0%) | 65 (100.0%) |
| College or Associate's Degree | 0 (0.0%) | 0 (0.0%) |
| Bachelor's Degree | 0 (0.0%) | 0 (0.0%) |
| Graduate Degree | 0 (0.0%) | 0 (0.0%) |
| Total | 0 (0.0%) | 65 (100.0%) |
Employment Characteristics in Irwin
Employment by Class of Employer in Irwin
Among the 729 employed individuals in Irwin, private company employees (601 | 82.4%), not-for-profit organizations (76 | 10.4%), and self-employed (not incorporated) (33 | 4.5%) make up the most common classes of employment.
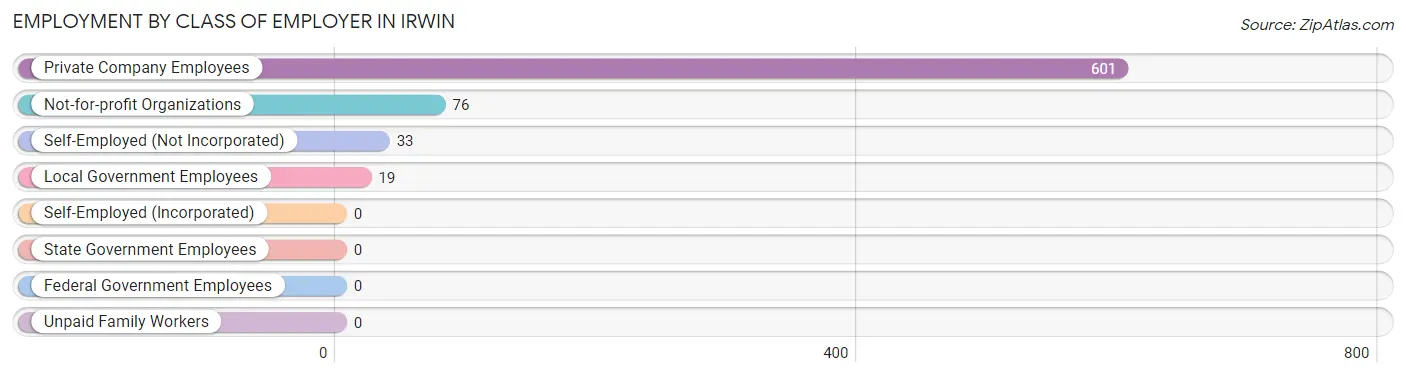
| Employer Class | # Employees | % Employees |
| Private Company Employees | 601 | 82.4% |
| Self-Employed (Incorporated) | 0 | 0.0% |
| Self-Employed (Not Incorporated) | 33 | 4.5% |
| Not-for-profit Organizations | 76 | 10.4% |
| Local Government Employees | 19 | 2.6% |
| State Government Employees | 0 | 0.0% |
| Federal Government Employees | 0 | 0.0% |
| Unpaid Family Workers | 0 | 0.0% |
| Total | 729 | 100.0% |
Employment Status by Age in Irwin
According to the labor force statistics for Irwin, out of the total population over 16 years of age (1,499), 57.0% or 854 individuals are in the labor force, with 11.6% or 99 of them unemployed. The age group with the highest labor force participation rate is 20 to 24 years, with 100.0% or 143 individuals in the labor force. Within the labor force, the 55 to 59 years age range has the highest percentage of unemployed individuals, with 51.4% or 18 of them being unemployed.
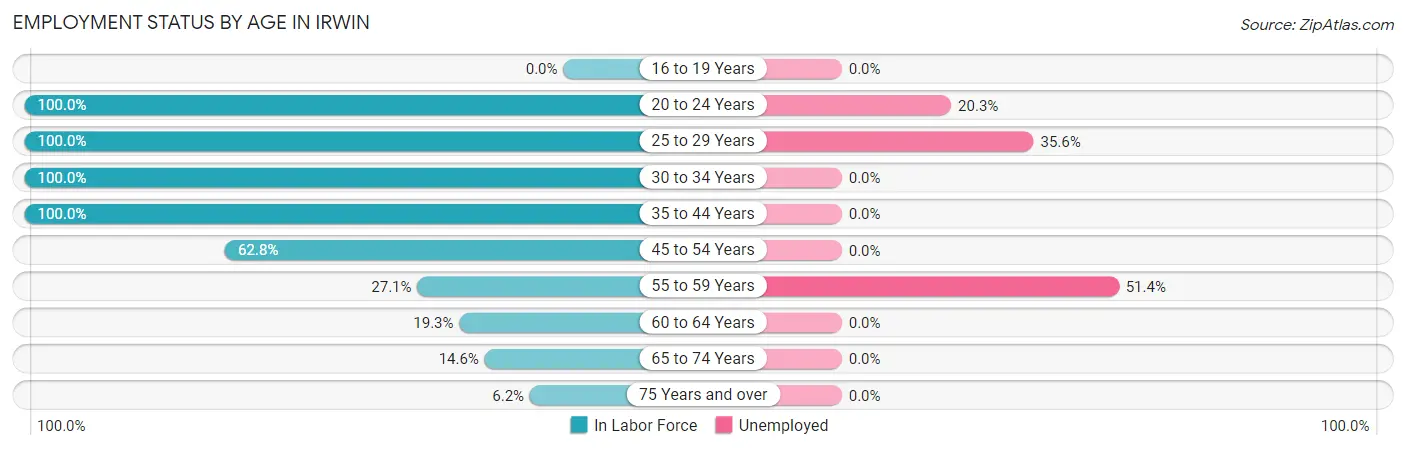
| Age Bracket | In Labor Force | Unemployed |
| 16 to 19 Years | 0 (0.0%) | 0 (0.0%) |
| 20 to 24 Years | 143 (100.0%) | 29 (20.3%) |
| 25 to 29 Years | 146 (100.0%) | 52 (35.6%) |
| 30 to 34 Years | 19 (100.0%) | 0 (0.0%) |
| 35 to 44 Years | 206 (100.0%) | 0 (0.0%) |
| 45 to 54 Years | 251 (62.8%) | 0 (0.0%) |
| 55 to 59 Years | 35 (27.1%) | 18 (51.4%) |
| 60 to 64 Years | 17 (19.3%) | 0 (0.0%) |
| 65 to 74 Years | 28 (14.6%) | 0 (0.0%) |
| 75 Years and over | 9 (6.2%) | 0 (0.0%) |
| Total | 854 (57.0%) | 99 (11.6%) |
Employment Status by Educational Attainment in Irwin
According to labor force statistics for Irwin, 68.2% of individuals (674) out of the total population between 25 and 64 years of age (988) are in the labor force, with 10.4% or 70 of them being unemployed. The group with the highest labor force participation rate are those with the educational attainment of bachelor's degree or higher, with 100.0% or 37 individuals in the labor force. Within the labor force, individuals with bachelor's degree or higher education have the highest percentage of unemployment, with 48.6% or 18 of them being unemployed.
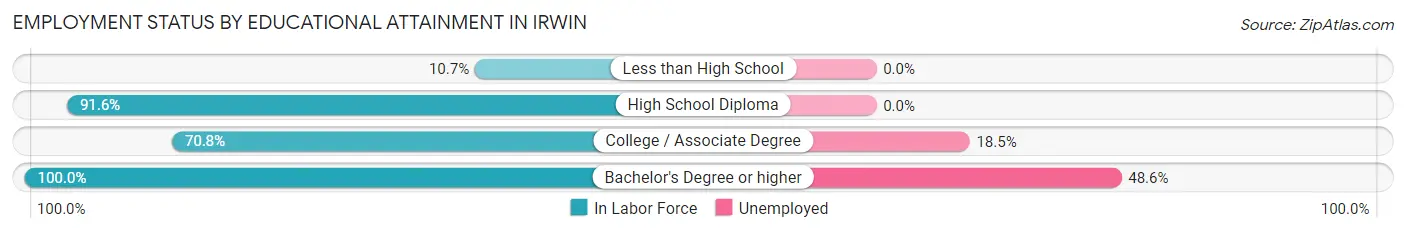
| Educational Attainment | In Labor Force | Unemployed |
| Less than High School | 20 (10.7%) | 0 (0.0%) |
| High School Diploma | 336 (91.6%) | 0 (0.0%) |
| College / Associate Degree | 281 (70.8%) | 73 (18.5%) |
| Bachelor's Degree or higher | 37 (100.0%) | 18 (48.6%) |
| Total | 674 (68.2%) | 103 (10.4%) |
Employment Occupations by Sex in Irwin
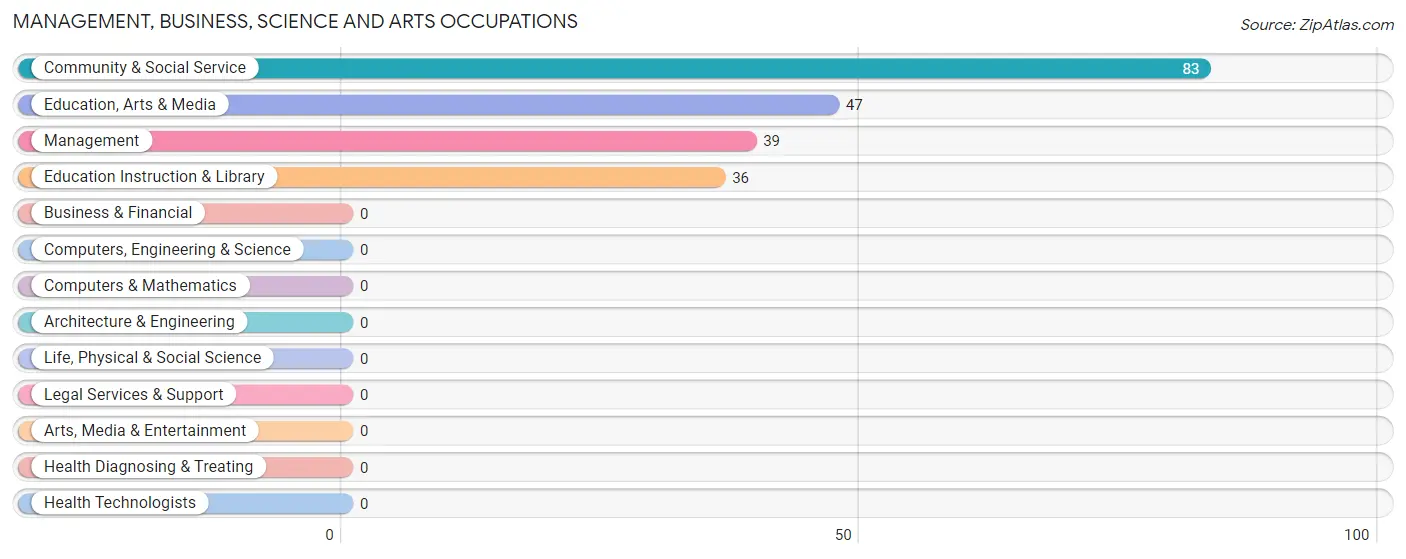
Management, Business, Science and Arts Occupations
The most common Management, Business, Science and Arts occupations in Irwin are Community & Social Service (83 | 11.0%), Education, Arts & Media (47 | 6.2%), Management (39 | 5.2%), and Education Instruction & Library (36 | 4.8%).
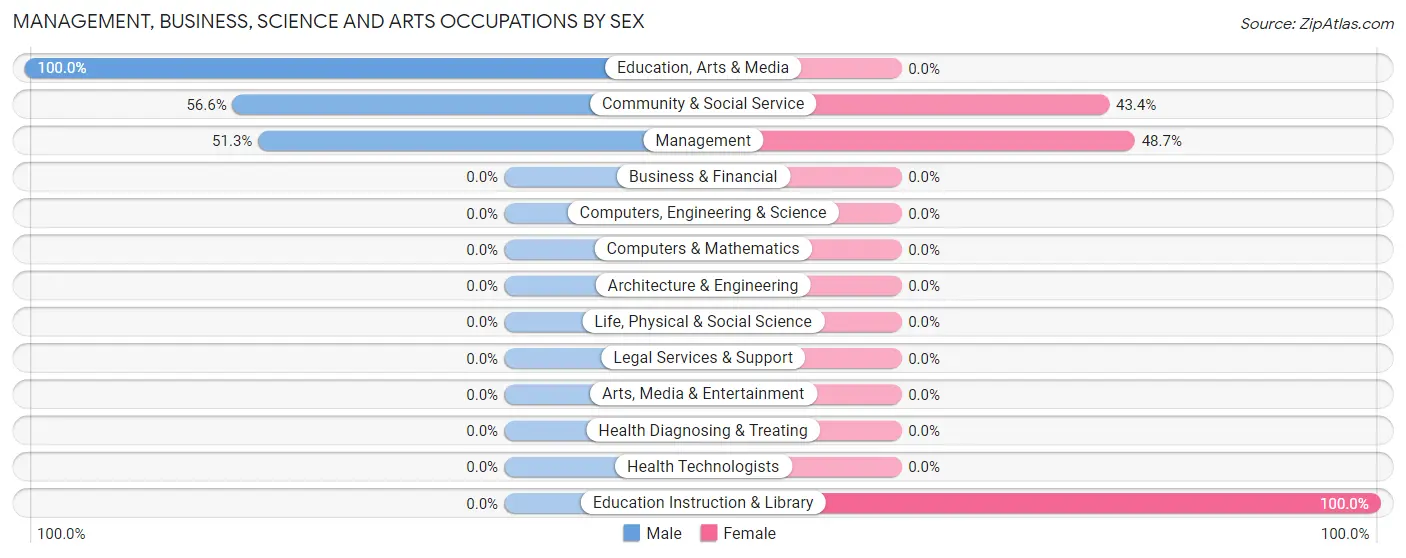
Management, Business, Science and Arts Occupations by Sex
Within the Management, Business, Science and Arts occupations in Irwin, the most male-oriented occupations are Education, Arts & Media (100.0%), Community & Social Service (56.6%), and Management (51.3%), while the most female-oriented occupations are Education Instruction & Library (100.0%), Management (48.7%), and Community & Social Service (43.4%).
| Occupation | Male | Female |
| Management | 20 (51.3%) | 19 (48.7%) |
| Business & Financial | 0 (0.0%) | 0 (0.0%) |
| Computers, Engineering & Science | 0 (0.0%) | 0 (0.0%) |
| Computers & Mathematics | 0 (0.0%) | 0 (0.0%) |
| Architecture & Engineering | 0 (0.0%) | 0 (0.0%) |
| Life, Physical & Social Science | 0 (0.0%) | 0 (0.0%) |
| Community & Social Service | 47 (56.6%) | 36 (43.4%) |
| Education, Arts & Media | 47 (100.0%) | 0 (0.0%) |
| Legal Services & Support | 0 (0.0%) | 0 (0.0%) |
| Education Instruction & Library | 0 (0.0%) | 36 (100.0%) |
| Arts, Media & Entertainment | 0 (0.0%) | 0 (0.0%) |
| Health Diagnosing & Treating | 0 (0.0%) | 0 (0.0%) |
| Health Technologists | 0 (0.0%) | 0 (0.0%) |
| Total (Category) | 67 (54.9%) | 55 (45.1%) |
| Total (Overall) | 465 (61.6%) | 290 (38.4%) |
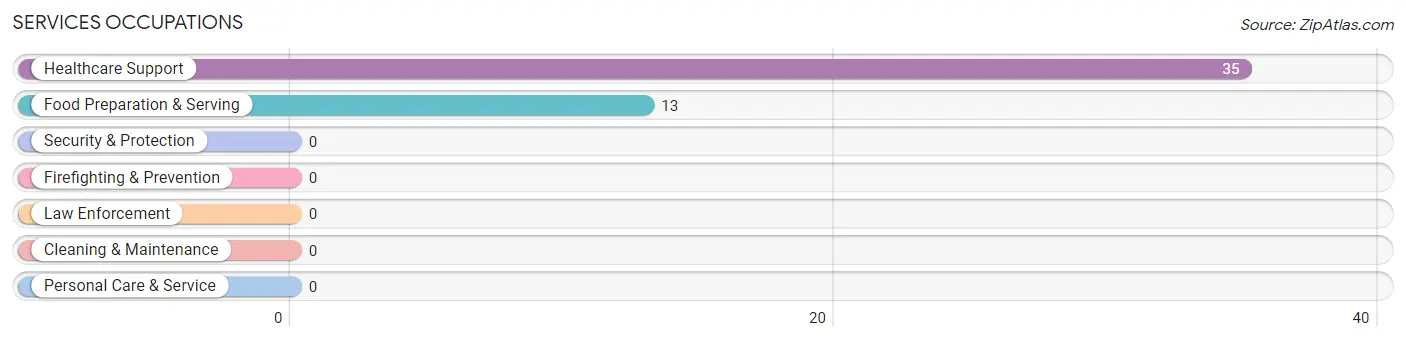
Services Occupations
The most common Services occupations in Irwin are Healthcare Support (35 | 4.6%), and Food Preparation & Serving (13 | 1.7%).
Services Occupations by Sex
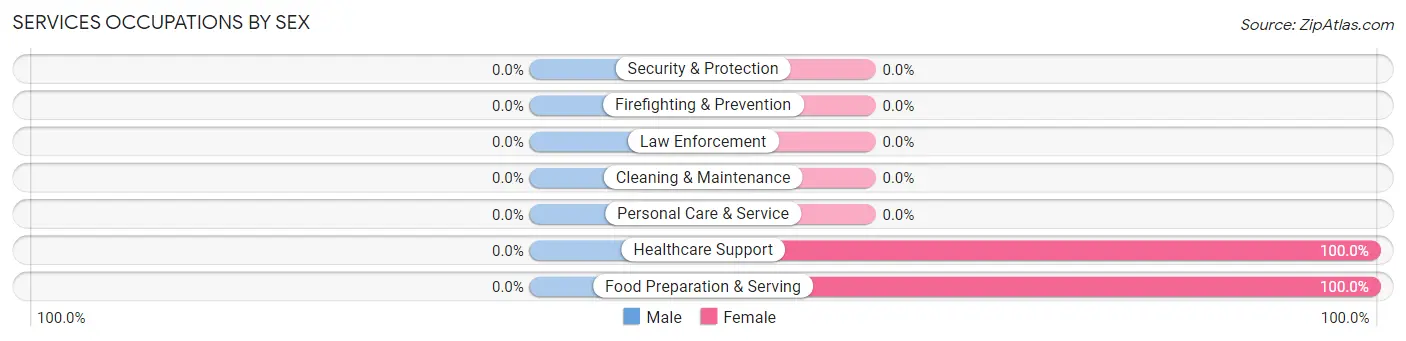
| Occupation | Male | Female |
| Healthcare Support | 0 (0.0%) | 35 (100.0%) |
| Security & Protection | 0 (0.0%) | 0 (0.0%) |
| Firefighting & Prevention | 0 (0.0%) | 0 (0.0%) |
| Law Enforcement | 0 (0.0%) | 0 (0.0%) |
| Food Preparation & Serving | 0 (0.0%) | 13 (100.0%) |
| Cleaning & Maintenance | 0 (0.0%) | 0 (0.0%) |
| Personal Care & Service | 0 (0.0%) | 0 (0.0%) |
| Total (Category) | 0 (0.0%) | 48 (100.0%) |
| Total (Overall) | 465 (61.6%) | 290 (38.4%) |
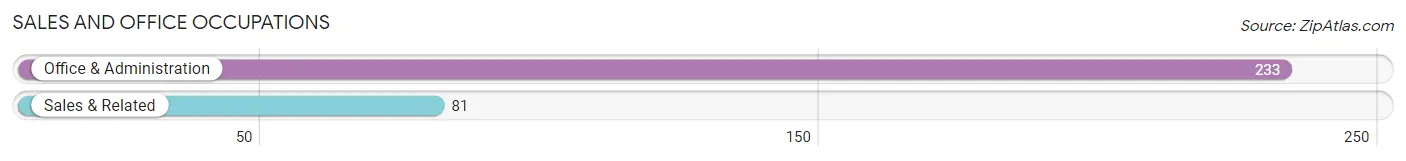
Sales and Office Occupations
The most common Sales and Office occupations in Irwin are Office & Administration (233 | 30.9%), and Sales & Related (81 | 10.7%).
Sales and Office Occupations by Sex
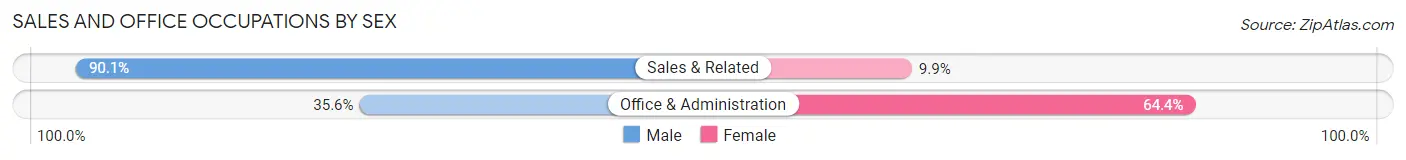
| Occupation | Male | Female |
| Sales & Related | 73 (90.1%) | 8 (9.9%) |
| Office & Administration | 83 (35.6%) | 150 (64.4%) |
| Total (Category) | 156 (49.7%) | 158 (50.3%) |
| Total (Overall) | 465 (61.6%) | 290 (38.4%) |
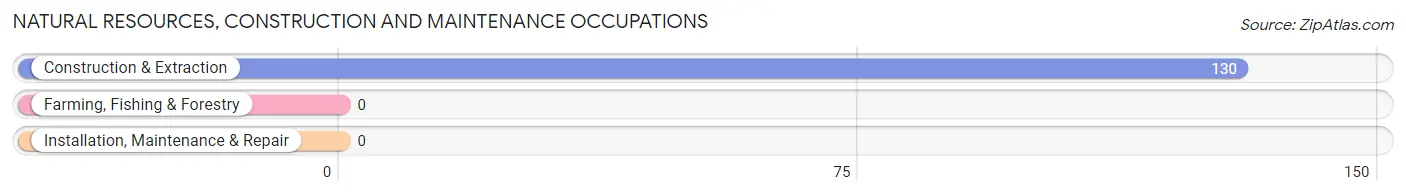
Natural Resources, Construction and Maintenance Occupations
The most common Natural Resources, Construction and Maintenance occupations in Irwin are , and Construction & Extraction (130 | 17.2%).
Natural Resources, Construction and Maintenance Occupations by Sex
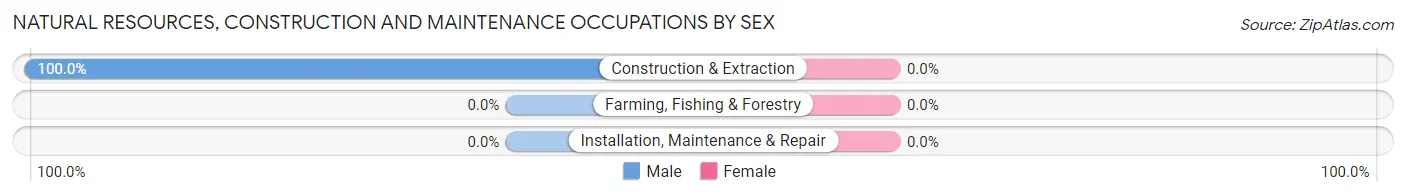
| Occupation | Male | Female |
| Farming, Fishing & Forestry | 0 (0.0%) | 0 (0.0%) |
| Construction & Extraction | 130 (100.0%) | 0 (0.0%) |
| Installation, Maintenance & Repair | 0 (0.0%) | 0 (0.0%) |
| Total (Category) | 130 (100.0%) | 0 (0.0%) |
| Total (Overall) | 465 (61.6%) | 290 (38.4%) |
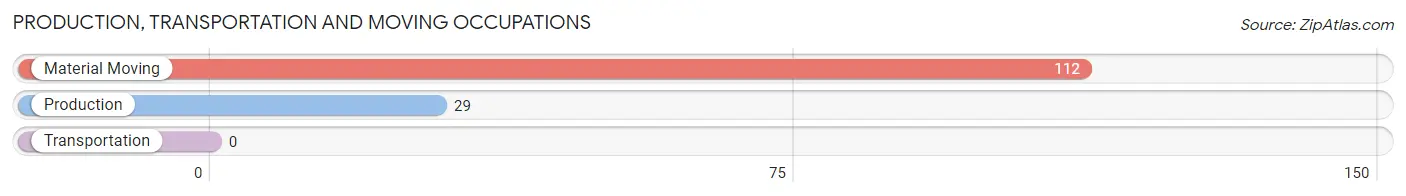
Production, Transportation and Moving Occupations
The most common Production, Transportation and Moving occupations in Irwin are Material Moving (112 | 14.8%), and Production (29 | 3.8%).
Production, Transportation and Moving Occupations by Sex
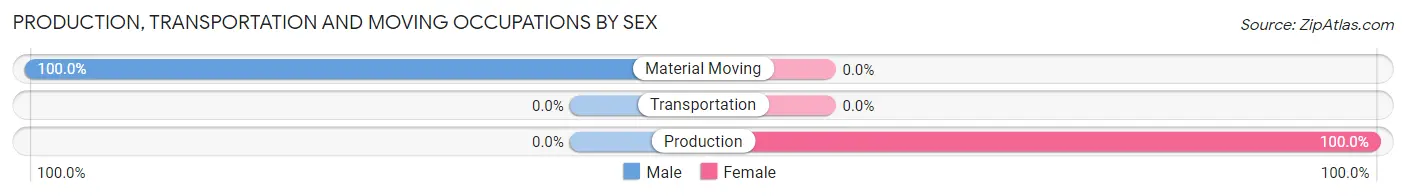
| Occupation | Male | Female |
| Production | 0 (0.0%) | 29 (100.0%) |
| Transportation | 0 (0.0%) | 0 (0.0%) |
| Material Moving | 112 (100.0%) | 0 (0.0%) |
| Total (Category) | 112 (79.4%) | 29 (20.6%) |
| Total (Overall) | 465 (61.6%) | 290 (38.4%) |
Employment Industries by Sex in Irwin
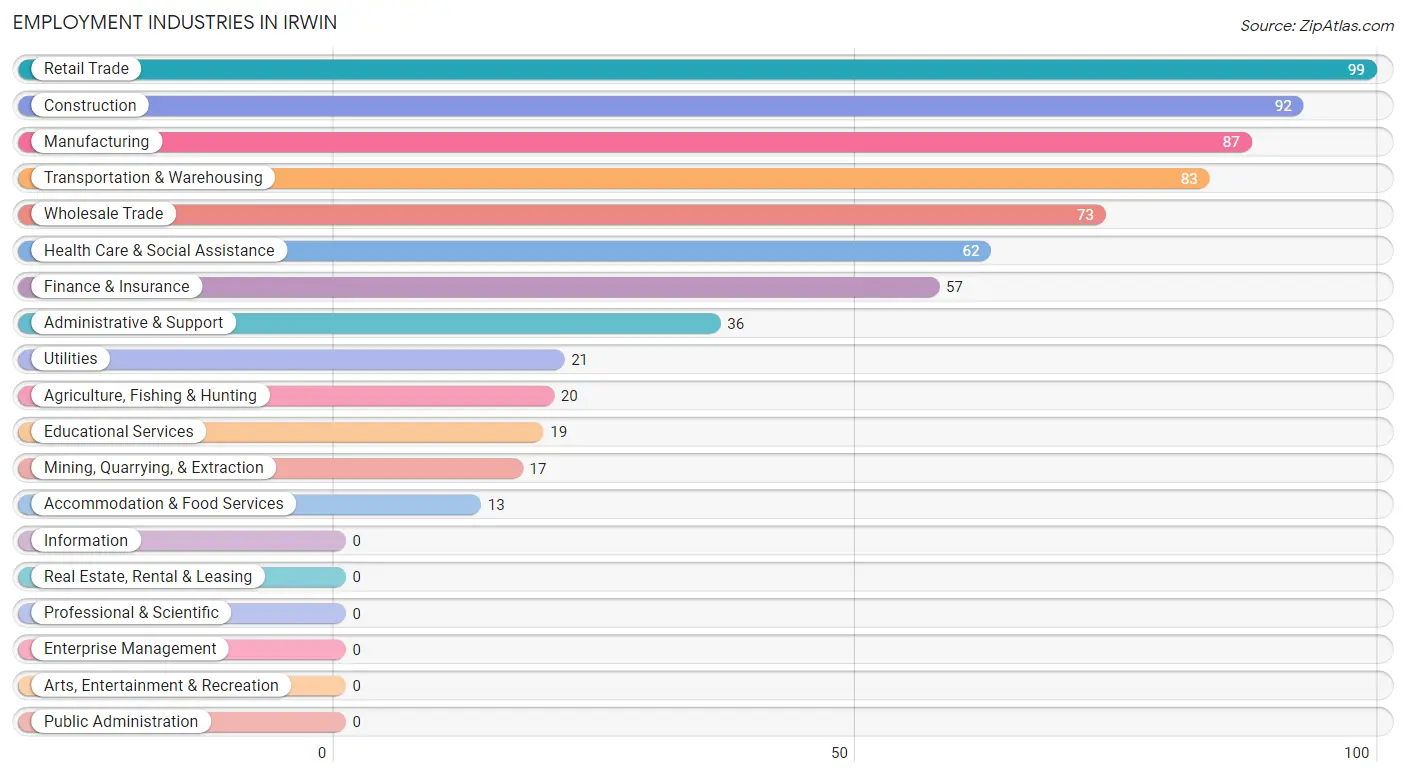
Employment Industries in Irwin
The major employment industries in Irwin include Retail Trade (99 | 13.1%), Construction (92 | 12.2%), Manufacturing (87 | 11.5%), Transportation & Warehousing (83 | 11.0%), and Wholesale Trade (73 | 9.7%).
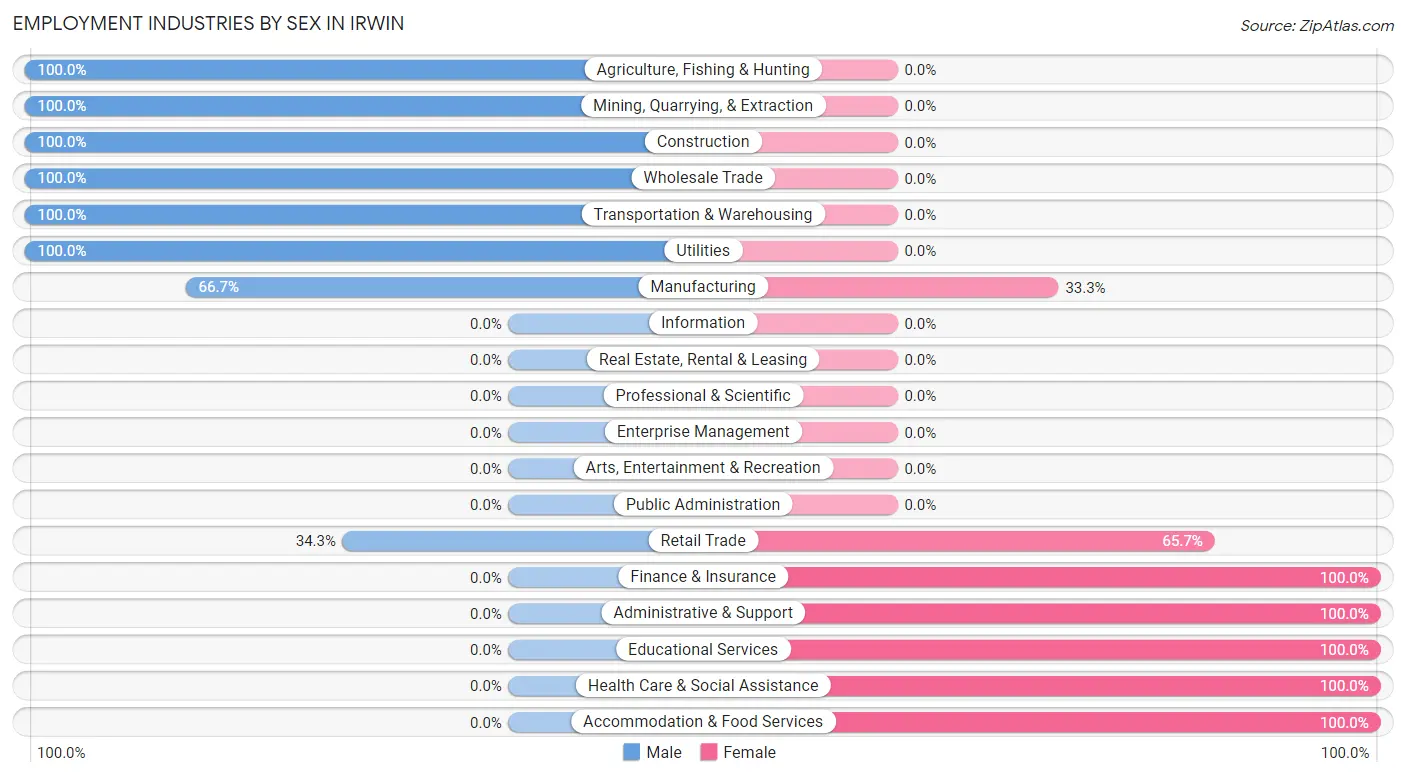
Employment Industries by Sex in Irwin
The Irwin industries that see more men than women are Agriculture, Fishing & Hunting (100.0%), Mining, Quarrying, & Extraction (100.0%), and Construction (100.0%), whereas the industries that tend to have a higher number of women are Finance & Insurance (100.0%), Administrative & Support (100.0%), and Educational Services (100.0%).
| Industry | Male | Female |
| Agriculture, Fishing & Hunting | 20 (100.0%) | 0 (0.0%) |
| Mining, Quarrying, & Extraction | 17 (100.0%) | 0 (0.0%) |
| Construction | 92 (100.0%) | 0 (0.0%) |
| Manufacturing | 58 (66.7%) | 29 (33.3%) |
| Wholesale Trade | 73 (100.0%) | 0 (0.0%) |
| Retail Trade | 34 (34.3%) | 65 (65.7%) |
| Transportation & Warehousing | 83 (100.0%) | 0 (0.0%) |
| Utilities | 21 (100.0%) | 0 (0.0%) |
| Information | 0 (0.0%) | 0 (0.0%) |
| Finance & Insurance | 0 (0.0%) | 57 (100.0%) |
| Real Estate, Rental & Leasing | 0 (0.0%) | 0 (0.0%) |
| Professional & Scientific | 0 (0.0%) | 0 (0.0%) |
| Enterprise Management | 0 (0.0%) | 0 (0.0%) |
| Administrative & Support | 0 (0.0%) | 36 (100.0%) |
| Educational Services | 0 (0.0%) | 19 (100.0%) |
| Health Care & Social Assistance | 0 (0.0%) | 62 (100.0%) |
| Arts, Entertainment & Recreation | 0 (0.0%) | 0 (0.0%) |
| Accommodation & Food Services | 0 (0.0%) | 13 (100.0%) |
| Public Administration | 0 (0.0%) | 0 (0.0%) |
| Total | 465 (61.6%) | 290 (38.4%) |
Education in Irwin
School Enrollment in Irwin
The most common levels of schooling among the 286 students in Irwin are middle school (86 | 30.1%), nursery / preschool (72 | 25.2%), and high school (72 | 25.2%).
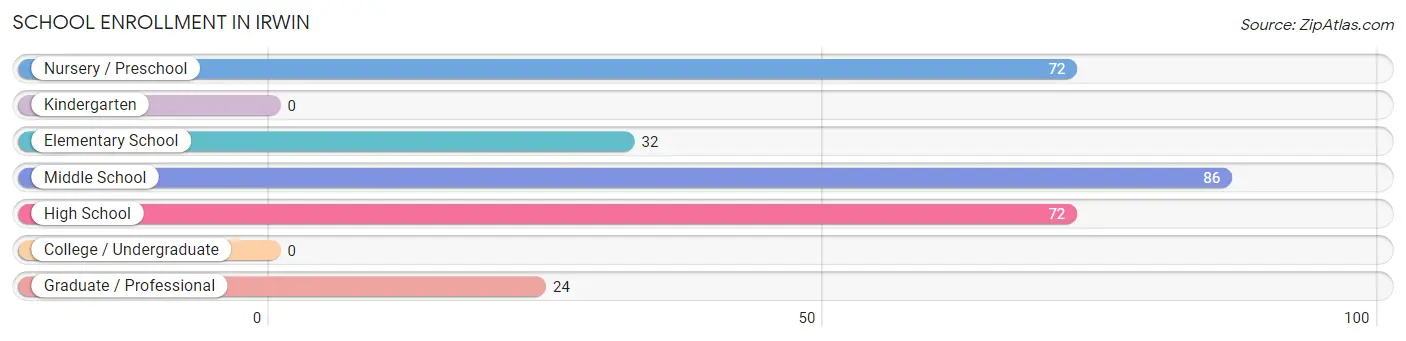
| School Level | # Students | % Students |
| Nursery / Preschool | 72 | 25.2% |
| Kindergarten | 0 | 0.0% |
| Elementary School | 32 | 11.2% |
| Middle School | 86 | 30.1% |
| High School | 72 | 25.2% |
| College / Undergraduate | 0 | 0.0% |
| Graduate / Professional | 24 | 8.4% |
| Total | 286 | 100.0% |
School Enrollment by Age by Funding Source in Irwin
Out of a total of 286 students who are enrolled in schools in Irwin, 19 (6.6%) attend a private institution, while the remaining 267 (93.4%) are enrolled in public schools. The age group of 10 to 14 year olds has the highest likelihood of being enrolled in private schools, with 19 (12.0% in the age bracket) enrolled. Conversely, the age group of 3 to 4 year olds has the lowest likelihood of being enrolled in a private school, with 9 (100.0% in the age bracket) attending a public institution.
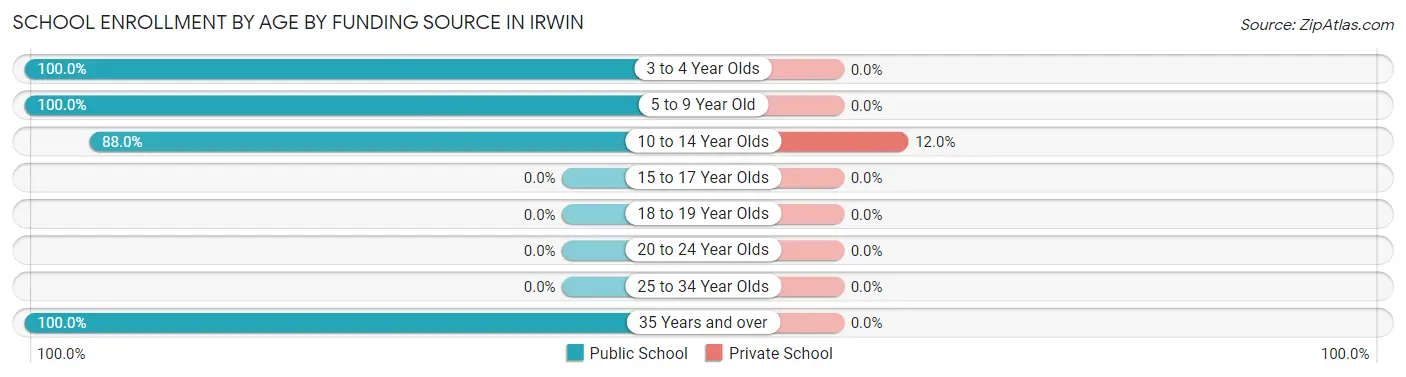
| Age Bracket | Public School | Private School |
| 3 to 4 Year Olds | 9 (100.0%) | 0 (0.0%) |
| 5 to 9 Year Old | 95 (100.0%) | 0 (0.0%) |
| 10 to 14 Year Olds | 139 (88.0%) | 19 (12.0%) |
| 15 to 17 Year Olds | 0 (0.0%) | 0 (0.0%) |
| 18 to 19 Year Olds | 0 (0.0%) | 0 (0.0%) |
| 20 to 24 Year Olds | 0 (0.0%) | 0 (0.0%) |
| 25 to 34 Year Olds | 0 (0.0%) | 0 (0.0%) |
| 35 Years and over | 24 (100.0%) | 0 (0.0%) |
| Total | 267 (93.4%) | 19 (6.6%) |
Educational Attainment by Field of Study in Irwin
Education (19 | 44.2%), engineering (18 | 41.9%), and arts & humanities (6 | 14.0%) are the most common fields of study among 43 individuals in Irwin who have obtained a bachelor's degree or higher.
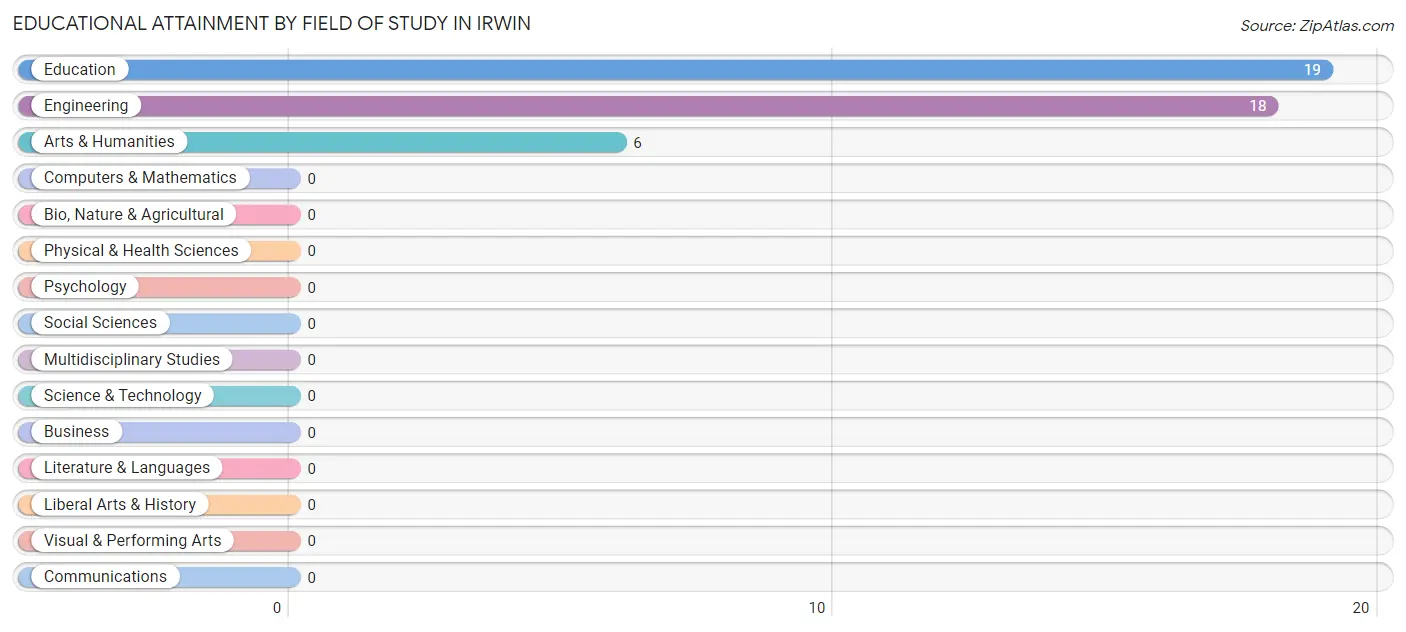
| Field of Study | # Graduates | % Graduates |
| Computers & Mathematics | 0 | 0.0% |
| Bio, Nature & Agricultural | 0 | 0.0% |
| Physical & Health Sciences | 0 | 0.0% |
| Psychology | 0 | 0.0% |
| Social Sciences | 0 | 0.0% |
| Engineering | 18 | 41.9% |
| Multidisciplinary Studies | 0 | 0.0% |
| Science & Technology | 0 | 0.0% |
| Business | 0 | 0.0% |
| Education | 19 | 44.2% |
| Literature & Languages | 0 | 0.0% |
| Liberal Arts & History | 0 | 0.0% |
| Visual & Performing Arts | 0 | 0.0% |
| Communications | 0 | 0.0% |
| Arts & Humanities | 6 | 14.0% |
| Total | 43 | 100.0% |
Transportation & Commute in Irwin
Vehicle Availability by Sex in Irwin
The most prevalent vehicle ownership categories in Irwin are males with 2 vehicles (203, accounting for 43.7%) and females with 2 vehicles (88, making up 76.9%).
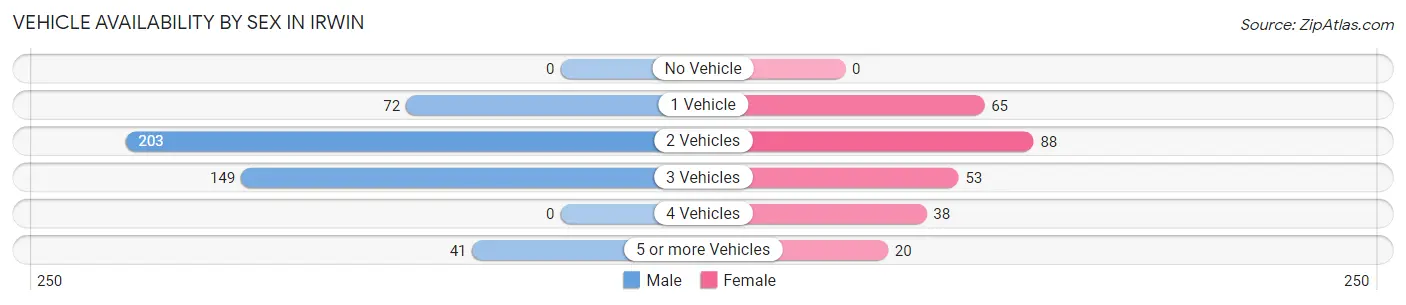
| Vehicles Available | Male | Female |
| No Vehicle | 0 (0.0%) | 0 (0.0%) |
| 1 Vehicle | 72 (15.5%) | 65 (24.6%) |
| 2 Vehicles | 203 (43.7%) | 88 (33.3%) |
| 3 Vehicles | 149 (32.0%) | 53 (20.1%) |
| 4 Vehicles | 0 (0.0%) | 38 (14.4%) |
| 5 or more Vehicles | 41 (8.8%) | 20 (7.6%) |
| Total | 465 (100.0%) | 264 (100.0%) |
Commute Time in Irwin
The most frequently occuring commute durations in Irwin are 10 to 14 minutes (197 commuters, 28.8%), 45 to 59 minutes (128 commuters, 18.7%), and 30 to 34 minutes (87 commuters, 12.7%).
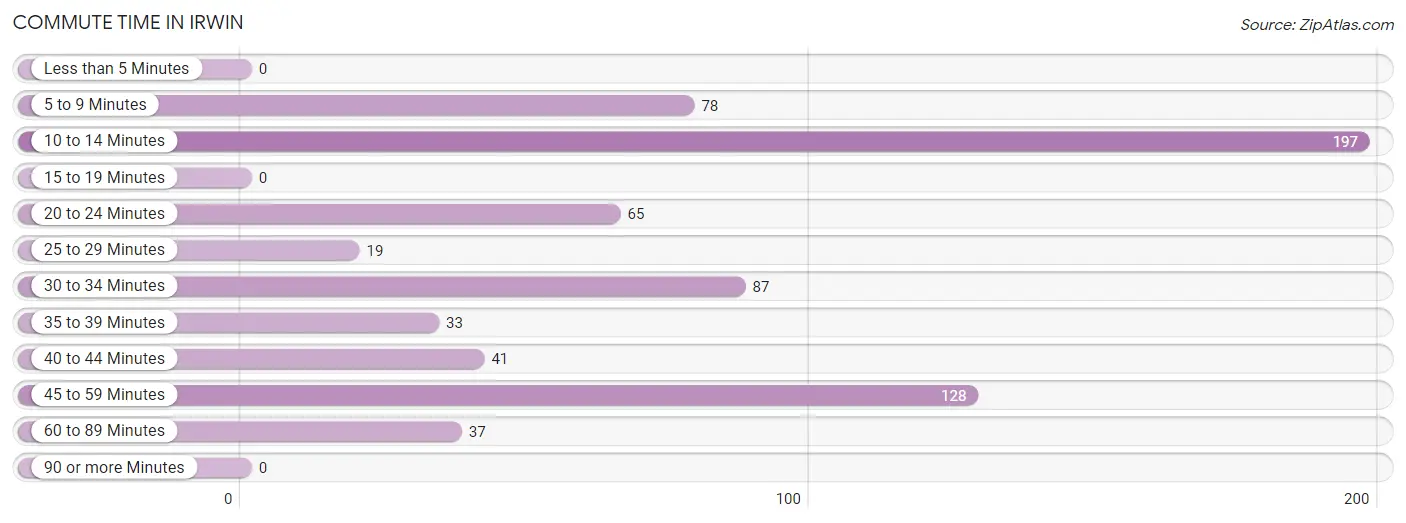
| Commute Time | # Commuters | % Commuters |
| Less than 5 Minutes | 0 | 0.0% |
| 5 to 9 Minutes | 78 | 11.4% |
| 10 to 14 Minutes | 197 | 28.8% |
| 15 to 19 Minutes | 0 | 0.0% |
| 20 to 24 Minutes | 65 | 9.5% |
| 25 to 29 Minutes | 19 | 2.8% |
| 30 to 34 Minutes | 87 | 12.7% |
| 35 to 39 Minutes | 33 | 4.8% |
| 40 to 44 Minutes | 41 | 6.0% |
| 45 to 59 Minutes | 128 | 18.7% |
| 60 to 89 Minutes | 37 | 5.4% |
| 90 or more Minutes | 0 | 0.0% |
Commute Time by Sex in Irwin
The most common commute times in Irwin are 10 to 14 minutes (117 commuters, 25.2%) for males and 10 to 14 minutes (80 commuters, 36.4%) for females.
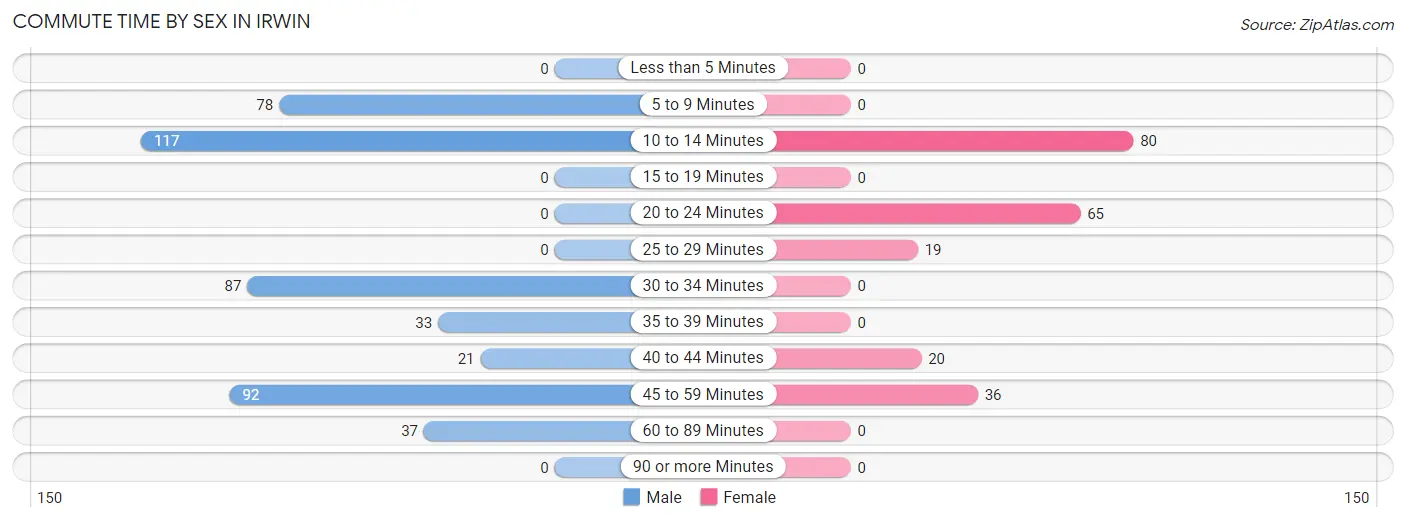
| Commute Time | Male | Female |
| Less than 5 Minutes | 0 (0.0%) | 0 (0.0%) |
| 5 to 9 Minutes | 78 (16.8%) | 0 (0.0%) |
| 10 to 14 Minutes | 117 (25.2%) | 80 (36.4%) |
| 15 to 19 Minutes | 0 (0.0%) | 0 (0.0%) |
| 20 to 24 Minutes | 0 (0.0%) | 65 (29.5%) |
| 25 to 29 Minutes | 0 (0.0%) | 19 (8.6%) |
| 30 to 34 Minutes | 87 (18.7%) | 0 (0.0%) |
| 35 to 39 Minutes | 33 (7.1%) | 0 (0.0%) |
| 40 to 44 Minutes | 21 (4.5%) | 20 (9.1%) |
| 45 to 59 Minutes | 92 (19.8%) | 36 (16.4%) |
| 60 to 89 Minutes | 37 (8.0%) | 0 (0.0%) |
| 90 or more Minutes | 0 (0.0%) | 0 (0.0%) |
Time of Departure to Work by Sex in Irwin
The most frequent times of departure to work in Irwin are 12:00 AM to 4:59 AM (163, 35.0%) for males and 7:30 AM to 7:59 AM (133, 60.5%) for females.
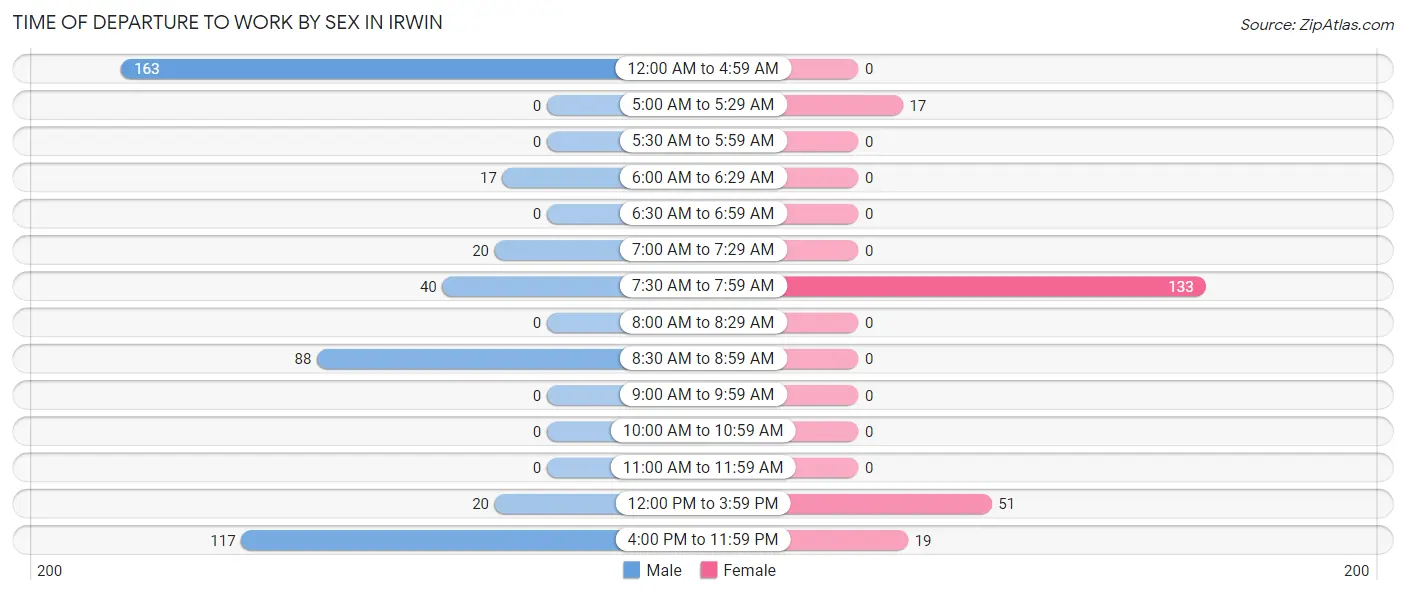
| Time of Departure | Male | Female |
| 12:00 AM to 4:59 AM | 163 (35.0%) | 0 (0.0%) |
| 5:00 AM to 5:29 AM | 0 (0.0%) | 17 (7.7%) |
| 5:30 AM to 5:59 AM | 0 (0.0%) | 0 (0.0%) |
| 6:00 AM to 6:29 AM | 17 (3.7%) | 0 (0.0%) |
| 6:30 AM to 6:59 AM | 0 (0.0%) | 0 (0.0%) |
| 7:00 AM to 7:29 AM | 20 (4.3%) | 0 (0.0%) |
| 7:30 AM to 7:59 AM | 40 (8.6%) | 133 (60.5%) |
| 8:00 AM to 8:29 AM | 0 (0.0%) | 0 (0.0%) |
| 8:30 AM to 8:59 AM | 88 (18.9%) | 0 (0.0%) |
| 9:00 AM to 9:59 AM | 0 (0.0%) | 0 (0.0%) |
| 10:00 AM to 10:59 AM | 0 (0.0%) | 0 (0.0%) |
| 11:00 AM to 11:59 AM | 0 (0.0%) | 0 (0.0%) |
| 12:00 PM to 3:59 PM | 20 (4.3%) | 51 (23.2%) |
| 4:00 PM to 11:59 PM | 117 (25.2%) | 19 (8.6%) |
| Total | 465 (100.0%) | 220 (100.0%) |
Housing Occupancy in Irwin
Occupancy by Ownership in Irwin
Of the total 702 dwellings in Irwin, owner-occupied units account for 473 (67.4%), while renter-occupied units make up 229 (32.6%).
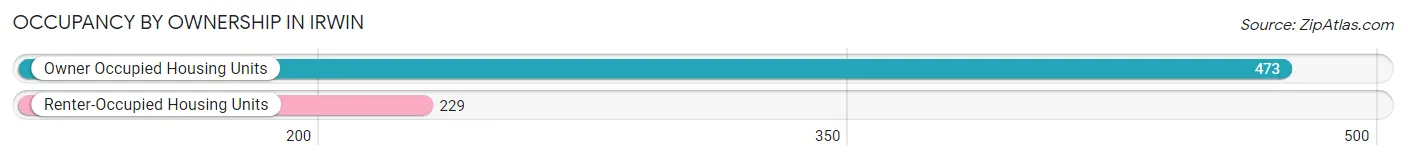
| Occupancy | # Housing Units | % Housing Units |
| Owner Occupied Housing Units | 473 | 67.4% |
| Renter-Occupied Housing Units | 229 | 32.6% |
| Total Occupied Housing Units | 702 | 100.0% |
Occupancy by Household Size in Irwin
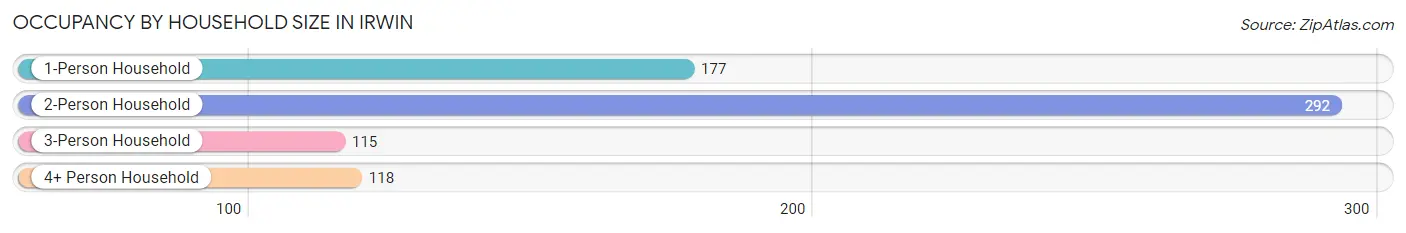
| Household Size | # Housing Units | % Housing Units |
| 1-Person Household | 177 | 25.2% |
| 2-Person Household | 292 | 41.6% |
| 3-Person Household | 115 | 16.4% |
| 4+ Person Household | 118 | 16.8% |
| Total Housing Units | 702 | 100.0% |
Occupancy by Ownership by Household Size in Irwin
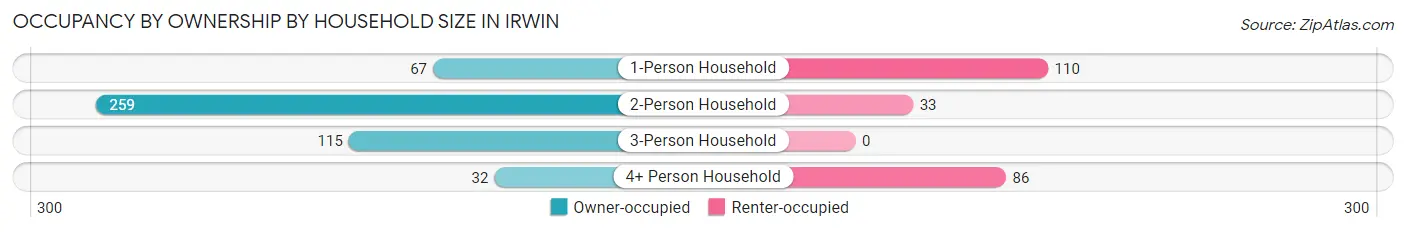
| Household Size | Owner-occupied | Renter-occupied |
| 1-Person Household | 67 (37.9%) | 110 (62.2%) |
| 2-Person Household | 259 (88.7%) | 33 (11.3%) |
| 3-Person Household | 115 (100.0%) | 0 (0.0%) |
| 4+ Person Household | 32 (27.1%) | 86 (72.9%) |
| Total Housing Units | 473 (67.4%) | 229 (32.6%) |
Occupancy by Educational Attainment in Irwin
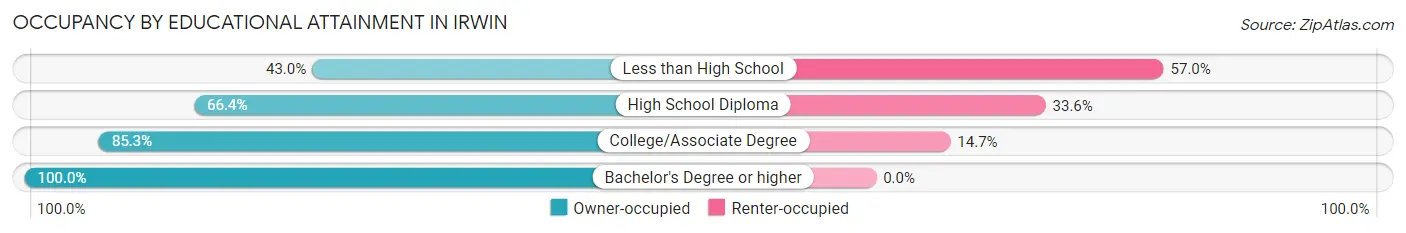
| Household Size | Owner-occupied | Renter-occupied |
| Less than High School | 83 (43.0%) | 110 (57.0%) |
| High School Diploma | 168 (66.4%) | 85 (33.6%) |
| College/Associate Degree | 197 (85.3%) | 34 (14.7%) |
| Bachelor's Degree or higher | 25 (100.0%) | 0 (0.0%) |
Occupancy by Age of Householder in Irwin
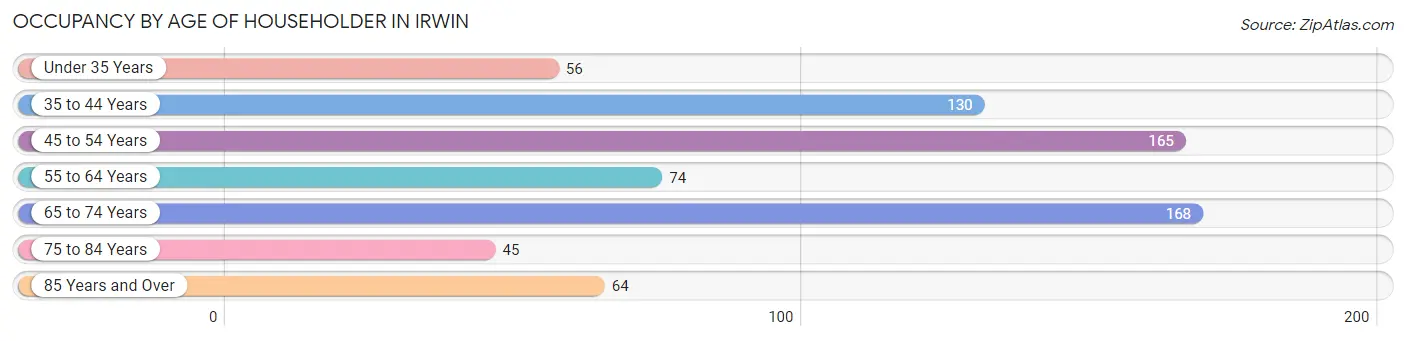
| Age Bracket | # Households | % Households |
| Under 35 Years | 56 | 8.0% |
| 35 to 44 Years | 130 | 18.5% |
| 45 to 54 Years | 165 | 23.5% |
| 55 to 64 Years | 74 | 10.5% |
| 65 to 74 Years | 168 | 23.9% |
| 75 to 84 Years | 45 | 6.4% |
| 85 Years and Over | 64 | 9.1% |
| Total | 702 | 100.0% |
Housing Finances in Irwin
Median Income by Occupancy in Irwin
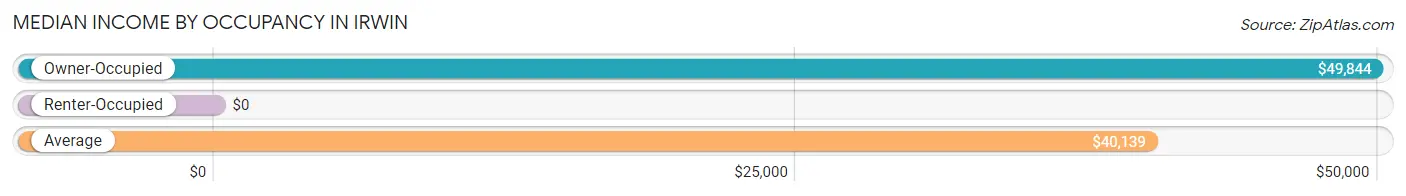
| Occupancy Type | # Households | Median Income |
| Owner-Occupied | 473 (67.4%) | $49,844 |
| Renter-Occupied | 229 (32.6%) | $0 |
| Average | 702 (100.0%) | $40,139 |
Occupancy by Householder Income Bracket in Irwin
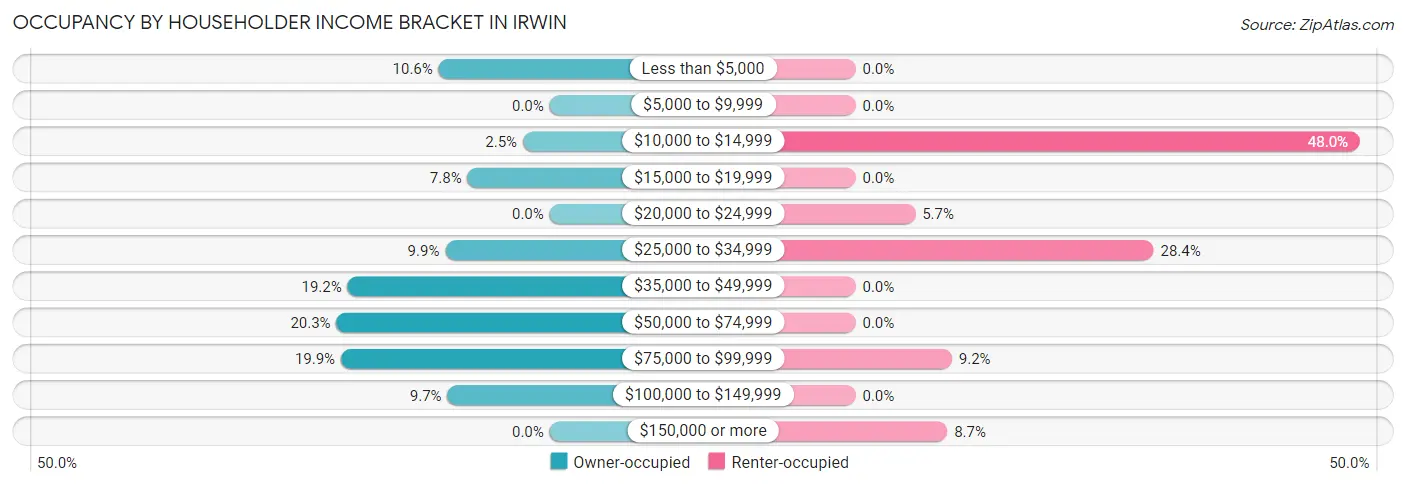
| Income Bracket | Owner-occupied | Renter-occupied |
| Less than $5,000 | 50 (10.6%) | 0 (0.0%) |
| $5,000 to $9,999 | 0 (0.0%) | 0 (0.0%) |
| $10,000 to $14,999 | 12 (2.5%) | 110 (48.0%) |
| $15,000 to $19,999 | 37 (7.8%) | 0 (0.0%) |
| $20,000 to $24,999 | 0 (0.0%) | 13 (5.7%) |
| $25,000 to $34,999 | 47 (9.9%) | 65 (28.4%) |
| $35,000 to $49,999 | 91 (19.2%) | 0 (0.0%) |
| $50,000 to $74,999 | 96 (20.3%) | 0 (0.0%) |
| $75,000 to $99,999 | 94 (19.9%) | 21 (9.2%) |
| $100,000 to $149,999 | 46 (9.7%) | 0 (0.0%) |
| $150,000 or more | 0 (0.0%) | 20 (8.7%) |
| Total | 473 (100.0%) | 229 (100.0%) |
Monthly Housing Cost Tiers in Irwin
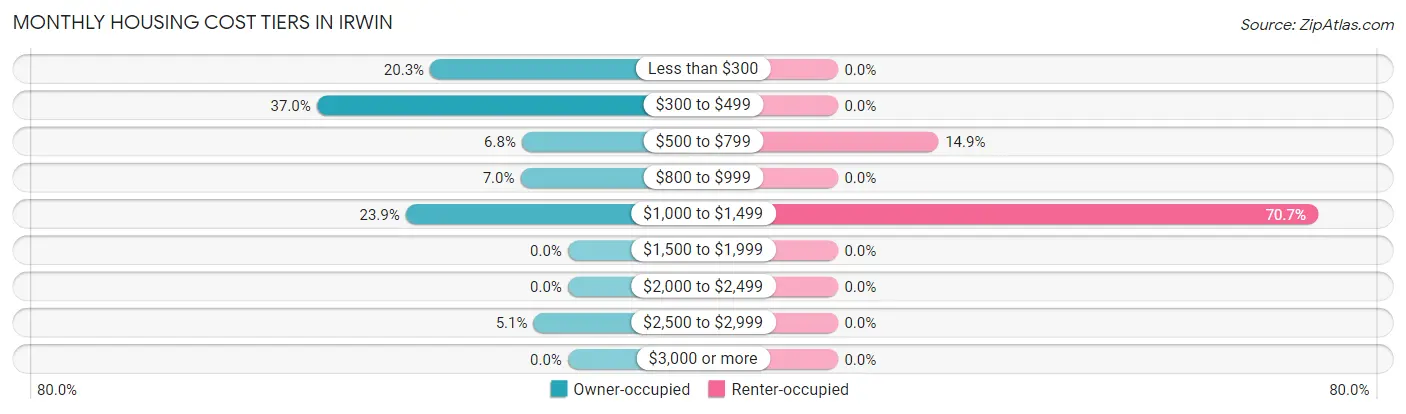
| Monthly Cost | Owner-occupied | Renter-occupied |
| Less than $300 | 96 (20.3%) | 0 (0.0%) |
| $300 to $499 | 175 (37.0%) | 0 (0.0%) |
| $500 to $799 | 32 (6.8%) | 34 (14.8%) |
| $800 to $999 | 33 (7.0%) | 0 (0.0%) |
| $1,000 to $1,499 | 113 (23.9%) | 162 (70.7%) |
| $1,500 to $1,999 | 0 (0.0%) | 0 (0.0%) |
| $2,000 to $2,499 | 0 (0.0%) | 0 (0.0%) |
| $2,500 to $2,999 | 24 (5.1%) | 0 (0.0%) |
| $3,000 or more | 0 (0.0%) | 0 (0.0%) |
| Total | 473 (100.0%) | 229 (100.0%) |
Physical Housing Characteristics in Irwin
Housing Structures in Irwin
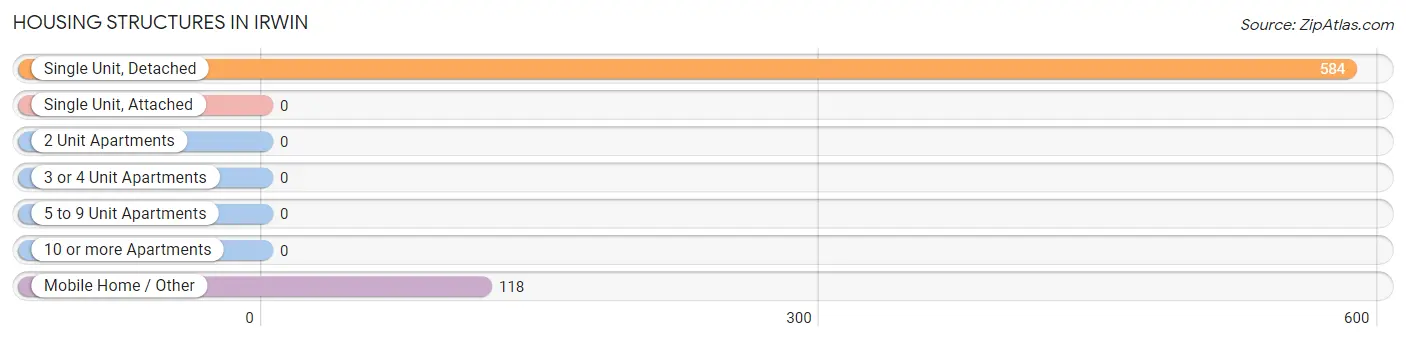
| Structure Type | # Housing Units | % Housing Units |
| Single Unit, Detached | 584 | 83.2% |
| Single Unit, Attached | 0 | 0.0% |
| 2 Unit Apartments | 0 | 0.0% |
| 3 or 4 Unit Apartments | 0 | 0.0% |
| 5 to 9 Unit Apartments | 0 | 0.0% |
| 10 or more Apartments | 0 | 0.0% |
| Mobile Home / Other | 118 | 16.8% |
| Total | 702 | 100.0% |
Housing Structures by Occupancy in Irwin
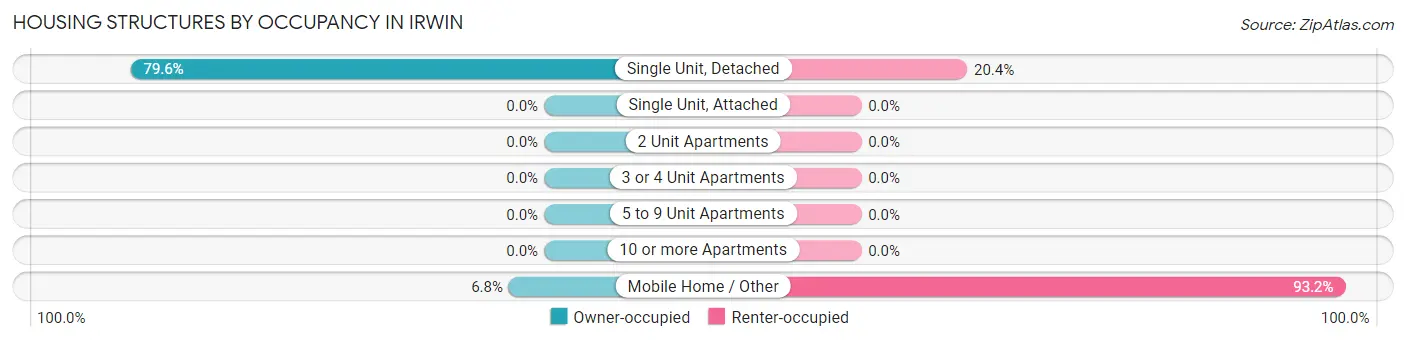
| Structure Type | Owner-occupied | Renter-occupied |
| Single Unit, Detached | 465 (79.6%) | 119 (20.4%) |
| Single Unit, Attached | 0 (0.0%) | 0 (0.0%) |
| 2 Unit Apartments | 0 (0.0%) | 0 (0.0%) |
| 3 or 4 Unit Apartments | 0 (0.0%) | 0 (0.0%) |
| 5 to 9 Unit Apartments | 0 (0.0%) | 0 (0.0%) |
| 10 or more Apartments | 0 (0.0%) | 0 (0.0%) |
| Mobile Home / Other | 8 (6.8%) | 110 (93.2%) |
| Total | 473 (67.4%) | 229 (32.6%) |
Housing Structures by Number of Rooms in Irwin
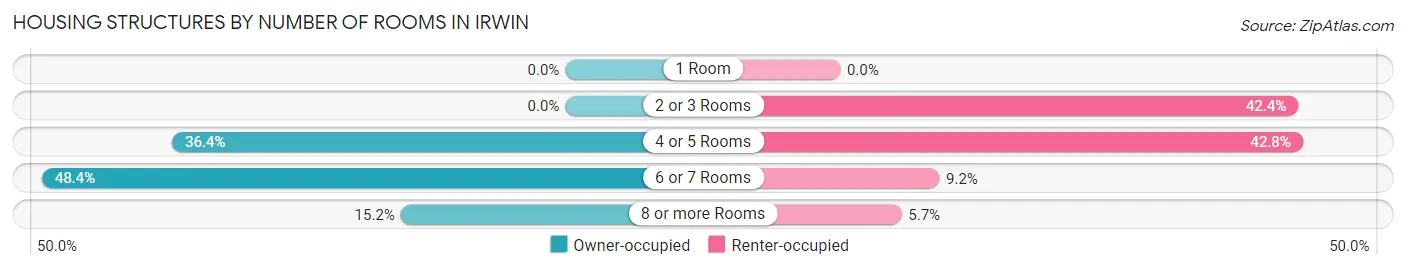
| Number of Rooms | Owner-occupied | Renter-occupied |
| 1 Room | 0 (0.0%) | 0 (0.0%) |
| 2 or 3 Rooms | 0 (0.0%) | 97 (42.4%) |
| 4 or 5 Rooms | 172 (36.4%) | 98 (42.8%) |
| 6 or 7 Rooms | 229 (48.4%) | 21 (9.2%) |
| 8 or more Rooms | 72 (15.2%) | 13 (5.7%) |
| Total | 473 (100.0%) | 229 (100.0%) |
Housing Structure by Heating Type in Irwin
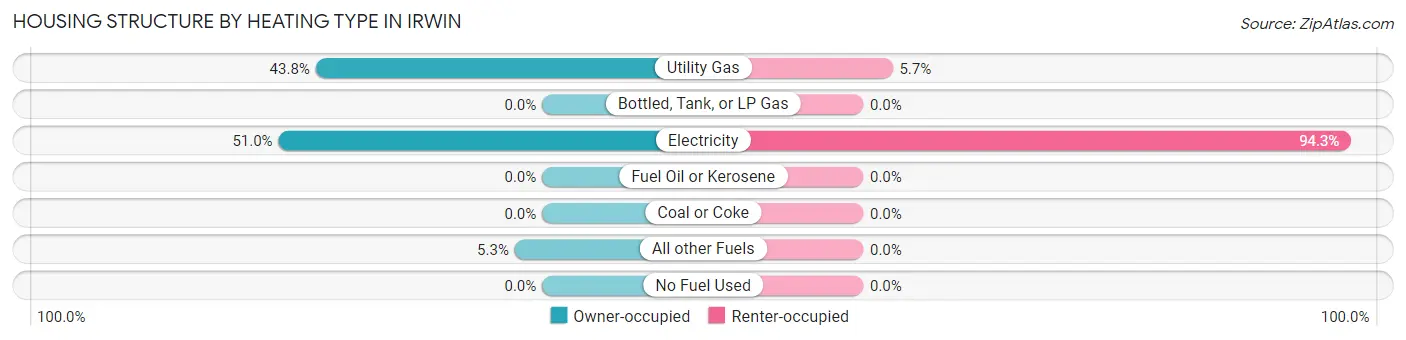
| Heating Type | Owner-occupied | Renter-occupied |
| Utility Gas | 207 (43.8%) | 13 (5.7%) |
| Bottled, Tank, or LP Gas | 0 (0.0%) | 0 (0.0%) |
| Electricity | 241 (50.9%) | 216 (94.3%) |
| Fuel Oil or Kerosene | 0 (0.0%) | 0 (0.0%) |
| Coal or Coke | 0 (0.0%) | 0 (0.0%) |
| All other Fuels | 25 (5.3%) | 0 (0.0%) |
| No Fuel Used | 0 (0.0%) | 0 (0.0%) |
| Total | 473 (100.0%) | 229 (100.0%) |
Household Vehicle Usage in Irwin
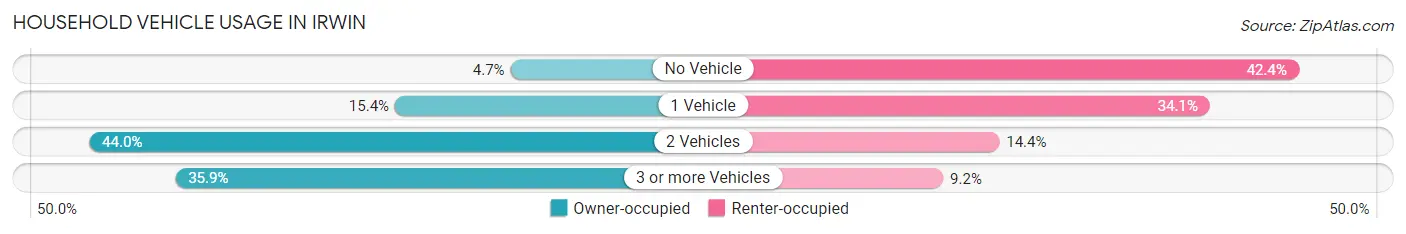
| Vehicles per Household | Owner-occupied | Renter-occupied |
| No Vehicle | 22 (4.6%) | 97 (42.4%) |
| 1 Vehicle | 73 (15.4%) | 78 (34.1%) |
| 2 Vehicles | 208 (44.0%) | 33 (14.4%) |
| 3 or more Vehicles | 170 (35.9%) | 21 (9.2%) |
| Total | 473 (100.0%) | 229 (100.0%) |
Real Estate & Mortgages in Irwin
Real Estate and Mortgage Overview in Irwin
| Characteristic | Without Mortgage | With Mortgage |
| Housing Units | 283 | 190 |
| Median Property Value | $90,800 | $139,600 |
| Median Household Income | $29,489 | $0 |
| Monthly Housing Costs | $322 | $0 |
| Real Estate Taxes | $416 | $0 |
Property Value by Mortgage Status in Irwin
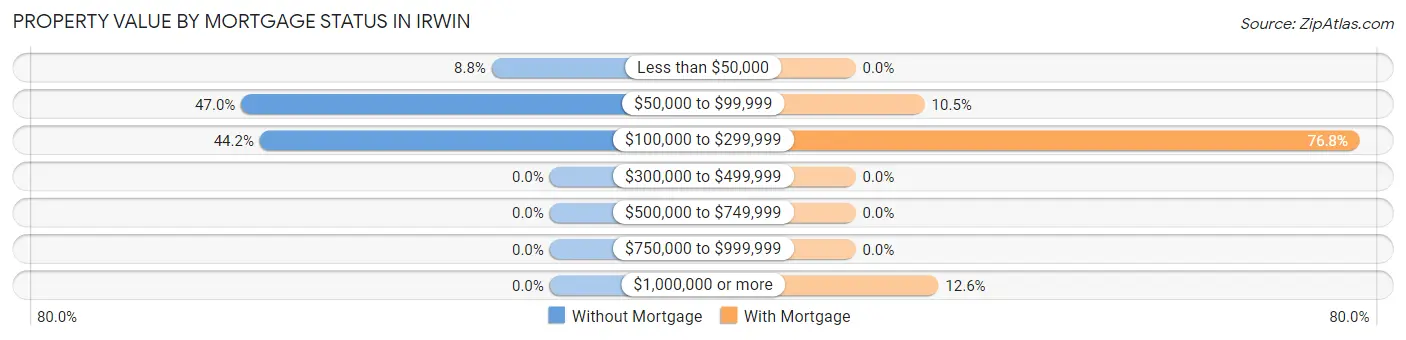
| Property Value | Without Mortgage | With Mortgage |
| Less than $50,000 | 25 (8.8%) | 0 (0.0%) |
| $50,000 to $99,999 | 133 (47.0%) | 20 (10.5%) |
| $100,000 to $299,999 | 125 (44.2%) | 146 (76.8%) |
| $300,000 to $499,999 | 0 (0.0%) | 0 (0.0%) |
| $500,000 to $749,999 | 0 (0.0%) | 0 (0.0%) |
| $750,000 to $999,999 | 0 (0.0%) | 0 (0.0%) |
| $1,000,000 or more | 0 (0.0%) | 24 (12.6%) |
| Total | 283 (100.0%) | 190 (100.0%) |
Household Income by Mortgage Status in Irwin
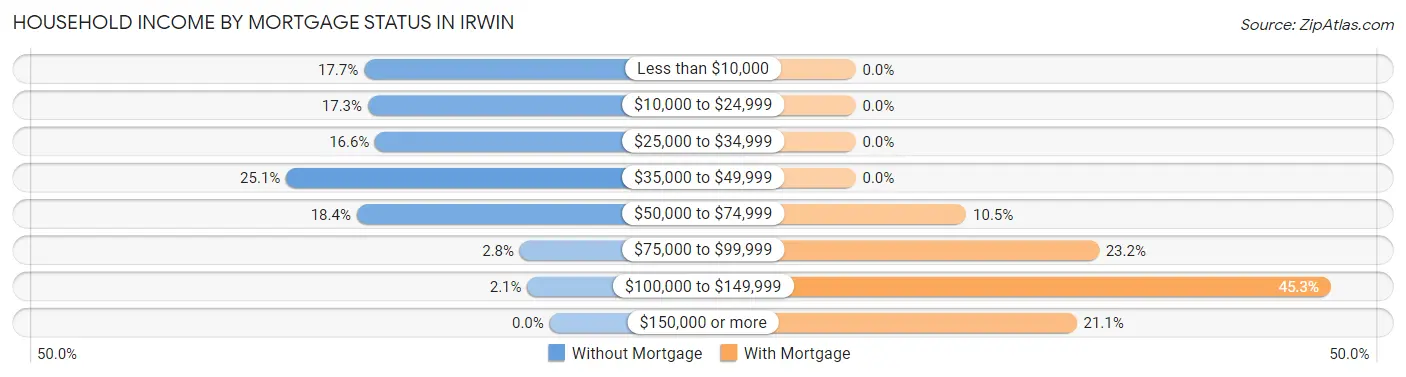
| Household Income | Without Mortgage | With Mortgage |
| Less than $10,000 | 50 (17.7%) | 0 (0.0%) |
| $10,000 to $24,999 | 49 (17.3%) | 0 (0.0%) |
| $25,000 to $34,999 | 47 (16.6%) | 0 (0.0%) |
| $35,000 to $49,999 | 71 (25.1%) | 0 (0.0%) |
| $50,000 to $74,999 | 52 (18.4%) | 20 (10.5%) |
| $75,000 to $99,999 | 8 (2.8%) | 44 (23.2%) |
| $100,000 to $149,999 | 6 (2.1%) | 86 (45.3%) |
| $150,000 or more | 0 (0.0%) | 40 (21.0%) |
| Total | 283 (100.0%) | 190 (100.0%) |
Property Value to Household Income Ratio in Irwin
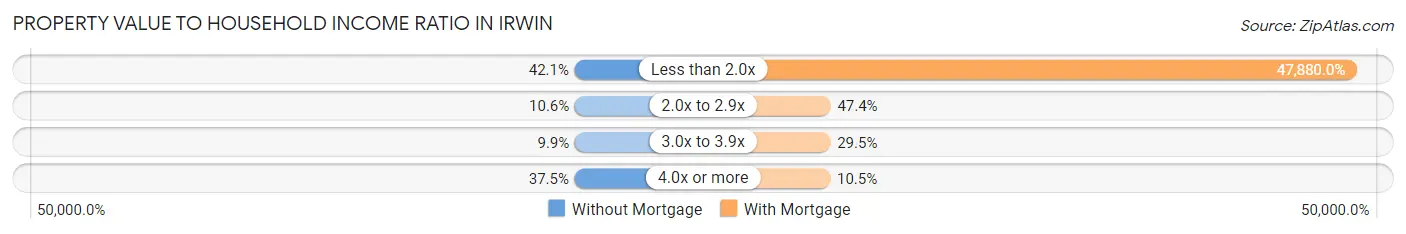
| Value-to-Income Ratio | Without Mortgage | With Mortgage |
| Less than 2.0x | 119 (42.0%) | 90,972 (47,880.0%) |
| 2.0x to 2.9x | 30 (10.6%) | 90 (47.4%) |
| 3.0x to 3.9x | 28 (9.9%) | 56 (29.5%) |
| 4.0x or more | 106 (37.5%) | 20 (10.5%) |
| Total | 283 (100.0%) | 190 (100.0%) |
Real Estate Taxes by Mortgage Status in Irwin
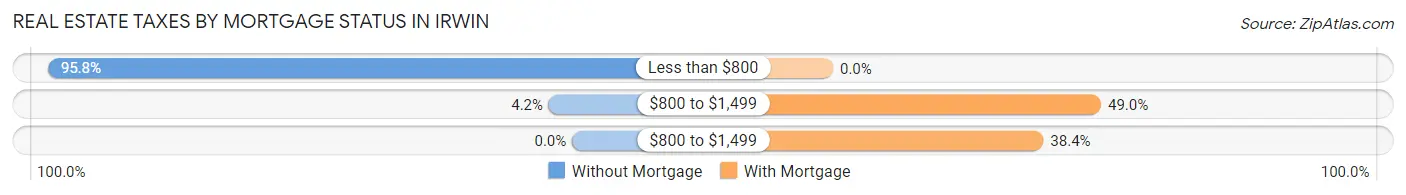
| Property Taxes | Without Mortgage | With Mortgage |
| Less than $800 | 271 (95.8%) | 0 (0.0%) |
| $800 to $1,499 | 12 (4.2%) | 93 (48.9%) |
| $800 to $1,499 | 0 (0.0%) | 73 (38.4%) |
| Total | 283 (100.0%) | 190 (100.0%) |
Health & Disability in Irwin
Health Insurance Coverage by Age in Irwin
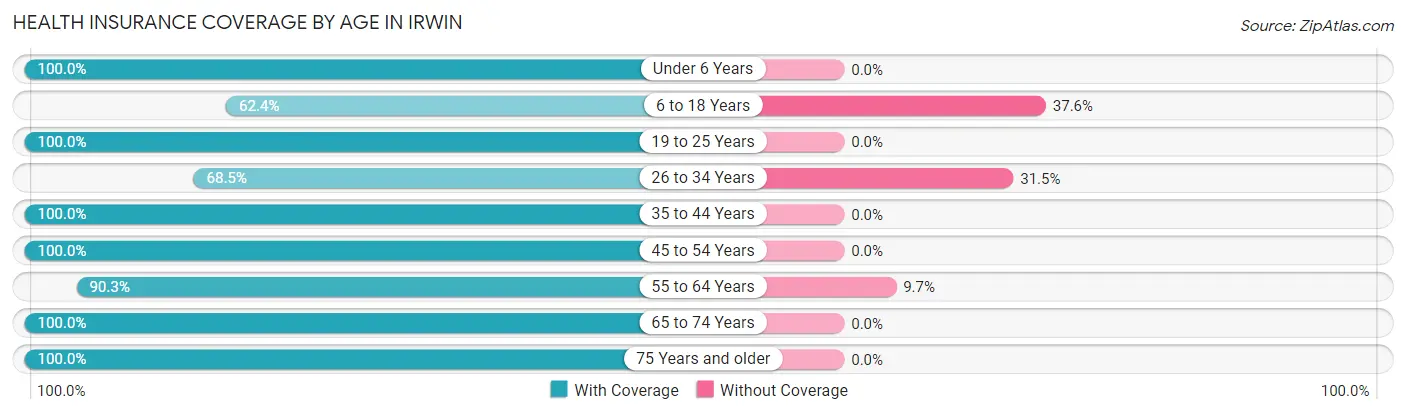
| Age Bracket | With Coverage | Without Coverage |
| Under 6 Years | 126 (100.0%) | 0 (0.0%) |
| 6 to 18 Years | 171 (62.4%) | 103 (37.6%) |
| 19 to 25 Years | 143 (100.0%) | 0 (0.0%) |
| 26 to 34 Years | 113 (68.5%) | 52 (31.5%) |
| 35 to 44 Years | 206 (100.0%) | 0 (0.0%) |
| 45 to 54 Years | 400 (100.0%) | 0 (0.0%) |
| 55 to 64 Years | 196 (90.3%) | 21 (9.7%) |
| 65 to 74 Years | 192 (100.0%) | 0 (0.0%) |
| 75 Years and older | 145 (100.0%) | 0 (0.0%) |
| Total | 1,692 (90.6%) | 176 (9.4%) |
Health Insurance Coverage by Citizenship Status in Irwin
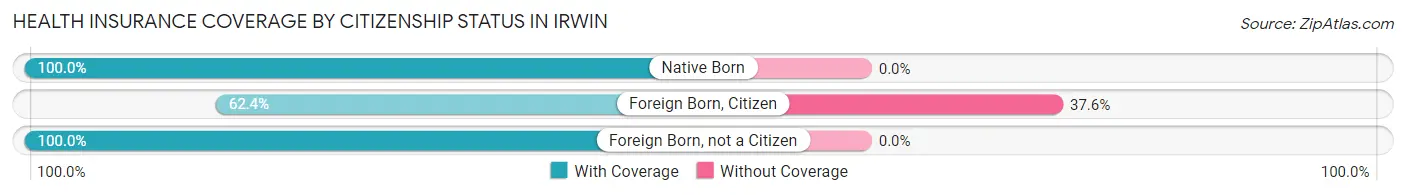
| Citizenship Status | With Coverage | Without Coverage |
| Native Born | 126 (100.0%) | 0 (0.0%) |
| Foreign Born, Citizen | 171 (62.4%) | 103 (37.6%) |
| Foreign Born, not a Citizen | 143 (100.0%) | 0 (0.0%) |
Health Insurance Coverage by Household Income in Irwin
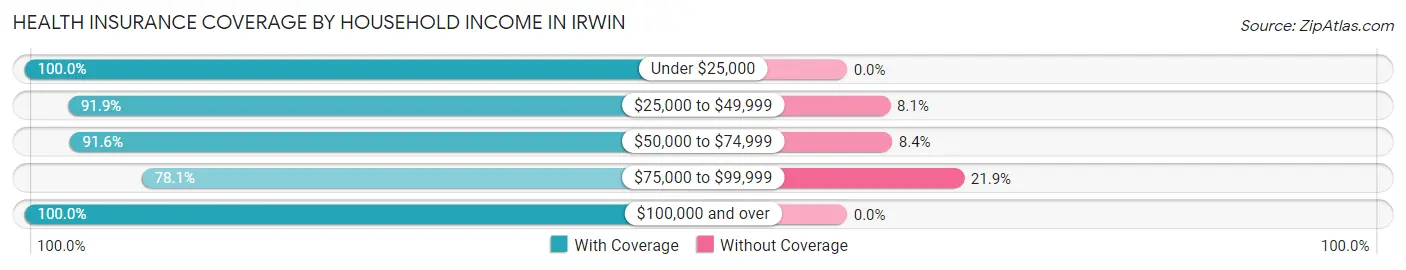
| Household Income | With Coverage | Without Coverage |
| Under $25,000 | 314 (100.0%) | 0 (0.0%) |
| $25,000 to $49,999 | 600 (91.9%) | 53 (8.1%) |
| $50,000 to $74,999 | 206 (91.6%) | 19 (8.4%) |
| $75,000 to $99,999 | 370 (78.1%) | 104 (21.9%) |
| $100,000 and over | 202 (100.0%) | 0 (0.0%) |
Public vs Private Health Insurance Coverage by Age in Irwin
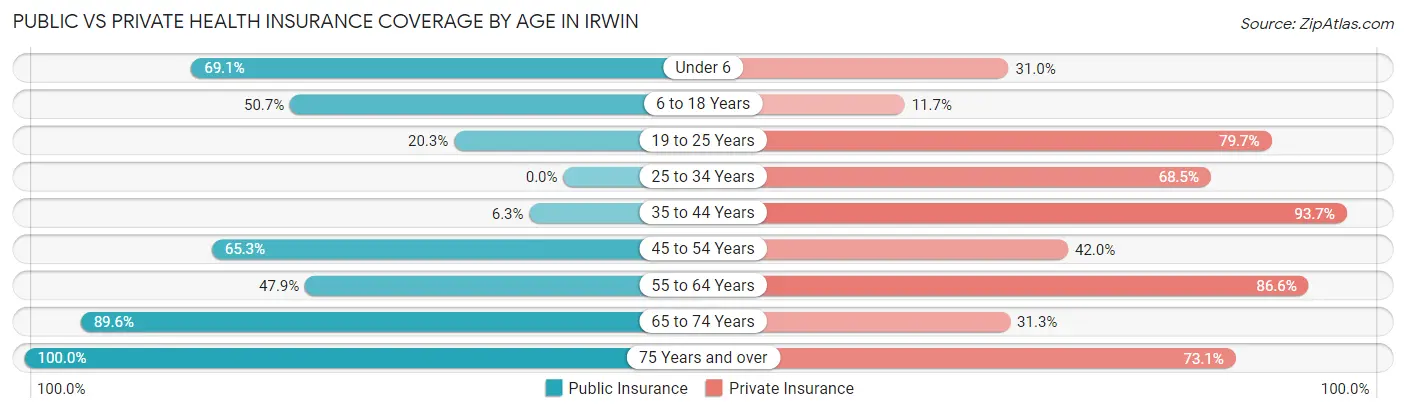
| Age Bracket | Public Insurance | Private Insurance |
| Under 6 | 87 (69.1%) | 39 (30.9%) |
| 6 to 18 Years | 139 (50.7%) | 32 (11.7%) |
| 19 to 25 Years | 29 (20.3%) | 114 (79.7%) |
| 25 to 34 Years | 0 (0.0%) | 113 (68.5%) |
| 35 to 44 Years | 13 (6.3%) | 193 (93.7%) |
| 45 to 54 Years | 261 (65.2%) | 168 (42.0%) |
| 55 to 64 Years | 104 (47.9%) | 188 (86.6%) |
| 65 to 74 Years | 172 (89.6%) | 60 (31.2%) |
| 75 Years and over | 145 (100.0%) | 106 (73.1%) |
| Total | 950 (50.9%) | 1,013 (54.2%) |
Disability Status by Sex by Age in Irwin
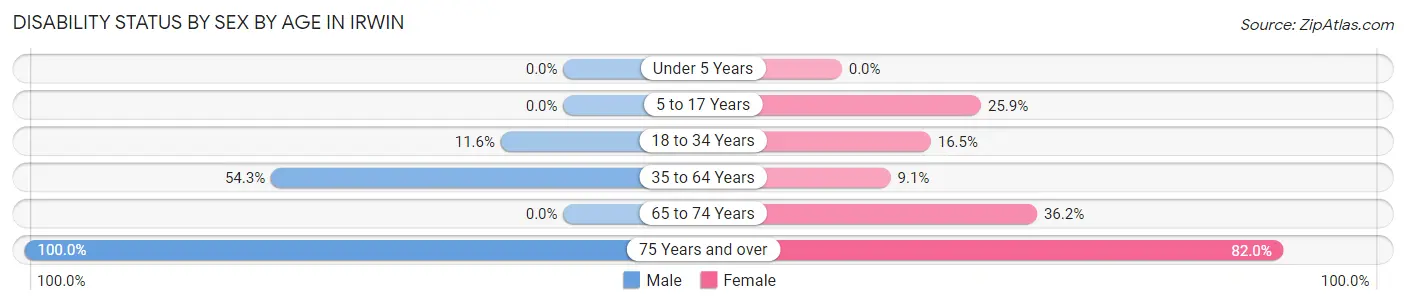
| Age Bracket | Male | Female |
| Under 5 Years | 0 (0.0%) | 0 (0.0%) |
| 5 to 17 Years | 0 (0.0%) | 53 (25.9%) |
| 18 to 34 Years | 26 (11.6%) | 19 (16.5%) |
| 35 to 64 Years | 273 (54.3%) | 29 (9.1%) |
| 65 to 74 Years | 0 (0.0%) | 50 (36.2%) |
| 75 Years and over | 45 (100.0%) | 82 (82.0%) |
Disability Class by Sex by Age in Irwin
Disability Class: Hearing Difficulty
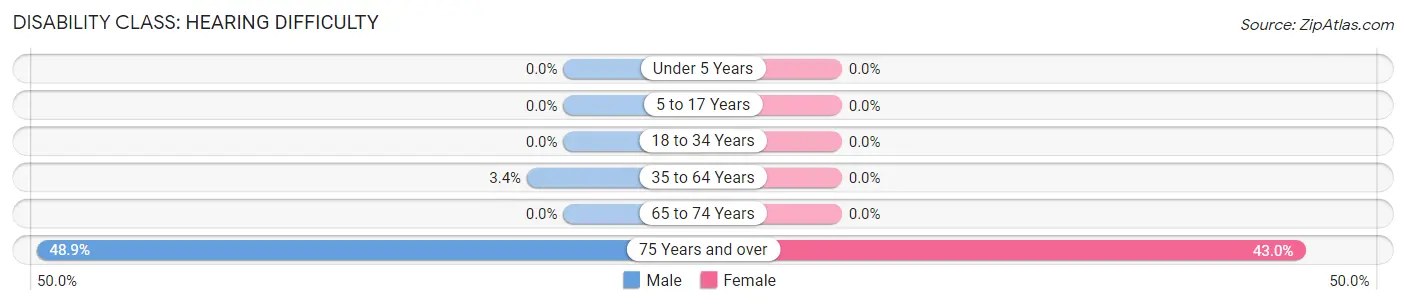
| Age Bracket | Male | Female |
| Under 5 Years | 0 (0.0%) | 0 (0.0%) |
| 5 to 17 Years | 0 (0.0%) | 0 (0.0%) |
| 18 to 34 Years | 0 (0.0%) | 0 (0.0%) |
| 35 to 64 Years | 17 (3.4%) | 0 (0.0%) |
| 65 to 74 Years | 0 (0.0%) | 0 (0.0%) |
| 75 Years and over | 22 (48.9%) | 43 (43.0%) |
Disability Class: Vision Difficulty
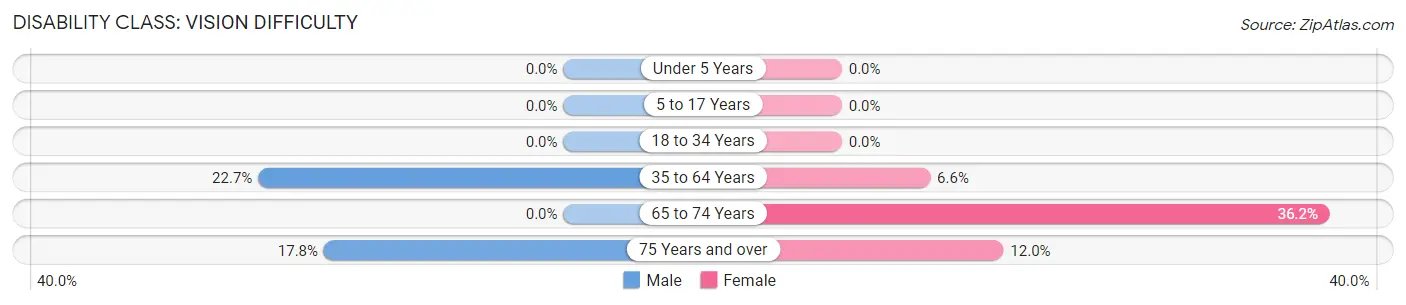
| Age Bracket | Male | Female |
| Under 5 Years | 0 (0.0%) | 0 (0.0%) |
| 5 to 17 Years | 0 (0.0%) | 0 (0.0%) |
| 18 to 34 Years | 0 (0.0%) | 0 (0.0%) |
| 35 to 64 Years | 114 (22.7%) | 21 (6.6%) |
| 65 to 74 Years | 0 (0.0%) | 50 (36.2%) |
| 75 Years and over | 8 (17.8%) | 12 (12.0%) |
Disability Class: Cognitive Difficulty
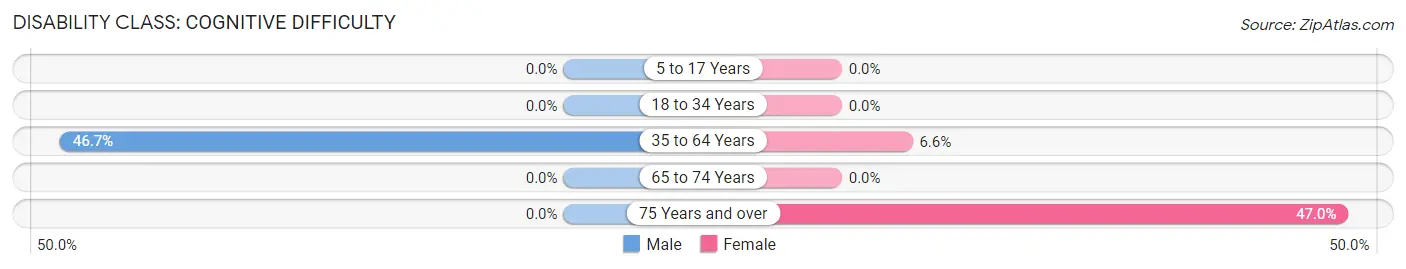
| Age Bracket | Male | Female |
| 5 to 17 Years | 0 (0.0%) | 0 (0.0%) |
| 18 to 34 Years | 0 (0.0%) | 0 (0.0%) |
| 35 to 64 Years | 235 (46.7%) | 21 (6.6%) |
| 65 to 74 Years | 0 (0.0%) | 0 (0.0%) |
| 75 Years and over | 0 (0.0%) | 47 (47.0%) |
Disability Class: Ambulatory Difficulty
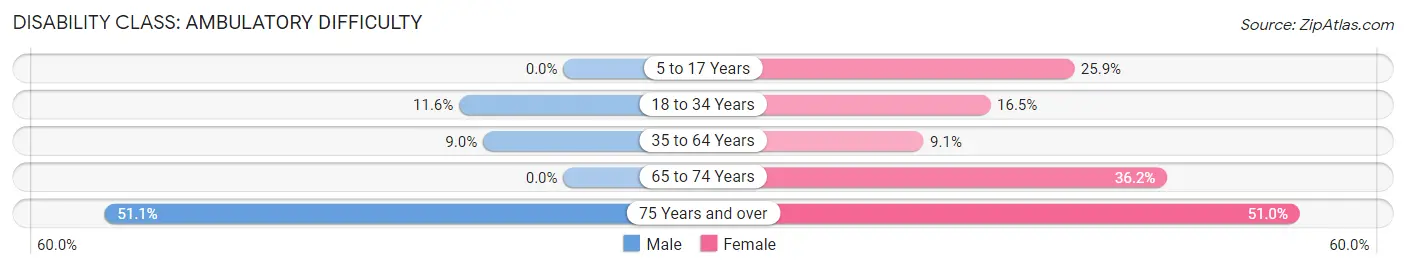
| Age Bracket | Male | Female |
| 5 to 17 Years | 0 (0.0%) | 53 (25.9%) |
| 18 to 34 Years | 26 (11.6%) | 19 (16.5%) |
| 35 to 64 Years | 45 (8.9%) | 29 (9.1%) |
| 65 to 74 Years | 0 (0.0%) | 50 (36.2%) |
| 75 Years and over | 23 (51.1%) | 51 (51.0%) |
Disability Class: Self-Care Difficulty
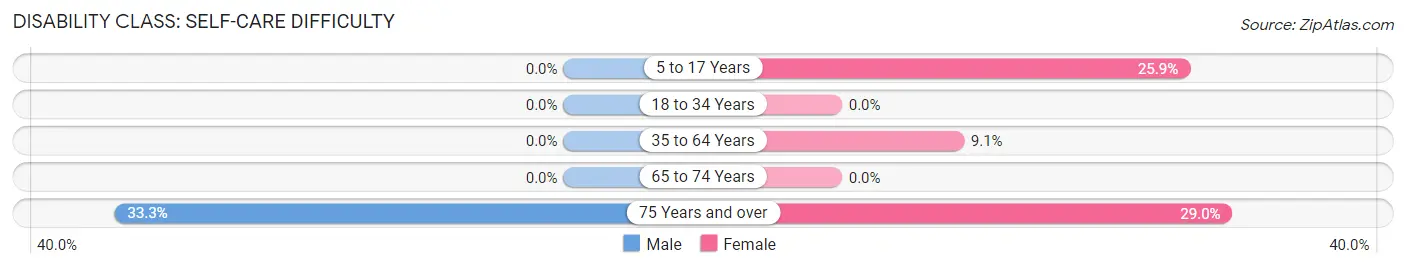
| Age Bracket | Male | Female |
| 5 to 17 Years | 0 (0.0%) | 53 (25.9%) |
| 18 to 34 Years | 0 (0.0%) | 0 (0.0%) |
| 35 to 64 Years | 0 (0.0%) | 29 (9.1%) |
| 65 to 74 Years | 0 (0.0%) | 0 (0.0%) |
| 75 Years and over | 15 (33.3%) | 29 (29.0%) |
Technology Access in Irwin
Computing Device Access in Irwin
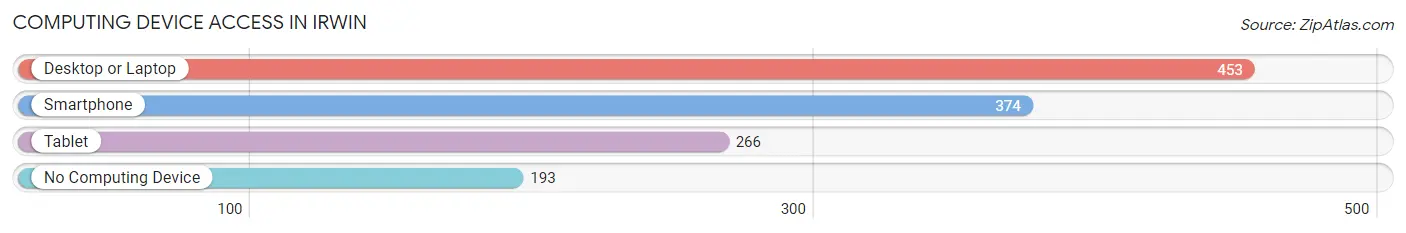
| Device Type | # Households | % Households |
| Desktop or Laptop | 453 | 64.5% |
| Smartphone | 374 | 53.3% |
| Tablet | 266 | 37.9% |
| No Computing Device | 193 | 27.5% |
| Total | 702 | 100.0% |
Internet Access in Irwin
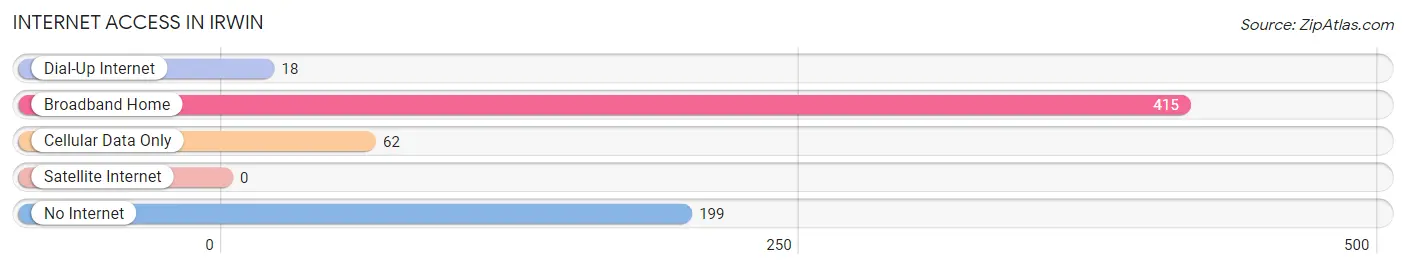
| Internet Type | # Households | % Households |
| Dial-Up Internet | 18 | 2.6% |
| Broadband Home | 415 | 59.1% |
| Cellular Data Only | 62 | 8.8% |
| Satellite Internet | 0 | 0.0% |
| No Internet | 199 | 28.3% |
| Total | 702 | 100.0% |
Irwin Summary
Irwin is a small town located in the state of South Carolina, United States. It is situated in the northeastern part of the state, in the Pee Dee region. The town is located in Marion County, and is part of the Florence Metropolitan Statistical Area. As of the 2010 census, the population of Irwin was 1,845.
History
The town of Irwin was founded in 1891 by the Irwin family, who had moved to the area from North Carolina. The town was named after the family, and was originally known as Irwinville. The town was incorporated in 1895, and the first mayor was J.W. Irwin.
In the early 1900s, the town was a thriving agricultural center, with cotton, corn, and tobacco being the main crops. The town also had a number of small businesses, including a general store, a blacksmith shop, and a grist mill.
In the 1950s, the town began to experience a decline in population, as many of the younger residents moved away in search of better job opportunities. The town also suffered from a lack of investment, as the local economy was largely dependent on agriculture.
In the late 1970s, the town began to experience a resurgence, as new businesses began to move into the area. The town also began to attract new residents, as the cost of living was much lower than in other parts of the state.
Geography
Irwin is located at 34°14'25" North, 79°45'45" West (34.240278, -79.7625). The town is situated in the Pee Dee region of South Carolina, and is part of the Florence Metropolitan Statistical Area.
The town is located in the northeastern part of the state, and is bordered by the towns of Mullins to the north, Marion to the east, and Florence to the south. The town is located approximately 40 miles from the city of Florence, and is about 100 miles from the state capital of Columbia.
The town is situated on the banks of the Great Pee Dee River, and is surrounded by a number of small lakes and ponds. The town is also located near the Francis Marion National Forest, which is a popular destination for outdoor recreation.
Economy
The economy of Irwin is largely based on agriculture, with cotton, corn, and tobacco being the main crops. The town also has a number of small businesses, including a general store, a blacksmith shop, and a grist mill.
The town is also home to a number of manufacturing companies, including a furniture factory, a textile mill, and a plastics plant. The town is also home to a number of retail stores, including a grocery store, a hardware store, and a pharmacy.
Demographics
As of the 2010 census, the population of Irwin was 1,845. The racial makeup of the town was 79.3% White, 17.3% African American, 0.3% Native American, 0.7% Asian, 0.1% Pacific Islander, and 2.3% from other races. Hispanic or Latino of any race were 2.7% of the population.
The median household income in Irwin was $30,938, and the median family income was $37,813. The per capita income for the town was $15,945. About 17.3% of the population was below the poverty line.
Common Questions
What is Per Capita Income in Irwin?
Per Capita income in Irwin is $22,048.
What is the Median Family Income in Irwin?
Median Family Income in Irwin is $42,188.
What is the Median Household income in Irwin?
Median Household Income in Irwin is $40,139.
What is Income or Wage Gap in Irwin?
Income or Wage Gap in Irwin is 46.7%.
Women in Irwin earn 53.3 cents for every dollar earned by a man.
What is Family Income Deficit in Irwin?
Family Income Deficit in Irwin is $11,996.
Families that are below poverty line in Irwin earn $11,996 less on average than the poverty threshold level.
What is Inequality or Gini Index in Irwin?
Inequality or Gini Index in Irwin is 0.47.
What is the Total Population of Irwin?
Total Population of Irwin is 1,868.
What is the Total Male Population of Irwin?
Total Male Population of Irwin is 936.
What is the Total Female Population of Irwin?
Total Female Population of Irwin is 932.
What is the Ratio of Males per 100 Females in Irwin?
There are 100.43 Males per 100 Females in Irwin.
What is the Ratio of Females per 100 Males in Irwin?
There are 99.57 Females per 100 Males in Irwin.
What is the Median Population Age in Irwin?
Median Population Age in Irwin is 45.2 Years.
What is the Average Family Size in Irwin
Average Family Size in Irwin is 3.0 People.
What is the Average Household Size in Irwin
Average Household Size in Irwin is 2.7 People.
How Large is the Labor Force in Irwin?
There are 854 People in the Labor Forcein in Irwin.
What is the Percentage of People in the Labor Force in Irwin?
57.0% of People are in the Labor Force in Irwin.
What is the Unemployment Rate in Irwin?
Unemployment Rate in Irwin is 11.6%.