St Stephen, SC Map & Demographics
St Stephen Map
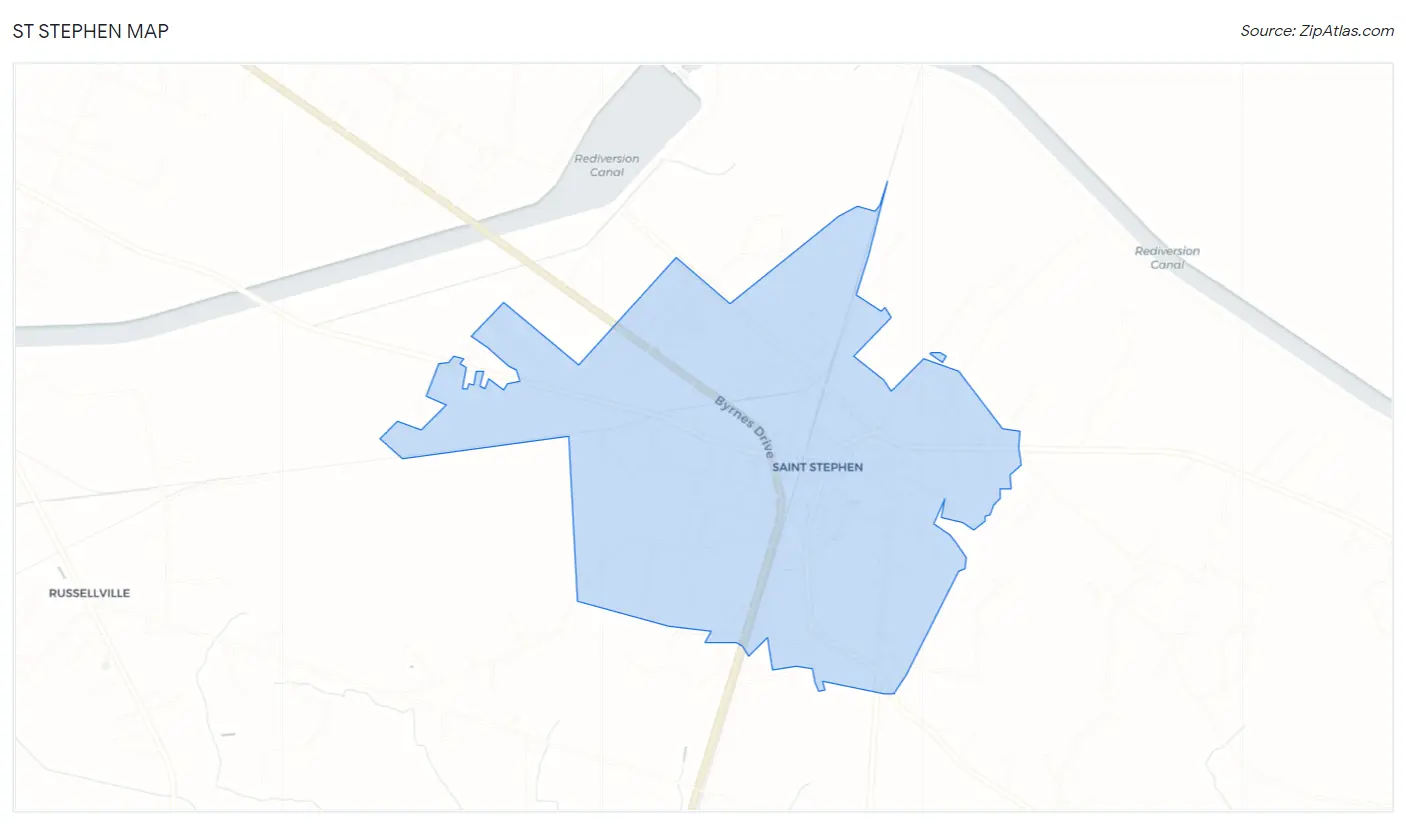
St Stephen Overview
$19,641
PER CAPITA INCOME
$41,618
AVG FAMILY INCOME
$37,596
AVG HOUSEHOLD INCOME
53.9%
WAGE / INCOME GAP [ % ]
46.1¢/ $1
WAGE / INCOME GAP [ $ ]
0.47
INEQUALITY / GINI INDEX
1,386
TOTAL POPULATION
628
MALE POPULATION
758
FEMALE POPULATION
82.85
MALES / 100 FEMALES
120.70
FEMALES / 100 MALES
36.5
MEDIAN AGE
3.1
AVG FAMILY SIZE
2.7
AVG HOUSEHOLD SIZE
405
LABOR FORCE [ PEOPLE ]
39.2%
PERCENT IN LABOR FORCE
8.4%
UNEMPLOYMENT RATE
Income in St Stephen
Income Overview in St Stephen
Per Capita Income in St Stephen is $19,641, while median incomes of families and households are $41,618 and $37,596 respectively.
| Characteristic | Number | Measure |
| Per Capita Income | 1,386 | $19,641 |
| Median Family Income | 330 | $41,618 |
| Mean Family Income | 330 | $58,054 |
| Median Household Income | 479 | $37,596 |
| Mean Household Income | 479 | $52,533 |
| Income Deficit | 330 | $0 |
| Wage / Income Gap (%) | 1,386 | 53.93% |
| Wage / Income Gap ($) | 1,386 | 46.07¢ per $1 |
| Gini / Inequality Index | 1,386 | 0.47 |
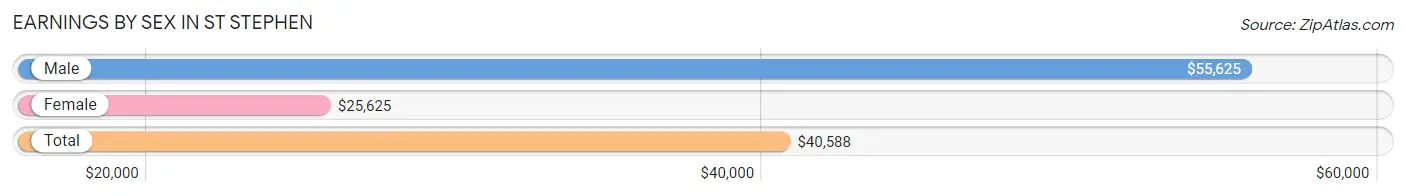
Earnings by Sex in St Stephen
Average Earnings in St Stephen are $40,588, $55,625 for men and $25,625 for women, a difference of 53.9%.
| Sex | Number | Average Earnings |
| Male | 244 (56.2%) | $55,625 |
| Female | 190 (43.8%) | $25,625 |
| Total | 434 (100.0%) | $40,588 |
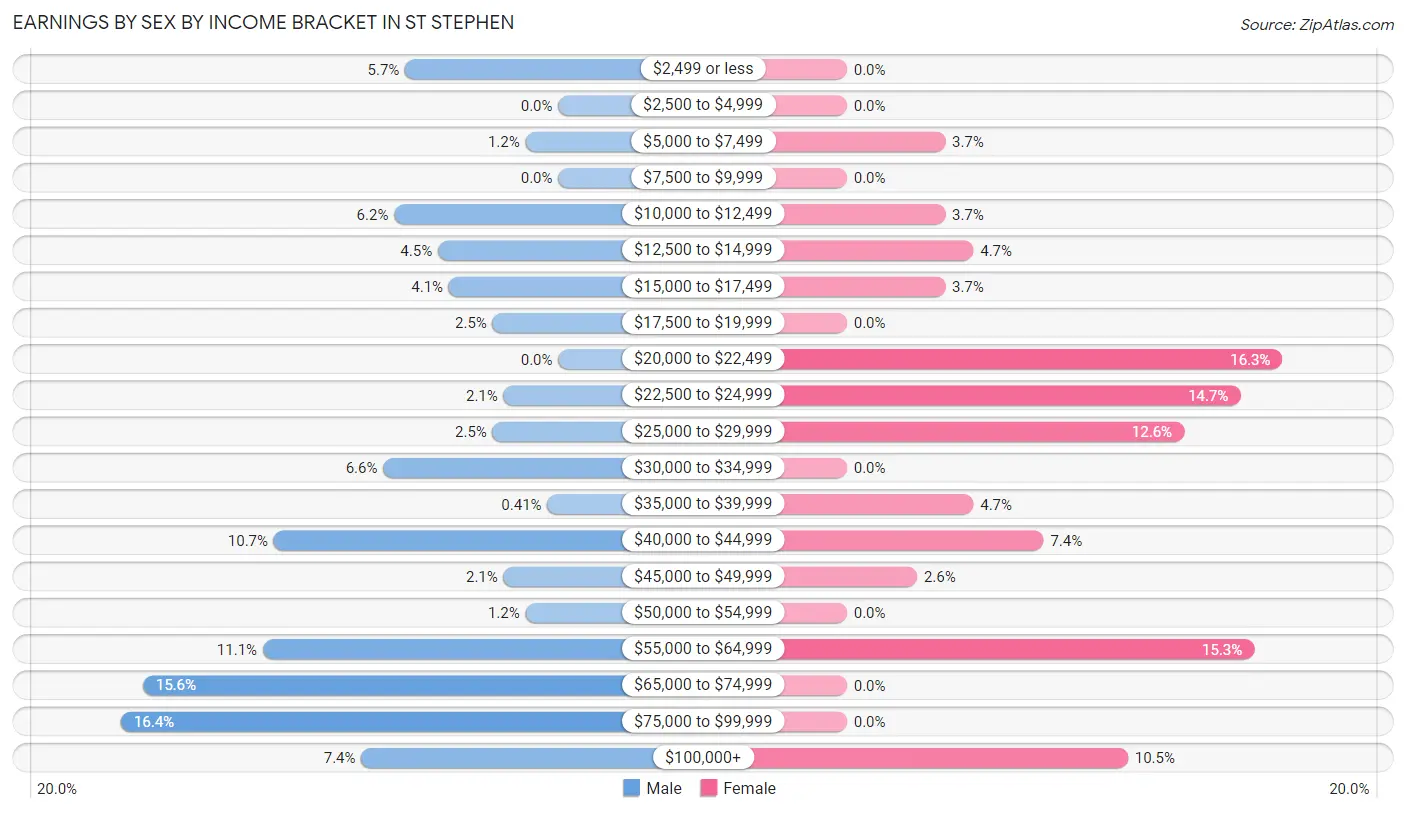
Earnings by Sex by Income Bracket in St Stephen
The most common earnings brackets in St Stephen are $75,000 to $99,999 for men (40 | 16.4%) and $20,000 to $22,499 for women (31 | 16.3%).
| Income | Male | Female |
| $2,499 or less | 14 (5.7%) | 0 (0.0%) |
| $2,500 to $4,999 | 0 (0.0%) | 0 (0.0%) |
| $5,000 to $7,499 | 3 (1.2%) | 7 (3.7%) |
| $7,500 to $9,999 | 0 (0.0%) | 0 (0.0%) |
| $10,000 to $12,499 | 15 (6.1%) | 7 (3.7%) |
| $12,500 to $14,999 | 11 (4.5%) | 9 (4.7%) |
| $15,000 to $17,499 | 10 (4.1%) | 7 (3.7%) |
| $17,500 to $19,999 | 6 (2.5%) | 0 (0.0%) |
| $20,000 to $22,499 | 0 (0.0%) | 31 (16.3%) |
| $22,500 to $24,999 | 5 (2.1%) | 28 (14.7%) |
| $25,000 to $29,999 | 6 (2.5%) | 24 (12.6%) |
| $30,000 to $34,999 | 16 (6.6%) | 0 (0.0%) |
| $35,000 to $39,999 | 1 (0.4%) | 9 (4.7%) |
| $40,000 to $44,999 | 26 (10.7%) | 14 (7.4%) |
| $45,000 to $49,999 | 5 (2.1%) | 5 (2.6%) |
| $50,000 to $54,999 | 3 (1.2%) | 0 (0.0%) |
| $55,000 to $64,999 | 27 (11.1%) | 29 (15.3%) |
| $65,000 to $74,999 | 38 (15.6%) | 0 (0.0%) |
| $75,000 to $99,999 | 40 (16.4%) | 0 (0.0%) |
| $100,000+ | 18 (7.4%) | 20 (10.5%) |
| Total | 244 (100.0%) | 190 (100.0%) |
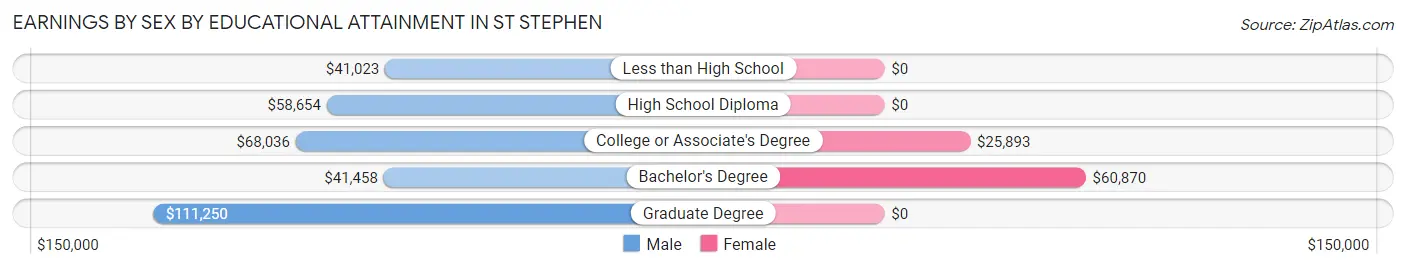
Earnings by Sex by Educational Attainment in St Stephen
| Educational Attainment | Male Income | Female Income |
| Less than High School | $41,023 | $0 |
| High School Diploma | $58,654 | $0 |
| College or Associate's Degree | $68,036 | $25,893 |
| Bachelor's Degree | $41,458 | $60,870 |
| Graduate Degree | $111,250 | $0 |
| Total | $59,688 | $0 |
Family Income in St Stephen
Family Income Brackets in St Stephen
According to the St Stephen family income data, there are 60 families falling into the $50,000 to $74,999 income range, which is the most common income bracket and makes up 18.2% of all families. Conversely, the $150,000 to $199,999 income bracket is the least frequent group with only 3 families (0.9%) belonging to this category.
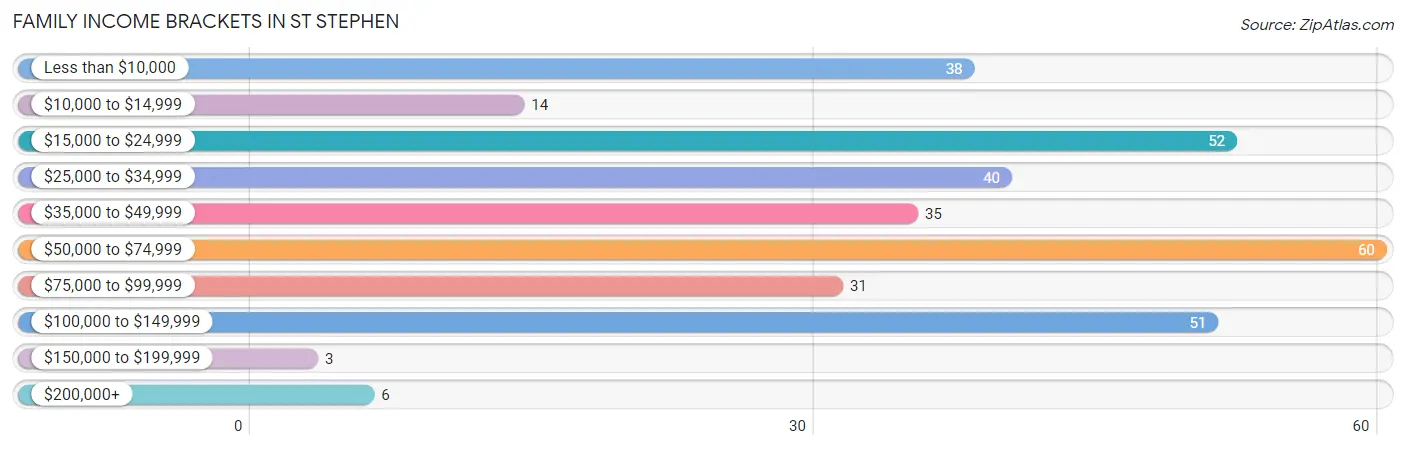
| Income Bracket | # Families | % Families |
| Less than $10,000 | 38 | 11.5% |
| $10,000 to $14,999 | 14 | 4.2% |
| $15,000 to $24,999 | 52 | 15.8% |
| $25,000 to $34,999 | 40 | 12.1% |
| $35,000 to $49,999 | 35 | 10.6% |
| $50,000 to $74,999 | 60 | 18.2% |
| $75,000 to $99,999 | 31 | 9.4% |
| $100,000 to $149,999 | 51 | 15.5% |
| $150,000 to $199,999 | 3 | 0.9% |
| $200,000+ | 6 | 1.8% |
Family Income by Famaliy Size in St Stephen
3-person families (93 | 28.2%) account for the highest median family income in St Stephen with $60,272 per family, while 2-person families (146 | 44.2%) have the highest median income of $20,625 per family member.
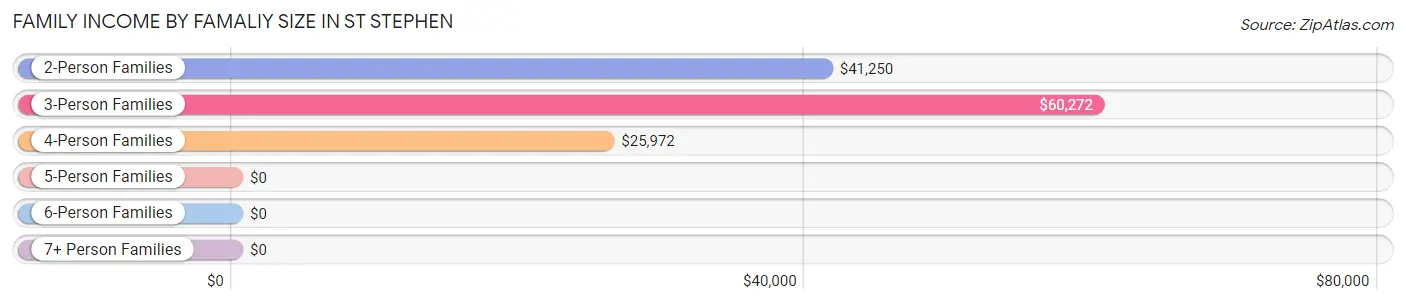
| Income Bracket | # Families | Median Income |
| 2-Person Families | 146 (44.2%) | $41,250 |
| 3-Person Families | 93 (28.2%) | $60,272 |
| 4-Person Families | 51 (15.4%) | $25,972 |
| 5-Person Families | 22 (6.7%) | $0 |
| 6-Person Families | 10 (3.0%) | $0 |
| 7+ Person Families | 8 (2.4%) | $0 |
| Total | 330 (100.0%) | $41,618 |
Family Income by Number of Earners in St Stephen
The median family income in St Stephen is $41,618, with families comprising 3+ earners (32) having the highest median family income of $138,750, while families with no earners (88) have the lowest median family income of $25,288, accounting for 9.7% and 26.7% of families, respectively.
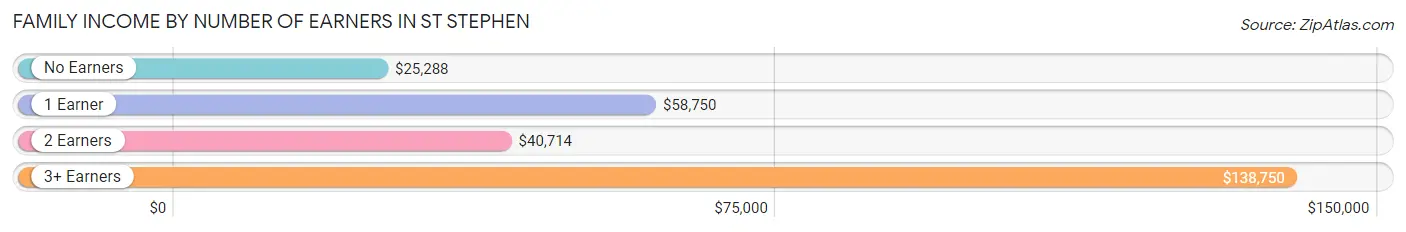
| Number of Earners | # Families | Median Income |
| No Earners | 88 (26.7%) | $25,288 |
| 1 Earner | 160 (48.5%) | $58,750 |
| 2 Earners | 50 (15.1%) | $40,714 |
| 3+ Earners | 32 (9.7%) | $138,750 |
| Total | 330 (100.0%) | $41,618 |
Household Income in St Stephen
Household Income Brackets in St Stephen
With 83 households falling in the category, the $15,000 to $24,999 income range is the most frequent in St Stephen, accounting for 17.3% of all households. In contrast, only 6 households (1.3%) fall into the $200,000+ income bracket, making it the least populous group.

| Income Bracket | # Households | % Households |
| Less than $10,000 | 49 | 10.2% |
| $10,000 to $14,999 | 43 | 9.0% |
| $15,000 to $24,999 | 83 | 17.3% |
| $25,000 to $34,999 | 56 | 11.7% |
| $35,000 to $49,999 | 58 | 12.1% |
| $50,000 to $74,999 | 70 | 14.6% |
| $75,000 to $99,999 | 44 | 9.2% |
| $100,000 to $149,999 | 61 | 12.7% |
| $150,000 to $199,999 | 9 | 1.9% |
| $200,000+ | 6 | 1.3% |
Household Income by Householder Age in St Stephen
The median household income in St Stephen is $37,596, with the highest median household income of $53,750 found in the 25 to 44 years age bracket for the primary householder. A total of 152 households (31.7%) fall into this category. Meanwhile, the 15 to 24 years age bracket for the primary householder has the lowest median household income of $0, with 21 households (4.4%) in this group.
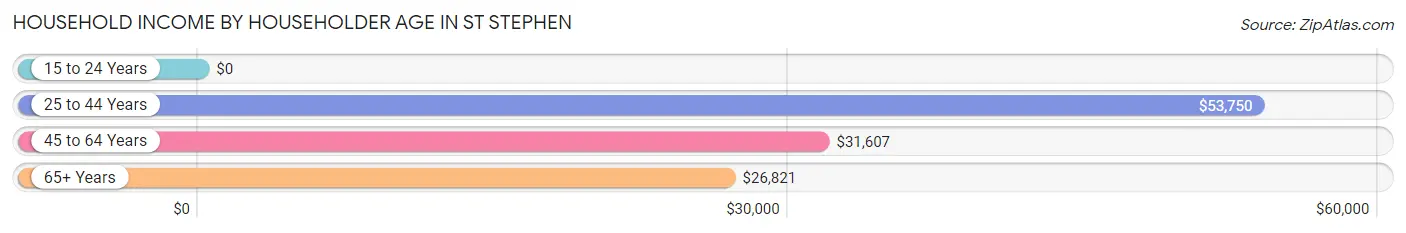
| Income Bracket | # Households | Median Income |
| 15 to 24 Years | 21 (4.4%) | $0 |
| 25 to 44 Years | 152 (31.7%) | $53,750 |
| 45 to 64 Years | 183 (38.2%) | $31,607 |
| 65+ Years | 123 (25.7%) | $26,821 |
| Total | 479 (100.0%) | $37,596 |
Poverty in St Stephen
Income Below Poverty by Sex and Age in St Stephen
With 31.7% poverty level for males and 45.5% for females among the residents of St Stephen, under 5 year old males and 18 to 24 year old females are the most vulnerable to poverty, with 35 males (83.3%) and 85 females (91.4%) in their respective age groups living below the poverty level.
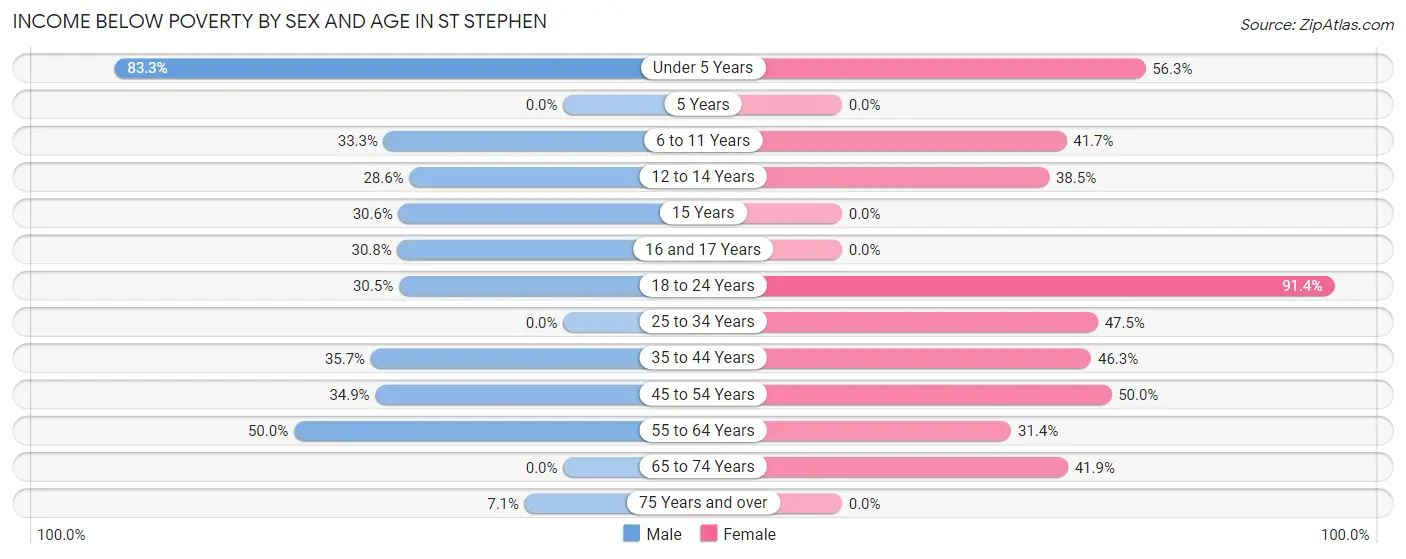
| Age Bracket | Male | Female |
| Under 5 Years | 35 (83.3%) | 49 (56.3%) |
| 5 Years | 0 (0.0%) | 0 (0.0%) |
| 6 to 11 Years | 11 (33.3%) | 25 (41.7%) |
| 12 to 14 Years | 4 (28.6%) | 10 (38.5%) |
| 15 Years | 11 (30.6%) | 0 (0.0%) |
| 16 and 17 Years | 8 (30.8%) | 0 (0.0%) |
| 18 to 24 Years | 18 (30.5%) | 85 (91.4%) |
| 25 to 34 Years | 0 (0.0%) | 38 (47.5%) |
| 35 to 44 Years | 20 (35.7%) | 31 (46.3%) |
| 45 to 54 Years | 15 (34.9%) | 19 (50.0%) |
| 55 to 64 Years | 58 (50.0%) | 44 (31.4%) |
| 65 to 74 Years | 0 (0.0%) | 13 (41.9%) |
| 75 Years and over | 2 (7.1%) | 0 (0.0%) |
| Total | 182 (31.7%) | 314 (45.5%) |
Income Above Poverty by Sex and Age in St Stephen
According to the poverty statistics in St Stephen, males aged 5 years and females aged 5 years are the age groups that are most secure financially, with 100.0% of males and 100.0% of females in these age groups living above the poverty line.
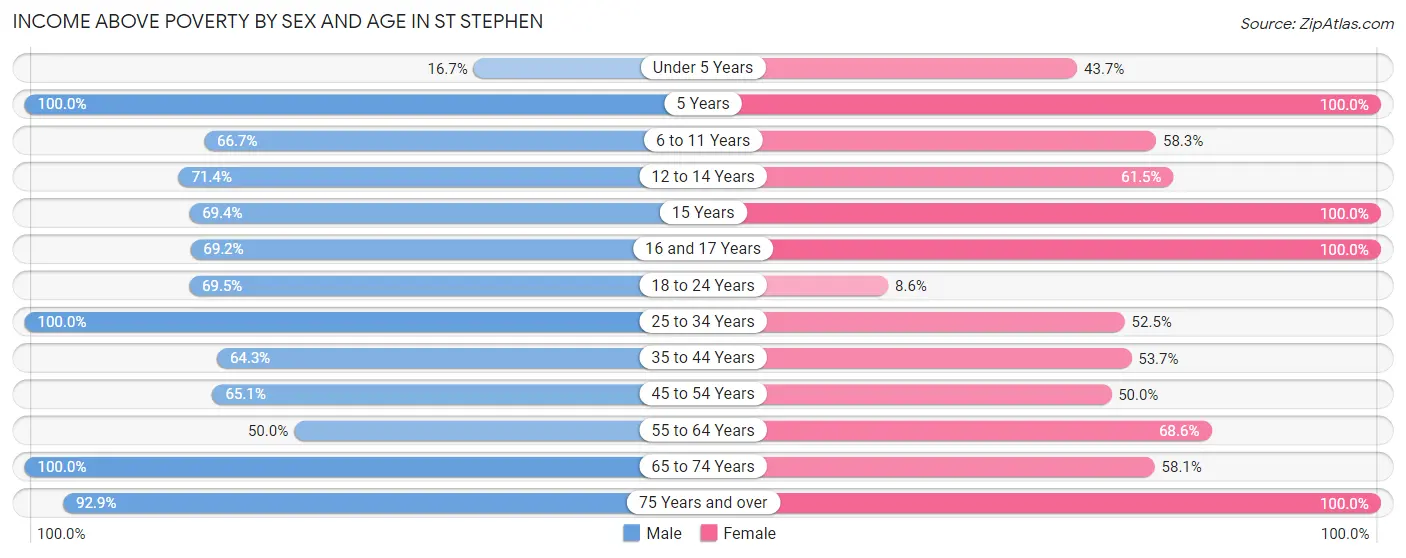
| Age Bracket | Male | Female |
| Under 5 Years | 7 (16.7%) | 38 (43.7%) |
| 5 Years | 20 (100.0%) | 3 (100.0%) |
| 6 to 11 Years | 22 (66.7%) | 35 (58.3%) |
| 12 to 14 Years | 10 (71.4%) | 16 (61.5%) |
| 15 Years | 25 (69.4%) | 4 (100.0%) |
| 16 and 17 Years | 18 (69.2%) | 11 (100.0%) |
| 18 to 24 Years | 41 (69.5%) | 8 (8.6%) |
| 25 to 34 Years | 60 (100.0%) | 42 (52.5%) |
| 35 to 44 Years | 36 (64.3%) | 36 (53.7%) |
| 45 to 54 Years | 28 (65.1%) | 19 (50.0%) |
| 55 to 64 Years | 58 (50.0%) | 96 (68.6%) |
| 65 to 74 Years | 41 (100.0%) | 18 (58.1%) |
| 75 Years and over | 26 (92.9%) | 50 (100.0%) |
| Total | 392 (68.3%) | 376 (54.5%) |
Income Below Poverty Among Married-Couple Families in St Stephen
The poverty statistics for married-couple families in St Stephen show that 22.6% or 49 of the total 217 families live below the poverty line. Families with 1 or 2 children have the highest poverty rate of 45.0%, comprising of 27 families. On the other hand, families with 3 or 4 children have the lowest poverty rate of 0.0%, which includes 0 families.
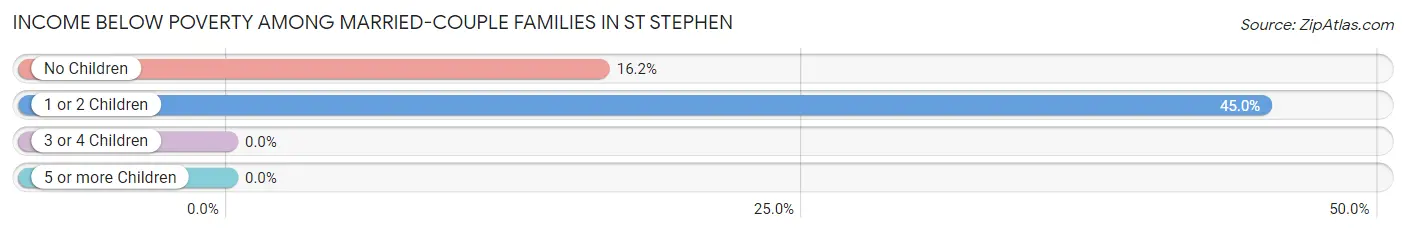
| Children | Above Poverty | Below Poverty |
| No Children | 114 (83.8%) | 22 (16.2%) |
| 1 or 2 Children | 33 (55.0%) | 27 (45.0%) |
| 3 or 4 Children | 21 (100.0%) | 0 (0.0%) |
| 5 or more Children | 0 (0.0%) | 0 (0.0%) |
| Total | 168 (77.4%) | 49 (22.6%) |
Income Below Poverty Among Single-Parent Households in St Stephen
According to the poverty data in St Stephen, 23.5% or 4 single-father households and 59.4% or 57 single-mother households are living below the poverty line. Among single-father households, those with no children have the highest poverty rate, with 4 households (57.1%) experiencing poverty. Likewise, among single-mother households, those with 3 or 4 children have the highest poverty rate, with 13 households (100.0%) falling below the poverty line.
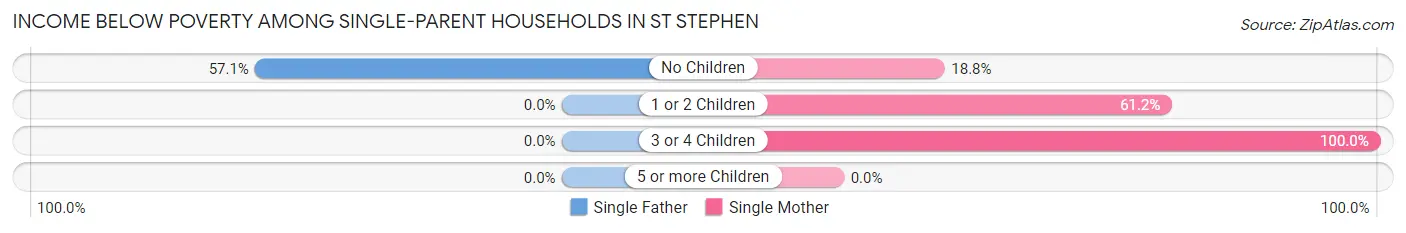
| Children | Single Father | Single Mother |
| No Children | 4 (57.1%) | 3 (18.8%) |
| 1 or 2 Children | 0 (0.0%) | 41 (61.2%) |
| 3 or 4 Children | 0 (0.0%) | 13 (100.0%) |
| 5 or more Children | 0 (0.0%) | 0 (0.0%) |
| Total | 4 (23.5%) | 57 (59.4%) |
Income Below Poverty Among Married-Couple vs Single-Parent Households in St Stephen
The poverty data for St Stephen shows that 49 of the married-couple family households (22.6%) and 61 of the single-parent households (54.0%) are living below the poverty level. Within the married-couple family households, those with 1 or 2 children have the highest poverty rate, with 27 households (45.0%) falling below the poverty line. Among the single-parent households, those with 3 or 4 children have the highest poverty rate, with 13 household (61.9%) living below poverty.
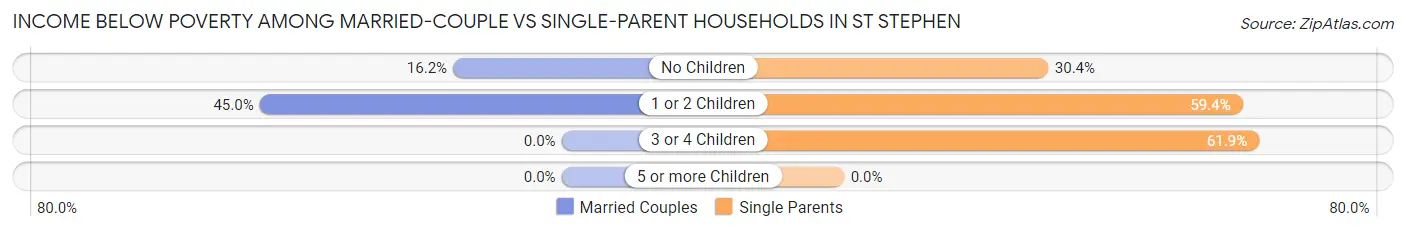
| Children | Married-Couple Families | Single-Parent Households |
| No Children | 22 (16.2%) | 7 (30.4%) |
| 1 or 2 Children | 27 (45.0%) | 41 (59.4%) |
| 3 or 4 Children | 0 (0.0%) | 13 (61.9%) |
| 5 or more Children | 0 (0.0%) | 0 (0.0%) |
| Total | 49 (22.6%) | 61 (54.0%) |
Race in St Stephen
The most populous races in St Stephen are White / Caucasian (774 | 55.8%), Black / African American (545 | 39.3%), and Two or more Races (67 | 4.8%).
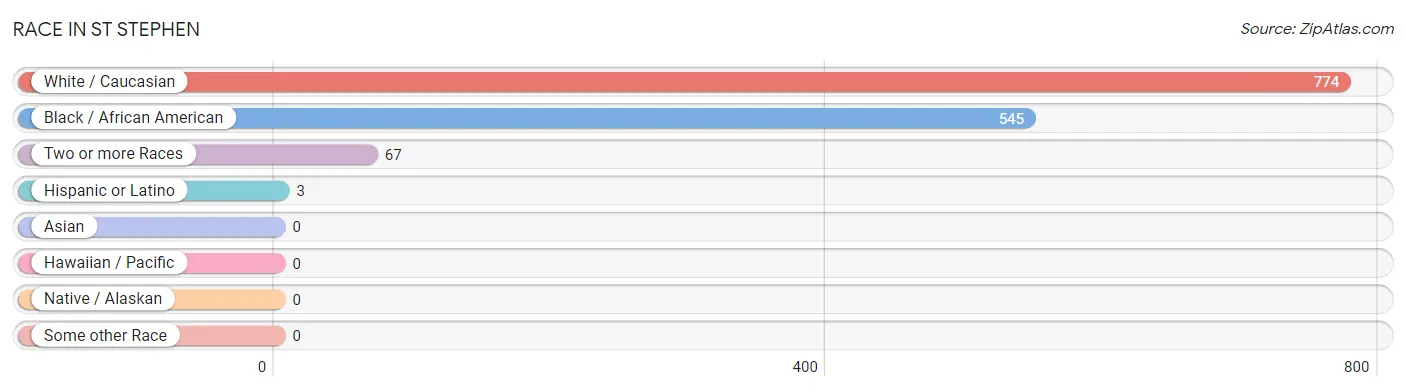
| Race | # Population | % Population |
| Asian | 0 | 0.0% |
| Black / African American | 545 | 39.3% |
| Hawaiian / Pacific | 0 | 0.0% |
| Hispanic or Latino | 3 | 0.2% |
| Native / Alaskan | 0 | 0.0% |
| White / Caucasian | 774 | 55.8% |
| Two or more Races | 67 | 4.8% |
| Some other Race | 0 | 0.0% |
| Total | 1,386 | 100.0% |
Ancestry in St Stephen
The most populous ancestries reported in St Stephen are American (172 | 12.4%), Irish (126 | 9.1%), German (65 | 4.7%), English (61 | 4.4%), and Scottish (22 | 1.6%), together accounting for 32.2% of all St Stephen residents.
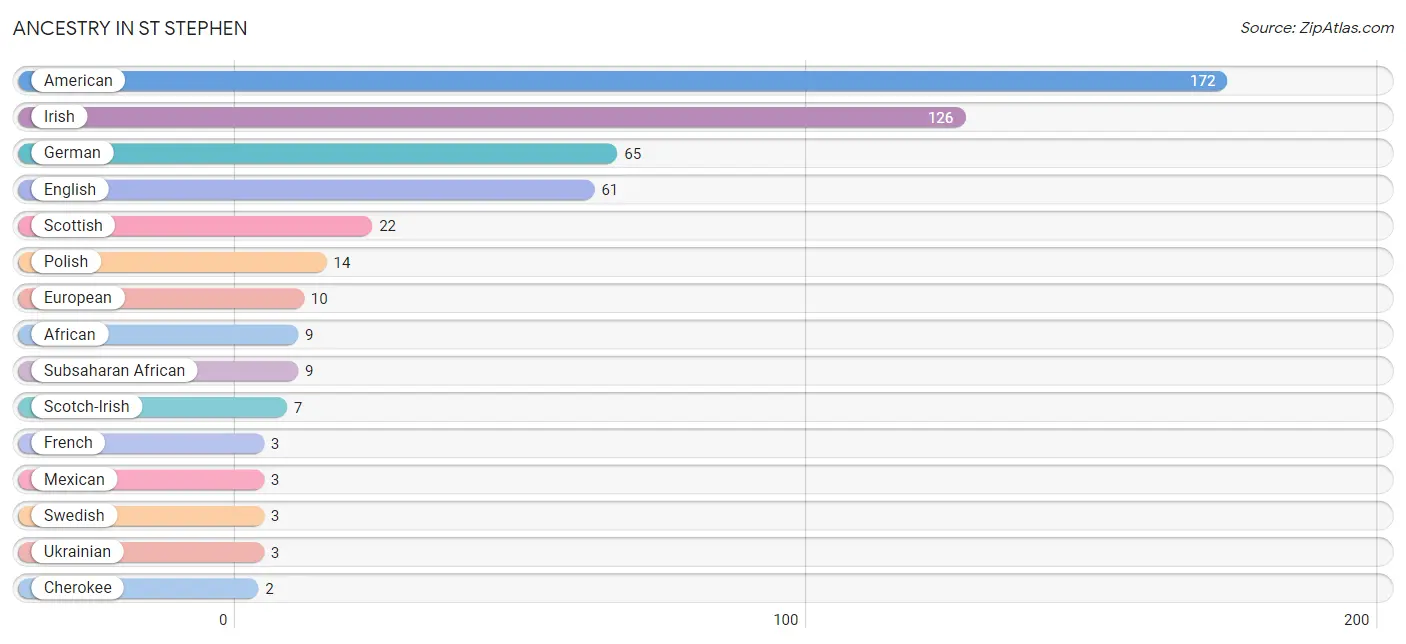
| Ancestry | # Population | % Population |
| African | 9 | 0.6% |
| American | 172 | 12.4% |
| Blackfeet | 1 | 0.1% |
| Cherokee | 2 | 0.1% |
| English | 61 | 4.4% |
| European | 10 | 0.7% |
| French | 3 | 0.2% |
| German | 65 | 4.7% |
| Irish | 126 | 9.1% |
| Mexican | 3 | 0.2% |
| Polish | 14 | 1.0% |
| Scotch-Irish | 7 | 0.5% |
| Scottish | 22 | 1.6% |
| Sioux | 2 | 0.1% |
| Subsaharan African | 9 | 0.6% |
| Swedish | 3 | 0.2% |
| Ukrainian | 3 | 0.2% | View All 17 Rows |
Immigrants in St Stephen
The most numerous immigrant groups reported in St Stephen came from Europe (10 | 0.7%), England (7 | 0.5%), Northern Europe (7 | 0.5%), Asia (3 | 0.2%), and Caribbean (3 | 0.2%), together accounting for 2.2% of all St Stephen residents.
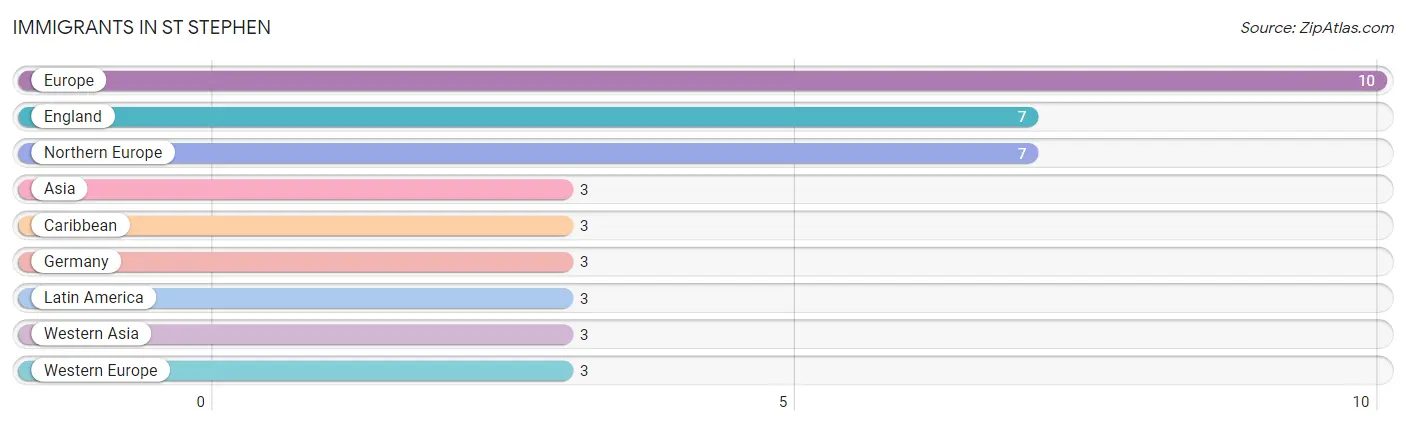
| Immigration Origin | # Population | % Population |
| Asia | 3 | 0.2% |
| Caribbean | 3 | 0.2% |
| England | 7 | 0.5% |
| Europe | 10 | 0.7% |
| Germany | 3 | 0.2% |
| Latin America | 3 | 0.2% |
| Northern Europe | 7 | 0.5% |
| Western Asia | 3 | 0.2% |
| Western Europe | 3 | 0.2% | View All 9 Rows |
Sex and Age in St Stephen
Sex and Age in St Stephen
The most populous age groups in St Stephen are 15 to 19 Years (86 | 13.7%) for men and Under 5 Years (98 | 12.9%) for women.
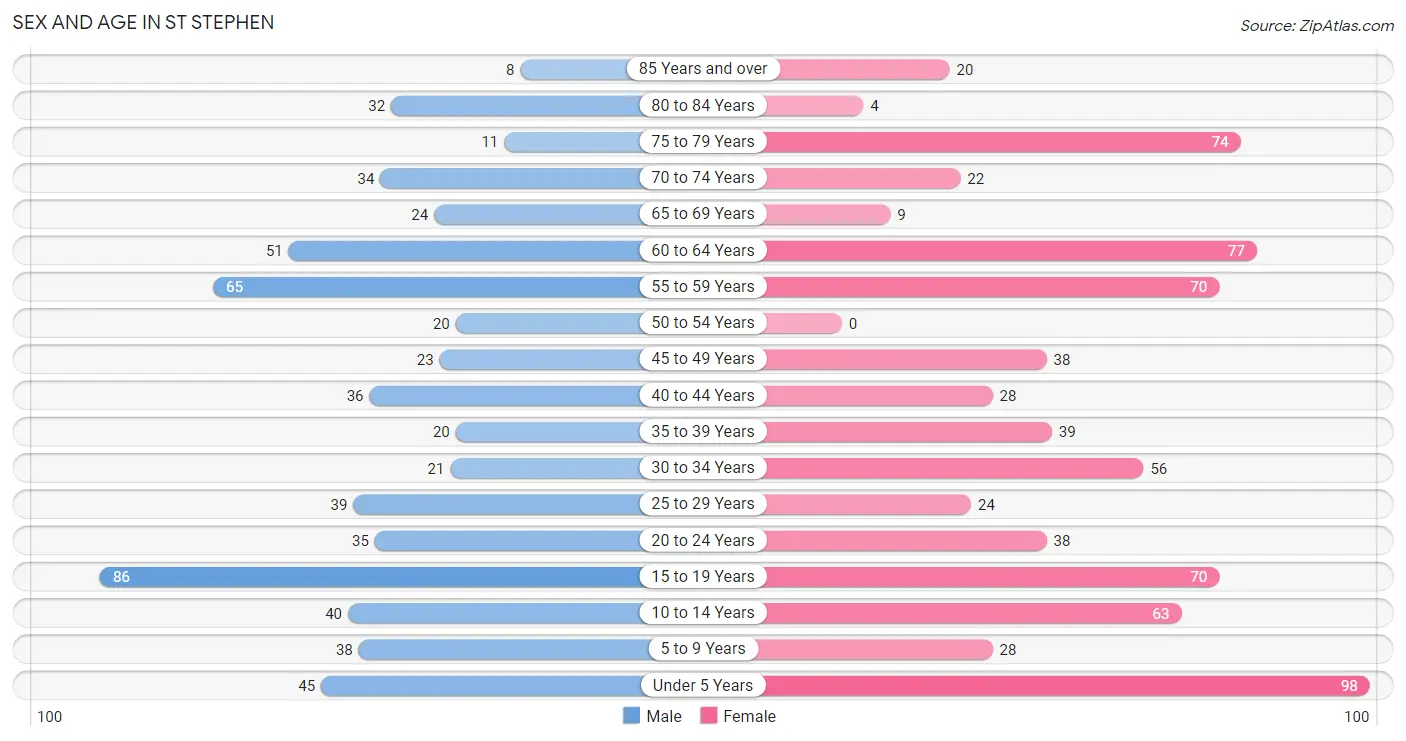
| Age Bracket | Male | Female |
| Under 5 Years | 45 (7.2%) | 98 (12.9%) |
| 5 to 9 Years | 38 (6.0%) | 28 (3.7%) |
| 10 to 14 Years | 40 (6.4%) | 63 (8.3%) |
| 15 to 19 Years | 86 (13.7%) | 70 (9.2%) |
| 20 to 24 Years | 35 (5.6%) | 38 (5.0%) |
| 25 to 29 Years | 39 (6.2%) | 24 (3.2%) |
| 30 to 34 Years | 21 (3.3%) | 56 (7.4%) |
| 35 to 39 Years | 20 (3.2%) | 39 (5.1%) |
| 40 to 44 Years | 36 (5.7%) | 28 (3.7%) |
| 45 to 49 Years | 23 (3.7%) | 38 (5.0%) |
| 50 to 54 Years | 20 (3.2%) | 0 (0.0%) |
| 55 to 59 Years | 65 (10.3%) | 70 (9.2%) |
| 60 to 64 Years | 51 (8.1%) | 77 (10.2%) |
| 65 to 69 Years | 24 (3.8%) | 9 (1.2%) |
| 70 to 74 Years | 34 (5.4%) | 22 (2.9%) |
| 75 to 79 Years | 11 (1.8%) | 74 (9.8%) |
| 80 to 84 Years | 32 (5.1%) | 4 (0.5%) |
| 85 Years and over | 8 (1.3%) | 20 (2.6%) |
| Total | 628 (100.0%) | 758 (100.0%) |
Families and Households in St Stephen
Median Family Size in St Stephen
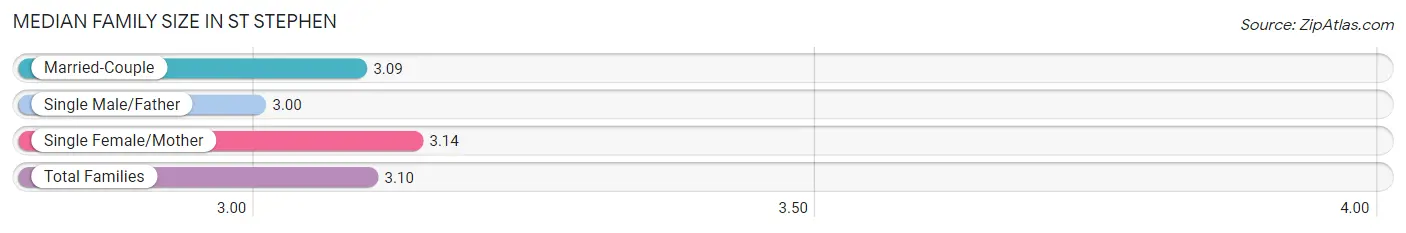
The median family size in St Stephen is 3.10 persons per family, with single female/mother families (96 | 29.1%) accounting for the largest median family size of 3.14 persons per family. On the other hand, single male/father families (17 | 5.1%) represent the smallest median family size with 3.00 persons per family.
| Family Type | # Families | Family Size |
| Married-Couple | 217 (65.8%) | 3.09 |
| Single Male/Father | 17 (5.1%) | 3.00 |
| Single Female/Mother | 96 (29.1%) | 3.14 |
| Total Families | 330 (100.0%) | 3.10 |
Median Household Size in St Stephen
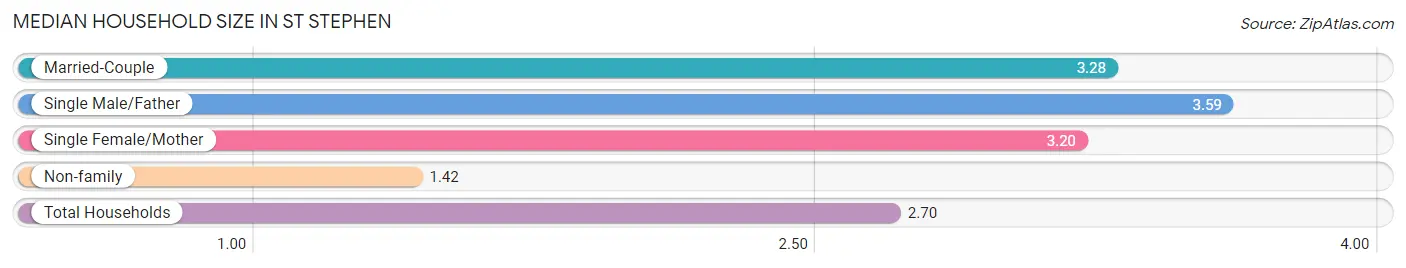
The median household size in St Stephen is 2.70 persons per household, with single male/father households (17 | 3.5%) accounting for the largest median household size of 3.59 persons per household. non-family households (149 | 31.1%) represent the smallest median household size with 1.42 persons per household.
| Household Type | # Households | Household Size |
| Married-Couple | 217 (45.3%) | 3.28 |
| Single Male/Father | 17 (3.5%) | 3.59 |
| Single Female/Mother | 96 (20.0%) | 3.20 |
| Non-family | 149 (31.1%) | 1.42 |
| Total Households | 479 (100.0%) | 2.70 |
Household Size by Marriage Status in St Stephen
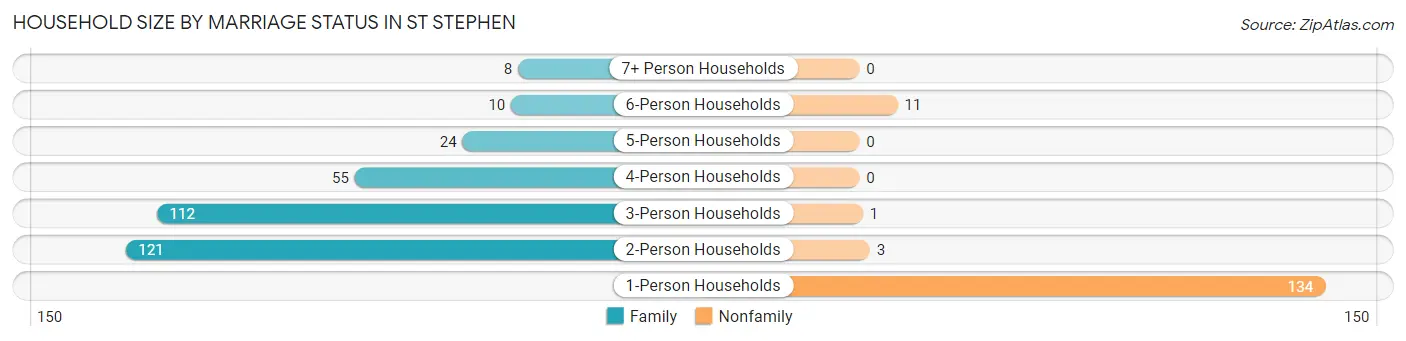
Out of a total of 479 households in St Stephen, 330 (68.9%) are family households, while 149 (31.1%) are nonfamily households. The most numerous type of family households are 2-person households, comprising 121, and the most common type of nonfamily households are 1-person households, comprising 134.
| Household Size | Family Households | Nonfamily Households |
| 1-Person Households | - | 134 (28.0%) |
| 2-Person Households | 121 (25.3%) | 3 (0.6%) |
| 3-Person Households | 112 (23.4%) | 1 (0.2%) |
| 4-Person Households | 55 (11.5%) | 0 (0.0%) |
| 5-Person Households | 24 (5.0%) | 0 (0.0%) |
| 6-Person Households | 10 (2.1%) | 11 (2.3%) |
| 7+ Person Households | 8 (1.7%) | 0 (0.0%) |
| Total | 330 (68.9%) | 149 (31.1%) |
Female Fertility in St Stephen
Fertility by Age in St Stephen
Average fertility rate in St Stephen is 157.0 births per 1,000 women. Women in the age bracket of 20 to 34 years have the highest fertility rate with 390.0 births per 1,000 women. Women in the age bracket of 20 to 34 years acount for 100.0% of all women with births.
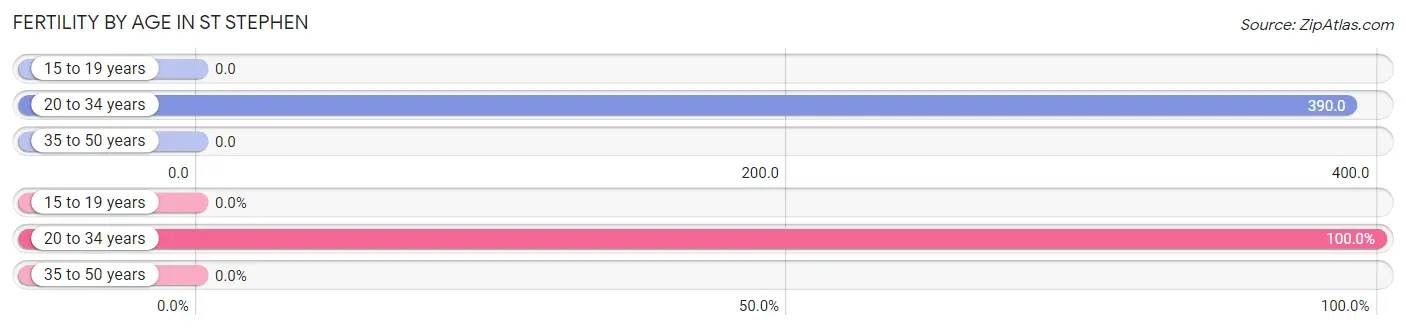
| Age Bracket | Women with Births | Births / 1,000 Women |
| 15 to 19 years | 0 (0.0%) | 0.0 |
| 20 to 34 years | 46 (100.0%) | 390.0 |
| 35 to 50 years | 0 (0.0%) | 0.0 |
| Total | 46 (100.0%) | 157.0 |
Fertility by Age by Marriage Status in St Stephen
21.7% of women with births (46) in St Stephen are married. The highest percentage of unmarried women with births falls into 20 to 34 years age bracket with 78.3% of them unmarried at the time of birth, while the lowest percentage of unmarried women with births belong to 20 to 34 years age bracket with 78.3% of them unmarried.
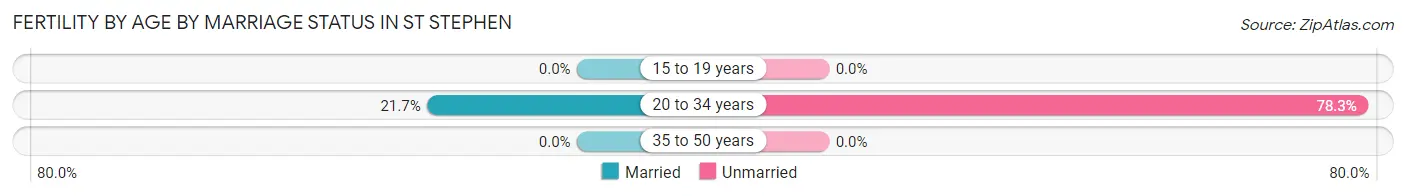
| Age Bracket | Married | Unmarried |
| 15 to 19 years | 0 (0.0%) | 0 (0.0%) |
| 20 to 34 years | 10 (21.7%) | 36 (78.3%) |
| 35 to 50 years | 0 (0.0%) | 0 (0.0%) |
| Total | 10 (21.7%) | 36 (78.3%) |
Fertility by Education in St Stephen
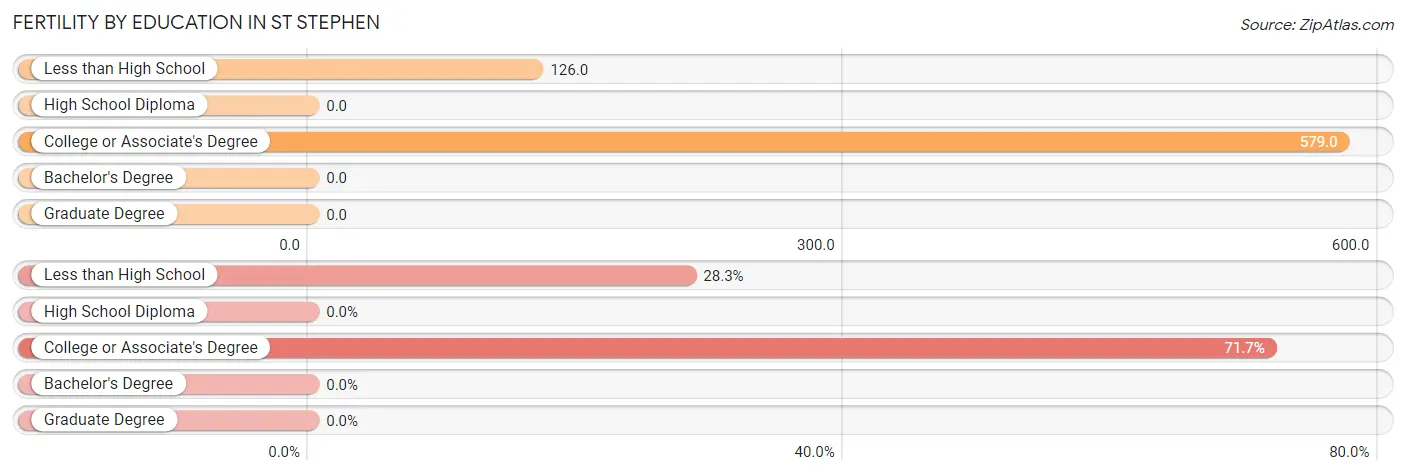
| Educational Attainment | Women with Births | Births / 1,000 Women |
| Less than High School | 13 (28.3%) | 126.0 |
| High School Diploma | 0 (0.0%) | 0.0 |
| College or Associate's Degree | 33 (71.7%) | 579.0 |
| Bachelor's Degree | 0 (0.0%) | 0.0 |
| Graduate Degree | 0 (0.0%) | 0.0 |
| Total | 46 (100.0%) | 157.0 |
Fertility by Education by Marriage Status in St Stephen
78.3% of women with births in St Stephen are unmarried. Women with the educational attainment of college or associate's degree are most likely to be married with 30.3% of them married at childbirth, while women with the educational attainment of less than high school are least likely to be married with 100.0% of them unmarried at childbirth.
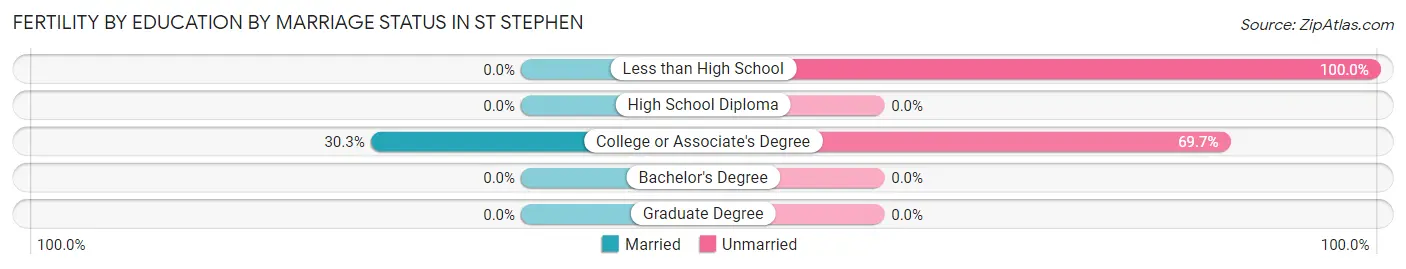
| Educational Attainment | Married | Unmarried |
| Less than High School | 0 (0.0%) | 13 (100.0%) |
| High School Diploma | 0 (0.0%) | 0 (0.0%) |
| College or Associate's Degree | 10 (30.3%) | 23 (69.7%) |
| Bachelor's Degree | 0 (0.0%) | 0 (0.0%) |
| Graduate Degree | 0 (0.0%) | 0 (0.0%) |
| Total | 10 (21.7%) | 36 (78.3%) |
Employment Characteristics in St Stephen
Employment by Class of Employer in St Stephen
Among the 358 employed individuals in St Stephen, private company employees (316 | 88.3%), self-employed (incorporated) (17 | 4.8%), and federal government employees (9 | 2.5%) make up the most common classes of employment.
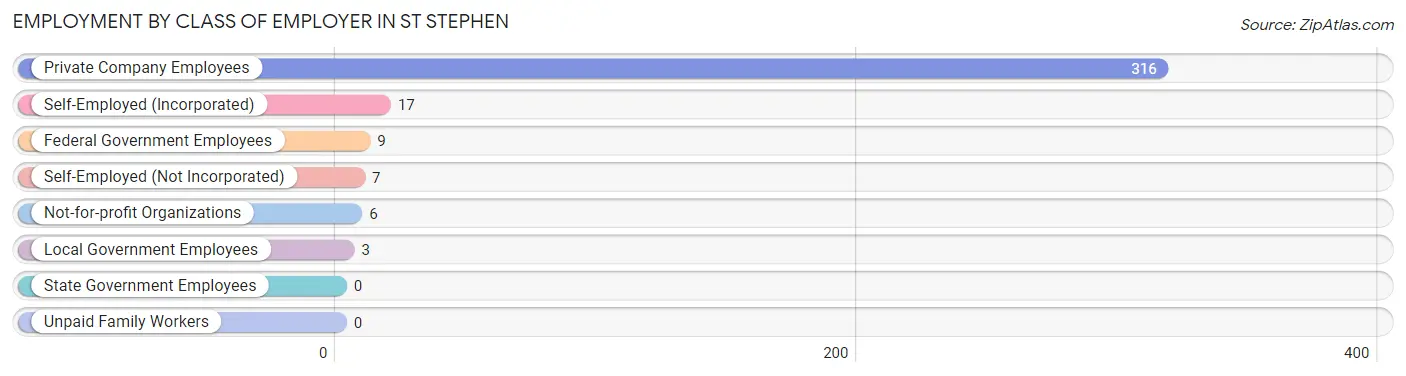
| Employer Class | # Employees | % Employees |
| Private Company Employees | 316 | 88.3% |
| Self-Employed (Incorporated) | 17 | 4.8% |
| Self-Employed (Not Incorporated) | 7 | 2.0% |
| Not-for-profit Organizations | 6 | 1.7% |
| Local Government Employees | 3 | 0.8% |
| State Government Employees | 0 | 0.0% |
| Federal Government Employees | 9 | 2.5% |
| Unpaid Family Workers | 0 | 0.0% |
| Total | 358 | 100.0% |
Employment Status by Age in St Stephen
According to the labor force statistics for St Stephen, out of the total population over 16 years of age (1,034), 39.2% or 405 individuals are in the labor force, with 8.4% or 34 of them unemployed. The age group with the highest labor force participation rate is 25 to 29 years, with 82.5% or 52 individuals in the labor force. Within the labor force, the 65 to 74 years age range has the highest percentage of unemployed individuals, with 23.1% or 3 of them being unemployed.
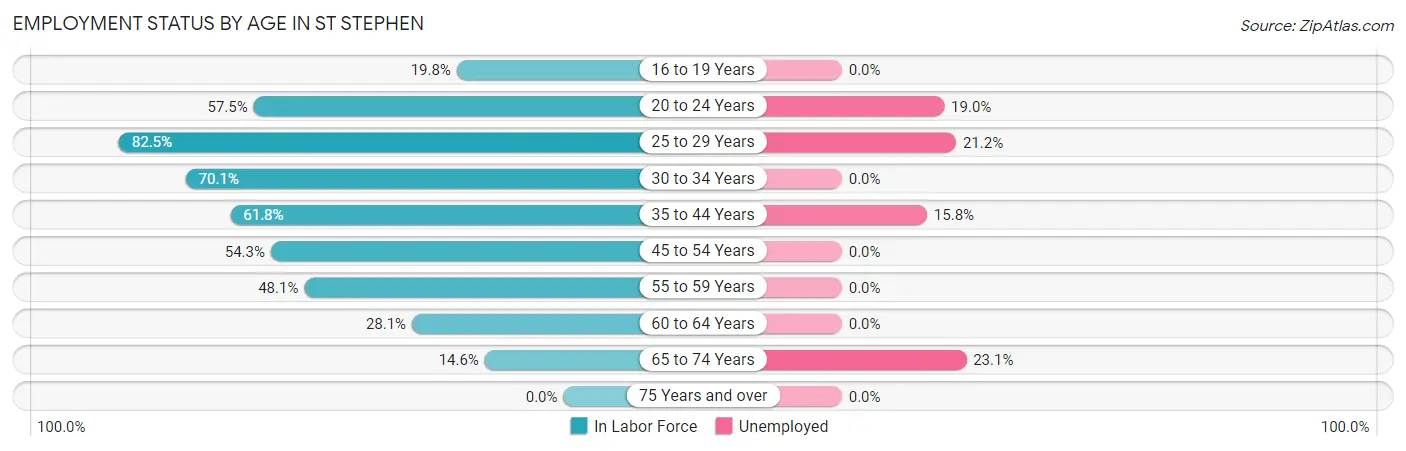
| Age Bracket | In Labor Force | Unemployed |
| 16 to 19 Years | 23 (19.8%) | 0 (0.0%) |
| 20 to 24 Years | 42 (57.5%) | 8 (19.0%) |
| 25 to 29 Years | 52 (82.5%) | 11 (21.2%) |
| 30 to 34 Years | 54 (70.1%) | 0 (0.0%) |
| 35 to 44 Years | 76 (61.8%) | 12 (15.8%) |
| 45 to 54 Years | 44 (54.3%) | 0 (0.0%) |
| 55 to 59 Years | 65 (48.1%) | 0 (0.0%) |
| 60 to 64 Years | 36 (28.1%) | 0 (0.0%) |
| 65 to 74 Years | 13 (14.6%) | 3 (23.1%) |
| 75 Years and over | 0 (0.0%) | 0 (0.0%) |
| Total | 405 (39.2%) | 34 (8.4%) |
Employment Status by Educational Attainment in St Stephen
According to labor force statistics for St Stephen, 53.9% of individuals (327) out of the total population between 25 and 64 years of age (607) are in the labor force, with 7.0% or 23 of them being unemployed. The group with the highest labor force participation rate are those with the educational attainment of bachelor's degree or higher, with 100.0% or 70 individuals in the labor force. Within the labor force, individuals with high school diploma education have the highest percentage of unemployment, with 10.0% or 12 of them being unemployed.
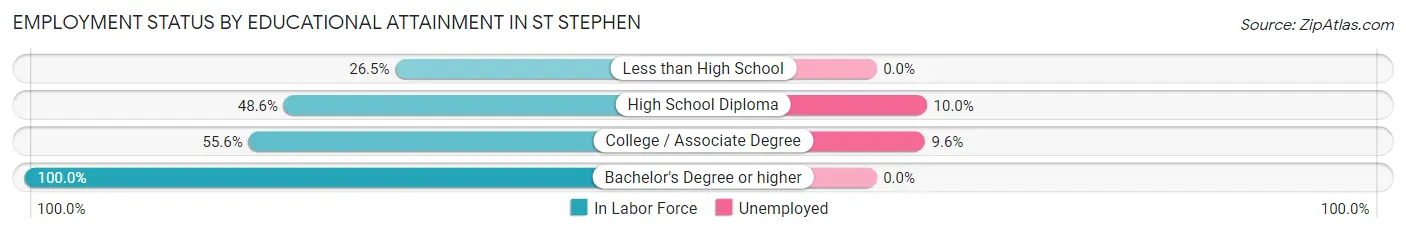
| Educational Attainment | In Labor Force | Unemployed |
| Less than High School | 22 (26.5%) | 0 (0.0%) |
| High School Diploma | 120 (48.6%) | 25 (10.0%) |
| College / Associate Degree | 115 (55.6%) | 20 (9.6%) |
| Bachelor's Degree or higher | 70 (100.0%) | 0 (0.0%) |
| Total | 327 (53.9%) | 42 (7.0%) |
Employment Occupations by Sex in St Stephen
Management, Business, Science and Arts Occupations
The most common Management, Business, Science and Arts occupations in St Stephen are Health Diagnosing & Treating (29 | 7.8%), Community & Social Service (17 | 4.6%), Management (15 | 4.0%), Education Instruction & Library (11 | 3.0%), and Computers, Engineering & Science (3 | 0.8%).
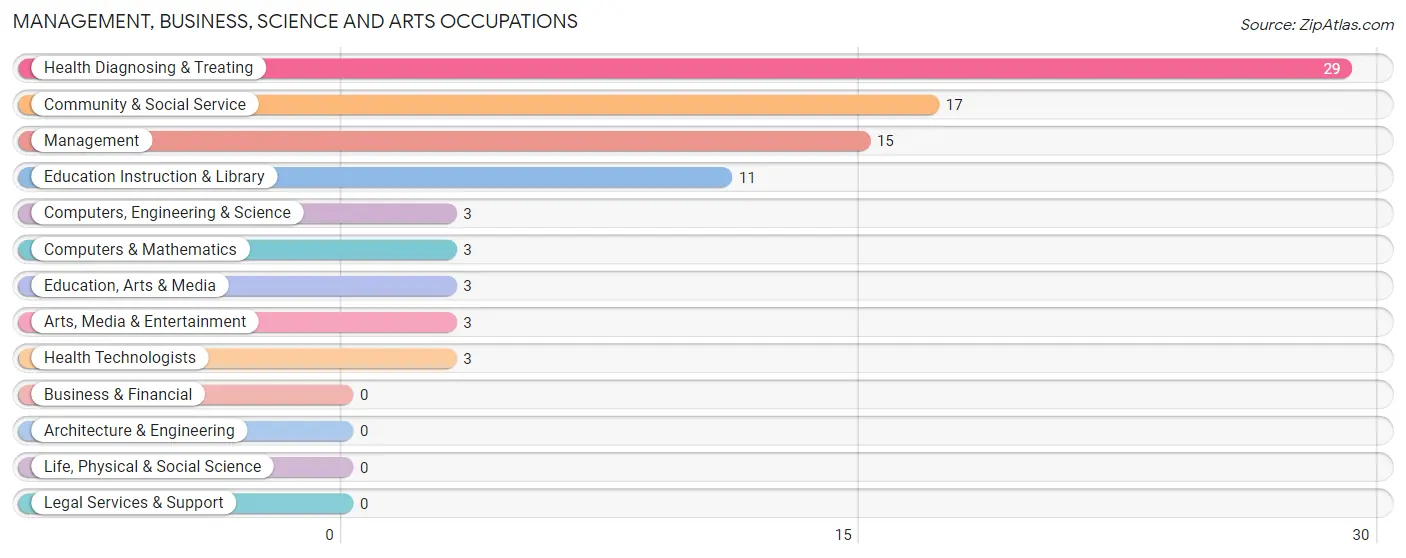
Management, Business, Science and Arts Occupations by Sex
Within the Management, Business, Science and Arts occupations in St Stephen, the most male-oriented occupations are Management (100.0%), Computers, Engineering & Science (100.0%), and Computers & Mathematics (100.0%), while the most female-oriented occupations are Community & Social Service (100.0%), Education, Arts & Media (100.0%), and Education Instruction & Library (100.0%).
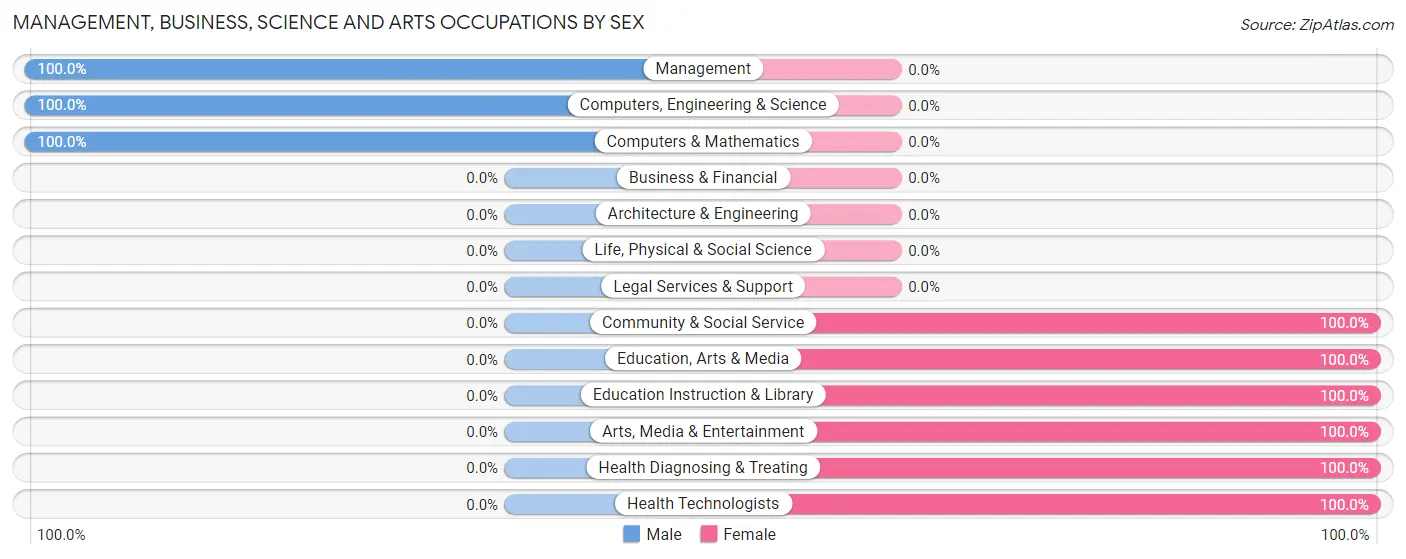
| Occupation | Male | Female |
| Management | 15 (100.0%) | 0 (0.0%) |
| Business & Financial | 0 (0.0%) | 0 (0.0%) |
| Computers, Engineering & Science | 3 (100.0%) | 0 (0.0%) |
| Computers & Mathematics | 3 (100.0%) | 0 (0.0%) |
| Architecture & Engineering | 0 (0.0%) | 0 (0.0%) |
| Life, Physical & Social Science | 0 (0.0%) | 0 (0.0%) |
| Community & Social Service | 0 (0.0%) | 17 (100.0%) |
| Education, Arts & Media | 0 (0.0%) | 3 (100.0%) |
| Legal Services & Support | 0 (0.0%) | 0 (0.0%) |
| Education Instruction & Library | 0 (0.0%) | 11 (100.0%) |
| Arts, Media & Entertainment | 0 (0.0%) | 3 (100.0%) |
| Health Diagnosing & Treating | 0 (0.0%) | 29 (100.0%) |
| Health Technologists | 0 (0.0%) | 3 (100.0%) |
| Total (Category) | 18 (28.1%) | 46 (71.9%) |
| Total (Overall) | 214 (57.7%) | 157 (42.3%) |
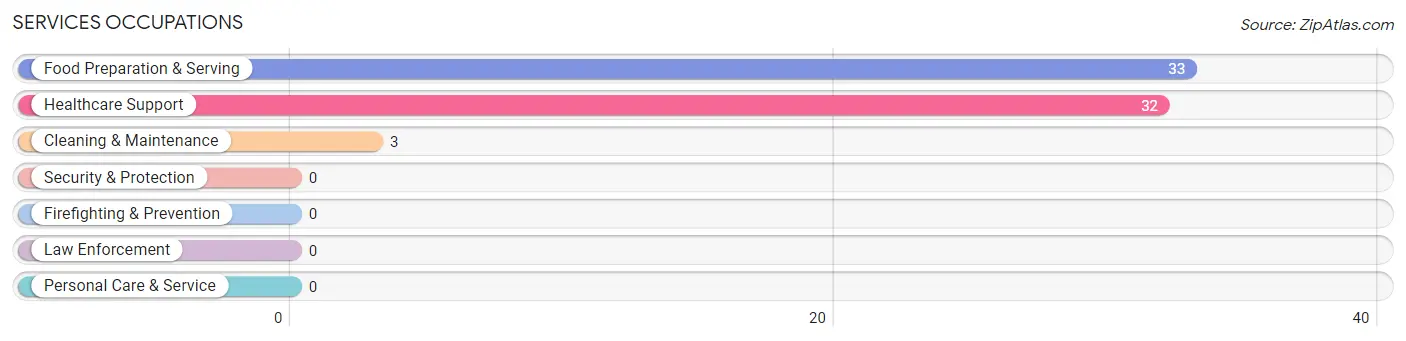
Services Occupations
The most common Services occupations in St Stephen are Food Preparation & Serving (33 | 8.9%), Healthcare Support (32 | 8.6%), and Cleaning & Maintenance (3 | 0.8%).
Services Occupations by Sex
Within the Services occupations in St Stephen, the most male-oriented occupations are Cleaning & Maintenance (100.0%), and Food Preparation & Serving (9.1%), while the most female-oriented occupations are Healthcare Support (100.0%), and Food Preparation & Serving (90.9%).
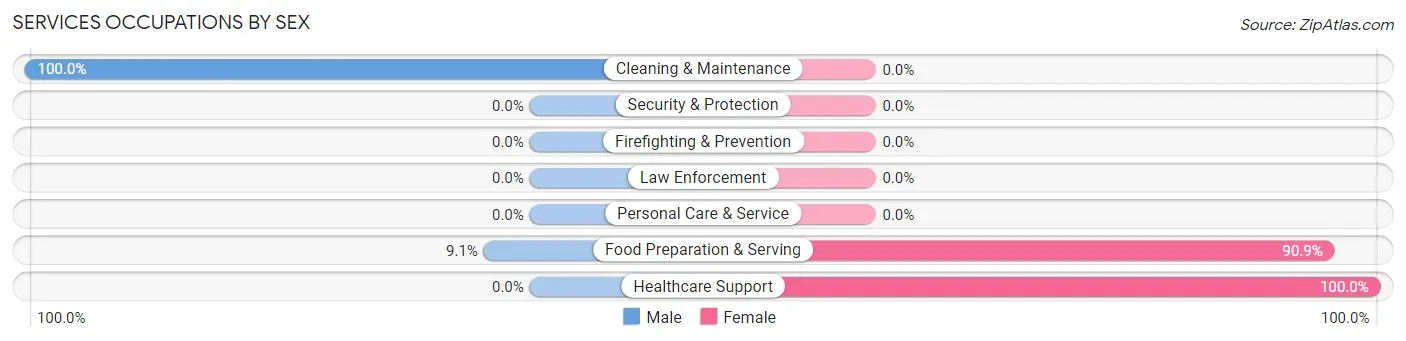
| Occupation | Male | Female |
| Healthcare Support | 0 (0.0%) | 32 (100.0%) |
| Security & Protection | 0 (0.0%) | 0 (0.0%) |
| Firefighting & Prevention | 0 (0.0%) | 0 (0.0%) |
| Law Enforcement | 0 (0.0%) | 0 (0.0%) |
| Food Preparation & Serving | 3 (9.1%) | 30 (90.9%) |
| Cleaning & Maintenance | 3 (100.0%) | 0 (0.0%) |
| Personal Care & Service | 0 (0.0%) | 0 (0.0%) |
| Total (Category) | 6 (8.8%) | 62 (91.2%) |
| Total (Overall) | 214 (57.7%) | 157 (42.3%) |
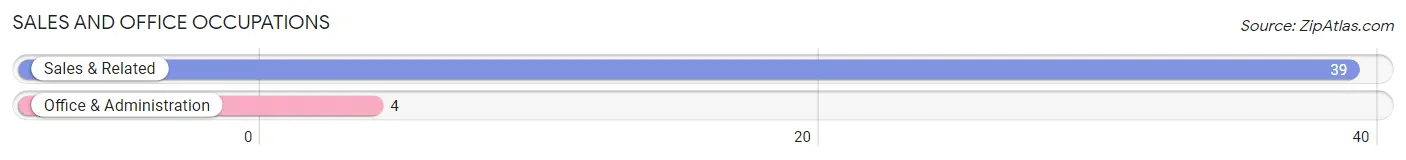
Sales and Office Occupations
The most common Sales and Office occupations in St Stephen are Sales & Related (39 | 10.5%), and Office & Administration (4 | 1.1%).
Sales and Office Occupations by Sex
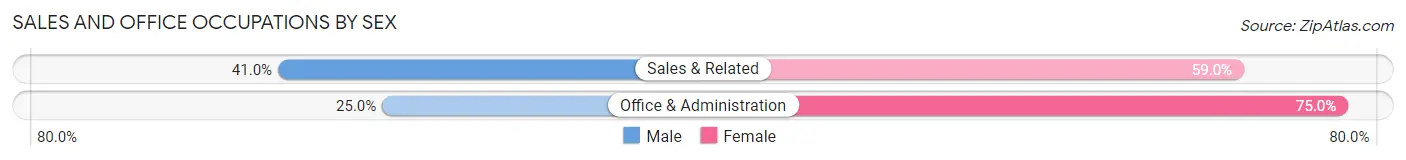
| Occupation | Male | Female |
| Sales & Related | 16 (41.0%) | 23 (59.0%) |
| Office & Administration | 1 (25.0%) | 3 (75.0%) |
| Total (Category) | 17 (39.5%) | 26 (60.5%) |
| Total (Overall) | 214 (57.7%) | 157 (42.3%) |
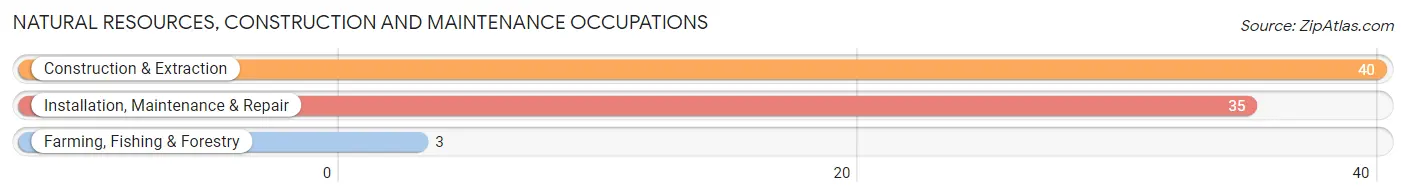
Natural Resources, Construction and Maintenance Occupations
The most common Natural Resources, Construction and Maintenance occupations in St Stephen are Construction & Extraction (40 | 10.8%), Installation, Maintenance & Repair (35 | 9.4%), and Farming, Fishing & Forestry (3 | 0.8%).
Natural Resources, Construction and Maintenance Occupations by Sex
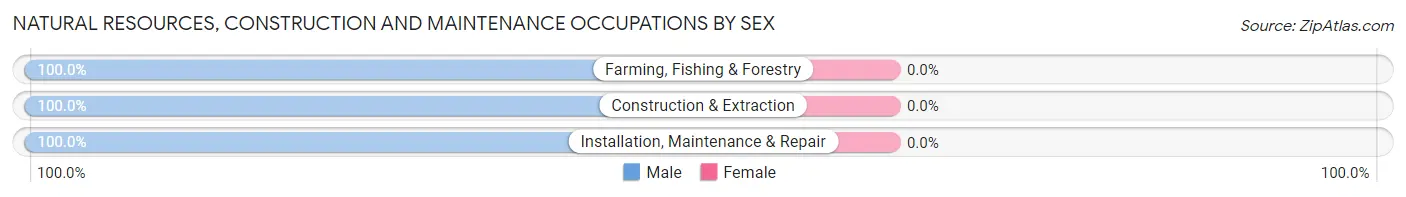
| Occupation | Male | Female |
| Farming, Fishing & Forestry | 3 (100.0%) | 0 (0.0%) |
| Construction & Extraction | 40 (100.0%) | 0 (0.0%) |
| Installation, Maintenance & Repair | 35 (100.0%) | 0 (0.0%) |
| Total (Category) | 78 (100.0%) | 0 (0.0%) |
| Total (Overall) | 214 (57.7%) | 157 (42.3%) |
Production, Transportation and Moving Occupations
The most common Production, Transportation and Moving occupations in St Stephen are Production (111 | 29.9%), and Transportation (7 | 1.9%).
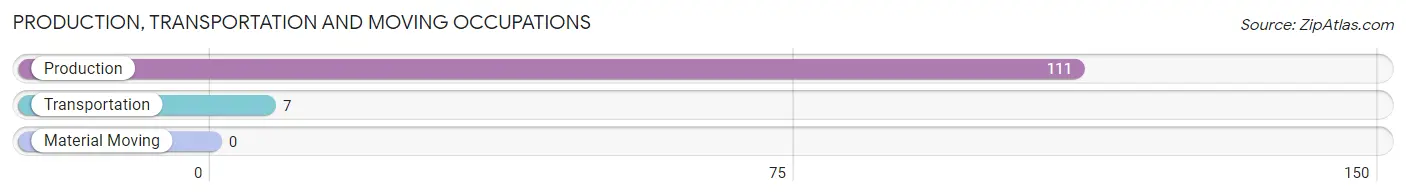
Production, Transportation and Moving Occupations by Sex
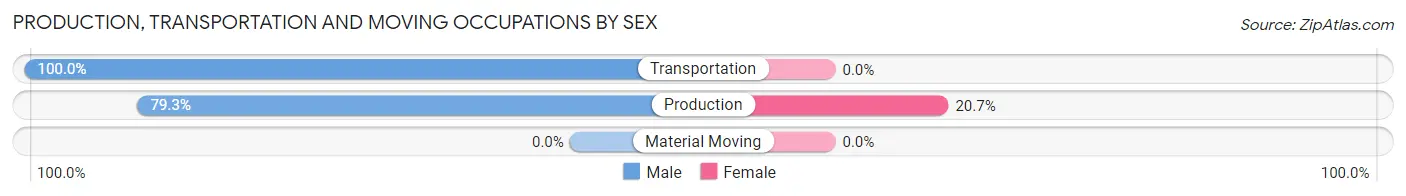
| Occupation | Male | Female |
| Production | 88 (79.3%) | 23 (20.7%) |
| Transportation | 7 (100.0%) | 0 (0.0%) |
| Material Moving | 0 (0.0%) | 0 (0.0%) |
| Total (Category) | 95 (80.5%) | 23 (19.5%) |
| Total (Overall) | 214 (57.7%) | 157 (42.3%) |
Employment Industries by Sex in St Stephen
Employment Industries in St Stephen
The major employment industries in St Stephen include Manufacturing (90 | 24.3%), Health Care & Social Assistance (79 | 21.3%), Construction (53 | 14.3%), Professional & Scientific (35 | 9.4%), and Accommodation & Food Services (30 | 8.1%).
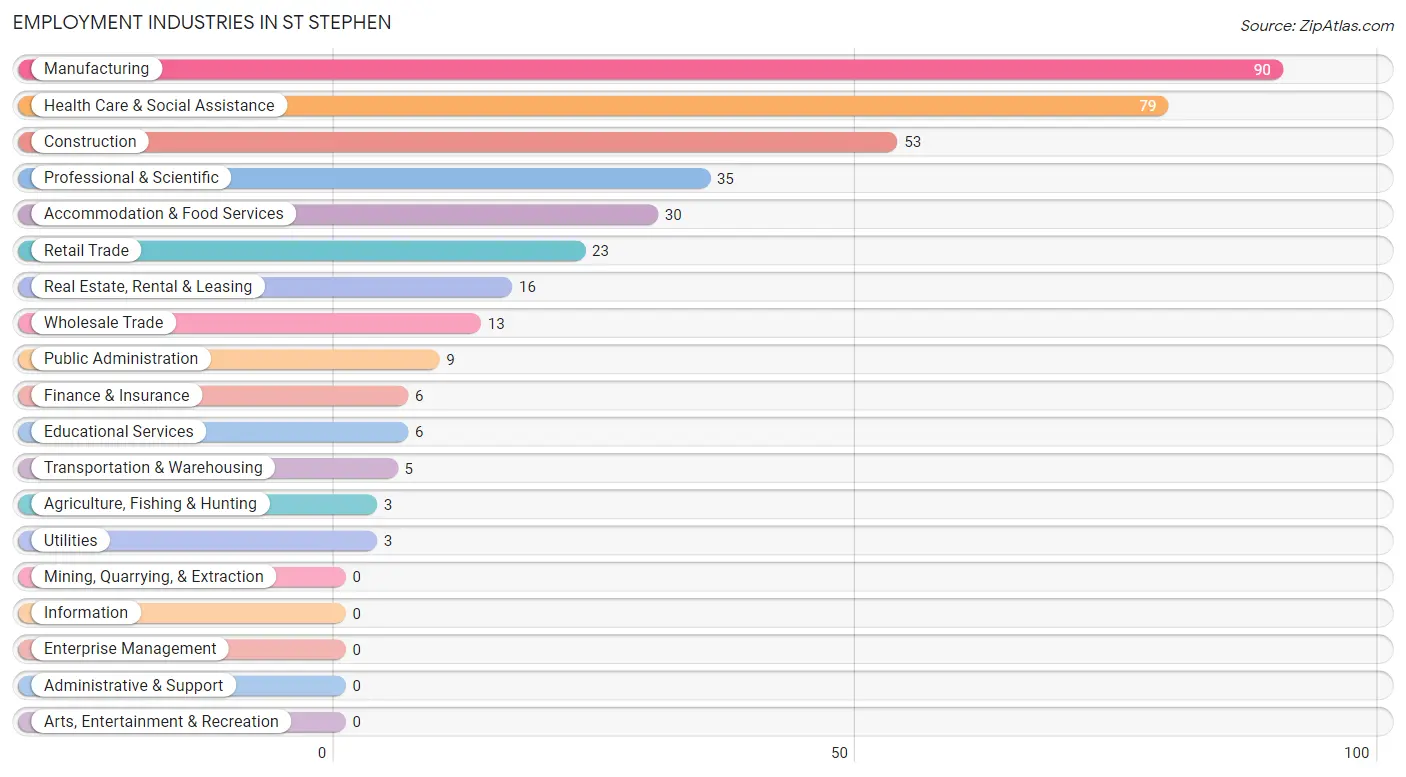
Employment Industries by Sex in St Stephen
The St Stephen industries that see more men than women are Agriculture, Fishing & Hunting (100.0%), Construction (100.0%), and Manufacturing (100.0%), whereas the industries that tend to have a higher number of women are Educational Services (100.0%), Health Care & Social Assistance (94.9%), and Accommodation & Food Services (90.0%).

| Industry | Male | Female |
| Agriculture, Fishing & Hunting | 3 (100.0%) | 0 (0.0%) |
| Mining, Quarrying, & Extraction | 0 (0.0%) | 0 (0.0%) |
| Construction | 53 (100.0%) | 0 (0.0%) |
| Manufacturing | 90 (100.0%) | 0 (0.0%) |
| Wholesale Trade | 13 (100.0%) | 0 (0.0%) |
| Retail Trade | 6 (26.1%) | 17 (73.9%) |
| Transportation & Warehousing | 5 (100.0%) | 0 (0.0%) |
| Utilities | 3 (100.0%) | 0 (0.0%) |
| Information | 0 (0.0%) | 0 (0.0%) |
| Finance & Insurance | 6 (100.0%) | 0 (0.0%) |
| Real Estate, Rental & Leasing | 7 (43.8%) | 9 (56.2%) |
| Professional & Scientific | 12 (34.3%) | 23 (65.7%) |
| Enterprise Management | 0 (0.0%) | 0 (0.0%) |
| Administrative & Support | 0 (0.0%) | 0 (0.0%) |
| Educational Services | 0 (0.0%) | 6 (100.0%) |
| Health Care & Social Assistance | 4 (5.1%) | 75 (94.9%) |
| Arts, Entertainment & Recreation | 0 (0.0%) | 0 (0.0%) |
| Accommodation & Food Services | 3 (10.0%) | 27 (90.0%) |
| Public Administration | 9 (100.0%) | 0 (0.0%) |
| Total | 214 (57.7%) | 157 (42.3%) |
Education in St Stephen
School Enrollment in St Stephen
The most common levels of schooling among the 329 students in St Stephen are high school (132 | 40.1%), middle school (93 | 28.3%), and elementary school (43 | 13.1%).
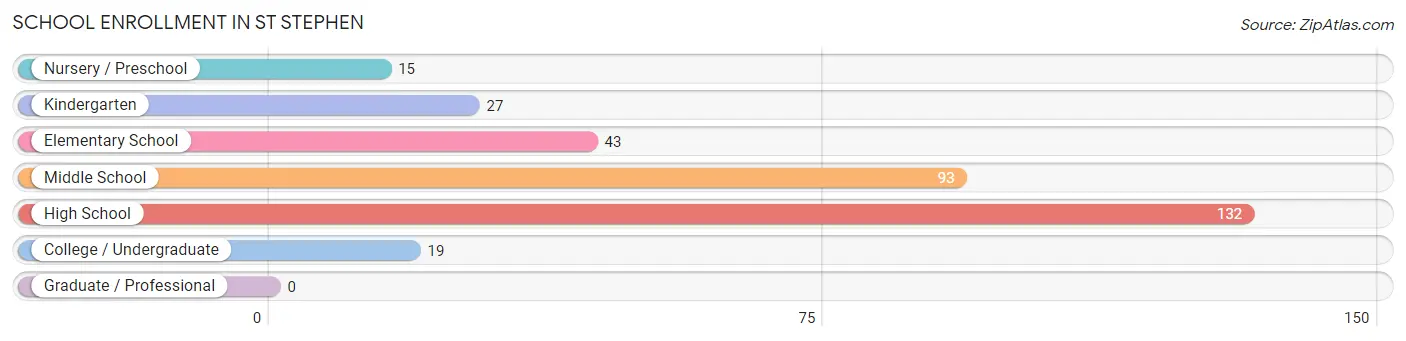
| School Level | # Students | % Students |
| Nursery / Preschool | 15 | 4.6% |
| Kindergarten | 27 | 8.2% |
| Elementary School | 43 | 13.1% |
| Middle School | 93 | 28.3% |
| High School | 132 | 40.1% |
| College / Undergraduate | 19 | 5.8% |
| Graduate / Professional | 0 | 0.0% |
| Total | 329 | 100.0% |
School Enrollment by Age by Funding Source in St Stephen
Out of a total of 329 students who are enrolled in schools in St Stephen, 33 (10.0%) attend a private institution, while the remaining 296 (90.0%) are enrolled in public schools. The age group of 15 to 17 year olds has the highest likelihood of being enrolled in private schools, with 17 (22.1% in the age bracket) enrolled. Conversely, the age group of 3 to 4 year olds has the lowest likelihood of being enrolled in a private school, with 22 (100.0% in the age bracket) attending a public institution.
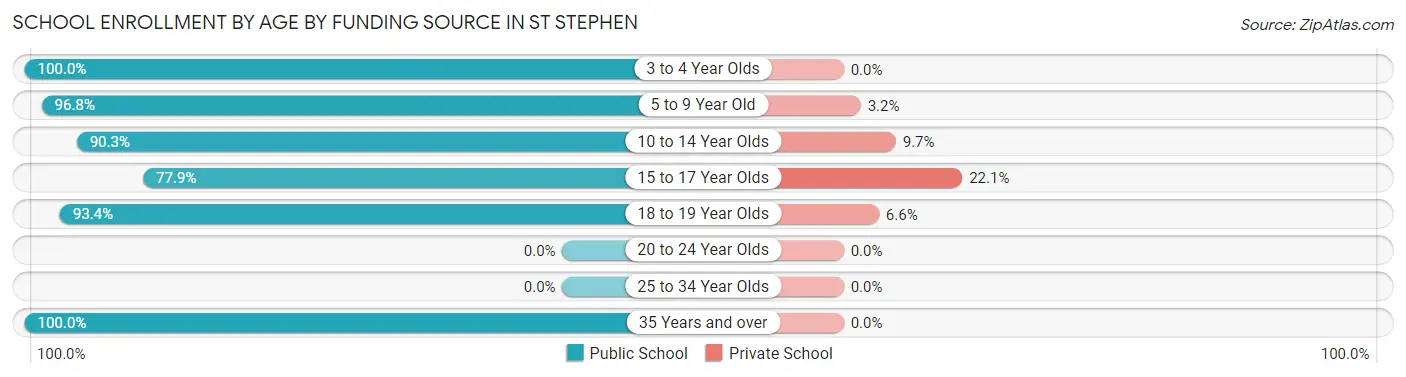
| Age Bracket | Public School | Private School |
| 3 to 4 Year Olds | 22 (100.0%) | 0 (0.0%) |
| 5 to 9 Year Old | 61 (96.8%) | 2 (3.2%) |
| 10 to 14 Year Olds | 93 (90.3%) | 10 (9.7%) |
| 15 to 17 Year Olds | 60 (77.9%) | 17 (22.1%) |
| 18 to 19 Year Olds | 57 (93.4%) | 4 (6.6%) |
| 20 to 24 Year Olds | 0 (0.0%) | 0 (0.0%) |
| 25 to 34 Year Olds | 0 (0.0%) | 0 (0.0%) |
| 35 Years and over | 3 (100.0%) | 0 (0.0%) |
| Total | 296 (90.0%) | 33 (10.0%) |
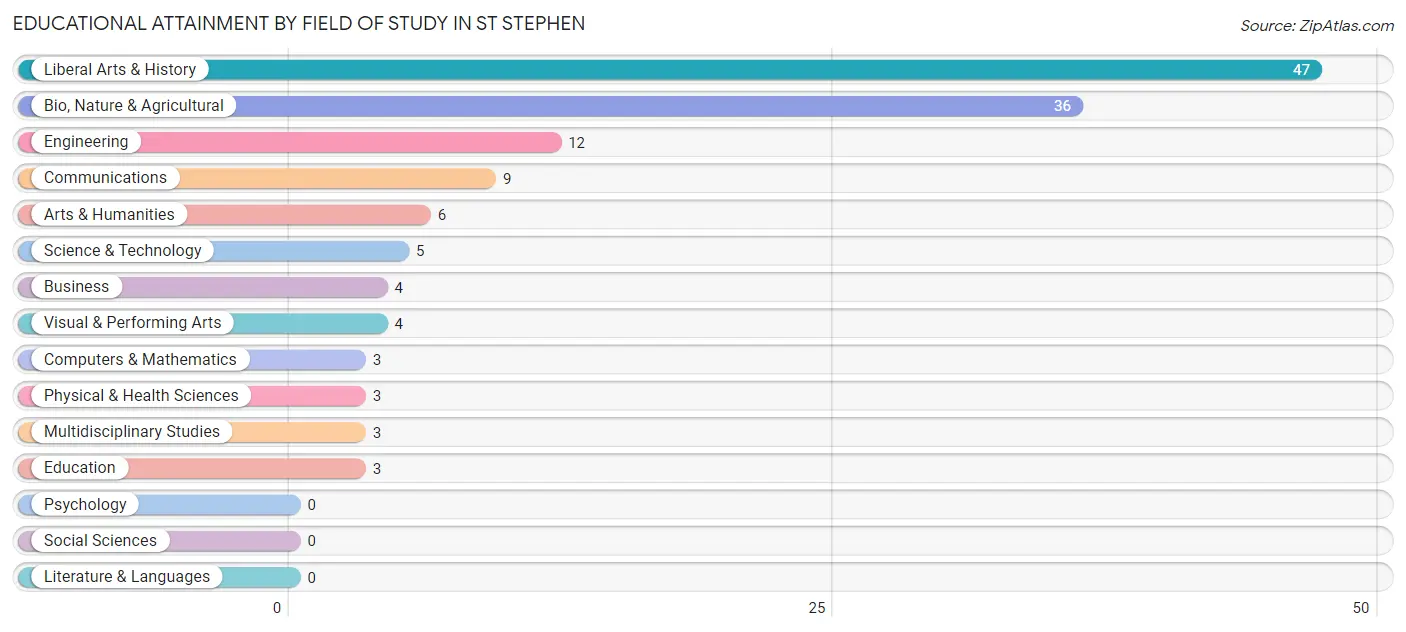
Educational Attainment by Field of Study in St Stephen
Liberal arts & history (47 | 34.8%), bio, nature & agricultural (36 | 26.7%), engineering (12 | 8.9%), communications (9 | 6.7%), and arts & humanities (6 | 4.4%) are the most common fields of study among 135 individuals in St Stephen who have obtained a bachelor's degree or higher.
| Field of Study | # Graduates | % Graduates |
| Computers & Mathematics | 3 | 2.2% |
| Bio, Nature & Agricultural | 36 | 26.7% |
| Physical & Health Sciences | 3 | 2.2% |
| Psychology | 0 | 0.0% |
| Social Sciences | 0 | 0.0% |
| Engineering | 12 | 8.9% |
| Multidisciplinary Studies | 3 | 2.2% |
| Science & Technology | 5 | 3.7% |
| Business | 4 | 3.0% |
| Education | 3 | 2.2% |
| Literature & Languages | 0 | 0.0% |
| Liberal Arts & History | 47 | 34.8% |
| Visual & Performing Arts | 4 | 3.0% |
| Communications | 9 | 6.7% |
| Arts & Humanities | 6 | 4.4% |
| Total | 135 | 100.0% |
Transportation & Commute in St Stephen
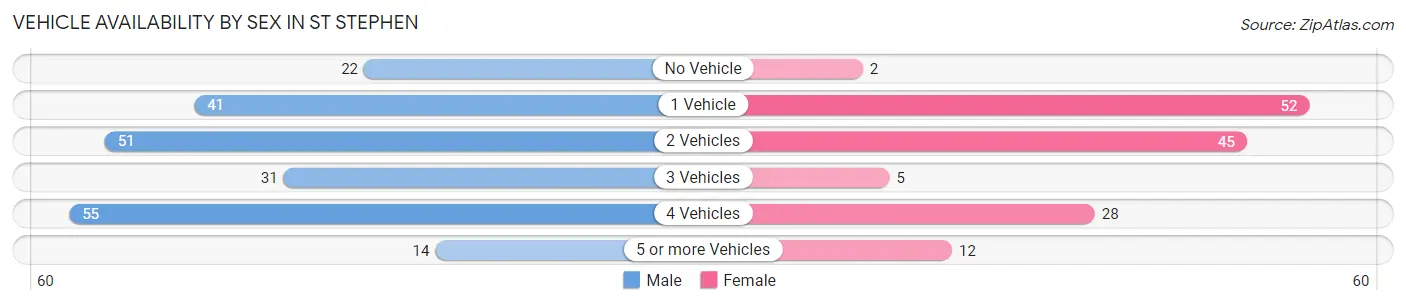
Vehicle Availability by Sex in St Stephen
The most prevalent vehicle ownership categories in St Stephen are males with 4 vehicles (55, accounting for 25.7%) and females with 4 vehicles (28, making up 38.2%).
| Vehicles Available | Male | Female |
| No Vehicle | 22 (10.3%) | 2 (1.4%) |
| 1 Vehicle | 41 (19.2%) | 52 (36.1%) |
| 2 Vehicles | 51 (23.8%) | 45 (31.2%) |
| 3 Vehicles | 31 (14.5%) | 5 (3.5%) |
| 4 Vehicles | 55 (25.7%) | 28 (19.4%) |
| 5 or more Vehicles | 14 (6.5%) | 12 (8.3%) |
| Total | 214 (100.0%) | 144 (100.0%) |
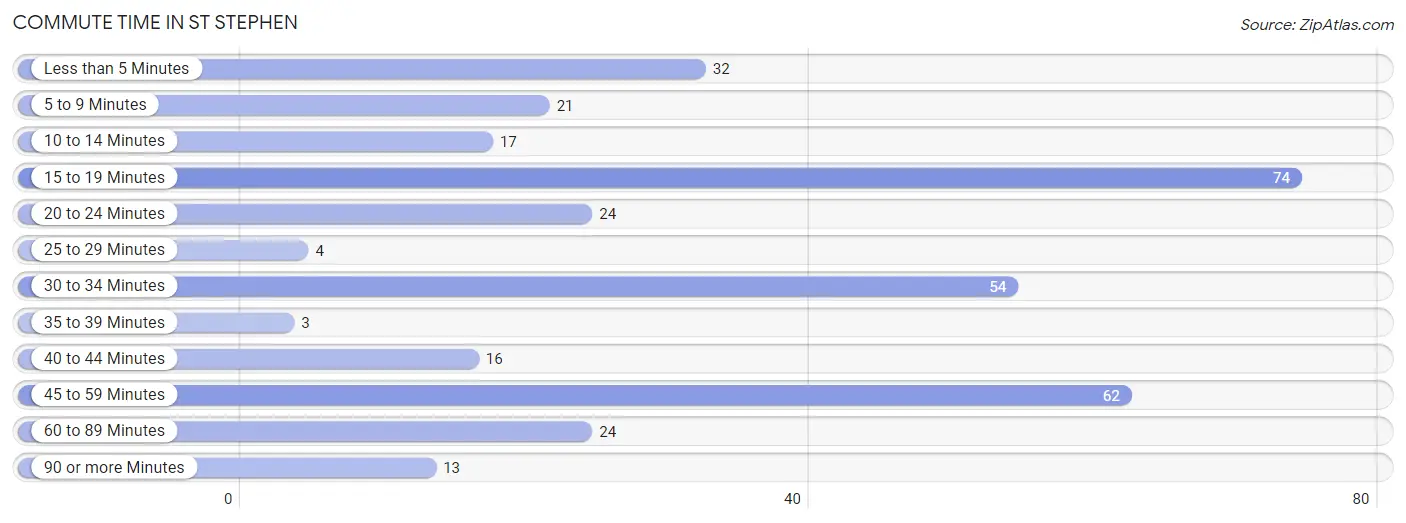
Commute Time in St Stephen
The most frequently occuring commute durations in St Stephen are 15 to 19 minutes (74 commuters, 21.5%), 45 to 59 minutes (62 commuters, 18.0%), and 30 to 34 minutes (54 commuters, 15.7%).
| Commute Time | # Commuters | % Commuters |
| Less than 5 Minutes | 32 | 9.3% |
| 5 to 9 Minutes | 21 | 6.1% |
| 10 to 14 Minutes | 17 | 4.9% |
| 15 to 19 Minutes | 74 | 21.5% |
| 20 to 24 Minutes | 24 | 7.0% |
| 25 to 29 Minutes | 4 | 1.2% |
| 30 to 34 Minutes | 54 | 15.7% |
| 35 to 39 Minutes | 3 | 0.9% |
| 40 to 44 Minutes | 16 | 4.6% |
| 45 to 59 Minutes | 62 | 18.0% |
| 60 to 89 Minutes | 24 | 7.0% |
| 90 or more Minutes | 13 | 3.8% |
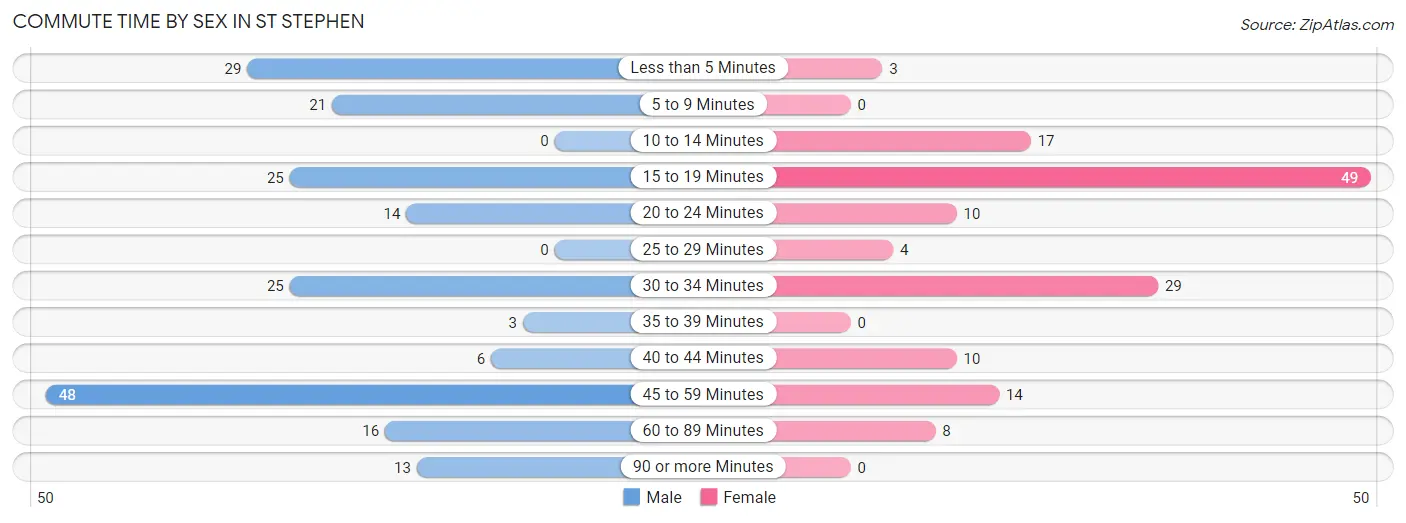
Commute Time by Sex in St Stephen
The most common commute times in St Stephen are 45 to 59 minutes (48 commuters, 24.0%) for males and 15 to 19 minutes (49 commuters, 34.0%) for females.
| Commute Time | Male | Female |
| Less than 5 Minutes | 29 (14.5%) | 3 (2.1%) |
| 5 to 9 Minutes | 21 (10.5%) | 0 (0.0%) |
| 10 to 14 Minutes | 0 (0.0%) | 17 (11.8%) |
| 15 to 19 Minutes | 25 (12.5%) | 49 (34.0%) |
| 20 to 24 Minutes | 14 (7.0%) | 10 (6.9%) |
| 25 to 29 Minutes | 0 (0.0%) | 4 (2.8%) |
| 30 to 34 Minutes | 25 (12.5%) | 29 (20.1%) |
| 35 to 39 Minutes | 3 (1.5%) | 0 (0.0%) |
| 40 to 44 Minutes | 6 (3.0%) | 10 (6.9%) |
| 45 to 59 Minutes | 48 (24.0%) | 14 (9.7%) |
| 60 to 89 Minutes | 16 (8.0%) | 8 (5.6%) |
| 90 or more Minutes | 13 (6.5%) | 0 (0.0%) |
Time of Departure to Work by Sex in St Stephen
The most frequent times of departure to work in St Stephen are 7:00 AM to 7:29 AM (63, 31.5%) for males and 7:00 AM to 7:29 AM (45, 31.2%) for females.
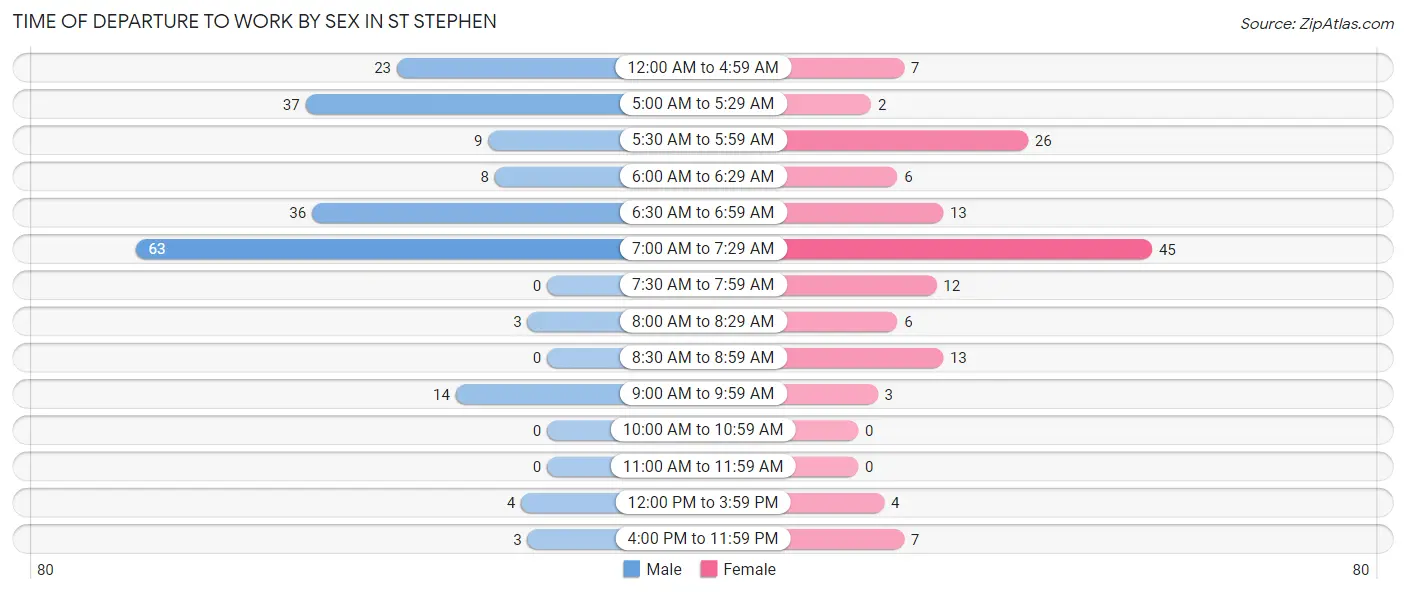
| Time of Departure | Male | Female |
| 12:00 AM to 4:59 AM | 23 (11.5%) | 7 (4.9%) |
| 5:00 AM to 5:29 AM | 37 (18.5%) | 2 (1.4%) |
| 5:30 AM to 5:59 AM | 9 (4.5%) | 26 (18.1%) |
| 6:00 AM to 6:29 AM | 8 (4.0%) | 6 (4.2%) |
| 6:30 AM to 6:59 AM | 36 (18.0%) | 13 (9.0%) |
| 7:00 AM to 7:29 AM | 63 (31.5%) | 45 (31.2%) |
| 7:30 AM to 7:59 AM | 0 (0.0%) | 12 (8.3%) |
| 8:00 AM to 8:29 AM | 3 (1.5%) | 6 (4.2%) |
| 8:30 AM to 8:59 AM | 0 (0.0%) | 13 (9.0%) |
| 9:00 AM to 9:59 AM | 14 (7.0%) | 3 (2.1%) |
| 10:00 AM to 10:59 AM | 0 (0.0%) | 0 (0.0%) |
| 11:00 AM to 11:59 AM | 0 (0.0%) | 0 (0.0%) |
| 12:00 PM to 3:59 PM | 4 (2.0%) | 4 (2.8%) |
| 4:00 PM to 11:59 PM | 3 (1.5%) | 7 (4.9%) |
| Total | 200 (100.0%) | 144 (100.0%) |
Housing Occupancy in St Stephen
Occupancy by Ownership in St Stephen
Of the total 479 dwellings in St Stephen, owner-occupied units account for 268 (55.9%), while renter-occupied units make up 211 (44.1%).
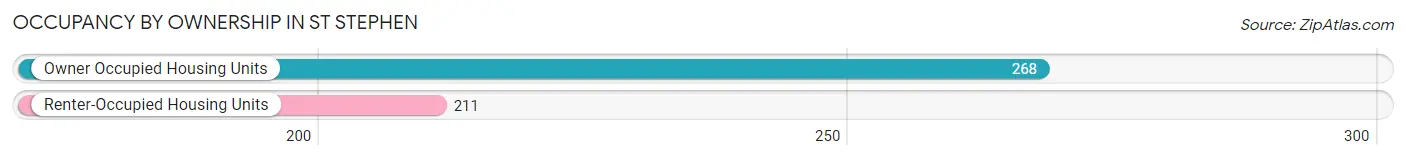
| Occupancy | # Housing Units | % Housing Units |
| Owner Occupied Housing Units | 268 | 55.9% |
| Renter-Occupied Housing Units | 211 | 44.1% |
| Total Occupied Housing Units | 479 | 100.0% |
Occupancy by Household Size in St Stephen
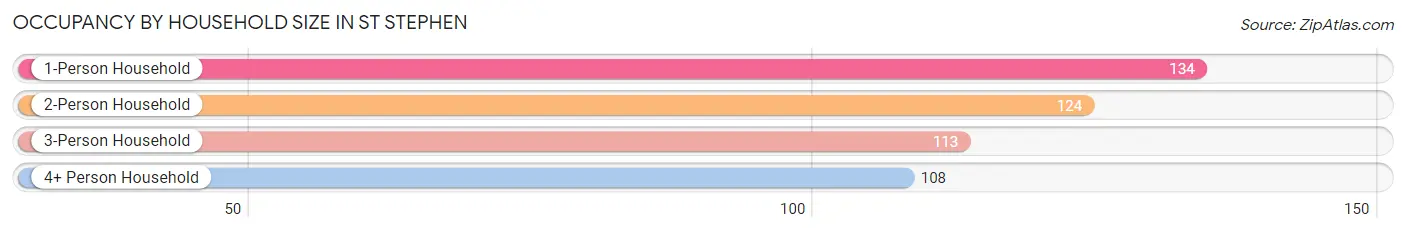
| Household Size | # Housing Units | % Housing Units |
| 1-Person Household | 134 | 28.0% |
| 2-Person Household | 124 | 25.9% |
| 3-Person Household | 113 | 23.6% |
| 4+ Person Household | 108 | 22.6% |
| Total Housing Units | 479 | 100.0% |
Occupancy by Ownership by Household Size in St Stephen
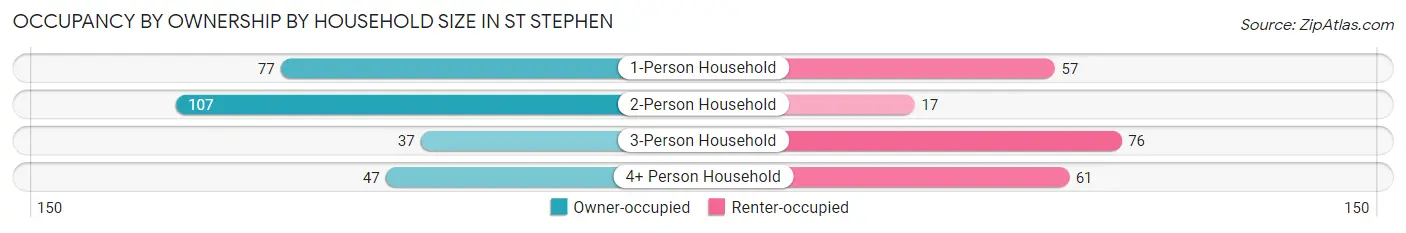
| Household Size | Owner-occupied | Renter-occupied |
| 1-Person Household | 77 (57.5%) | 57 (42.5%) |
| 2-Person Household | 107 (86.3%) | 17 (13.7%) |
| 3-Person Household | 37 (32.7%) | 76 (67.3%) |
| 4+ Person Household | 47 (43.5%) | 61 (56.5%) |
| Total Housing Units | 268 (55.9%) | 211 (44.1%) |
Occupancy by Educational Attainment in St Stephen
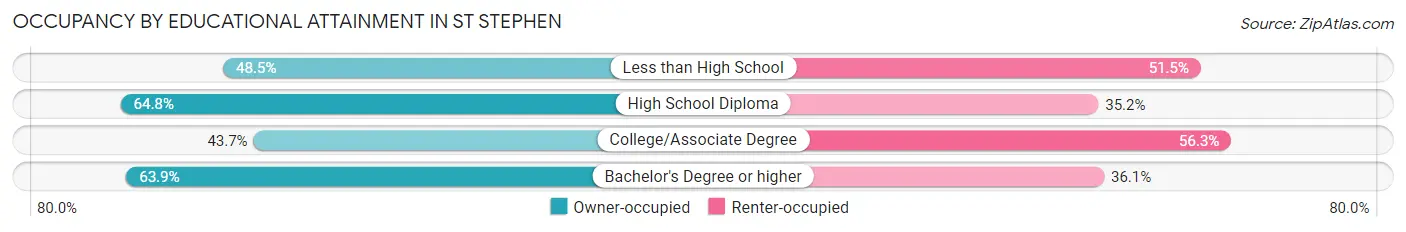
| Household Size | Owner-occupied | Renter-occupied |
| Less than High School | 49 (48.5%) | 52 (51.5%) |
| High School Diploma | 114 (64.8%) | 62 (35.2%) |
| College/Associate Degree | 52 (43.7%) | 67 (56.3%) |
| Bachelor's Degree or higher | 53 (63.9%) | 30 (36.1%) |
Occupancy by Age of Householder in St Stephen
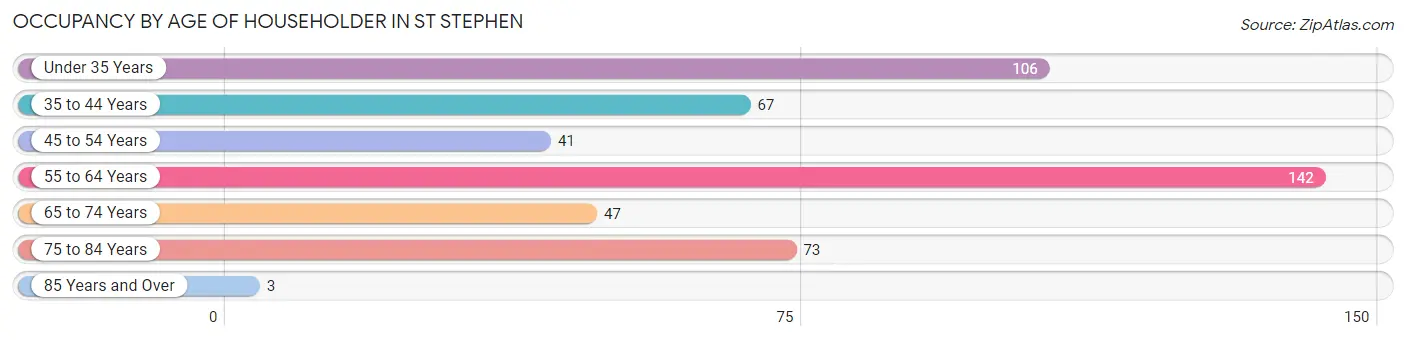
| Age Bracket | # Households | % Households |
| Under 35 Years | 106 | 22.1% |
| 35 to 44 Years | 67 | 14.0% |
| 45 to 54 Years | 41 | 8.6% |
| 55 to 64 Years | 142 | 29.6% |
| 65 to 74 Years | 47 | 9.8% |
| 75 to 84 Years | 73 | 15.2% |
| 85 Years and Over | 3 | 0.6% |
| Total | 479 | 100.0% |
Housing Finances in St Stephen
Median Income by Occupancy in St Stephen
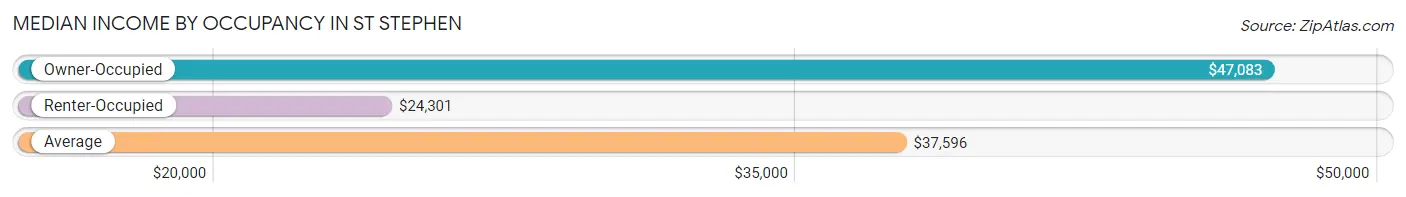
| Occupancy Type | # Households | Median Income |
| Owner-Occupied | 268 (55.9%) | $47,083 |
| Renter-Occupied | 211 (44.1%) | $24,301 |
| Average | 479 (100.0%) | $37,596 |
Occupancy by Householder Income Bracket in St Stephen
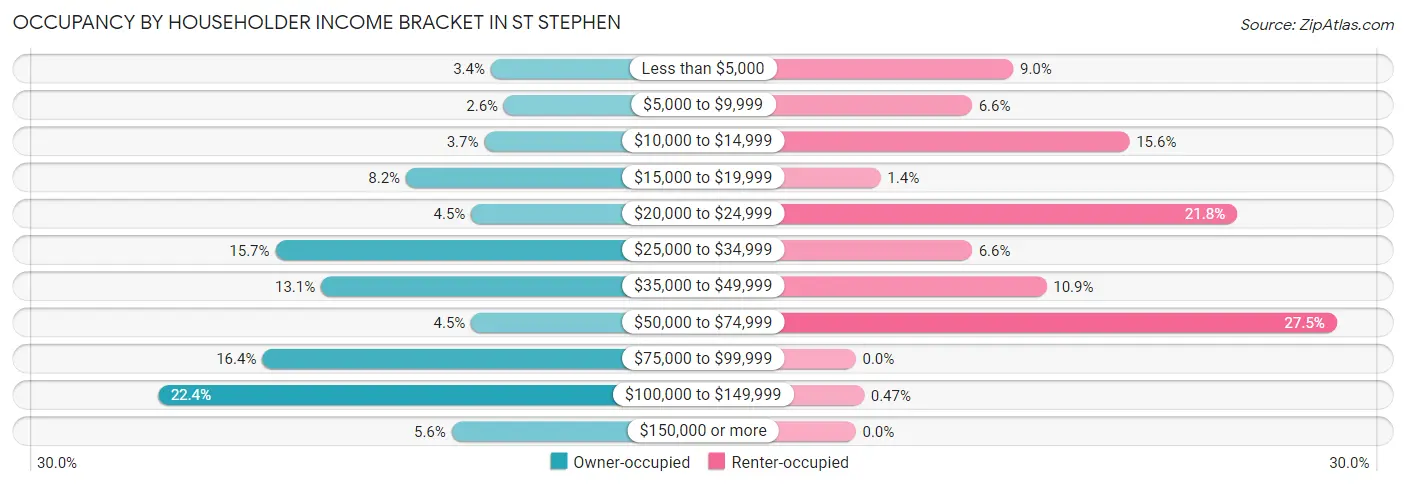
| Income Bracket | Owner-occupied | Renter-occupied |
| Less than $5,000 | 9 (3.4%) | 19 (9.0%) |
| $5,000 to $9,999 | 7 (2.6%) | 14 (6.6%) |
| $10,000 to $14,999 | 10 (3.7%) | 33 (15.6%) |
| $15,000 to $19,999 | 22 (8.2%) | 3 (1.4%) |
| $20,000 to $24,999 | 12 (4.5%) | 46 (21.8%) |
| $25,000 to $34,999 | 42 (15.7%) | 14 (6.6%) |
| $35,000 to $49,999 | 35 (13.1%) | 23 (10.9%) |
| $50,000 to $74,999 | 12 (4.5%) | 58 (27.5%) |
| $75,000 to $99,999 | 44 (16.4%) | 0 (0.0%) |
| $100,000 to $149,999 | 60 (22.4%) | 1 (0.5%) |
| $150,000 or more | 15 (5.6%) | 0 (0.0%) |
| Total | 268 (100.0%) | 211 (100.0%) |
Monthly Housing Cost Tiers in St Stephen
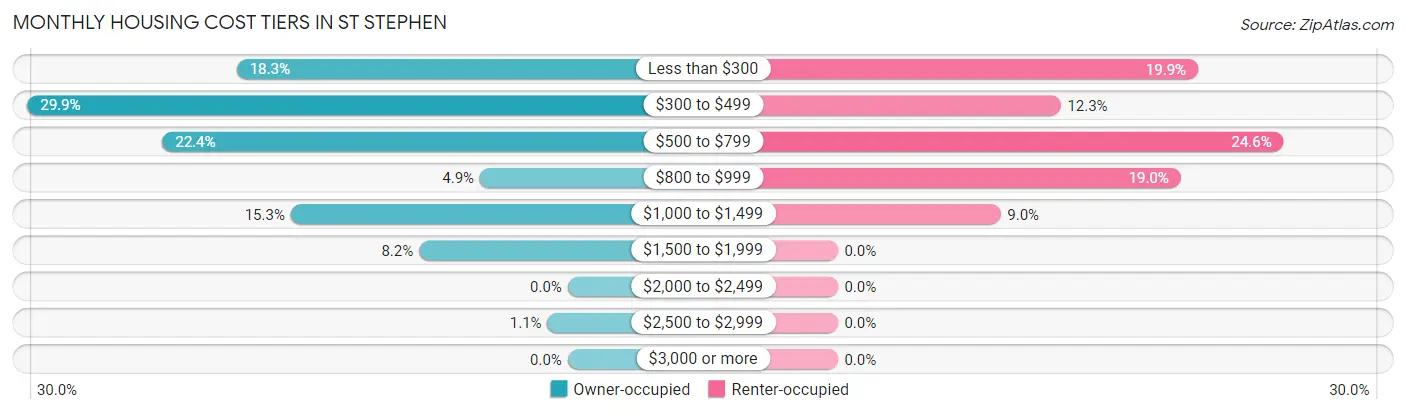
| Monthly Cost | Owner-occupied | Renter-occupied |
| Less than $300 | 49 (18.3%) | 42 (19.9%) |
| $300 to $499 | 80 (29.8%) | 26 (12.3%) |
| $500 to $799 | 60 (22.4%) | 52 (24.6%) |
| $800 to $999 | 13 (4.9%) | 40 (19.0%) |
| $1,000 to $1,499 | 41 (15.3%) | 19 (9.0%) |
| $1,500 to $1,999 | 22 (8.2%) | 0 (0.0%) |
| $2,000 to $2,499 | 0 (0.0%) | 0 (0.0%) |
| $2,500 to $2,999 | 3 (1.1%) | 0 (0.0%) |
| $3,000 or more | 0 (0.0%) | 0 (0.0%) |
| Total | 268 (100.0%) | 211 (100.0%) |
Physical Housing Characteristics in St Stephen
Housing Structures in St Stephen
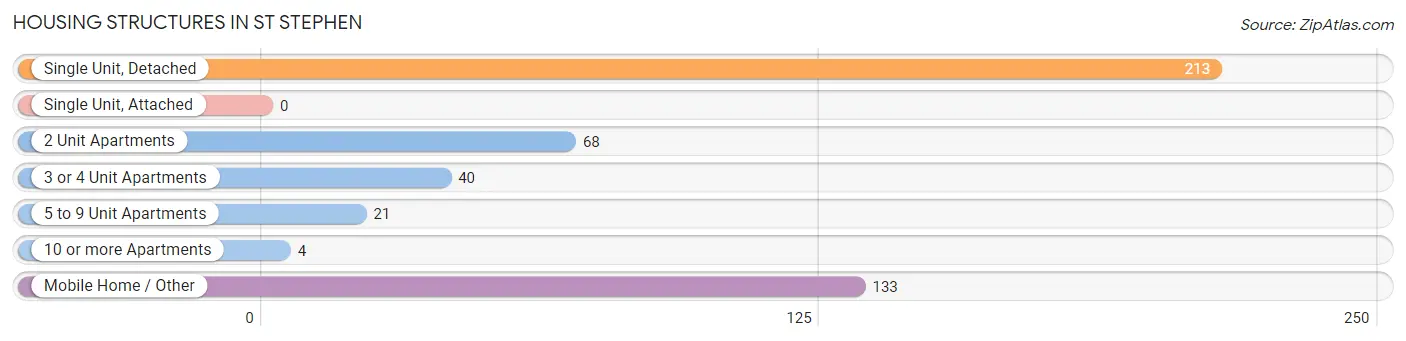
| Structure Type | # Housing Units | % Housing Units |
| Single Unit, Detached | 213 | 44.5% |
| Single Unit, Attached | 0 | 0.0% |
| 2 Unit Apartments | 68 | 14.2% |
| 3 or 4 Unit Apartments | 40 | 8.4% |
| 5 to 9 Unit Apartments | 21 | 4.4% |
| 10 or more Apartments | 4 | 0.8% |
| Mobile Home / Other | 133 | 27.8% |
| Total | 479 | 100.0% |
Housing Structures by Occupancy in St Stephen
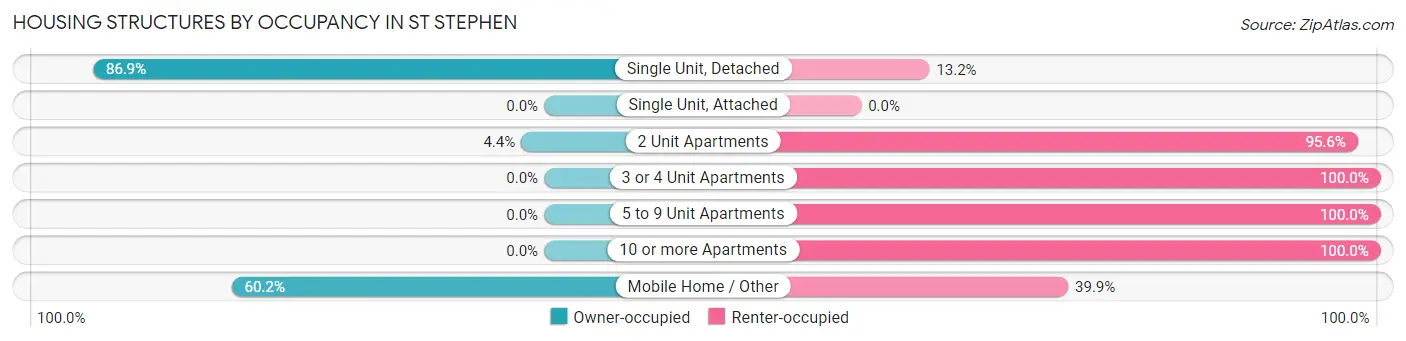
| Structure Type | Owner-occupied | Renter-occupied |
| Single Unit, Detached | 185 (86.9%) | 28 (13.2%) |
| Single Unit, Attached | 0 (0.0%) | 0 (0.0%) |
| 2 Unit Apartments | 3 (4.4%) | 65 (95.6%) |
| 3 or 4 Unit Apartments | 0 (0.0%) | 40 (100.0%) |
| 5 to 9 Unit Apartments | 0 (0.0%) | 21 (100.0%) |
| 10 or more Apartments | 0 (0.0%) | 4 (100.0%) |
| Mobile Home / Other | 80 (60.2%) | 53 (39.9%) |
| Total | 268 (55.9%) | 211 (44.1%) |
Housing Structures by Number of Rooms in St Stephen
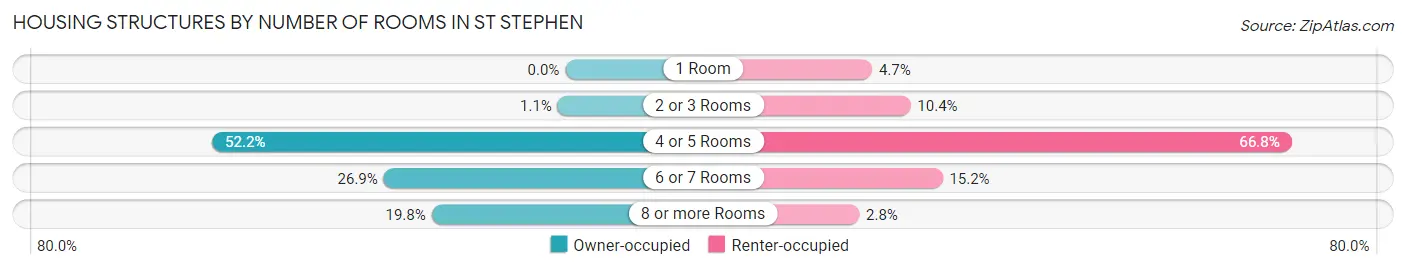
| Number of Rooms | Owner-occupied | Renter-occupied |
| 1 Room | 0 (0.0%) | 10 (4.7%) |
| 2 or 3 Rooms | 3 (1.1%) | 22 (10.4%) |
| 4 or 5 Rooms | 140 (52.2%) | 141 (66.8%) |
| 6 or 7 Rooms | 72 (26.9%) | 32 (15.2%) |
| 8 or more Rooms | 53 (19.8%) | 6 (2.8%) |
| Total | 268 (100.0%) | 211 (100.0%) |
Housing Structure by Heating Type in St Stephen
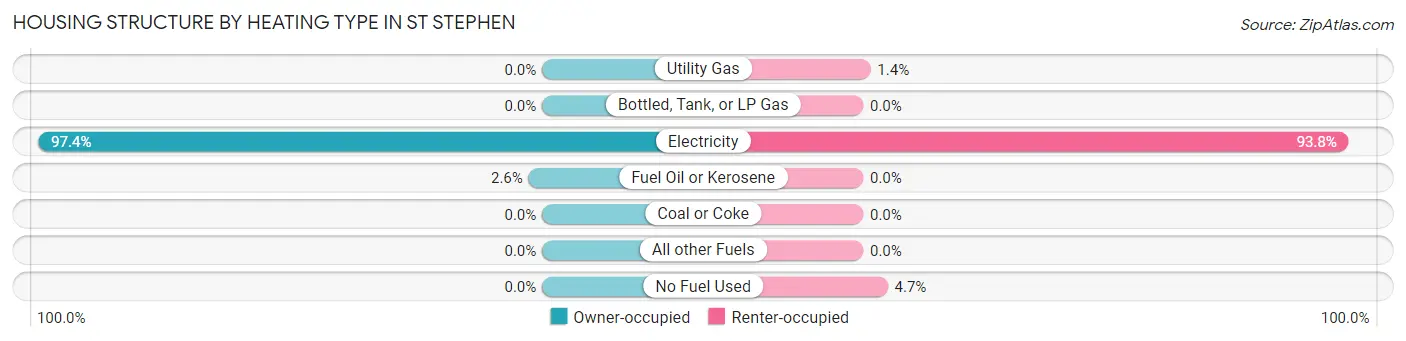
| Heating Type | Owner-occupied | Renter-occupied |
| Utility Gas | 0 (0.0%) | 3 (1.4%) |
| Bottled, Tank, or LP Gas | 0 (0.0%) | 0 (0.0%) |
| Electricity | 261 (97.4%) | 198 (93.8%) |
| Fuel Oil or Kerosene | 7 (2.6%) | 0 (0.0%) |
| Coal or Coke | 0 (0.0%) | 0 (0.0%) |
| All other Fuels | 0 (0.0%) | 0 (0.0%) |
| No Fuel Used | 0 (0.0%) | 10 (4.7%) |
| Total | 268 (100.0%) | 211 (100.0%) |
Household Vehicle Usage in St Stephen
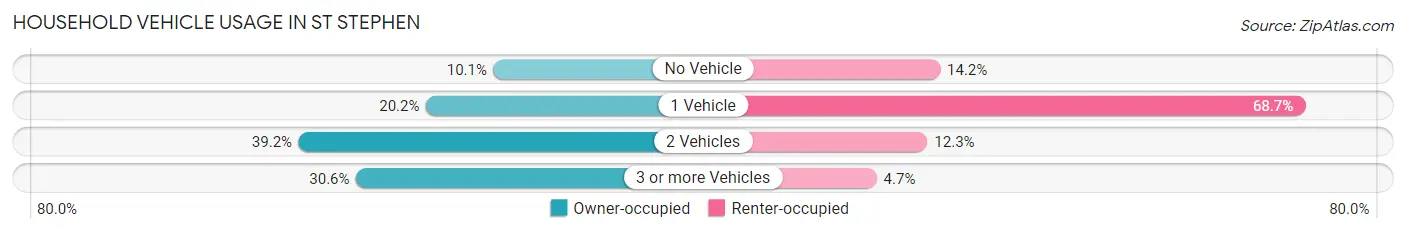
| Vehicles per Household | Owner-occupied | Renter-occupied |
| No Vehicle | 27 (10.1%) | 30 (14.2%) |
| 1 Vehicle | 54 (20.2%) | 145 (68.7%) |
| 2 Vehicles | 105 (39.2%) | 26 (12.3%) |
| 3 or more Vehicles | 82 (30.6%) | 10 (4.7%) |
| Total | 268 (100.0%) | 211 (100.0%) |
Real Estate & Mortgages in St Stephen
Real Estate and Mortgage Overview in St Stephen
| Characteristic | Without Mortgage | With Mortgage |
| Housing Units | 197 | 71 |
| Median Property Value | $79,600 | $173,900 |
| Median Household Income | $38,750 | $12 |
| Monthly Housing Costs | $431 | $0 |
| Real Estate Taxes | $498 | $5 |
Property Value by Mortgage Status in St Stephen
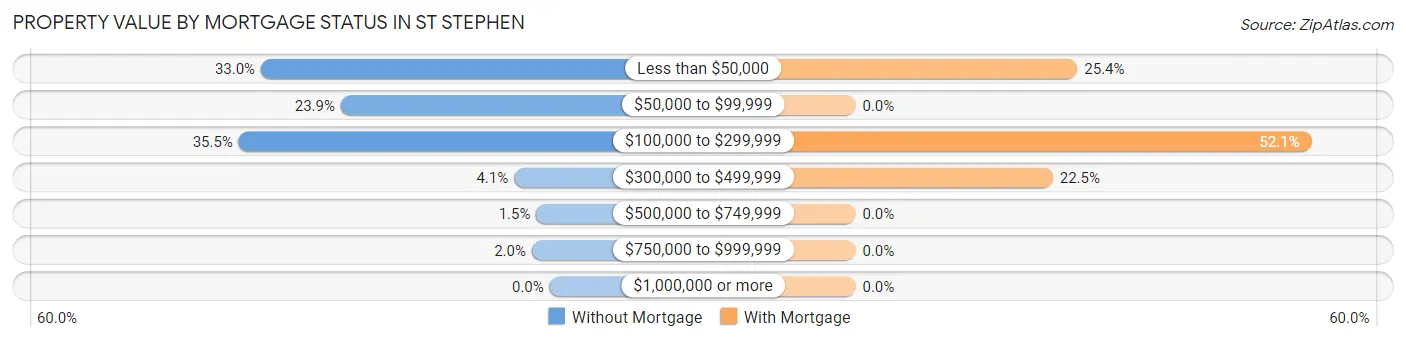
| Property Value | Without Mortgage | With Mortgage |
| Less than $50,000 | 65 (33.0%) | 18 (25.4%) |
| $50,000 to $99,999 | 47 (23.9%) | 0 (0.0%) |
| $100,000 to $299,999 | 70 (35.5%) | 37 (52.1%) |
| $300,000 to $499,999 | 8 (4.1%) | 16 (22.5%) |
| $500,000 to $749,999 | 3 (1.5%) | 0 (0.0%) |
| $750,000 to $999,999 | 4 (2.0%) | 0 (0.0%) |
| $1,000,000 or more | 0 (0.0%) | 0 (0.0%) |
| Total | 197 (100.0%) | 71 (100.0%) |
Household Income by Mortgage Status in St Stephen
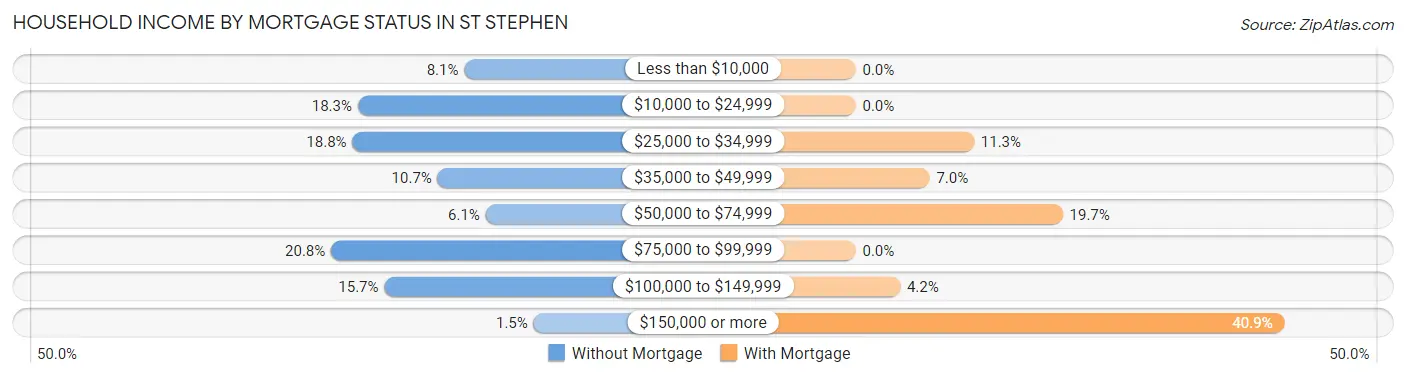
| Household Income | Without Mortgage | With Mortgage |
| Less than $10,000 | 16 (8.1%) | 0 (0.0%) |
| $10,000 to $24,999 | 36 (18.3%) | 0 (0.0%) |
| $25,000 to $34,999 | 37 (18.8%) | 8 (11.3%) |
| $35,000 to $49,999 | 21 (10.7%) | 5 (7.0%) |
| $50,000 to $74,999 | 12 (6.1%) | 14 (19.7%) |
| $75,000 to $99,999 | 41 (20.8%) | 0 (0.0%) |
| $100,000 to $149,999 | 31 (15.7%) | 3 (4.2%) |
| $150,000 or more | 3 (1.5%) | 29 (40.8%) |
| Total | 197 (100.0%) | 71 (100.0%) |
Property Value to Household Income Ratio in St Stephen
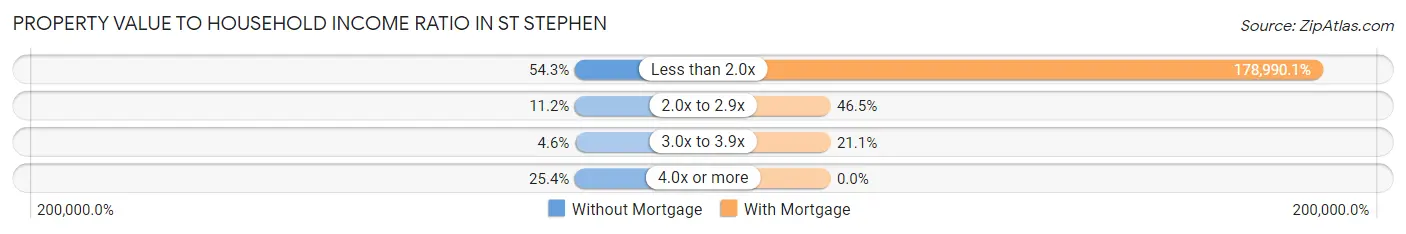
| Value-to-Income Ratio | Without Mortgage | With Mortgage |
| Less than 2.0x | 107 (54.3%) | 127,083 (178,990.1%) |
| 2.0x to 2.9x | 22 (11.2%) | 33 (46.5%) |
| 3.0x to 3.9x | 9 (4.6%) | 15 (21.1%) |
| 4.0x or more | 50 (25.4%) | 0 (0.0%) |
| Total | 197 (100.0%) | 71 (100.0%) |
Real Estate Taxes by Mortgage Status in St Stephen
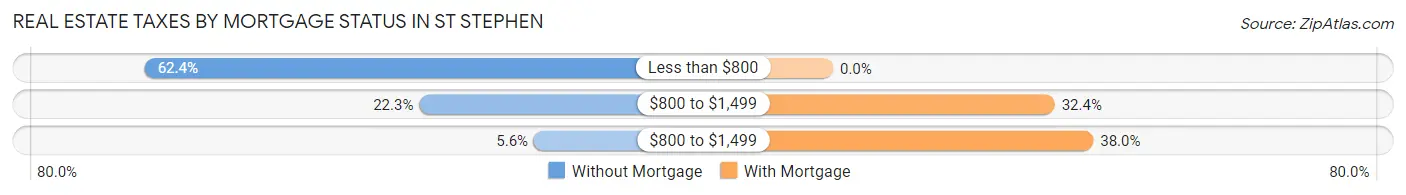
| Property Taxes | Without Mortgage | With Mortgage |
| Less than $800 | 123 (62.4%) | 0 (0.0%) |
| $800 to $1,499 | 44 (22.3%) | 23 (32.4%) |
| $800 to $1,499 | 11 (5.6%) | 27 (38.0%) |
| Total | 197 (100.0%) | 71 (100.0%) |
Health & Disability in St Stephen
Health Insurance Coverage by Age in St Stephen
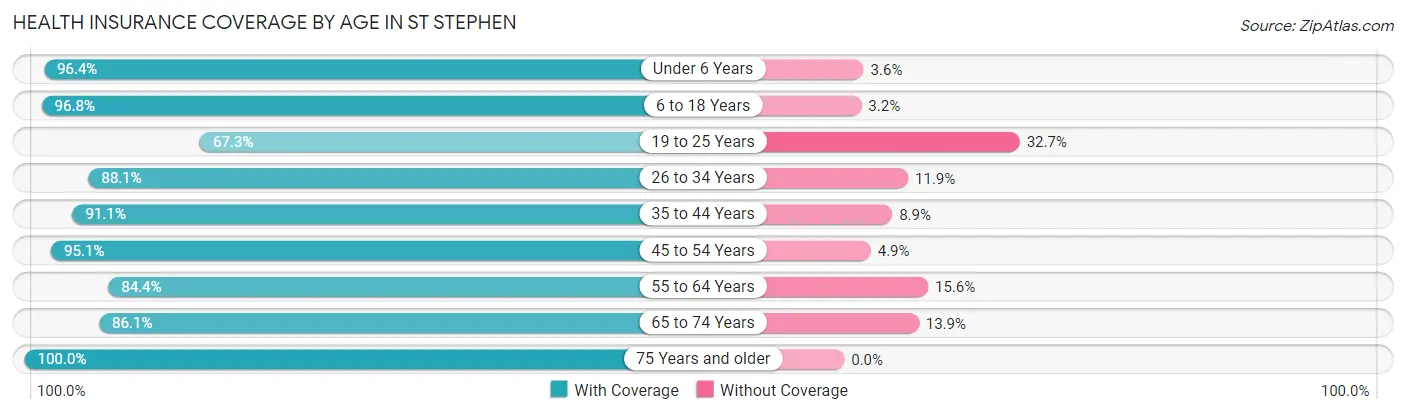
| Age Bracket | With Coverage | Without Coverage |
| Under 6 Years | 160 (96.4%) | 6 (3.6%) |
| 6 to 18 Years | 273 (96.8%) | 9 (3.2%) |
| 19 to 25 Years | 72 (67.3%) | 35 (32.7%) |
| 26 to 34 Years | 111 (88.1%) | 15 (11.9%) |
| 35 to 44 Years | 112 (91.1%) | 11 (8.9%) |
| 45 to 54 Years | 77 (95.1%) | 4 (4.9%) |
| 55 to 64 Years | 216 (84.4%) | 40 (15.6%) |
| 65 to 74 Years | 62 (86.1%) | 10 (13.9%) |
| 75 Years and older | 78 (100.0%) | 0 (0.0%) |
| Total | 1,161 (89.9%) | 130 (10.1%) |
Health Insurance Coverage by Citizenship Status in St Stephen
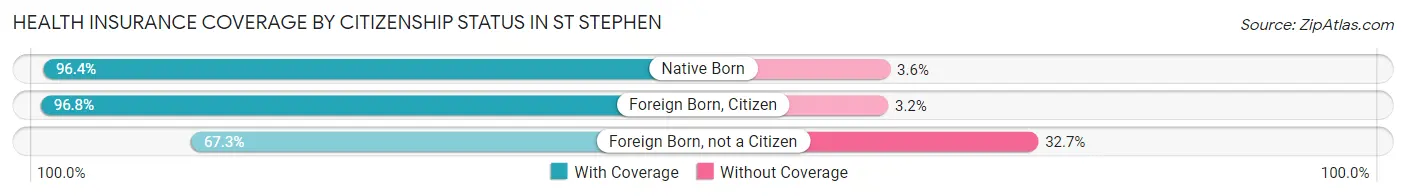
| Citizenship Status | With Coverage | Without Coverage |
| Native Born | 160 (96.4%) | 6 (3.6%) |
| Foreign Born, Citizen | 273 (96.8%) | 9 (3.2%) |
| Foreign Born, not a Citizen | 72 (67.3%) | 35 (32.7%) |
Health Insurance Coverage by Household Income in St Stephen
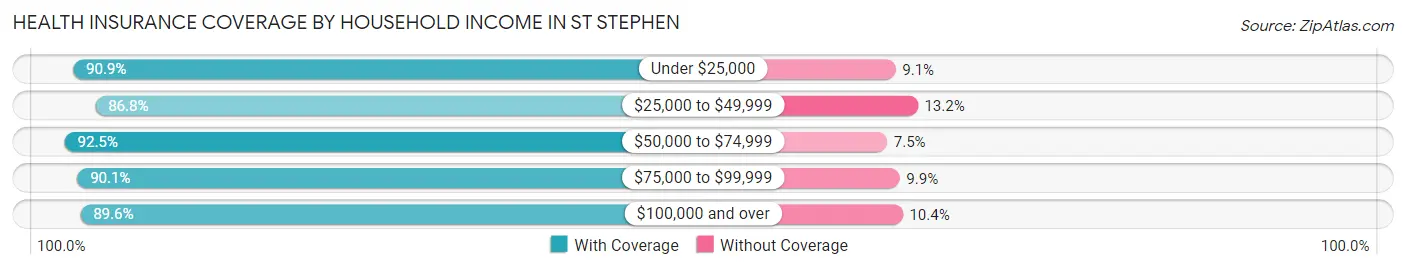
| Household Income | With Coverage | Without Coverage |
| Under $25,000 | 410 (90.9%) | 41 (9.1%) |
| $25,000 to $49,999 | 249 (86.8%) | 38 (13.2%) |
| $50,000 to $74,999 | 185 (92.5%) | 15 (7.5%) |
| $75,000 to $99,999 | 128 (90.1%) | 14 (9.9%) |
| $100,000 and over | 189 (89.6%) | 22 (10.4%) |
Public vs Private Health Insurance Coverage by Age in St Stephen
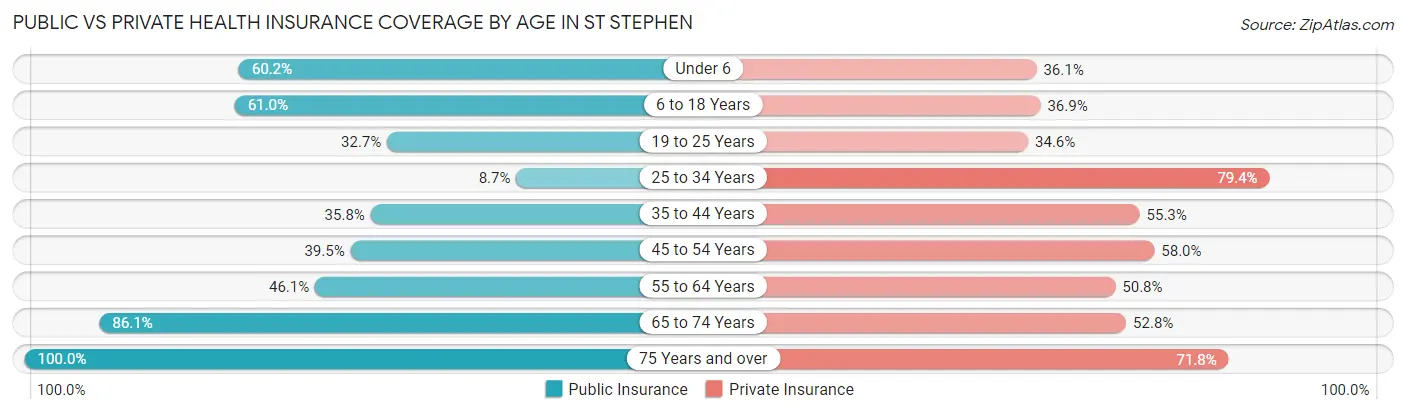
| Age Bracket | Public Insurance | Private Insurance |
| Under 6 | 100 (60.2%) | 60 (36.1%) |
| 6 to 18 Years | 172 (61.0%) | 104 (36.9%) |
| 19 to 25 Years | 35 (32.7%) | 37 (34.6%) |
| 25 to 34 Years | 11 (8.7%) | 100 (79.4%) |
| 35 to 44 Years | 44 (35.8%) | 68 (55.3%) |
| 45 to 54 Years | 32 (39.5%) | 47 (58.0%) |
| 55 to 64 Years | 118 (46.1%) | 130 (50.8%) |
| 65 to 74 Years | 62 (86.1%) | 38 (52.8%) |
| 75 Years and over | 78 (100.0%) | 56 (71.8%) |
| Total | 652 (50.5%) | 640 (49.6%) |
Disability Status by Sex by Age in St Stephen
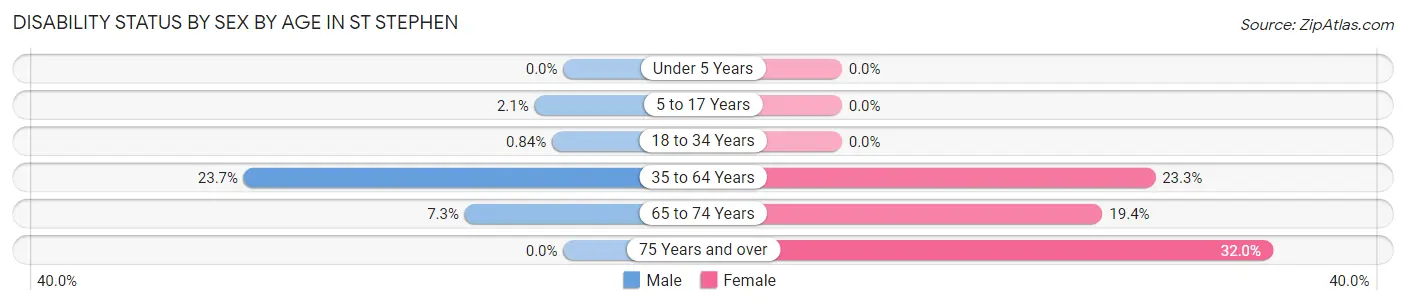
| Age Bracket | Male | Female |
| Under 5 Years | 0 (0.0%) | 0 (0.0%) |
| 5 to 17 Years | 3 (2.1%) | 0 (0.0%) |
| 18 to 34 Years | 1 (0.8%) | 0 (0.0%) |
| 35 to 64 Years | 51 (23.7%) | 57 (23.3%) |
| 65 to 74 Years | 3 (7.3%) | 6 (19.4%) |
| 75 Years and over | 0 (0.0%) | 16 (32.0%) |
Disability Class by Sex by Age in St Stephen
Disability Class: Hearing Difficulty
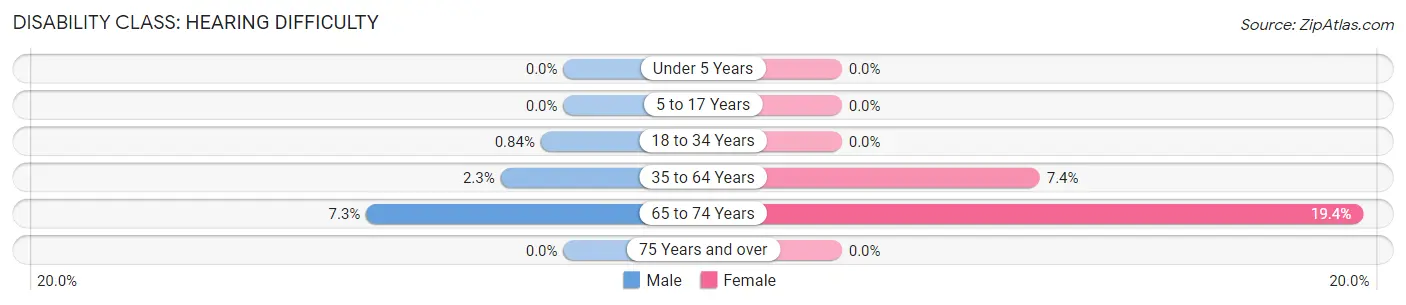
| Age Bracket | Male | Female |
| Under 5 Years | 0 (0.0%) | 0 (0.0%) |
| 5 to 17 Years | 0 (0.0%) | 0 (0.0%) |
| 18 to 34 Years | 1 (0.8%) | 0 (0.0%) |
| 35 to 64 Years | 5 (2.3%) | 18 (7.3%) |
| 65 to 74 Years | 3 (7.3%) | 6 (19.4%) |
| 75 Years and over | 0 (0.0%) | 0 (0.0%) |
Disability Class: Vision Difficulty
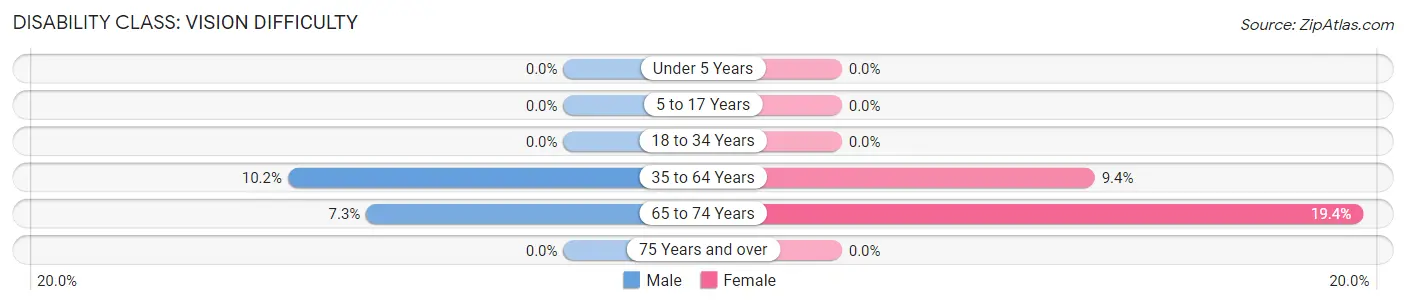
| Age Bracket | Male | Female |
| Under 5 Years | 0 (0.0%) | 0 (0.0%) |
| 5 to 17 Years | 0 (0.0%) | 0 (0.0%) |
| 18 to 34 Years | 0 (0.0%) | 0 (0.0%) |
| 35 to 64 Years | 22 (10.2%) | 23 (9.4%) |
| 65 to 74 Years | 3 (7.3%) | 6 (19.4%) |
| 75 Years and over | 0 (0.0%) | 0 (0.0%) |
Disability Class: Cognitive Difficulty
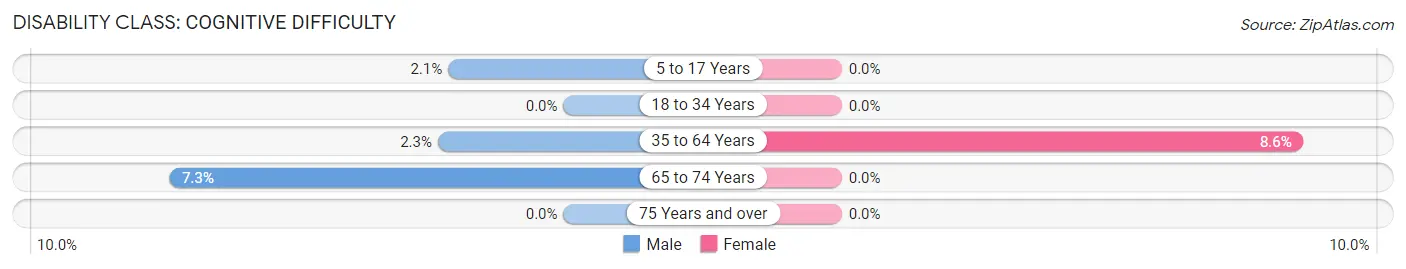
| Age Bracket | Male | Female |
| 5 to 17 Years | 3 (2.1%) | 0 (0.0%) |
| 18 to 34 Years | 0 (0.0%) | 0 (0.0%) |
| 35 to 64 Years | 5 (2.3%) | 21 (8.6%) |
| 65 to 74 Years | 3 (7.3%) | 0 (0.0%) |
| 75 Years and over | 0 (0.0%) | 0 (0.0%) |
Disability Class: Ambulatory Difficulty
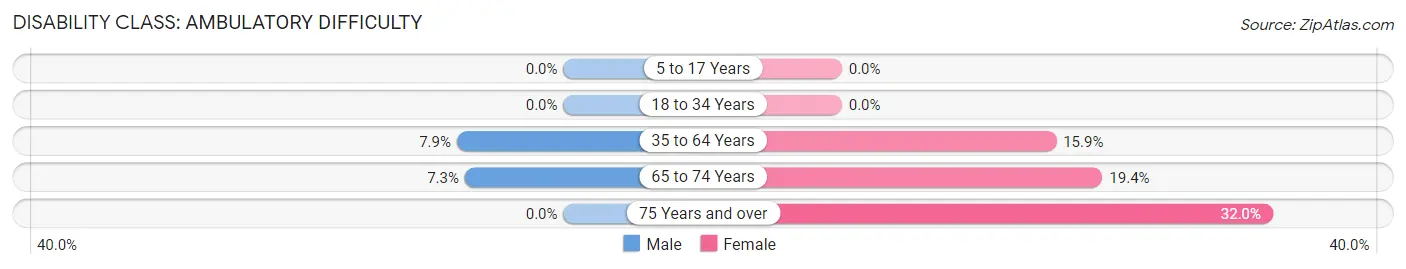
| Age Bracket | Male | Female |
| 5 to 17 Years | 0 (0.0%) | 0 (0.0%) |
| 18 to 34 Years | 0 (0.0%) | 0 (0.0%) |
| 35 to 64 Years | 17 (7.9%) | 39 (15.9%) |
| 65 to 74 Years | 3 (7.3%) | 6 (19.4%) |
| 75 Years and over | 0 (0.0%) | 16 (32.0%) |
Disability Class: Self-Care Difficulty
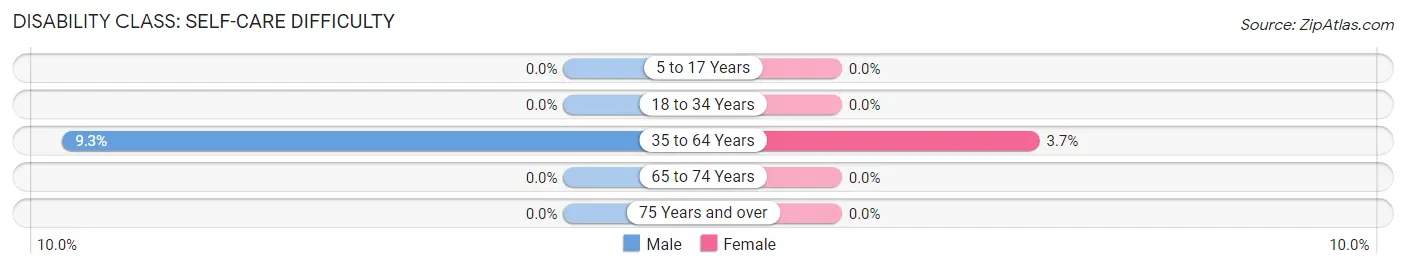
| Age Bracket | Male | Female |
| 5 to 17 Years | 0 (0.0%) | 0 (0.0%) |
| 18 to 34 Years | 0 (0.0%) | 0 (0.0%) |
| 35 to 64 Years | 20 (9.3%) | 9 (3.7%) |
| 65 to 74 Years | 0 (0.0%) | 0 (0.0%) |
| 75 Years and over | 0 (0.0%) | 0 (0.0%) |
Technology Access in St Stephen
Computing Device Access in St Stephen
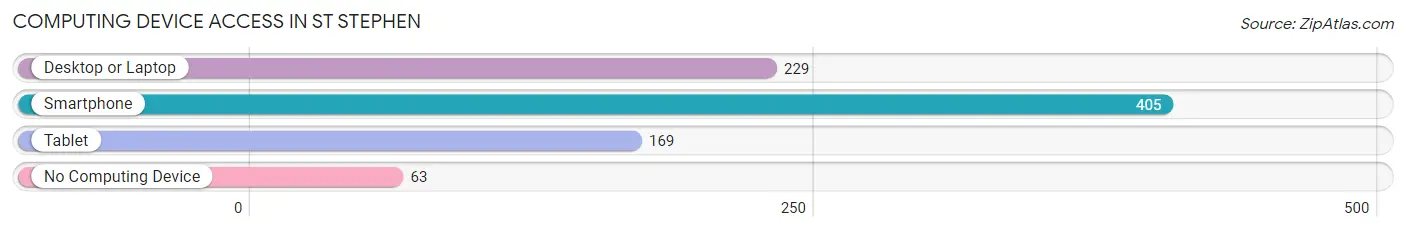
| Device Type | # Households | % Households |
| Desktop or Laptop | 229 | 47.8% |
| Smartphone | 405 | 84.6% |
| Tablet | 169 | 35.3% |
| No Computing Device | 63 | 13.2% |
| Total | 479 | 100.0% |
Internet Access in St Stephen
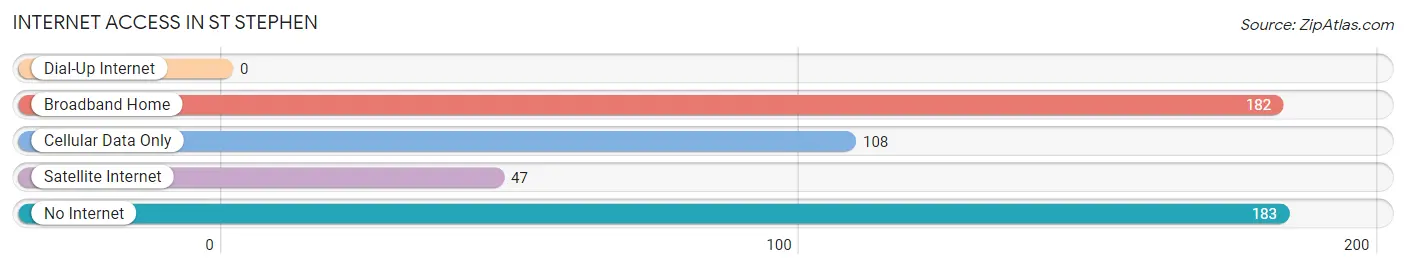
| Internet Type | # Households | % Households |
| Dial-Up Internet | 0 | 0.0% |
| Broadband Home | 182 | 38.0% |
| Cellular Data Only | 108 | 22.6% |
| Satellite Internet | 47 | 9.8% |
| No Internet | 183 | 38.2% |
| Total | 479 | 100.0% |
St Stephen Summary
St Stephen is a small town located in Berkeley County, South Carolina. It is situated on the banks of the Santee River, approximately 25 miles northwest of Charleston. The town has a population of approximately 1,500 people and is part of the Charleston-North Charleston-Summerville Metropolitan Statistical Area.
History
St Stephen was founded in 1790 by a group of settlers from the nearby town of Jamestown. The town was named after Stephen, the first Christian martyr. The town was originally a trading post and was used as a stopover for travelers heading to Charleston. In 1820, the town was incorporated and the first post office was established.
In the late 19th century, St Stephen became a popular destination for wealthy Charlestonians looking to escape the summer heat. The town was home to several large plantations and was known for its hospitality and charm.
Geography
St Stephen is located in Berkeley County, South Carolina. It is situated on the banks of the Santee River, approximately 25 miles northwest of Charleston. The town has a total area of 1.3 square miles, all of which is land. The town is located in a humid subtropical climate zone and experiences hot, humid summers and mild winters.
Economy
The economy of St Stephen is largely based on agriculture and tourism. The town is home to several large farms and is known for its production of peaches, cotton, and soybeans. Tourism is also an important part of the local economy, with visitors coming to the town to enjoy its historic sites and natural beauty.
Demographics
As of the 2010 census, the population of St Stephen was 1,500. The racial makeup of the town was 79.2% White, 17.3% African American, 0.7% Native American, 0.7% Asian, 0.3% from other races, and 1.9% from two or more races. The median household income was $37,500 and the median family income was $45,000. The per capita income was $18,000.
Conclusion
St Stephen is a small town located in Berkeley County, South Carolina. It is situated on the banks of the Santee River, approximately 25 miles northwest of Charleston. The town has a population of approximately 1,500 people and is part of the Charleston-North Charleston-Summerville Metropolitan Statistical Area. The economy of St Stephen is largely based on agriculture and tourism, and the town is known for its production of peaches, cotton, and soybeans. The racial makeup of the town is 79.2% White, 17.3% African American, 0.7% Native American, 0.7% Asian, 0.3% from other races, and 1.9% from two or more races. The median household income was $37,500 and the median family income was $45,000. The per capita income was $18,000.
Common Questions
What is Per Capita Income in St Stephen?
Per Capita income in St Stephen is $19,641.
What is the Median Family Income in St Stephen?
Median Family Income in St Stephen is $41,618.
What is the Median Household income in St Stephen?
Median Household Income in St Stephen is $37,596.
What is Income or Wage Gap in St Stephen?
Income or Wage Gap in St Stephen is 53.9%.
Women in St Stephen earn 46.1 cents for every dollar earned by a man.
What is Inequality or Gini Index in St Stephen?
Inequality or Gini Index in St Stephen is 0.47.
What is the Total Population of St Stephen?
Total Population of St Stephen is 1,386.
What is the Total Male Population of St Stephen?
Total Male Population of St Stephen is 628.
What is the Total Female Population of St Stephen?
Total Female Population of St Stephen is 758.
What is the Ratio of Males per 100 Females in St Stephen?
There are 82.85 Males per 100 Females in St Stephen.
What is the Ratio of Females per 100 Males in St Stephen?
There are 120.70 Females per 100 Males in St Stephen.
What is the Median Population Age in St Stephen?
Median Population Age in St Stephen is 36.5 Years.
What is the Average Family Size in St Stephen
Average Family Size in St Stephen is 3.1 People.
What is the Average Household Size in St Stephen
Average Household Size in St Stephen is 2.7 People.
How Large is the Labor Force in St Stephen?
There are 405 People in the Labor Forcein in St Stephen.
What is the Percentage of People in the Labor Force in St Stephen?
39.2% of People are in the Labor Force in St Stephen.
What is the Unemployment Rate in St Stephen?
Unemployment Rate in St Stephen is 8.4%.