Thai Disability
COMPARE
Thai
Select to Compare
Disability
Thai Disability
9.7%
DISABILITY
100.0/ 100
METRIC RATING
4th/ 347
METRIC RANK
Thai Disability Correlation Chart
The statistical analysis conducted on geographies consisting of 475,831,416 people shows a mild negative correlation between the proportion of Thais and percentage of population with a disability in the United States with a correlation coefficient (R) of -0.372 and weighted average of 9.7%. On average, for every 1% (one percent) increase in Thais within a typical geography, there is a decrease of 0.057% in percentage of population with a disability.
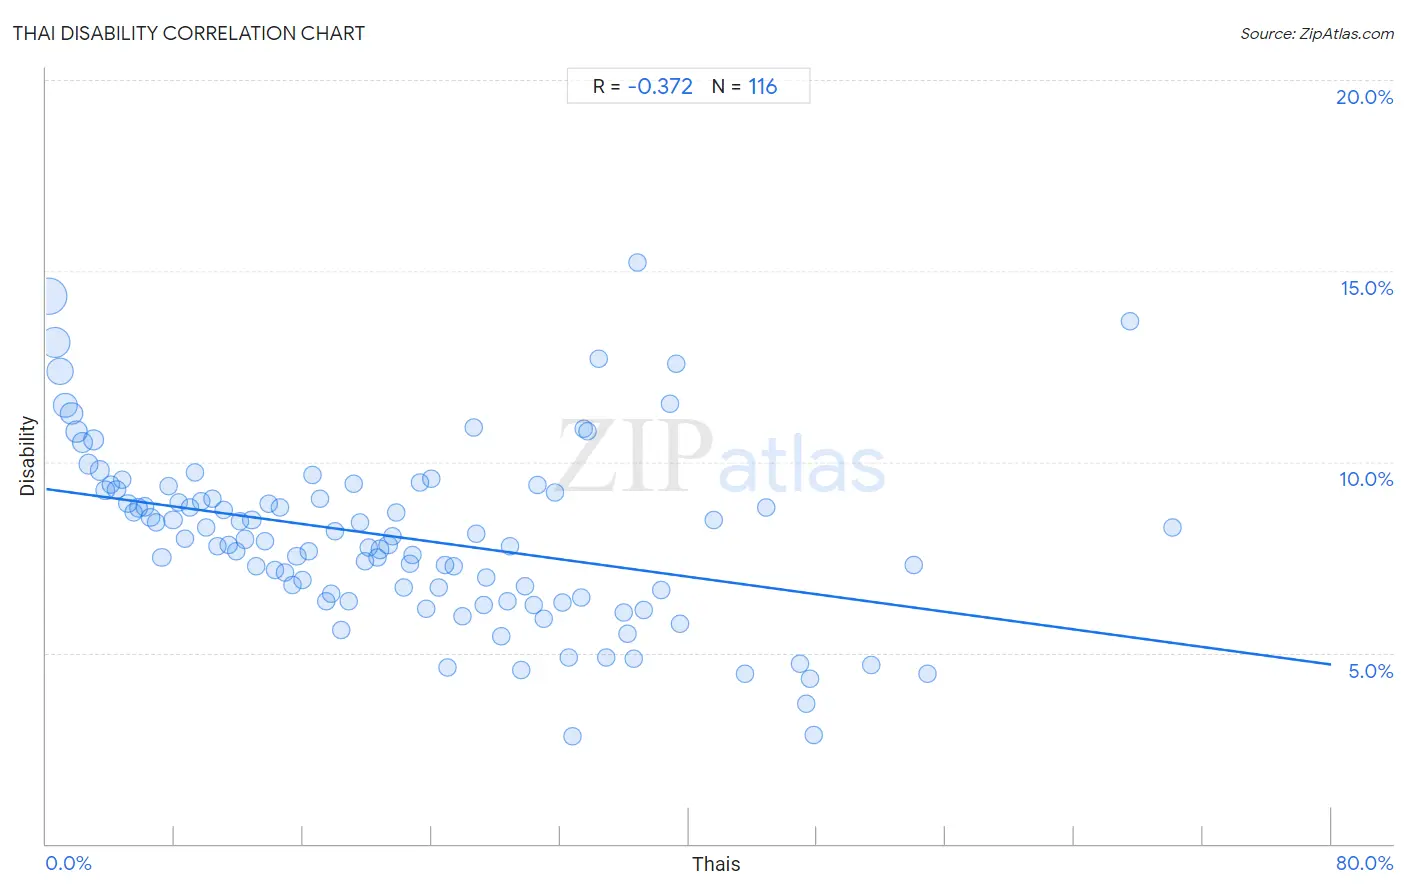
It is essential to understand that the correlation between the percentage of Thais and percentage of population with a disability does not imply a direct cause-and-effect relationship. It remains uncertain whether the presence of Thais influences an upward or downward trend in the level of percentage of population with a disability within an area, or if Thais simply ended up residing in those areas with higher or lower levels of percentage of population with a disability due to other factors.
Demographics Similar to Thais by Disability
In terms of disability, the demographic groups most similar to Thais are Immigrants from Taiwan (9.6%, a difference of 1.1%), Filipino (9.6%, a difference of 1.1%), Immigrants from Bolivia (9.9%, a difference of 1.6%), Immigrants from India (9.5%, a difference of 2.1%), and Immigrants from South Central Asia (9.9%, a difference of 2.5%).
| Demographics | Rating | Rank | Disability |
| Immigrants from India | 100.0 /100 | #1 | Exceptional 9.5% |
| Filipinos | 100.0 /100 | #2 | Exceptional 9.6% |
| Immigrants from Taiwan | 100.0 /100 | #3 | Exceptional 9.6% |
| Thais | 100.0 /100 | #4 | Exceptional 9.7% |
| Immigrants from Bolivia | 100.0 /100 | #5 | Exceptional 9.9% |
| Immigrants from South Central Asia | 100.0 /100 | #6 | Exceptional 9.9% |
| Immigrants from Singapore | 100.0 /100 | #7 | Exceptional 10.0% |
| Bolivians | 100.0 /100 | #8 | Exceptional 10.0% |
| Immigrants from Hong Kong | 100.0 /100 | #9 | Exceptional 10.0% |
| Immigrants from China | 100.0 /100 | #10 | Exceptional 10.1% |
| Iranians | 100.0 /100 | #11 | Exceptional 10.1% |
| Immigrants from Israel | 100.0 /100 | #12 | Exceptional 10.1% |
| Immigrants from Eastern Asia | 100.0 /100 | #13 | Exceptional 10.2% |
| Immigrants from Korea | 100.0 /100 | #14 | Exceptional 10.2% |
| Okinawans | 100.0 /100 | #15 | Exceptional 10.3% |
Thai Disability Correlation Summary
| Measurement | Thai Data | Disability Data |
| Minimum | 0.16% | 2.8% |
| Maximum | 70.1% | 15.2% |
| Range | 69.9% | 12.4% |
| Mean | 22.1% | 8.0% |
| Median | 20.4% | 7.9% |
| Interquartile 25% (IQ1) | 10.2% | 6.5% |
| Interquartile 75% (IQ3) | 31.9% | 9.2% |
| Interquartile Range (IQR) | 21.7% | 2.7% |
| Standard Deviation (Sample) | 14.9% | 2.3% |
| Standard Deviation (Population) | 14.8% | 2.3% |
Correlation Details
| Thai Percentile | Sample Size | Disability |
[ 0.0% - 0.5% ] 0.16% | 128,297,091 | 14.3% |
[ 0.5% - 1.0% ] 0.52% | 86,244,920 | 13.1% |
[ 0.5% - 1.0% ] 0.86% | 59,111,513 | 12.4% |
[ 1.0% - 1.5% ] 1.20% | 38,298,062 | 11.5% |
[ 1.5% - 2.0% ] 1.56% | 30,203,604 | 11.3% |
[ 1.5% - 2.0% ] 1.90% | 20,944,519 | 10.8% |
[ 2.0% - 2.5% ] 2.27% | 16,605,719 | 10.5% |
[ 2.5% - 3.0% ] 2.61% | 11,530,510 | 9.9% |
[ 2.5% - 3.0% ] 2.96% | 18,917,651 | 10.6% |
[ 3.0% - 3.5% ] 3.32% | 10,534,102 | 9.8% |
[ 3.5% - 4.0% ] 3.67% | 5,342,592 | 9.3% |
[ 4.0% - 4.5% ] 4.02% | 5,340,937 | 9.4% |
[ 4.0% - 4.5% ] 4.38% | 4,945,731 | 9.3% |
[ 4.5% - 5.0% ] 4.73% | 3,896,550 | 9.5% |
[ 5.0% - 5.5% ] 5.09% | 3,411,362 | 8.9% |
[ 5.0% - 5.5% ] 5.42% | 2,260,265 | 8.7% |
[ 5.5% - 6.0% ] 5.76% | 3,265,215 | 8.8% |
[ 6.0% - 6.5% ] 6.16% | 1,862,828 | 8.8% |
[ 6.0% - 6.5% ] 6.50% | 1,515,245 | 8.5% |
[ 6.5% - 7.0% ] 6.81% | 1,479,975 | 8.4% |
[ 7.0% - 7.5% ] 7.20% | 1,115,526 | 7.5% |
[ 7.5% - 8.0% ] 7.60% | 1,957,214 | 9.4% |
[ 7.5% - 8.0% ] 7.89% | 1,148,534 | 8.5% |
[ 8.0% - 8.5% ] 8.24% | 793,488 | 8.9% |
[ 8.5% - 9.0% ] 8.62% | 863,766 | 8.0% |
[ 8.5% - 9.0% ] 8.98% | 603,618 | 8.8% |
[ 9.0% - 9.5% ] 9.29% | 718,822 | 9.7% |
[ 9.5% - 10.0% ] 9.63% | 704,877 | 9.0% |
[ 9.5% - 10.0% ] 9.95% | 641,314 | 8.3% |
[ 10.0% - 10.5% ] 10.36% | 534,933 | 9.0% |
[ 10.5% - 11.0% ] 10.67% | 549,111 | 7.8% |
[ 11.0% - 11.5% ] 11.08% | 652,132 | 8.7% |
[ 11.0% - 11.5% ] 11.38% | 927,231 | 7.8% |
[ 11.5% - 12.0% ] 11.82% | 179,860 | 7.6% |
[ 12.0% - 12.5% ] 12.07% | 526,284 | 8.5% |
[ 12.0% - 12.5% ] 12.38% | 427,516 | 8.0% |
[ 12.5% - 13.0% ] 12.80% | 843,636 | 8.5% |
[ 13.0% - 13.5% ] 13.11% | 424,251 | 7.3% |
[ 13.5% - 14.0% ] 13.62% | 492,269 | 7.9% |
[ 13.5% - 14.0% ] 13.87% | 301,133 | 8.9% |
[ 14.0% - 14.5% ] 14.23% | 373,447 | 7.2% |
[ 14.5% - 15.0% ] 14.56% | 678,696 | 8.8% |
[ 14.5% - 15.0% ] 14.89% | 213,574 | 7.1% |
[ 15.0% - 15.5% ] 15.35% | 394,649 | 6.8% |
[ 15.5% - 16.0% ] 15.60% | 235,822 | 7.5% |
[ 15.5% - 16.0% ] 15.96% | 145,079 | 6.9% |
[ 16.0% - 16.5% ] 16.34% | 95,398 | 7.6% |
[ 16.5% - 17.0% ] 16.61% | 210,115 | 9.7% |
[ 17.0% - 17.5% ] 17.02% | 78,602 | 9.0% |
[ 17.0% - 17.5% ] 17.47% | 34,484 | 6.4% |
[ 17.5% - 18.0% ] 17.72% | 483,376 | 6.5% |
[ 18.0% - 18.5% ] 18.00% | 258,637 | 8.2% |
[ 18.0% - 18.5% ] 18.36% | 95,553 | 5.6% |
[ 18.5% - 19.0% ] 18.82% | 158,081 | 6.4% |
[ 19.0% - 19.5% ] 19.14% | 10,341 | 9.4% |
[ 19.5% - 20.0% ] 19.51% | 332,773 | 8.4% |
[ 19.5% - 20.0% ] 19.85% | 121,376 | 7.4% |
[ 20.0% - 20.5% ] 20.10% | 223,691 | 7.8% |
[ 20.5% - 21.0% ] 20.61% | 85,133 | 7.5% |
[ 20.5% - 21.0% ] 20.81% | 269,353 | 7.7% |
[ 21.0% - 21.5% ] 21.28% | 139,153 | 7.8% |
[ 21.5% - 22.0% ] 21.57% | 97,178 | 8.0% |
[ 21.5% - 22.0% ] 21.83% | 103,197 | 8.7% |
[ 22.0% - 22.5% ] 22.29% | 120,806 | 6.7% |
[ 22.5% - 23.0% ] 22.68% | 208,151 | 7.3% |
[ 22.5% - 23.0% ] 22.84% | 106,155 | 7.6% |
[ 23.0% - 23.5% ] 23.25% | 37,071 | 9.5% |
[ 23.5% - 24.0% ] 23.64% | 101,208 | 6.2% |
[ 23.5% - 24.0% ] 23.95% | 48,552 | 9.6% |
[ 24.0% - 24.5% ] 24.45% | 248,641 | 6.7% |
[ 24.5% - 25.0% ] 24.81% | 8,456 | 7.3% |
[ 25.0% - 25.5% ] 25.01% | 20,651 | 4.6% |
[ 25.0% - 25.5% ] 25.35% | 30,207 | 7.3% |
[ 25.5% - 26.0% ] 25.88% | 653 | 6.0% |
[ 26.5% - 27.0% ] 26.61% | 27,571 | 10.9% |
[ 26.5% - 27.0% ] 26.78% | 114,355 | 8.1% |
[ 27.0% - 27.5% ] 27.23% | 188,552 | 6.2% |
[ 27.0% - 27.5% ] 27.38% | 22,852 | 7.0% |
[ 28.0% - 28.5% ] 28.34% | 18,949 | 5.4% |
[ 28.5% - 29.0% ] 28.70% | 69,659 | 6.4% |
[ 28.5% - 29.0% ] 28.87% | 95,566 | 7.8% |
[ 29.5% - 30.0% ] 29.55% | 63,620 | 4.5% |
[ 29.5% - 30.0% ] 29.83% | 257,729 | 6.7% |
[ 30.0% - 30.5% ] 30.38% | 76,956 | 6.3% |
[ 30.5% - 31.0% ] 30.61% | 51,153 | 9.4% |
[ 30.5% - 31.0% ] 30.99% | 102,097 | 5.9% |
[ 31.5% - 32.0% ] 31.68% | 30,392 | 9.2% |
[ 32.0% - 32.5% ] 32.12% | 3,695 | 6.3% |
[ 32.5% - 33.0% ] 32.52% | 61,363 | 4.9% |
[ 32.5% - 33.0% ] 32.75% | 2,766 | 2.8% |
[ 33.0% - 33.5% ] 33.28% | 5,018 | 6.5% |
[ 33.0% - 33.5% ] 33.44% | 21,806 | 10.9% |
[ 33.5% - 34.0% ] 33.67% | 802 | 10.8% |
[ 34.0% - 34.5% ] 34.38% | 15,702 | 12.7% |
[ 34.5% - 35.0% ] 34.86% | 68,587 | 4.9% |
[ 35.5% - 36.0% ] 35.98% | 29,756 | 6.0% |
[ 36.0% - 36.5% ] 36.21% | 2,994 | 5.5% |
[ 36.5% - 37.0% ] 36.59% | 20,954 | 4.9% |
[ 36.5% - 37.0% ] 36.84% | 1,425 | 15.2% |
[ 37.0% - 37.5% ] 37.20% | 53,464 | 6.1% |
[ 38.0% - 38.5% ] 38.27% | 23,274 | 6.6% |
[ 38.5% - 39.0% ] 38.87% | 2,560 | 11.5% |
[ 39.0% - 39.5% ] 39.23% | 6,773 | 12.6% |
[ 39.0% - 39.5% ] 39.42% | 104 | 5.8% |
[ 41.5% - 42.0% ] 41.53% | 118 | 8.5% |
[ 43.0% - 43.5% ] 43.50% | 9,750 | 4.4% |
[ 44.5% - 45.0% ] 44.79% | 53,744 | 8.8% |
[ 46.5% - 47.0% ] 46.92% | 21,452 | 4.7% |
[ 47.0% - 47.5% ] 47.30% | 20,693 | 3.7% |
[ 47.5% - 48.0% ] 47.55% | 44,570 | 4.3% |
[ 47.5% - 48.0% ] 47.76% | 10,514 | 2.8% |
[ 51.0% - 51.5% ] 51.35% | 2,300 | 4.7% |
[ 53.5% - 54.0% ] 53.99% | 40,614 | 7.3% |
[ 54.5% - 55.0% ] 54.84% | 2,241 | 4.5% |
[ 67.0% - 67.5% ] 67.45% | 212 | 13.7% |
[ 70.0% - 70.5% ] 70.11% | 2,549 | 8.3% |