Thai Self-Care Disability
COMPARE
Thai
Select to Compare
Self-Care Disability
Thai Self-Care Disability
2.1%
SELF-CARE DISABILITY
100.0/ 100
METRIC RATING
3rd/ 347
METRIC RANK
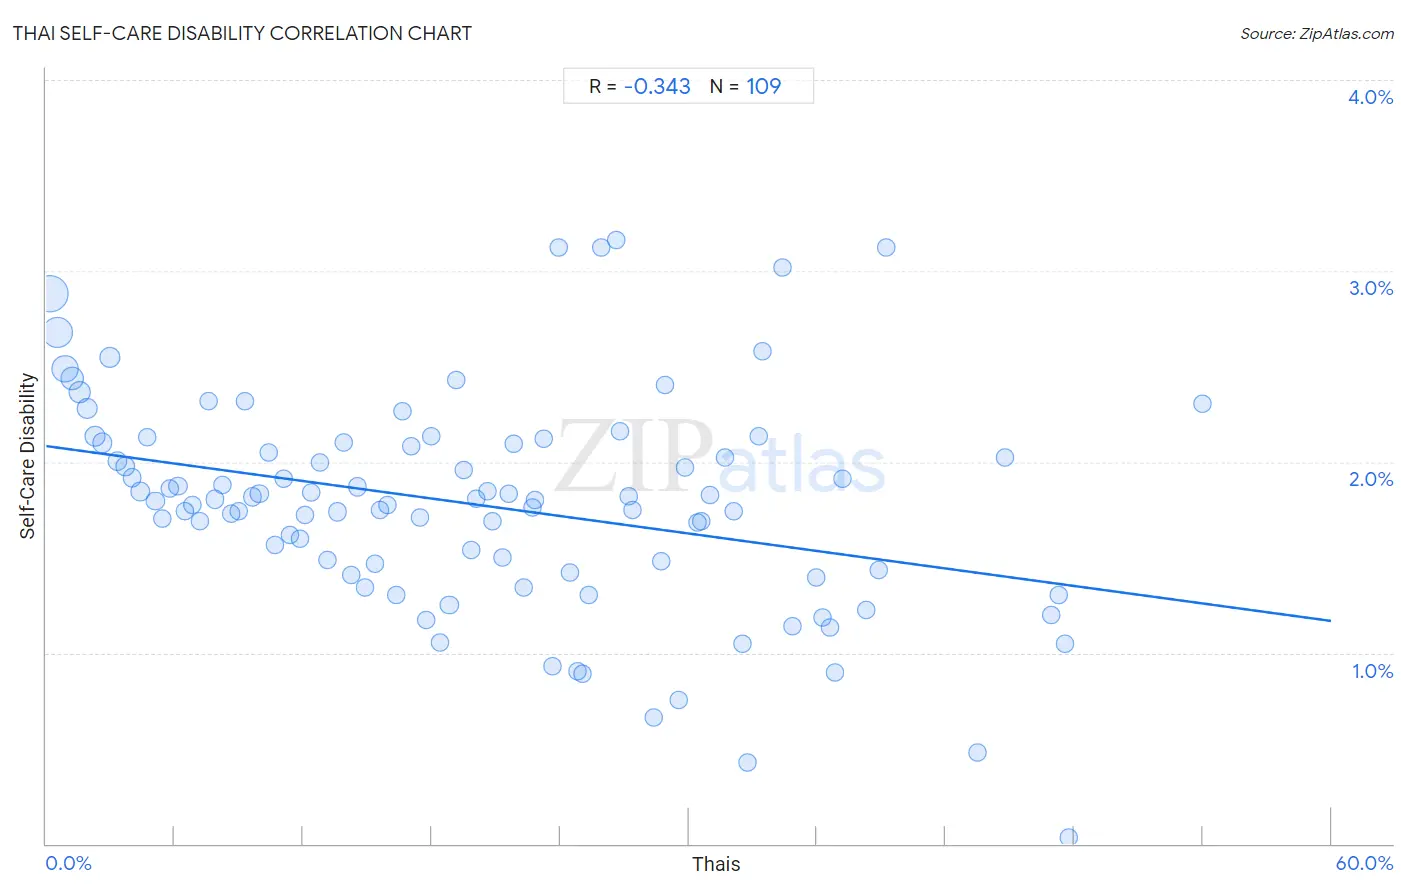
Thai Self-Care Disability Correlation Chart
The statistical analysis conducted on geographies consisting of 474,998,821 people shows a mild negative correlation between the proportion of Thais and percentage of population with self-care disability in the United States with a correlation coefficient (R) of -0.343 and weighted average of 2.1%. On average, for every 1% (one percent) increase in Thais within a typical geography, there is a decrease of 0.015% in percentage of population with self-care disability.
It is essential to understand that the correlation between the percentage of Thais and percentage of population with self-care disability does not imply a direct cause-and-effect relationship. It remains uncertain whether the presence of Thais influences an upward or downward trend in the level of percentage of population with self-care disability within an area, or if Thais simply ended up residing in those areas with higher or lower levels of percentage of population with self-care disability due to other factors.
Demographics Similar to Thais by Self-Care Disability
In terms of self-care disability, the demographic groups most similar to Thais are Immigrants from Singapore (2.1%, a difference of 2.3%), Immigrants from India (2.0%, a difference of 3.0%), Zimbabwean (2.2%, a difference of 3.3%), Filipino (2.2%, a difference of 3.6%), and Immigrants from Bolivia (2.2%, a difference of 3.8%).
| Demographics | Rating | Rank | Self-Care Disability |
| Yup'ik | 100.0 /100 | #1 | Exceptional 1.9% |
| Immigrants from India | 100.0 /100 | #2 | Exceptional 2.0% |
| Thais | 100.0 /100 | #3 | Exceptional 2.1% |
| Immigrants from Singapore | 100.0 /100 | #4 | Exceptional 2.1% |
| Zimbabweans | 100.0 /100 | #5 | Exceptional 2.2% |
| Filipinos | 100.0 /100 | #6 | Exceptional 2.2% |
| Immigrants from Bolivia | 100.0 /100 | #7 | Exceptional 2.2% |
| Bolivians | 100.0 /100 | #8 | Exceptional 2.2% |
| Immigrants from Nepal | 100.0 /100 | #9 | Exceptional 2.2% |
| Sudanese | 100.0 /100 | #10 | Exceptional 2.2% |
| Immigrants from South Central Asia | 100.0 /100 | #11 | Exceptional 2.2% |
| Immigrants from Ethiopia | 100.0 /100 | #12 | Exceptional 2.2% |
| Ethiopians | 100.0 /100 | #13 | Exceptional 2.2% |
| Luxembourgers | 100.0 /100 | #14 | Exceptional 2.2% |
| Okinawans | 100.0 /100 | #15 | Exceptional 2.2% |
Thai Self-Care Disability Correlation Summary
| Measurement | Thai Data | Self-Care Disability Data |
| Minimum | 0.16% | 0.030% |
| Maximum | 54.0% | 3.2% |
| Range | 53.8% | 3.1% |
| Mean | 20.2% | 1.8% |
| Median | 19.1% | 1.8% |
| Interquartile 25% (IQ1) | 9.5% | 1.4% |
| Interquartile 75% (IQ3) | 29.7% | 2.1% |
| Interquartile Range (IQR) | 20.2% | 0.67% |
| Standard Deviation (Sample) | 12.9% | 0.57% |
| Standard Deviation (Population) | 12.8% | 0.57% |
Correlation Details
| Thai Percentile | Sample Size | Self-Care Disability |
[ 0.0% - 0.5% ] 0.16% | 128,153,961 | 2.9% |
[ 0.5% - 1.0% ] 0.52% | 86,173,615 | 2.7% |
[ 0.5% - 1.0% ] 0.86% | 59,052,479 | 2.5% |
[ 1.0% - 1.5% ] 1.20% | 38,253,338 | 2.4% |
[ 1.5% - 2.0% ] 1.56% | 30,134,820 | 2.4% |
[ 1.5% - 2.0% ] 1.90% | 20,920,076 | 2.3% |
[ 2.0% - 2.5% ] 2.27% | 16,576,642 | 2.1% |
[ 2.5% - 3.0% ] 2.61% | 11,467,723 | 2.1% |
[ 2.5% - 3.0% ] 2.96% | 18,878,153 | 2.5% |
[ 3.0% - 3.5% ] 3.32% | 10,484,679 | 2.0% |
[ 3.5% - 4.0% ] 3.67% | 5,308,503 | 2.0% |
[ 4.0% - 4.5% ] 4.02% | 5,318,389 | 1.9% |
[ 4.0% - 4.5% ] 4.38% | 4,937,498 | 1.8% |
[ 4.5% - 5.0% ] 4.73% | 3,871,774 | 2.1% |
[ 5.0% - 5.5% ] 5.09% | 3,393,196 | 1.8% |
[ 5.0% - 5.5% ] 5.42% | 2,260,019 | 1.7% |
[ 5.5% - 6.0% ] 5.76% | 3,261,881 | 1.9% |
[ 6.0% - 6.5% ] 6.16% | 1,849,727 | 1.9% |
[ 6.0% - 6.5% ] 6.50% | 1,515,124 | 1.7% |
[ 6.5% - 7.0% ] 6.81% | 1,455,379 | 1.8% |
[ 7.0% - 7.5% ] 7.20% | 1,111,853 | 1.7% |
[ 7.5% - 8.0% ] 7.60% | 1,948,114 | 2.3% |
[ 7.5% - 8.0% ] 7.89% | 1,139,571 | 1.8% |
[ 8.0% - 8.5% ] 8.24% | 780,720 | 1.9% |
[ 8.5% - 9.0% ] 8.62% | 863,043 | 1.7% |
[ 8.5% - 9.0% ] 8.98% | 603,427 | 1.7% |
[ 9.0% - 9.5% ] 9.29% | 716,774 | 2.3% |
[ 9.5% - 10.0% ] 9.63% | 700,376 | 1.8% |
[ 9.5% - 10.0% ] 9.95% | 641,314 | 1.8% |
[ 10.0% - 10.5% ] 10.36% | 531,420 | 2.0% |
[ 10.5% - 11.0% ] 10.67% | 548,797 | 1.6% |
[ 11.0% - 11.5% ] 11.08% | 647,691 | 1.9% |
[ 11.0% - 11.5% ] 11.38% | 926,761 | 1.6% |
[ 11.5% - 12.0% ] 11.83% | 173,986 | 1.6% |
[ 12.0% - 12.5% ] 12.07% | 523,120 | 1.7% |
[ 12.0% - 12.5% ] 12.38% | 427,516 | 1.8% |
[ 12.5% - 13.0% ] 12.80% | 843,636 | 2.0% |
[ 13.0% - 13.5% ] 13.10% | 421,856 | 1.5% |
[ 13.5% - 14.0% ] 13.62% | 492,269 | 1.7% |
[ 13.5% - 14.0% ] 13.87% | 296,031 | 2.1% |
[ 14.0% - 14.5% ] 14.23% | 373,043 | 1.4% |
[ 14.5% - 15.0% ] 14.56% | 678,696 | 1.9% |
[ 14.5% - 15.0% ] 14.89% | 213,574 | 1.3% |
[ 15.0% - 15.5% ] 15.35% | 394,649 | 1.5% |
[ 15.5% - 16.0% ] 15.60% | 235,822 | 1.7% |
[ 15.5% - 16.0% ] 15.96% | 143,844 | 1.8% |
[ 16.0% - 16.5% ] 16.34% | 94,193 | 1.3% |
[ 16.5% - 17.0% ] 16.61% | 210,115 | 2.3% |
[ 17.0% - 17.5% ] 17.02% | 75,830 | 2.1% |
[ 17.0% - 17.5% ] 17.47% | 34,484 | 1.7% |
[ 17.5% - 18.0% ] 17.72% | 482,639 | 1.2% |
[ 18.0% - 18.5% ] 18.00% | 256,305 | 2.1% |
[ 18.0% - 18.5% ] 18.36% | 95,553 | 1.1% |
[ 18.5% - 19.0% ] 18.82% | 157,862 | 1.2% |
[ 19.0% - 19.5% ] 19.14% | 10,341 | 2.4% |
[ 19.5% - 20.0% ] 19.51% | 332,773 | 2.0% |
[ 19.5% - 20.0% ] 19.85% | 121,376 | 1.5% |
[ 20.0% - 20.5% ] 20.10% | 223,691 | 1.8% |
[ 20.5% - 21.0% ] 20.61% | 85,133 | 1.8% |
[ 20.5% - 21.0% ] 20.81% | 269,353 | 1.7% |
[ 21.0% - 21.5% ] 21.28% | 139,153 | 1.5% |
[ 21.5% - 22.0% ] 21.57% | 93,540 | 1.8% |
[ 21.5% - 22.0% ] 21.83% | 103,197 | 2.1% |
[ 22.0% - 22.5% ] 22.29% | 120,806 | 1.3% |
[ 22.5% - 23.0% ] 22.68% | 208,151 | 1.8% |
[ 22.5% - 23.0% ] 22.84% | 106,155 | 1.8% |
[ 23.0% - 23.5% ] 23.25% | 36,973 | 2.1% |
[ 23.5% - 24.0% ] 23.64% | 101,208 | 0.93% |
[ 23.5% - 24.0% ] 23.95% | 47,922 | 3.1% |
[ 24.0% - 24.5% ] 24.45% | 248,641 | 1.4% |
[ 24.5% - 25.0% ] 24.81% | 8,456 | 0.90% |
[ 25.0% - 25.5% ] 25.01% | 20,651 | 0.89% |
[ 25.0% - 25.5% ] 25.35% | 30,207 | 1.3% |
[ 25.5% - 26.0% ] 25.89% | 224 | 3.1% |
[ 26.5% - 27.0% ] 26.61% | 27,571 | 3.2% |
[ 26.5% - 27.0% ] 26.78% | 114,355 | 2.2% |
[ 27.0% - 27.5% ] 27.23% | 188,552 | 1.8% |
[ 27.0% - 27.5% ] 27.38% | 22,852 | 1.7% |
[ 28.0% - 28.5% ] 28.34% | 18,949 | 0.66% |
[ 28.5% - 29.0% ] 28.70% | 69,659 | 1.5% |
[ 28.5% - 29.0% ] 28.87% | 95,566 | 2.4% |
[ 29.5% - 30.0% ] 29.54% | 62,554 | 0.76% |
[ 29.5% - 30.0% ] 29.83% | 257,729 | 2.0% |
[ 30.0% - 30.5% ] 30.38% | 76,956 | 1.7% |
[ 30.5% - 31.0% ] 30.61% | 51,153 | 1.7% |
[ 30.5% - 31.0% ] 30.99% | 102,097 | 1.8% |
[ 31.5% - 32.0% ] 31.68% | 30,392 | 2.0% |
[ 32.0% - 32.5% ] 32.12% | 3,695 | 1.7% |
[ 32.5% - 33.0% ] 32.52% | 61,363 | 1.0% |
[ 32.5% - 33.0% ] 32.75% | 2,766 | 0.43% |
[ 33.0% - 33.5% ] 33.28% | 5,018 | 2.1% |
[ 33.0% - 33.5% ] 33.44% | 21,806 | 2.6% |
[ 34.0% - 34.5% ] 34.38% | 15,702 | 3.0% |
[ 34.5% - 35.0% ] 34.86% | 68,587 | 1.1% |
[ 35.5% - 36.0% ] 35.98% | 29,756 | 1.4% |
[ 36.0% - 36.5% ] 36.22% | 2,145 | 1.2% |
[ 36.5% - 37.0% ] 36.59% | 20,954 | 1.1% |
[ 36.5% - 37.0% ] 36.84% | 1,425 | 0.89% |
[ 37.0% - 37.5% ] 37.20% | 53,464 | 1.9% |
[ 38.0% - 38.5% ] 38.27% | 23,274 | 1.2% |
[ 38.5% - 39.0% ] 38.87% | 2,560 | 1.4% |
[ 39.0% - 39.5% ] 39.23% | 6,773 | 3.1% |
[ 43.0% - 43.5% ] 43.50% | 9,750 | 0.48% |
[ 44.5% - 45.0% ] 44.79% | 53,744 | 2.0% |
[ 46.5% - 47.0% ] 46.92% | 21,452 | 1.2% |
[ 47.0% - 47.5% ] 47.30% | 20,693 | 1.3% |
[ 47.5% - 48.0% ] 47.55% | 44,570 | 1.0% |
[ 47.5% - 48.0% ] 47.76% | 10,514 | 0.030% |
[ 53.5% - 54.0% ] 53.99% | 40,614 | 2.3% |