Thai Receiving Food Stamps
COMPARE
Thai
Select to Compare
Receiving Food Stamps
Thai Receiving Food Stamps
8.1%
PUBLIC INCOME | FOOD STAMPS
100.0/ 100
METRIC RATING
5th/ 347
METRIC RANK
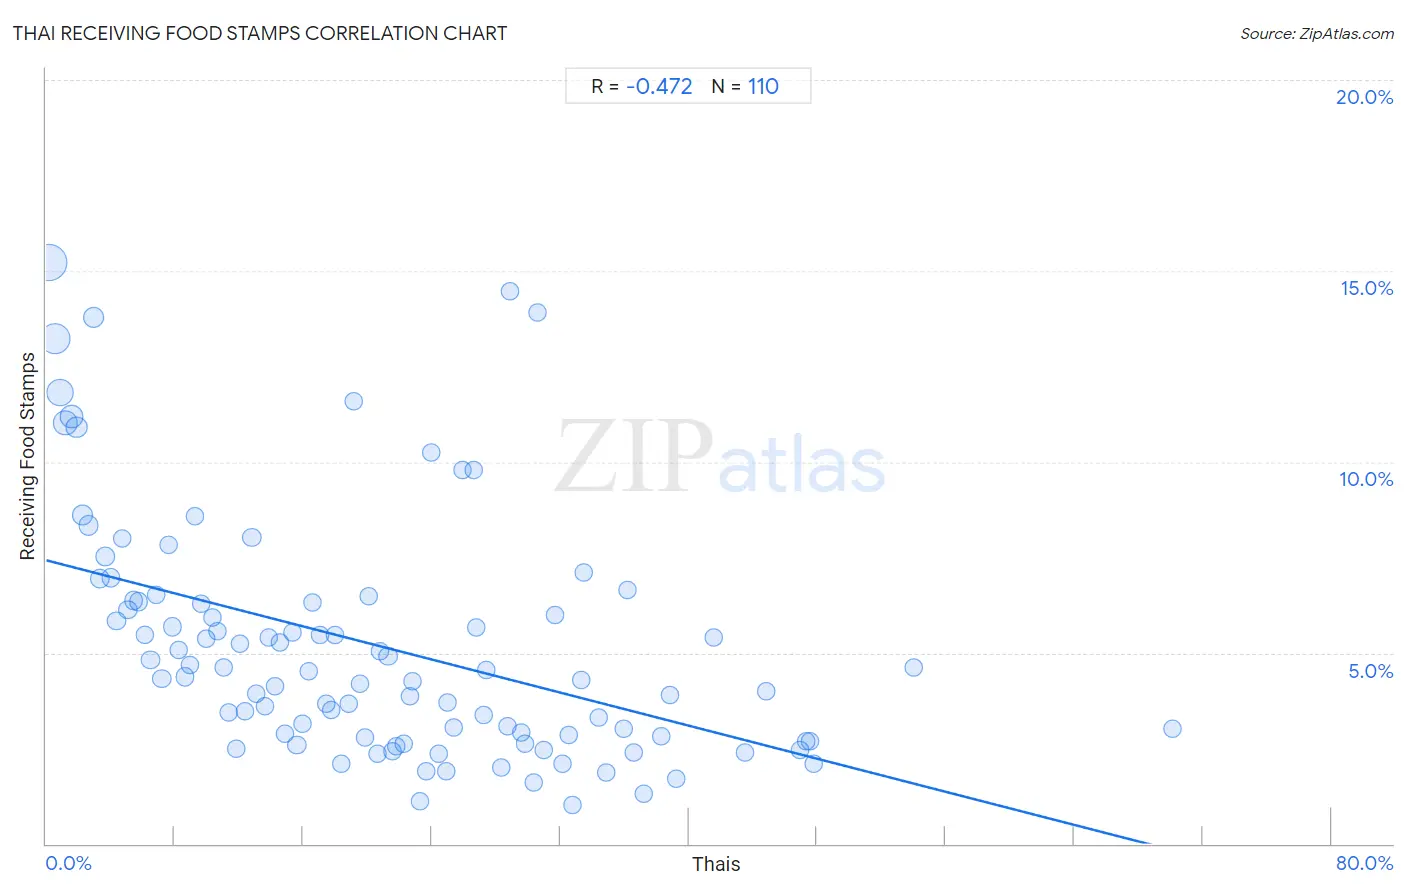
Thai Receiving Food Stamps Correlation Chart
The statistical analysis conducted on geographies consisting of 473,754,114 people shows a moderate negative correlation between the proportion of Thais and percentage of population receiving government assistance and/or food stamps in the United States with a correlation coefficient (R) of -0.472 and weighted average of 8.1%. On average, for every 1% (one percent) increase in Thais within a typical geography, there is a decrease of 0.11% in percentage of population receiving government assistance and/or food stamps.
It is essential to understand that the correlation between the percentage of Thais and percentage of population receiving government assistance and/or food stamps does not imply a direct cause-and-effect relationship. It remains uncertain whether the presence of Thais influences an upward or downward trend in the level of percentage of population receiving government assistance and/or food stamps within an area, or if Thais simply ended up residing in those areas with higher or lower levels of percentage of population receiving government assistance and/or food stamps due to other factors.
Demographics Similar to Thais by Receiving Food Stamps
In terms of receiving food stamps, the demographic groups most similar to Thais are Iranian (7.9%, a difference of 2.3%), Immigrants from Singapore (8.3%, a difference of 2.3%), Immigrants from Iran (8.3%, a difference of 2.9%), Burmese (8.6%, a difference of 6.6%), and Immigrants from Korea (8.7%, a difference of 6.8%).
| Demographics | Rating | Rank | Receiving Food Stamps |
| Immigrants from Taiwan | 100.0 /100 | #1 | Exceptional 7.3% |
| Immigrants from India | 100.0 /100 | #2 | Exceptional 7.4% |
| Filipinos | 100.0 /100 | #3 | Exceptional 7.4% |
| Iranians | 100.0 /100 | #4 | Exceptional 7.9% |
| Thais | 100.0 /100 | #5 | Exceptional 8.1% |
| Immigrants from Singapore | 100.0 /100 | #6 | Exceptional 8.3% |
| Immigrants from Iran | 100.0 /100 | #7 | Exceptional 8.3% |
| Burmese | 99.9 /100 | #8 | Exceptional 8.6% |
| Immigrants from Korea | 99.9 /100 | #9 | Exceptional 8.7% |
| Immigrants from South Central Asia | 99.9 /100 | #10 | Exceptional 8.8% |
| Okinawans | 99.9 /100 | #11 | Exceptional 8.9% |
| Cypriots | 99.9 /100 | #12 | Exceptional 8.9% |
| Bulgarians | 99.9 /100 | #13 | Exceptional 8.9% |
| Maltese | 99.9 /100 | #14 | Exceptional 8.9% |
| Norwegians | 99.9 /100 | #15 | Exceptional 9.0% |
Thai Receiving Food Stamps Correlation Summary
| Measurement | Thai Data | Receiving Food Stamps Data |
| Minimum | 0.16% | 1.0% |
| Maximum | 70.1% | 15.2% |
| Range | 69.9% | 14.2% |
| Mean | 20.7% | 5.2% |
| Median | 19.3% | 4.4% |
| Interquartile 25% (IQ1) | 9.6% | 2.8% |
| Interquartile 75% (IQ3) | 29.8% | 6.3% |
| Interquartile Range (IQR) | 20.2% | 3.5% |
| Standard Deviation (Sample) | 13.7% | 3.1% |
| Standard Deviation (Population) | 13.7% | 3.1% |
Correlation Details
| Thai Percentile | Sample Size | Receiving Food Stamps |
[ 0.0% - 0.5% ] 0.16% | 128,126,791 | 15.2% |
[ 0.5% - 1.0% ] 0.52% | 86,014,181 | 13.2% |
[ 0.5% - 1.0% ] 0.86% | 58,948,753 | 11.8% |
[ 1.0% - 1.5% ] 1.20% | 38,123,473 | 11.0% |
[ 1.5% - 2.0% ] 1.56% | 30,053,935 | 11.2% |
[ 1.5% - 2.0% ] 1.90% | 20,814,902 | 10.9% |
[ 2.0% - 2.5% ] 2.27% | 16,488,106 | 8.6% |
[ 2.5% - 3.0% ] 2.61% | 11,423,291 | 8.3% |
[ 2.5% - 3.0% ] 2.96% | 18,847,459 | 13.8% |
[ 3.0% - 3.5% ] 3.32% | 10,409,215 | 6.9% |
[ 3.5% - 4.0% ] 3.67% | 5,227,697 | 7.5% |
[ 4.0% - 4.5% ] 4.02% | 5,226,513 | 7.0% |
[ 4.0% - 4.5% ] 4.38% | 4,926,819 | 5.8% |
[ 4.5% - 5.0% ] 4.73% | 3,860,305 | 8.0% |
[ 5.0% - 5.5% ] 5.09% | 3,360,902 | 6.1% |
[ 5.0% - 5.5% ] 5.42% | 2,249,919 | 6.4% |
[ 5.5% - 6.0% ] 5.76% | 3,242,001 | 6.3% |
[ 6.0% - 6.5% ] 6.16% | 1,852,439 | 5.5% |
[ 6.0% - 6.5% ] 6.50% | 1,510,420 | 4.8% |
[ 6.5% - 7.0% ] 6.81% | 1,426,862 | 6.5% |
[ 7.0% - 7.5% ] 7.20% | 1,107,321 | 4.3% |
[ 7.5% - 8.0% ] 7.60% | 1,941,207 | 7.8% |
[ 7.5% - 8.0% ] 7.89% | 1,115,790 | 5.7% |
[ 8.0% - 8.5% ] 8.24% | 786,010 | 5.1% |
[ 8.5% - 9.0% ] 8.62% | 855,708 | 4.4% |
[ 8.5% - 9.0% ] 8.98% | 602,861 | 4.7% |
[ 9.0% - 9.5% ] 9.29% | 711,453 | 8.6% |
[ 9.5% - 10.0% ] 9.63% | 696,037 | 6.3% |
[ 9.5% - 10.0% ] 9.95% | 623,488 | 5.4% |
[ 10.0% - 10.5% ] 10.36% | 521,386 | 5.9% |
[ 10.5% - 11.0% ] 10.67% | 546,123 | 5.6% |
[ 11.0% - 11.5% ] 11.07% | 642,455 | 4.6% |
[ 11.0% - 11.5% ] 11.38% | 926,428 | 3.4% |
[ 11.5% - 12.0% ] 11.83% | 174,555 | 2.5% |
[ 12.0% - 12.5% ] 12.07% | 525,182 | 5.2% |
[ 12.0% - 12.5% ] 12.37% | 424,692 | 3.5% |
[ 12.5% - 13.0% ] 12.80% | 843,636 | 8.0% |
[ 13.0% - 13.5% ] 13.10% | 419,554 | 3.9% |
[ 13.5% - 14.0% ] 13.63% | 483,514 | 3.6% |
[ 13.5% - 14.0% ] 13.87% | 299,564 | 5.4% |
[ 14.0% - 14.5% ] 14.23% | 373,043 | 4.1% |
[ 14.5% - 15.0% ] 14.56% | 675,197 | 5.3% |
[ 14.5% - 15.0% ] 14.89% | 211,887 | 2.9% |
[ 15.0% - 15.5% ] 15.35% | 394,649 | 5.5% |
[ 15.5% - 16.0% ] 15.60% | 235,822 | 2.6% |
[ 15.5% - 16.0% ] 15.96% | 143,844 | 3.1% |
[ 16.0% - 16.5% ] 16.35% | 90,375 | 4.5% |
[ 16.5% - 17.0% ] 16.61% | 210,115 | 6.3% |
[ 17.0% - 17.5% ] 17.02% | 75,830 | 5.5% |
[ 17.0% - 17.5% ] 17.47% | 34,484 | 3.7% |
[ 17.5% - 18.0% ] 17.72% | 482,187 | 3.5% |
[ 18.0% - 18.5% ] 18.00% | 258,449 | 5.5% |
[ 18.0% - 18.5% ] 18.36% | 95,553 | 2.1% |
[ 18.5% - 19.0% ] 18.82% | 158,081 | 3.7% |
[ 19.0% - 19.5% ] 19.14% | 10,341 | 11.6% |
[ 19.5% - 20.0% ] 19.51% | 332,773 | 4.2% |
[ 19.5% - 20.0% ] 19.85% | 121,376 | 2.8% |
[ 20.0% - 20.5% ] 20.10% | 223,691 | 6.5% |
[ 20.5% - 21.0% ] 20.61% | 85,133 | 2.3% |
[ 20.5% - 21.0% ] 20.81% | 264,653 | 5.0% |
[ 21.0% - 21.5% ] 21.28% | 139,153 | 4.9% |
[ 21.5% - 22.0% ] 21.57% | 93,540 | 2.4% |
[ 21.5% - 22.0% ] 21.83% | 101,053 | 2.6% |
[ 22.0% - 22.5% ] 22.29% | 120,806 | 2.6% |
[ 22.5% - 23.0% ] 22.68% | 208,151 | 3.9% |
[ 22.5% - 23.0% ] 22.84% | 106,155 | 4.2% |
[ 23.0% - 23.5% ] 23.25% | 37,071 | 1.1% |
[ 23.5% - 24.0% ] 23.64% | 101,208 | 1.9% |
[ 23.5% - 24.0% ] 23.95% | 48,552 | 10.3% |
[ 24.0% - 24.5% ] 24.45% | 248,641 | 2.4% |
[ 24.5% - 25.0% ] 24.87% | 599 | 1.9% |
[ 25.0% - 25.5% ] 25.01% | 20,339 | 3.7% |
[ 25.0% - 25.5% ] 25.35% | 30,207 | 3.1% |
[ 25.5% - 26.0% ] 25.89% | 224 | 9.8% |
[ 26.5% - 27.0% ] 26.61% | 27,571 | 9.8% |
[ 26.5% - 27.0% ] 26.78% | 114,355 | 5.6% |
[ 27.0% - 27.5% ] 27.23% | 188,552 | 3.4% |
[ 27.0% - 27.5% ] 27.38% | 22,077 | 4.6% |
[ 28.0% - 28.5% ] 28.34% | 18,949 | 2.0% |
[ 28.5% - 29.0% ] 28.70% | 69,659 | 3.1% |
[ 28.5% - 29.0% ] 28.87% | 95,566 | 14.5% |
[ 29.5% - 30.0% ] 29.54% | 62,554 | 2.9% |
[ 29.5% - 30.0% ] 29.83% | 257,729 | 2.6% |
[ 30.0% - 30.5% ] 30.38% | 76,956 | 1.6% |
[ 30.5% - 31.0% ] 30.61% | 51,153 | 13.9% |
[ 30.5% - 31.0% ] 30.99% | 101,756 | 2.5% |
[ 31.5% - 32.0% ] 31.68% | 30,392 | 6.0% |
[ 32.0% - 32.5% ] 32.12% | 3,695 | 2.1% |
[ 32.5% - 33.0% ] 32.52% | 61,363 | 2.8% |
[ 32.5% - 33.0% ] 32.75% | 2,766 | 1.0% |
[ 33.0% - 33.5% ] 33.28% | 5,018 | 4.3% |
[ 33.0% - 33.5% ] 33.44% | 21,806 | 7.1% |
[ 34.0% - 34.5% ] 34.38% | 15,702 | 3.3% |
[ 34.5% - 35.0% ] 34.86% | 68,587 | 1.9% |
[ 35.5% - 36.0% ] 35.98% | 29,756 | 3.0% |
[ 36.0% - 36.5% ] 36.21% | 2,994 | 6.6% |
[ 36.5% - 37.0% ] 36.59% | 20,954 | 2.4% |
[ 37.0% - 37.5% ] 37.20% | 53,464 | 1.3% |
[ 38.0% - 38.5% ] 38.27% | 23,274 | 2.8% |
[ 38.5% - 39.0% ] 38.87% | 2,560 | 3.9% |
[ 39.0% - 39.5% ] 39.23% | 6,773 | 1.7% |
[ 41.5% - 42.0% ] 41.53% | 118 | 5.4% |
[ 43.0% - 43.5% ] 43.50% | 9,750 | 2.4% |
[ 44.5% - 45.0% ] 44.79% | 53,744 | 4.0% |
[ 46.5% - 47.0% ] 46.92% | 21,452 | 2.4% |
[ 47.0% - 47.5% ] 47.30% | 20,693 | 2.7% |
[ 47.5% - 48.0% ] 47.55% | 44,570 | 2.7% |
[ 47.5% - 48.0% ] 47.76% | 10,514 | 2.1% |
[ 53.5% - 54.0% ] 53.99% | 40,614 | 4.6% |
[ 70.0% - 70.5% ] 70.11% | 2,549 | 3.0% |