Thai Disability Age Under 5
COMPARE
Thai
Select to Compare
Disability Age Under 5
Thai Disability Age Under 5
1.1%
DISABILITY | AGE UNDER 5
99.8/ 100
METRIC RATING
41st/ 347
METRIC RANK
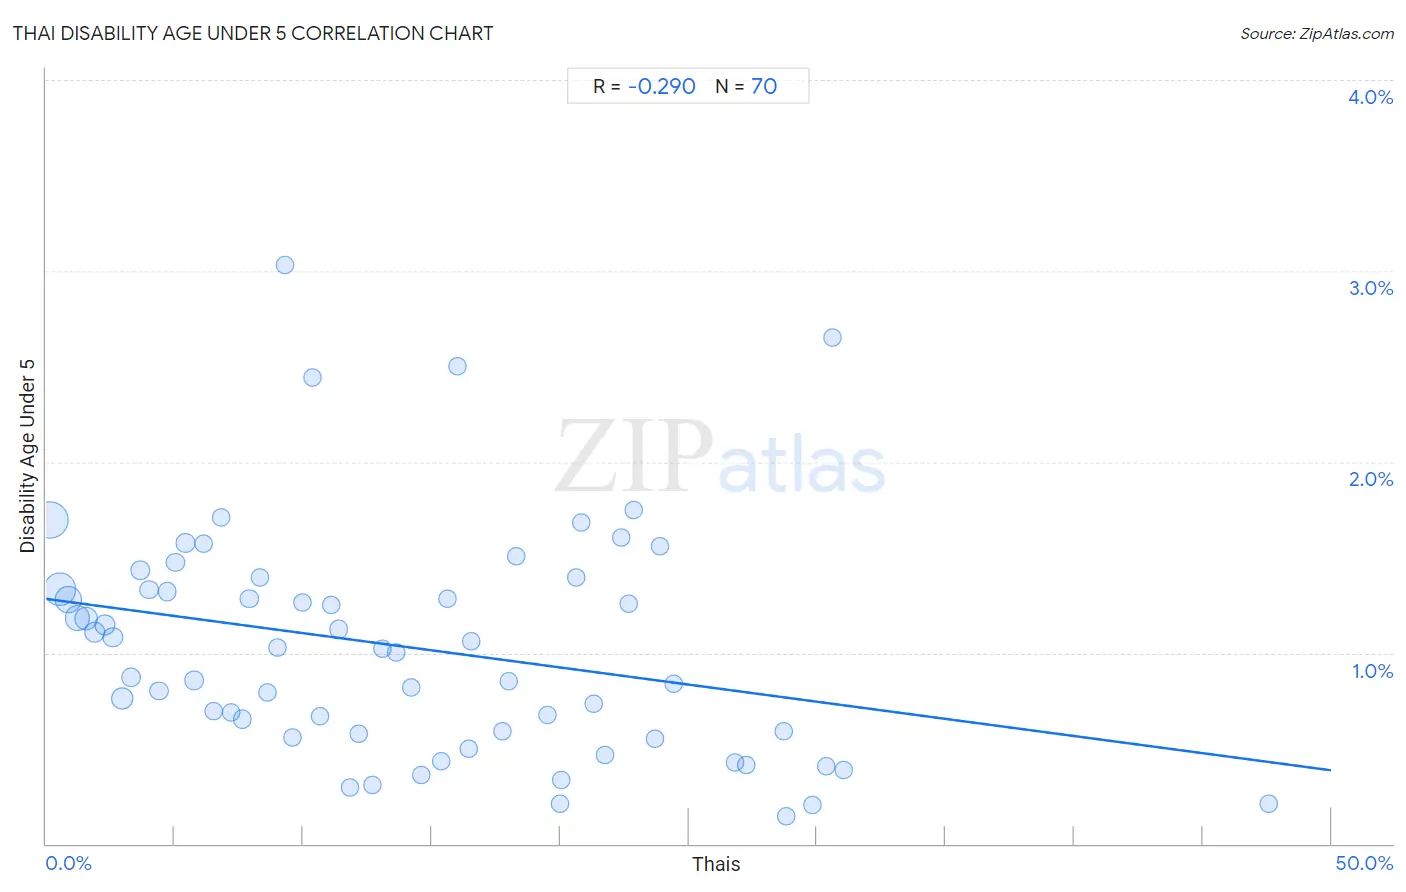
Thai Disability Age Under 5 Correlation Chart
The statistical analysis conducted on geographies consisting of 242,704,166 people shows a weak negative correlation between the proportion of Thais and percentage of population with a disability under the age of 5 in the United States with a correlation coefficient (R) of -0.290 and weighted average of 1.1%. On average, for every 1% (one percent) increase in Thais within a typical geography, there is a decrease of 0.018% in percentage of population with a disability under the age of 5.
It is essential to understand that the correlation between the percentage of Thais and percentage of population with a disability under the age of 5 does not imply a direct cause-and-effect relationship. It remains uncertain whether the presence of Thais influences an upward or downward trend in the level of percentage of population with a disability under the age of 5 within an area, or if Thais simply ended up residing in those areas with higher or lower levels of percentage of population with a disability under the age of 5 due to other factors.
Demographics Similar to Thais by Disability Age Under 5
In terms of disability age under 5, the demographic groups most similar to Thais are Immigrants from Bulgaria (1.1%, a difference of 0.10%), Pima (1.1%, a difference of 0.11%), Immigrants from Asia (1.1%, a difference of 0.21%), Immigrants from Albania (1.1%, a difference of 0.41%), and Immigrants from Turkey (1.1%, a difference of 0.43%).
| Demographics | Rating | Rank | Disability Age Under 5 |
| Immigrants from Ukraine | 99.9 /100 | #34 | Exceptional 1.0% |
| Barbadians | 99.9 /100 | #35 | Exceptional 1.0% |
| Immigrants from Nepal | 99.9 /100 | #36 | Exceptional 1.0% |
| Immigrants from India | 99.9 /100 | #37 | Exceptional 1.0% |
| Immigrants from Guyana | 99.9 /100 | #38 | Exceptional 1.0% |
| Filipinos | 99.9 /100 | #39 | Exceptional 1.1% |
| Immigrants from Albania | 99.9 /100 | #40 | Exceptional 1.1% |
| Thais | 99.8 /100 | #41 | Exceptional 1.1% |
| Immigrants from Bulgaria | 99.8 /100 | #42 | Exceptional 1.1% |
| Pima | 99.8 /100 | #43 | Exceptional 1.1% |
| Immigrants from Asia | 99.8 /100 | #44 | Exceptional 1.1% |
| Immigrants from Turkey | 99.8 /100 | #45 | Exceptional 1.1% |
| Immigrants from Congo | 99.8 /100 | #46 | Exceptional 1.1% |
| Immigrants from Sweden | 99.8 /100 | #47 | Exceptional 1.1% |
| Immigrants from Singapore | 99.7 /100 | #48 | Exceptional 1.1% |
Thai Disability Age Under 5 Correlation Summary
| Measurement | Thai Data | Disability Age Under 5 Data |
| Minimum | 0.16% | 0.14% |
| Maximum | 47.6% | 3.0% |
| Range | 47.4% | 2.9% |
| Mean | 14.0% | 1.0% |
| Median | 12.4% | 1.0% |
| Interquartile 25% (IQ1) | 6.1% | 0.58% |
| Interquartile 75% (IQ3) | 20.8% | 1.3% |
| Interquartile Range (IQR) | 14.7% | 0.76% |
| Standard Deviation (Sample) | 9.7% | 0.60% |
| Standard Deviation (Population) | 9.6% | 0.60% |
Correlation Details
| Thai Percentile | Sample Size | Disability Age Under 5 |
[ 0.0% - 0.5% ] 0.16% | 60,978,375 | 1.7% |
[ 0.5% - 1.0% ] 0.52% | 45,709,060 | 1.3% |
[ 0.5% - 1.0% ] 0.86% | 31,324,308 | 1.3% |
[ 1.0% - 1.5% ] 1.19% | 21,055,202 | 1.2% |
[ 1.5% - 2.0% ] 1.54% | 17,286,505 | 1.2% |
[ 1.5% - 2.0% ] 1.88% | 9,947,013 | 1.1% |
[ 2.0% - 2.5% ] 2.28% | 8,504,612 | 1.1% |
[ 2.5% - 3.0% ] 2.59% | 5,491,794 | 1.1% |
[ 2.5% - 3.0% ] 2.95% | 14,076,821 | 0.76% |
[ 3.0% - 3.5% ] 3.32% | 5,349,577 | 0.87% |
[ 3.5% - 4.0% ] 3.66% | 2,033,848 | 1.4% |
[ 4.0% - 4.5% ] 4.01% | 2,088,403 | 1.3% |
[ 4.0% - 4.5% ] 4.40% | 2,276,781 | 0.80% |
[ 4.5% - 5.0% ] 4.72% | 1,700,491 | 1.3% |
[ 5.0% - 5.5% ] 5.03% | 1,143,890 | 1.5% |
[ 5.0% - 5.5% ] 5.42% | 1,082,908 | 1.6% |
[ 5.5% - 6.0% ] 5.76% | 1,478,567 | 0.86% |
[ 6.0% - 6.5% ] 6.14% | 649,661 | 1.6% |
[ 6.5% - 7.0% ] 6.53% | 671,737 | 0.70% |
[ 6.5% - 7.0% ] 6.80% | 537,246 | 1.7% |
[ 7.0% - 7.5% ] 7.21% | 635,408 | 0.69% |
[ 7.5% - 8.0% ] 7.62% | 1,406,819 | 0.65% |
[ 7.5% - 8.0% ] 7.90% | 363,786 | 1.3% |
[ 8.0% - 8.5% ] 8.32% | 231,173 | 1.4% |
[ 8.5% - 9.0% ] 8.62% | 433,601 | 0.79% |
[ 9.0% - 9.5% ] 9.01% | 110,763 | 1.0% |
[ 9.0% - 9.5% ] 9.29% | 193,716 | 3.0% |
[ 9.5% - 10.0% ] 9.60% | 347,949 | 0.56% |
[ 9.5% - 10.0% ] 9.95% | 236,197 | 1.3% |
[ 10.0% - 10.5% ] 10.37% | 165,445 | 2.4% |
[ 10.5% - 11.0% ] 10.64% | 124,724 | 0.67% |
[ 11.0% - 11.5% ] 11.09% | 266,150 | 1.3% |
[ 11.0% - 11.5% ] 11.39% | 487,965 | 1.1% |
[ 11.5% - 12.0% ] 11.81% | 19,669 | 0.30% |
[ 12.0% - 12.5% ] 12.18% | 45,390 | 0.58% |
[ 12.5% - 13.0% ] 12.69% | 305,018 | 0.31% |
[ 13.0% - 13.5% ] 13.08% | 244,778 | 1.0% |
[ 13.5% - 14.0% ] 13.63% | 254,574 | 1.00% |
[ 14.0% - 14.5% ] 14.21% | 154,169 | 0.82% |
[ 14.5% - 15.0% ] 14.60% | 176,881 | 0.36% |
[ 15.0% - 15.5% ] 15.36% | 263,027 | 0.43% |
[ 15.5% - 16.0% ] 15.61% | 125,223 | 1.3% |
[ 15.5% - 16.0% ] 15.99% | 66,211 | 2.5% |
[ 16.0% - 16.5% ] 16.42% | 26,805 | 0.50% |
[ 16.5% - 17.0% ] 16.53% | 32,559 | 1.1% |
[ 17.5% - 18.0% ] 17.74% | 323,231 | 0.59% |
[ 17.5% - 18.0% ] 18.00% | 193,873 | 0.85% |
[ 18.0% - 18.5% ] 18.31% | 66,818 | 1.5% |
[ 19.5% - 20.0% ] 19.52% | 252,294 | 0.67% |
[ 19.5% - 20.0% ] 19.97% | 54,201 | 0.21% |
[ 20.0% - 20.5% ] 20.06% | 91,618 | 0.34% |
[ 20.5% - 21.0% ] 20.63% | 41,967 | 1.4% |
[ 20.5% - 21.0% ] 20.80% | 158,681 | 1.7% |
[ 21.0% - 21.5% ] 21.28% | 139,153 | 0.73% |
[ 21.5% - 22.0% ] 21.74% | 42,140 | 0.46% |
[ 22.0% - 22.5% ] 22.39% | 49,217 | 1.6% |
[ 22.5% - 23.0% ] 22.68% | 208,151 | 1.3% |
[ 22.5% - 23.0% ] 22.84% | 91,503 | 1.7% |
[ 23.5% - 24.0% ] 23.69% | 66,046 | 0.55% |
[ 23.5% - 24.0% ] 23.87% | 27,794 | 1.6% |
[ 24.0% - 24.5% ] 24.44% | 139,409 | 0.84% |
[ 26.5% - 27.0% ] 26.78% | 114,355 | 0.42% |
[ 27.0% - 27.5% ] 27.24% | 22,187 | 0.41% |
[ 28.5% - 29.0% ] 28.69% | 47,338 | 0.59% |
[ 28.5% - 29.0% ] 28.77% | 23,696 | 0.14% |
[ 29.5% - 30.0% ] 29.82% | 228,795 | 0.20% |
[ 30.0% - 30.5% ] 30.36% | 59,763 | 0.40% |
[ 30.5% - 31.0% ] 30.61% | 51,153 | 2.7% |
[ 31.0% - 31.5% ] 31.01% | 61,414 | 0.38% |
[ 47.5% - 48.0% ] 47.55% | 44,570 | 0.21% |