Swedish 4 or more Vehicles in Household
COMPARE
Swedish
Select to Compare
4 or more Vehicles in Household
Swedish 4 or more Vehicles in Household
7.6%
4+ VEHICLES AVAILABLE
100.0/ 100
METRIC RATING
58th/ 347
METRIC RANK
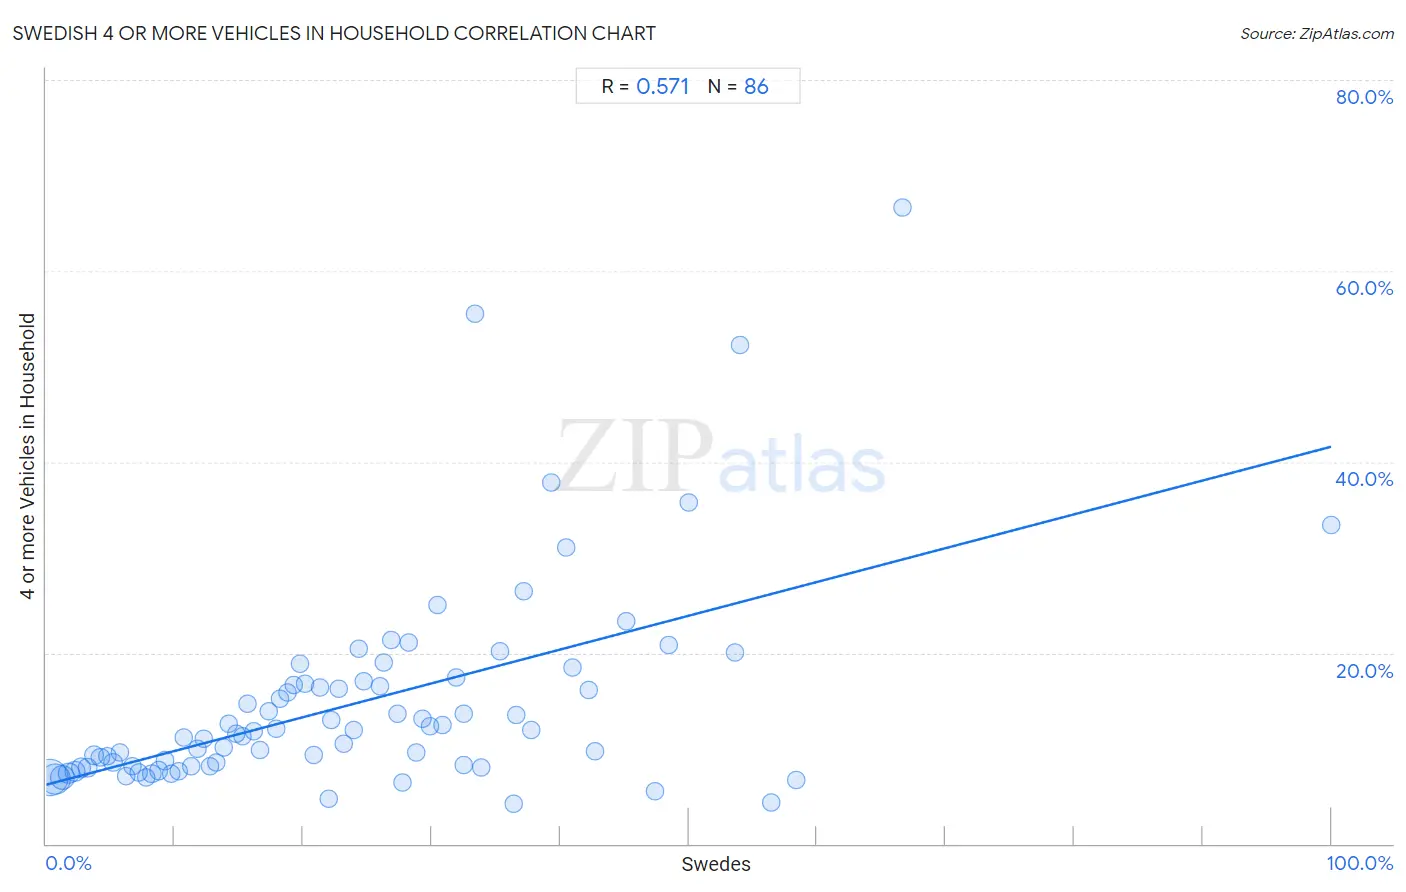
Swedish 4 or more Vehicles in Household Correlation Chart
The statistical analysis conducted on geographies consisting of 536,277,844 people shows a substantial positive correlation between the proportion of Swedes and percentage of households with 4 or more vehicles available in the United States with a correlation coefficient (R) of 0.571 and weighted average of 7.6%. On average, for every 1% (one percent) increase in Swedes within a typical geography, there is an increase of 0.35% in percentage of households with 4 or more vehicles available.
It is essential to understand that the correlation between the percentage of Swedes and percentage of households with 4 or more vehicles available does not imply a direct cause-and-effect relationship. It remains uncertain whether the presence of Swedes influences an upward or downward trend in the level of percentage of households with 4 or more vehicles available within an area, or if Swedes simply ended up residing in those areas with higher or lower levels of percentage of households with 4 or more vehicles available due to other factors.
Demographics Similar to Swedes by 4 or more Vehicles in Household
In terms of 4 or more vehicles in household, the demographic groups most similar to Swedes are Pennsylvania German (7.6%, a difference of 0.0%), Hispanic or Latino (7.6%, a difference of 0.040%), Spaniard (7.6%, a difference of 0.10%), English (7.6%, a difference of 0.12%), and Immigrants from Oceania (7.6%, a difference of 0.14%).
| Demographics | Rating | Rank | 4 or more Vehicles in Household |
| Immigrants from Laos | 100.0 /100 | #51 | Exceptional 7.7% |
| Japanese | 100.0 /100 | #52 | Exceptional 7.7% |
| Malaysians | 100.0 /100 | #53 | Exceptional 7.7% |
| Dutch | 100.0 /100 | #54 | Exceptional 7.7% |
| Immigrants from Oceania | 100.0 /100 | #55 | Exceptional 7.6% |
| English | 100.0 /100 | #56 | Exceptional 7.6% |
| Pennsylvania Germans | 100.0 /100 | #57 | Exceptional 7.6% |
| Swedes | 100.0 /100 | #58 | Exceptional 7.6% |
| Hispanics or Latinos | 100.0 /100 | #59 | Exceptional 7.6% |
| Spaniards | 100.0 /100 | #60 | Exceptional 7.6% |
| Europeans | 100.0 /100 | #61 | Exceptional 7.6% |
| Chippewa | 100.0 /100 | #62 | Exceptional 7.6% |
| Immigrants from Micronesia | 100.0 /100 | #63 | Exceptional 7.6% |
| Bangladeshis | 100.0 /100 | #64 | Exceptional 7.6% |
| Immigrants from the Azores | 100.0 /100 | #65 | Exceptional 7.5% |
Swedish 4 or more Vehicles in Household Correlation Summary
| Measurement | Swedish Data | 4 or more Vehicles in Household Data |
| Minimum | 0.26% | 4.2% |
| Maximum | 100.0% | 66.7% |
| Range | 99.7% | 62.5% |
| Mean | 24.1% | 14.7% |
| Median | 21.6% | 11.6% |
| Interquartile 25% (IQ1) | 10.7% | 8.1% |
| Interquartile 75% (IQ3) | 33.3% | 16.7% |
| Interquartile Range (IQR) | 22.6% | 8.6% |
| Standard Deviation (Sample) | 17.5% | 10.8% |
| Standard Deviation (Population) | 17.4% | 10.8% |
Correlation Details
| Swedish Percentile | Sample Size | 4 or more Vehicles in Household |
[ 0.0% - 0.5% ] 0.26% | 210,520,008 | 6.9% |
[ 0.5% - 1.0% ] 0.73% | 133,674,196 | 6.8% |
[ 1.0% - 1.5% ] 1.22% | 71,063,964 | 6.9% |
[ 1.5% - 2.0% ] 1.73% | 39,656,625 | 7.4% |
[ 2.0% - 2.5% ] 2.23% | 26,065,882 | 7.6% |
[ 2.5% - 3.0% ] 2.72% | 17,917,500 | 7.9% |
[ 3.0% - 3.5% ] 3.23% | 10,661,785 | 8.0% |
[ 3.5% - 4.0% ] 3.72% | 7,213,504 | 9.2% |
[ 4.0% - 4.5% ] 4.22% | 3,600,248 | 9.1% |
[ 4.5% - 5.0% ] 4.76% | 2,513,092 | 9.2% |
[ 5.0% - 5.5% ] 5.20% | 2,221,875 | 8.6% |
[ 5.5% - 6.0% ] 5.77% | 1,690,065 | 9.5% |
[ 6.0% - 6.5% ] 6.22% | 2,034,586 | 7.0% |
[ 6.5% - 7.0% ] 6.71% | 1,237,403 | 8.2% |
[ 7.0% - 7.5% ] 7.24% | 916,408 | 7.5% |
[ 7.5% - 8.0% ] 7.77% | 1,128,978 | 7.0% |
[ 8.0% - 8.5% ] 8.22% | 724,731 | 7.3% |
[ 8.5% - 9.0% ] 8.75% | 615,112 | 7.7% |
[ 9.0% - 9.5% ] 9.23% | 543,776 | 8.7% |
[ 9.5% - 10.0% ] 9.72% | 527,043 | 7.3% |
[ 10.0% - 10.5% ] 10.28% | 297,839 | 7.5% |
[ 10.5% - 11.0% ] 10.70% | 162,530 | 11.1% |
[ 11.0% - 11.5% ] 11.24% | 226,248 | 8.2% |
[ 11.5% - 12.0% ] 11.77% | 100,764 | 9.9% |
[ 12.0% - 12.5% ] 12.25% | 143,340 | 11.0% |
[ 12.5% - 13.0% ] 12.74% | 148,522 | 8.1% |
[ 13.0% - 13.5% ] 13.21% | 136,906 | 8.6% |
[ 13.5% - 14.0% ] 13.78% | 91,929 | 10.1% |
[ 14.0% - 14.5% ] 14.18% | 50,218 | 12.6% |
[ 14.5% - 15.0% ] 14.77% | 56,217 | 11.5% |
[ 15.0% - 15.5% ] 15.27% | 58,795 | 11.3% |
[ 15.5% - 16.0% ] 15.67% | 26,425 | 14.7% |
[ 16.0% - 16.5% ] 16.18% | 37,611 | 11.7% |
[ 16.5% - 17.0% ] 16.59% | 44,163 | 9.8% |
[ 17.0% - 17.5% ] 17.31% | 18,143 | 13.9% |
[ 17.5% - 18.0% ] 17.86% | 26,583 | 12.0% |
[ 18.0% - 18.5% ] 18.20% | 10,547 | 15.2% |
[ 18.5% - 19.0% ] 18.78% | 5,618 | 15.9% |
[ 19.0% - 19.5% ] 19.31% | 14,716 | 16.7% |
[ 19.5% - 20.0% ] 19.78% | 13,798 | 18.9% |
[ 20.0% - 20.5% ] 20.18% | 16,501 | 16.7% |
[ 20.5% - 21.0% ] 20.78% | 4,677 | 9.3% |
[ 21.0% - 21.5% ] 21.32% | 2,139 | 16.4% |
[ 21.5% - 22.0% ] 21.95% | 3,517 | 4.7% |
[ 22.0% - 22.5% ] 22.19% | 1,920 | 13.0% |
[ 22.5% - 23.0% ] 22.74% | 4,023 | 16.2% |
[ 23.0% - 23.5% ] 23.15% | 5,917 | 10.5% |
[ 23.5% - 24.0% ] 23.91% | 2,581 | 11.9% |
[ 24.0% - 24.5% ] 24.33% | 3,819 | 20.4% |
[ 24.5% - 25.0% ] 24.76% | 3,906 | 17.1% |
[ 25.5% - 26.0% ] 25.93% | 4,072 | 16.5% |
[ 26.0% - 26.5% ] 26.23% | 3,789 | 18.9% |
[ 26.5% - 27.0% ] 26.81% | 2,331 | 21.3% |
[ 27.0% - 27.5% ] 27.35% | 2,534 | 13.6% |
[ 27.5% - 28.0% ] 27.68% | 1,398 | 6.4% |
[ 28.0% - 28.5% ] 28.17% | 1,608 | 21.1% |
[ 28.5% - 29.0% ] 28.75% | 1,955 | 9.6% |
[ 29.0% - 29.5% ] 29.31% | 348 | 13.1% |
[ 29.5% - 30.0% ] 29.86% | 2,880 | 12.3% |
[ 30.0% - 30.5% ] 30.43% | 23 | 25.0% |
[ 30.5% - 31.0% ] 30.80% | 276 | 12.5% |
[ 31.5% - 32.0% ] 31.89% | 1,251 | 17.5% |
[ 32.0% - 32.5% ] 32.48% | 311 | 13.6% |
[ 32.5% - 33.0% ] 32.52% | 1,891 | 8.3% |
[ 33.0% - 33.5% ] 33.33% | 15 | 55.6% |
[ 33.5% - 34.0% ] 33.82% | 479 | 7.9% |
[ 35.0% - 35.5% ] 35.27% | 224 | 20.1% |
[ 36.0% - 36.5% ] 36.36% | 44 | 4.2% |
[ 36.5% - 37.0% ] 36.54% | 353 | 13.5% |
[ 37.0% - 37.5% ] 37.16% | 1,402 | 26.4% |
[ 37.5% - 38.0% ] 37.75% | 347 | 11.9% |
[ 39.0% - 39.5% ] 39.33% | 150 | 37.8% |
[ 40.0% - 40.5% ] 40.43% | 507 | 31.1% |
[ 40.5% - 41.0% ] 40.92% | 325 | 18.5% |
[ 42.0% - 42.5% ] 42.19% | 429 | 16.1% |
[ 42.5% - 43.0% ] 42.69% | 616 | 9.7% |
[ 45.0% - 45.5% ] 45.12% | 430 | 23.3% |
[ 47.0% - 47.5% ] 47.37% | 19 | 5.6% |
[ 48.0% - 48.5% ] 48.40% | 374 | 20.8% |
[ 50.0% - 50.5% ] 50.00% | 128 | 35.7% |
[ 53.5% - 54.0% ] 53.57% | 28 | 20.0% |
[ 54.0% - 54.5% ] 54.01% | 274 | 52.3% |
[ 56.0% - 56.5% ] 56.39% | 133 | 4.3% |
[ 58.0% - 58.5% ] 58.33% | 180 | 6.6% |
[ 66.5% - 67.0% ] 66.67% | 9 | 66.7% |
[ 99.5% - 100.0% ] 100.00% | 18 | 33.3% |