Swedish Unemployment Among Women with Children Ages 6 to 17 years
COMPARE
Swedish
Select to Compare
Unemployment Among Women with Children Ages 6 to 17 years
Swedish Unemployment Among Women with Children Ages 6 to 17 years
8.6%
UNEMPLOYMENT | WOMEN W/ CHILDREN 6 TO 17
97.6/ 100
METRIC RATING
108th/ 347
METRIC RANK
Swedish Unemployment Among Women with Children Ages 6 to 17 years Correlation Chart
The statistical analysis conducted on geographies consisting of 343,411,572 people shows a mild positive correlation between the proportion of Swedes and unemployment rate among women with children between the ages 6 and 17 in the United States with a correlation coefficient (R) of 0.340 and weighted average of 8.6%. On average, for every 1% (one percent) increase in Swedes within a typical geography, there is an increase of 0.50% in unemployment rate among women with children between the ages 6 and 17.
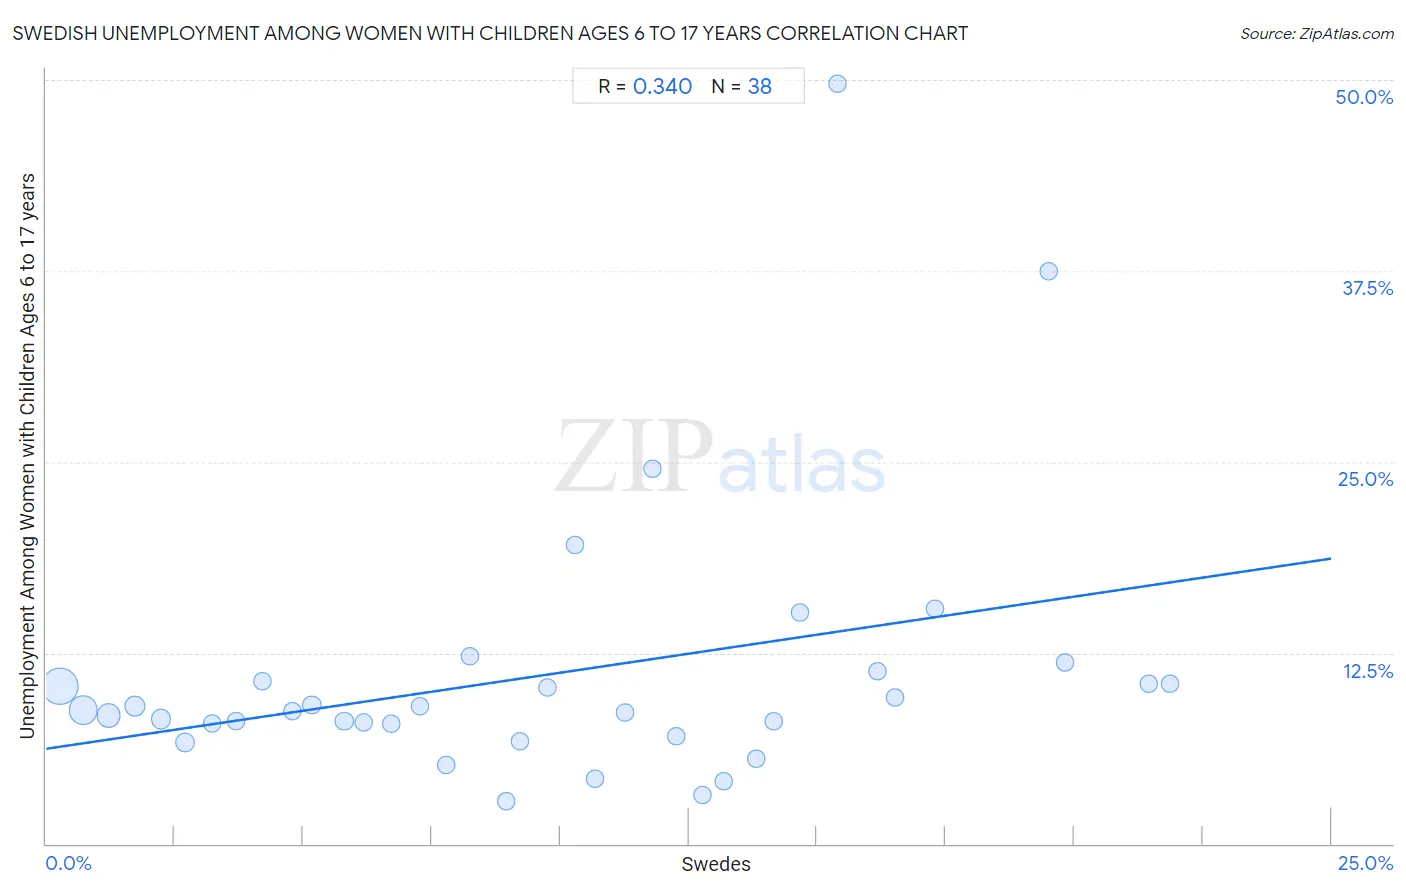
It is essential to understand that the correlation between the percentage of Swedes and unemployment rate among women with children between the ages 6 and 17 does not imply a direct cause-and-effect relationship. It remains uncertain whether the presence of Swedes influences an upward or downward trend in the level of unemployment rate among women with children between the ages 6 and 17 within an area, or if Swedes simply ended up residing in those areas with higher or lower levels of unemployment rate among women with children between the ages 6 and 17 due to other factors.
Demographics Similar to Swedes by Unemployment Among Women with Children Ages 6 to 17 years
In terms of unemployment among women with children ages 6 to 17 years, the demographic groups most similar to Swedes are Chickasaw (8.6%, a difference of 0.010%), Immigrants from Serbia (8.6%, a difference of 0.040%), Immigrants from Romania (8.6%, a difference of 0.070%), Immigrants from Norway (8.6%, a difference of 0.080%), and Latvian (8.6%, a difference of 0.080%).
| Demographics | Rating | Rank | Unemployment Among Women with Children Ages 6 to 17 years |
| Immigrants from Pakistan | 98.4 /100 | #101 | Exceptional 8.6% |
| Immigrants from South Africa | 98.3 /100 | #102 | Exceptional 8.6% |
| Scandinavians | 98.3 /100 | #103 | Exceptional 8.6% |
| Immigrants from France | 98.0 /100 | #104 | Exceptional 8.6% |
| Immigrants from Norway | 97.8 /100 | #105 | Exceptional 8.6% |
| Immigrants from Serbia | 97.7 /100 | #106 | Exceptional 8.6% |
| Chickasaw | 97.6 /100 | #107 | Exceptional 8.6% |
| Swedes | 97.6 /100 | #108 | Exceptional 8.6% |
| Immigrants from Romania | 97.5 /100 | #109 | Exceptional 8.6% |
| Latvians | 97.4 /100 | #110 | Exceptional 8.6% |
| Immigrants from Ukraine | 97.4 /100 | #111 | Exceptional 8.6% |
| Romanians | 97.1 /100 | #112 | Exceptional 8.6% |
| Eastern Europeans | 96.8 /100 | #113 | Exceptional 8.6% |
| Immigrants from Russia | 96.7 /100 | #114 | Exceptional 8.6% |
| Argentineans | 96.5 /100 | #115 | Exceptional 8.6% |
Swedish Unemployment Among Women with Children Ages 6 to 17 years Correlation Summary
| Measurement | Swedish Data | Unemployment Among Women with Children Ages 6 to 17 years Data |
| Minimum | 0.26% | 2.8% |
| Maximum | 21.9% | 49.8% |
| Range | 21.6% | 47.0% |
| Mean | 9.8% | 11.1% |
| Median | 9.5% | 8.7% |
| Interquartile 25% (IQ1) | 4.8% | 7.9% |
| Interquartile 75% (IQ3) | 14.2% | 10.6% |
| Interquartile Range (IQR) | 9.4% | 2.7% |
| Standard Deviation (Sample) | 6.1% | 8.9% |
| Standard Deviation (Population) | 6.0% | 8.8% |
Correlation Details
| Swedish Percentile | Sample Size | Unemployment Among Women with Children Ages 6 to 17 years |
[ 0.0% - 0.5% ] 0.26% | 151,622,343 | 10.3% |
[ 0.5% - 1.0% ] 0.72% | 88,846,216 | 8.8% |
[ 1.0% - 1.5% ] 1.21% | 42,146,389 | 8.4% |
[ 1.5% - 2.0% ] 1.73% | 21,504,831 | 9.0% |
[ 2.0% - 2.5% ] 2.24% | 14,373,892 | 8.2% |
[ 2.5% - 3.0% ] 2.71% | 9,602,366 | 6.6% |
[ 3.0% - 3.5% ] 3.23% | 4,749,363 | 7.9% |
[ 3.5% - 4.0% ] 3.69% | 2,797,321 | 8.0% |
[ 4.0% - 4.5% ] 4.22% | 1,033,782 | 10.6% |
[ 4.5% - 5.0% ] 4.79% | 1,053,742 | 8.7% |
[ 5.0% - 5.5% ] 5.17% | 1,056,601 | 9.1% |
[ 5.5% - 6.0% ] 5.80% | 738,527 | 8.0% |
[ 6.0% - 6.5% ] 6.17% | 1,119,670 | 7.9% |
[ 6.5% - 7.0% ] 6.71% | 586,409 | 7.9% |
[ 7.0% - 7.5% ] 7.28% | 346,201 | 9.0% |
[ 7.5% - 8.0% ] 7.78% | 504,012 | 5.2% |
[ 8.0% - 8.5% ] 8.25% | 340,761 | 12.3% |
[ 8.5% - 9.0% ] 8.96% | 53,212 | 2.8% |
[ 9.0% - 9.5% ] 9.22% | 250,328 | 6.7% |
[ 9.5% - 10.0% ] 9.75% | 211,970 | 10.3% |
[ 10.0% - 10.5% ] 10.30% | 40,396 | 19.5% |
[ 10.5% - 11.0% ] 10.68% | 53,629 | 4.2% |
[ 11.0% - 11.5% ] 11.26% | 69,869 | 8.6% |
[ 11.5% - 12.0% ] 11.80% | 24,415 | 24.6% |
[ 12.0% - 12.5% ] 12.25% | 62,455 | 7.0% |
[ 12.5% - 13.0% ] 12.77% | 40,635 | 3.2% |
[ 13.0% - 13.5% ] 13.19% | 94,978 | 4.1% |
[ 13.5% - 14.0% ] 13.81% | 16,126 | 5.6% |
[ 14.0% - 14.5% ] 14.17% | 20,571 | 8.1% |
[ 14.5% - 15.0% ] 14.66% | 19,826 | 15.1% |
[ 15.0% - 15.5% ] 15.38% | 1,885 | 49.8% |
[ 16.0% - 16.5% ] 16.16% | 15,339 | 11.3% |
[ 16.5% - 17.0% ] 16.50% | 6,411 | 9.6% |
[ 17.0% - 17.5% ] 17.29% | 902 | 15.4% |
[ 19.0% - 19.5% ] 19.49% | 949 | 37.5% |
[ 19.5% - 20.0% ] 19.81% | 4,382 | 11.9% |
[ 21.0% - 21.5% ] 21.46% | 438 | 10.5% |
[ 21.5% - 22.0% ] 21.86% | 430 | 10.5% |