Swedish vs South African Married-Couple Family Poverty
COMPARE
Swedish
South African
Married-Couple Family Poverty
Married-Couple Family Poverty Comparison
Swedes
South Africans
3.9%
MARRIED-COUPLE FAMILY POVERTY
100.0/ 100
METRIC RATING
5th/ 347
METRIC RANK
4.6%
MARRIED-COUPLE FAMILY POVERTY
98.7/ 100
METRIC RATING
85th/ 347
METRIC RANK
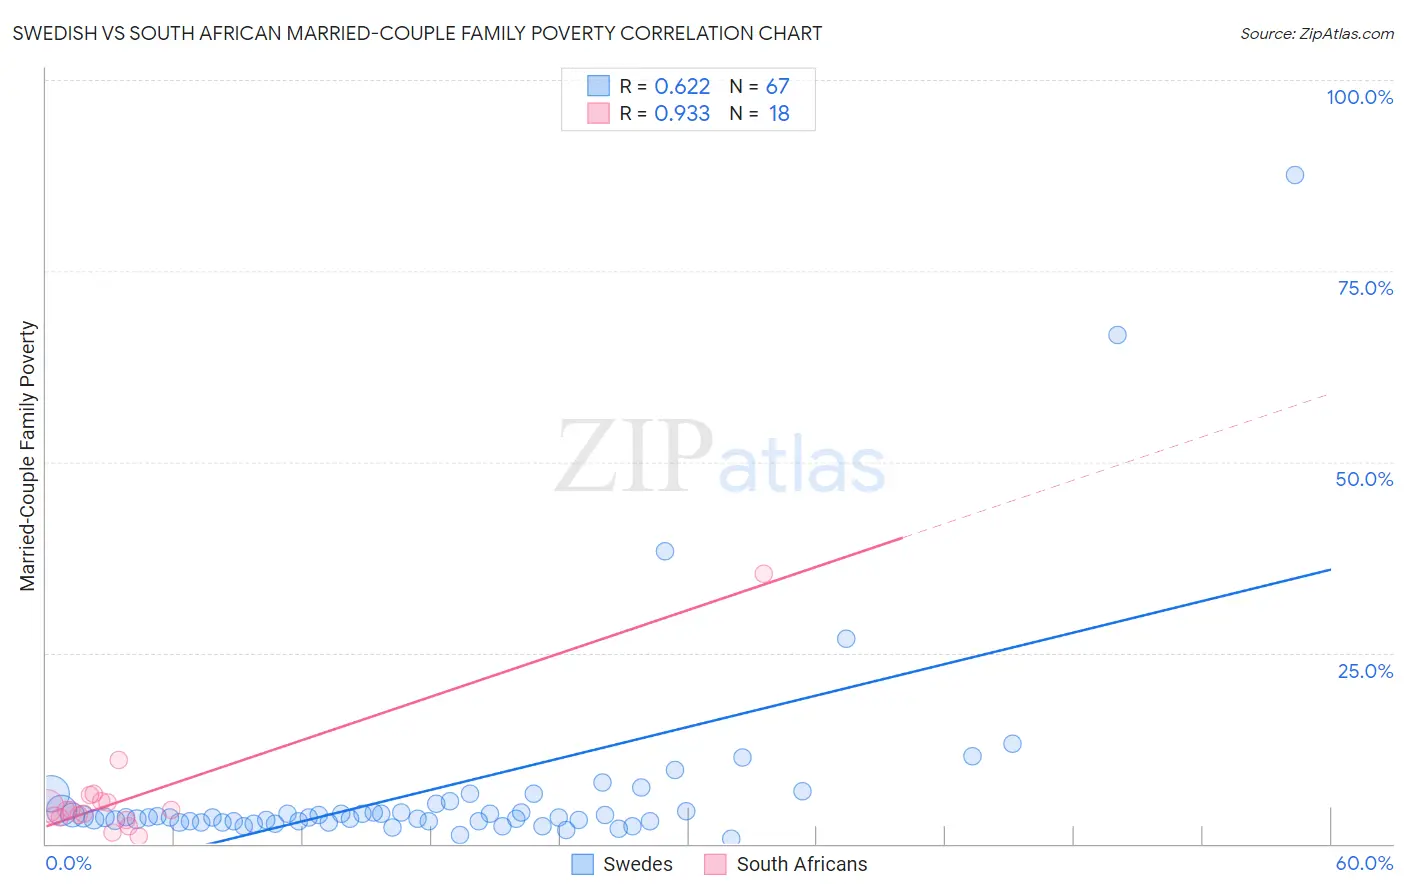
Swedish vs South African Married-Couple Family Poverty Correlation Chart
The statistical analysis conducted on geographies consisting of 527,096,192 people shows a significant positive correlation between the proportion of Swedes and poverty level among married-couple families in the United States with a correlation coefficient (R) of 0.622 and weighted average of 3.9%. Similarly, the statistical analysis conducted on geographies consisting of 181,779,474 people shows a near-perfect positive correlation between the proportion of South Africans and poverty level among married-couple families in the United States with a correlation coefficient (R) of 0.933 and weighted average of 4.6%, a difference of 18.5%.
Married-Couple Family Poverty Correlation Summary
| Measurement | Swedish | South African |
| Minimum | 0.65% | 1.00% |
| Maximum | 87.5% | 35.3% |
| Range | 86.9% | 34.3% |
| Mean | 7.1% | 6.2% |
| Median | 3.4% | 4.4% |
| Interquartile 25% (IQ1) | 2.9% | 3.5% |
| Interquartile 75% (IQ3) | 4.3% | 5.5% |
| Interquartile Range (IQR) | 1.4% | 2.1% |
| Standard Deviation (Sample) | 13.7% | 7.6% |
| Standard Deviation (Population) | 13.5% | 7.4% |
Similar Demographics by Married-Couple Family Poverty
Demographics Similar to Swedes by Married-Couple Family Poverty
In terms of married-couple family poverty, the demographic groups most similar to Swedes are Slovene (3.8%, a difference of 0.15%), Luxembourger (3.9%, a difference of 0.61%), Latvian (3.9%, a difference of 1.1%), Thai (3.9%, a difference of 1.7%), and Croatian (3.9%, a difference of 2.1%).
| Demographics | Rating | Rank | Married-Couple Family Poverty |
| Immigrants | India | 100.0 /100 | #1 | Exceptional 3.6% |
| Chinese | 100.0 /100 | #2 | Exceptional 3.6% |
| Norwegians | 100.0 /100 | #3 | Exceptional 3.7% |
| Slovenes | 100.0 /100 | #4 | Exceptional 3.8% |
| Swedes | 100.0 /100 | #5 | Exceptional 3.9% |
| Luxembourgers | 100.0 /100 | #6 | Exceptional 3.9% |
| Latvians | 100.0 /100 | #7 | Exceptional 3.9% |
| Thais | 100.0 /100 | #8 | Exceptional 3.9% |
| Croatians | 100.0 /100 | #9 | Exceptional 3.9% |
| Carpatho Rusyns | 100.0 /100 | #10 | Exceptional 3.9% |
| Lithuanians | 100.0 /100 | #11 | Exceptional 4.0% |
| Bulgarians | 100.0 /100 | #12 | Exceptional 4.0% |
| Czechs | 100.0 /100 | #13 | Exceptional 4.0% |
| Slovaks | 100.0 /100 | #14 | Exceptional 4.0% |
| Poles | 100.0 /100 | #15 | Exceptional 4.0% |
Demographics Similar to South Africans by Married-Couple Family Poverty
In terms of married-couple family poverty, the demographic groups most similar to South Africans are Immigrants from Turkey (4.6%, a difference of 0.040%), Immigrants from North Macedonia (4.6%, a difference of 0.12%), Bolivian (4.6%, a difference of 0.22%), Immigrants from Croatia (4.6%, a difference of 0.23%), and Immigrants from Czechoslovakia (4.6%, a difference of 0.33%).
| Demographics | Rating | Rank | Married-Couple Family Poverty |
| Scotch-Irish | 99.1 /100 | #78 | Exceptional 4.5% |
| Immigrants | Iran | 99.0 /100 | #79 | Exceptional 4.5% |
| Icelanders | 99.0 /100 | #80 | Exceptional 4.5% |
| Immigrants | Greece | 98.9 /100 | #81 | Exceptional 4.5% |
| Canadians | 98.8 /100 | #82 | Exceptional 4.5% |
| Immigrants | Denmark | 98.8 /100 | #83 | Exceptional 4.6% |
| Immigrants | Croatia | 98.7 /100 | #84 | Exceptional 4.6% |
| South Africans | 98.7 /100 | #85 | Exceptional 4.6% |
| Immigrants | Turkey | 98.6 /100 | #86 | Exceptional 4.6% |
| Immigrants | North Macedonia | 98.6 /100 | #87 | Exceptional 4.6% |
| Bolivians | 98.6 /100 | #88 | Exceptional 4.6% |
| Immigrants | Czechoslovakia | 98.5 /100 | #89 | Exceptional 4.6% |
| Immigrants | Switzerland | 98.5 /100 | #90 | Exceptional 4.6% |
| Basques | 98.5 /100 | #91 | Exceptional 4.6% |
| Immigrants | Norway | 98.4 /100 | #92 | Exceptional 4.6% |