Peruvian vs Apache Married-Couple Family Poverty
COMPARE
Peruvian
Apache
Married-Couple Family Poverty
Married-Couple Family Poverty Comparison
Peruvians
Apache
5.3%
MARRIED-COUPLE FAMILY POVERTY
37.6/ 100
METRIC RATING
183rd/ 347
METRIC RANK
9.0%
MARRIED-COUPLE FAMILY POVERTY
0.0/ 100
METRIC RATING
336th/ 347
METRIC RANK
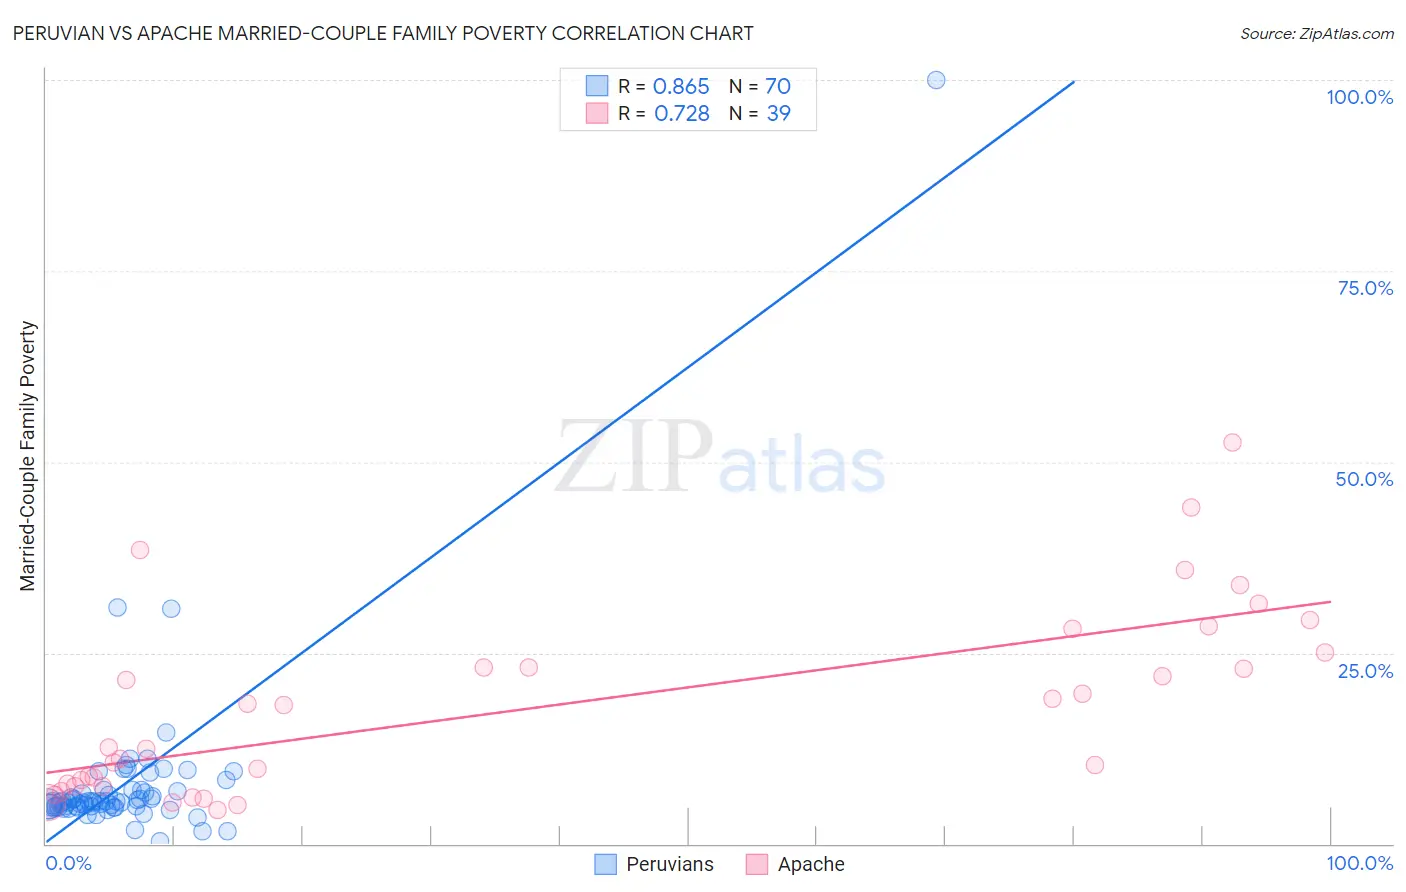
Peruvian vs Apache Married-Couple Family Poverty Correlation Chart
The statistical analysis conducted on geographies consisting of 360,614,929 people shows a very strong positive correlation between the proportion of Peruvians and poverty level among married-couple families in the United States with a correlation coefficient (R) of 0.865 and weighted average of 5.3%. Similarly, the statistical analysis conducted on geographies consisting of 230,238,952 people shows a strong positive correlation between the proportion of Apache and poverty level among married-couple families in the United States with a correlation coefficient (R) of 0.728 and weighted average of 9.0%, a difference of 69.1%.
Married-Couple Family Poverty Correlation Summary
| Measurement | Peruvian | Apache |
| Minimum | 0.26% | 4.3% |
| Maximum | 100.0% | 52.5% |
| Range | 99.7% | 48.2% |
| Mean | 8.0% | 17.8% |
| Median | 5.5% | 12.6% |
| Interquartile 25% (IQ1) | 4.9% | 7.5% |
| Interquartile 75% (IQ3) | 7.0% | 25.0% |
| Interquartile Range (IQR) | 2.2% | 17.5% |
| Standard Deviation (Sample) | 12.1% | 12.2% |
| Standard Deviation (Population) | 12.1% | 12.0% |
Similar Demographics by Married-Couple Family Poverty
Demographics Similar to Peruvians by Married-Couple Family Poverty
In terms of married-couple family poverty, the demographic groups most similar to Peruvians are Immigrants from Vietnam (5.3%, a difference of 0.010%), Immigrants from Chile (5.3%, a difference of 0.14%), Immigrants from Sierra Leone (5.3%, a difference of 0.20%), Nonimmigrants (5.3%, a difference of 0.22%), and American (5.3%, a difference of 0.28%).
| Demographics | Rating | Rank | Married-Couple Family Poverty |
| Menominee | 47.8 /100 | #176 | Average 5.2% |
| Immigrants | Kazakhstan | 45.1 /100 | #177 | Average 5.2% |
| Immigrants | Ukraine | 44.9 /100 | #178 | Average 5.2% |
| Spanish | 41.4 /100 | #179 | Average 5.3% |
| Immigrants | Sierra Leone | 39.3 /100 | #180 | Fair 5.3% |
| Immigrants | Chile | 38.8 /100 | #181 | Fair 5.3% |
| Immigrants | Vietnam | 37.7 /100 | #182 | Fair 5.3% |
| Peruvians | 37.6 /100 | #183 | Fair 5.3% |
| Immigrants | Nonimmigrants | 35.8 /100 | #184 | Fair 5.3% |
| Americans | 35.4 /100 | #185 | Fair 5.3% |
| Hungarians | 34.7 /100 | #186 | Fair 5.3% |
| Immigrants | Albania | 33.8 /100 | #187 | Fair 5.3% |
| Israelis | 33.1 /100 | #188 | Fair 5.3% |
| South American Indians | 32.5 /100 | #189 | Fair 5.3% |
| Ugandans | 31.6 /100 | #190 | Fair 5.3% |
Demographics Similar to Apache by Married-Couple Family Poverty
In terms of married-couple family poverty, the demographic groups most similar to Apache are Yakama (9.0%, a difference of 0.040%), Sioux (8.7%, a difference of 2.9%), Cheyenne (9.4%, a difference of 5.4%), Immigrants from Dominican Republic (8.4%, a difference of 6.6%), and Crow (9.6%, a difference of 6.8%).
| Demographics | Rating | Rank | Married-Couple Family Poverty |
| Natives/Alaskans | 0.0 /100 | #329 | Tragic 8.2% |
| Paiute | 0.0 /100 | #330 | Tragic 8.3% |
| Central American Indians | 0.0 /100 | #331 | Tragic 8.3% |
| Dominicans | 0.0 /100 | #332 | Tragic 8.3% |
| Lumbee | 0.0 /100 | #333 | Tragic 8.3% |
| Immigrants | Dominican Republic | 0.0 /100 | #334 | Tragic 8.4% |
| Sioux | 0.0 /100 | #335 | Tragic 8.7% |
| Apache | 0.0 /100 | #336 | Tragic 9.0% |
| Yakama | 0.0 /100 | #337 | Tragic 9.0% |
| Cheyenne | 0.0 /100 | #338 | Tragic 9.4% |
| Crow | 0.0 /100 | #339 | Tragic 9.6% |
| Yuman | 0.0 /100 | #340 | Tragic 9.7% |
| Pueblo | 0.0 /100 | #341 | Tragic 11.1% |
| Tohono O'odham | 0.0 /100 | #342 | Tragic 11.2% |
| Pima | 0.0 /100 | #343 | Tragic 11.4% |