Peruvian Female Disability
COMPARE
Peruvian
Select to Compare
Female Disability
Peruvian Female Disability
11.3%
DISABILITY | FEMALES
99.9/ 100
METRIC RATING
54th/ 347
METRIC RANK
Peruvian Female Disability Correlation Chart
The statistical analysis conducted on geographies consisting of 363,181,047 people shows a moderate positive correlation between the proportion of Peruvians and percentage of females with a disability in the United States with a correlation coefficient (R) of 0.466 and weighted average of 11.3%. On average, for every 1% (one percent) increase in Peruvians within a typical geography, there is an increase of 0.67% in percentage of females with a disability.
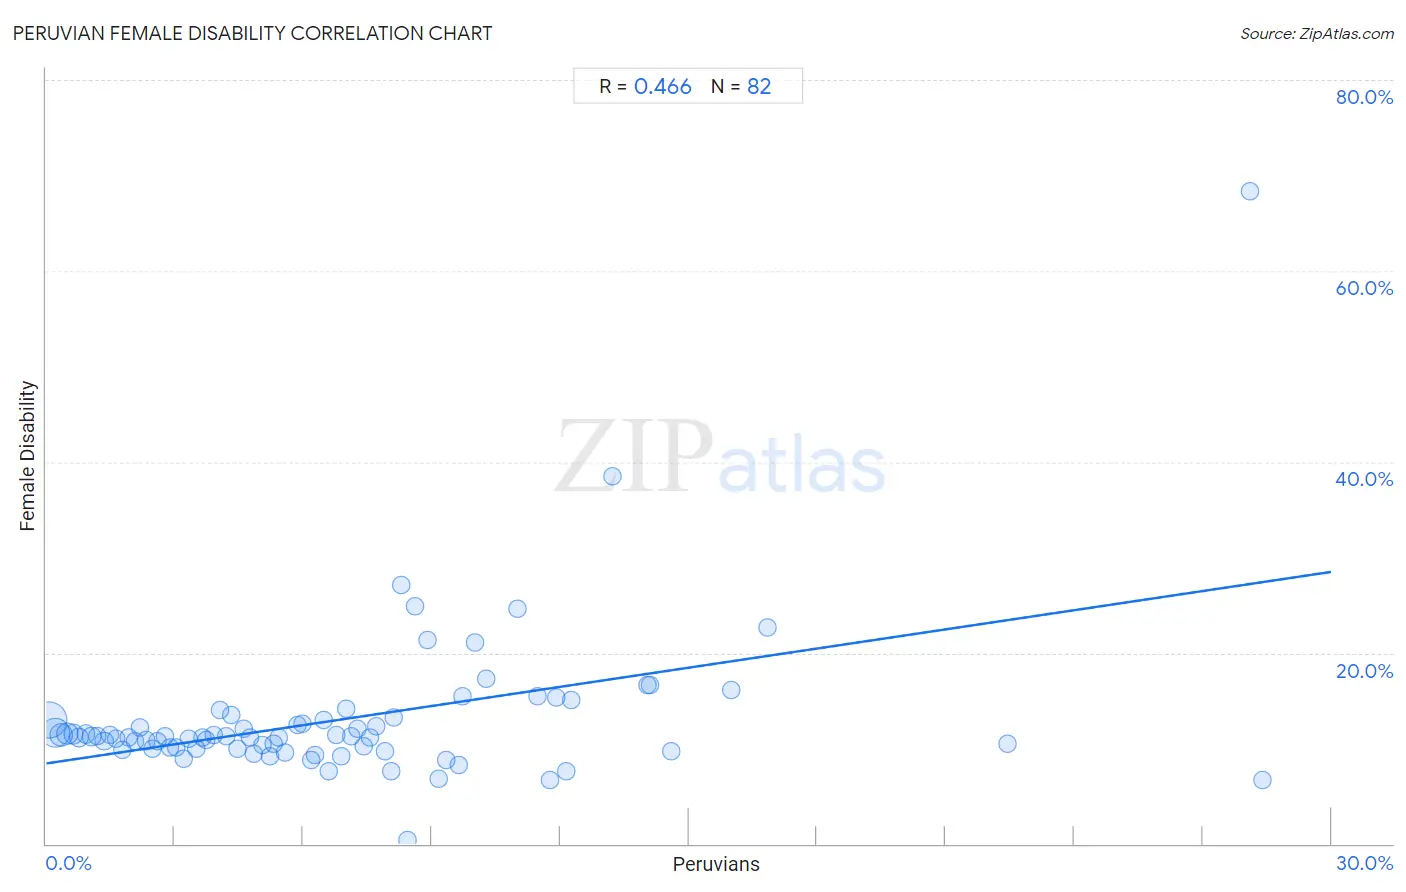
It is essential to understand that the correlation between the percentage of Peruvians and percentage of females with a disability does not imply a direct cause-and-effect relationship. It remains uncertain whether the presence of Peruvians influences an upward or downward trend in the level of percentage of females with a disability within an area, or if Peruvians simply ended up residing in those areas with higher or lower levels of percentage of females with a disability due to other factors.
Demographics Similar to Peruvians by Female Disability
In terms of female disability, the demographic groups most similar to Peruvians are Bulgarian (11.3%, a difference of 0.020%), Immigrants from Saudi Arabia (11.3%, a difference of 0.060%), Immigrants from Peru (11.3%, a difference of 0.10%), Immigrants from Belgium (11.3%, a difference of 0.22%), and Taiwanese (11.4%, a difference of 0.25%).
| Demographics | Rating | Rank | Female Disability |
| Jordanians | 100.0 /100 | #47 | Exceptional 11.3% |
| Zimbabweans | 100.0 /100 | #48 | Exceptional 11.3% |
| Tongans | 100.0 /100 | #49 | Exceptional 11.3% |
| Inupiat | 100.0 /100 | #50 | Exceptional 11.3% |
| Immigrants from Belgium | 100.0 /100 | #51 | Exceptional 11.3% |
| Immigrants from Peru | 99.9 /100 | #52 | Exceptional 11.3% |
| Immigrants from Saudi Arabia | 99.9 /100 | #53 | Exceptional 11.3% |
| Peruvians | 99.9 /100 | #54 | Exceptional 11.3% |
| Bulgarians | 99.9 /100 | #55 | Exceptional 11.3% |
| Taiwanese | 99.9 /100 | #56 | Exceptional 11.4% |
| South Americans | 99.9 /100 | #57 | Exceptional 11.4% |
| Laotians | 99.9 /100 | #58 | Exceptional 11.4% |
| Immigrants from Spain | 99.9 /100 | #59 | Exceptional 11.4% |
| Immigrants from Bulgaria | 99.9 /100 | #60 | Exceptional 11.4% |
| Immigrants from France | 99.9 /100 | #61 | Exceptional 11.4% |
Peruvian Female Disability Correlation Summary
| Measurement | Peruvian Data | Female Disability Data |
| Minimum | 0.070% | 0.45% |
| Maximum | 28.4% | 68.3% |
| Range | 28.3% | 67.8% |
| Mean | 6.9% | 13.0% |
| Median | 5.9% | 11.2% |
| Interquartile 25% (IQ1) | 2.9% | 9.9% |
| Interquartile 75% (IQ3) | 9.2% | 13.0% |
| Interquartile Range (IQR) | 6.3% | 3.1% |
| Standard Deviation (Sample) | 5.6% | 8.0% |
| Standard Deviation (Population) | 5.5% | 8.0% |
Correlation Details
| Peruvian Percentile | Sample Size | Female Disability |
[ 0.0% - 0.5% ] 0.070% | 149,461,961 | 13.0% |
[ 0.0% - 0.5% ] 0.20% | 85,481,263 | 11.7% |
[ 0.0% - 0.5% ] 0.35% | 41,175,052 | 11.4% |
[ 0.0% - 0.5% ] 0.49% | 31,977,457 | 11.5% |
[ 0.5% - 1.0% ] 0.63% | 13,897,138 | 11.5% |
[ 0.5% - 1.0% ] 0.77% | 8,074,188 | 11.1% |
[ 0.5% - 1.0% ] 0.93% | 5,765,683 | 11.5% |
[ 1.0% - 1.5% ] 1.06% | 4,659,088 | 11.2% |
[ 1.0% - 1.5% ] 1.20% | 3,571,569 | 11.3% |
[ 1.0% - 1.5% ] 1.35% | 2,893,435 | 10.7% |
[ 1.0% - 1.5% ] 1.49% | 1,936,348 | 11.4% |
[ 1.5% - 2.0% ] 1.63% | 1,667,970 | 11.0% |
[ 1.5% - 2.0% ] 1.77% | 1,892,889 | 9.8% |
[ 1.5% - 2.0% ] 1.92% | 1,779,081 | 11.2% |
[ 2.0% - 2.5% ] 2.06% | 1,007,564 | 10.7% |
[ 2.0% - 2.5% ] 2.18% | 787,207 | 12.1% |
[ 2.0% - 2.5% ] 2.33% | 868,678 | 10.8% |
[ 2.0% - 2.5% ] 2.47% | 847,314 | 10.0% |
[ 2.5% - 3.0% ] 2.61% | 700,044 | 10.7% |
[ 2.5% - 3.0% ] 2.77% | 587,574 | 11.2% |
[ 2.5% - 3.0% ] 2.89% | 325,365 | 10.1% |
[ 3.0% - 3.5% ] 3.05% | 605,569 | 10.0% |
[ 3.0% - 3.5% ] 3.20% | 223,697 | 8.9% |
[ 3.0% - 3.5% ] 3.33% | 418,518 | 11.0% |
[ 3.0% - 3.5% ] 3.49% | 238,569 | 9.9% |
[ 3.5% - 4.0% ] 3.64% | 265,745 | 11.2% |
[ 3.5% - 4.0% ] 3.74% | 248,036 | 10.9% |
[ 3.5% - 4.0% ] 3.92% | 28,885 | 11.4% |
[ 4.0% - 4.5% ] 4.04% | 226,901 | 14.0% |
[ 4.0% - 4.5% ] 4.19% | 83,204 | 11.2% |
[ 4.0% - 4.5% ] 4.32% | 27,211 | 13.4% |
[ 4.0% - 4.5% ] 4.48% | 181,752 | 9.9% |
[ 4.5% - 5.0% ] 4.62% | 217,878 | 12.0% |
[ 4.5% - 5.0% ] 4.76% | 76,854 | 11.1% |
[ 4.5% - 5.0% ] 4.85% | 69,443 | 9.5% |
[ 5.0% - 5.5% ] 5.04% | 98,715 | 10.3% |
[ 5.0% - 5.5% ] 5.22% | 72,562 | 9.1% |
[ 5.0% - 5.5% ] 5.31% | 3,088 | 10.5% |
[ 5.0% - 5.5% ] 5.43% | 72,450 | 11.1% |
[ 5.5% - 6.0% ] 5.58% | 11,743 | 9.5% |
[ 5.5% - 6.0% ] 5.85% | 29,593 | 12.5% |
[ 5.5% - 6.0% ] 5.99% | 10,133 | 12.6% |
[ 6.0% - 6.5% ] 6.19% | 182,097 | 8.8% |
[ 6.0% - 6.5% ] 6.29% | 47,848 | 9.3% |
[ 6.0% - 6.5% ] 6.46% | 12,421 | 13.0% |
[ 6.5% - 7.0% ] 6.61% | 2,815 | 7.5% |
[ 6.5% - 7.0% ] 6.76% | 47,290 | 11.4% |
[ 6.5% - 7.0% ] 6.90% | 12,868 | 9.2% |
[ 7.0% - 7.5% ] 7.00% | 7,212 | 14.1% |
[ 7.0% - 7.5% ] 7.11% | 17,048 | 11.2% |
[ 7.0% - 7.5% ] 7.27% | 4,967 | 12.1% |
[ 7.0% - 7.5% ] 7.40% | 9,320 | 10.2% |
[ 7.5% - 8.0% ] 7.57% | 1,308 | 11.1% |
[ 7.5% - 8.0% ] 7.70% | 40,263 | 12.3% |
[ 7.5% - 8.0% ] 7.89% | 38,572 | 9.7% |
[ 8.0% - 8.5% ] 8.06% | 29,533 | 7.5% |
[ 8.0% - 8.5% ] 8.11% | 4,523 | 13.3% |
[ 8.0% - 8.5% ] 8.29% | 1,231 | 27.1% |
[ 8.0% - 8.5% ] 8.43% | 522 | 0.45% |
[ 8.5% - 9.0% ] 8.60% | 605 | 24.8% |
[ 8.5% - 9.0% ] 8.89% | 2,463 | 21.4% |
[ 9.0% - 9.5% ] 9.15% | 3,158 | 6.8% |
[ 9.0% - 9.5% ] 9.34% | 22,377 | 8.8% |
[ 9.5% - 10.0% ] 9.62% | 82,314 | 8.2% |
[ 9.5% - 10.0% ] 9.71% | 6,166 | 15.4% |
[ 10.0% - 10.5% ] 10.02% | 1,298 | 21.1% |
[ 10.0% - 10.5% ] 10.28% | 1,848 | 17.3% |
[ 11.0% - 11.5% ] 11.02% | 581 | 24.6% |
[ 11.0% - 11.5% ] 11.46% | 253 | 15.5% |
[ 11.5% - 12.0% ] 11.77% | 11,069 | 6.6% |
[ 11.5% - 12.0% ] 11.91% | 2,334 | 15.4% |
[ 12.0% - 12.5% ] 12.13% | 5,778 | 7.7% |
[ 12.0% - 12.5% ] 12.27% | 2,910 | 15.1% |
[ 13.0% - 13.5% ] 13.21% | 106 | 38.5% |
[ 14.0% - 14.5% ] 14.04% | 57 | 16.7% |
[ 14.0% - 14.5% ] 14.08% | 6,299 | 16.6% |
[ 14.5% - 15.0% ] 14.60% | 815 | 9.7% |
[ 15.5% - 16.0% ] 15.98% | 1,214 | 16.1% |
[ 16.5% - 17.0% ] 16.84% | 1,562 | 22.7% |
[ 22.0% - 22.5% ] 22.45% | 196 | 10.4% |
[ 28.0% - 28.5% ] 28.09% | 89 | 68.3% |
[ 28.0% - 28.5% ] 28.38% | 303 | 6.7% |