Peruvian 3 or more Vehicles in Household
COMPARE
Peruvian
Select to Compare
3 or more Vehicles in Household
Peruvian 3 or more Vehicles in Household
19.6%
3+ VEHICLES AVAILABLE
58.8/ 100
METRIC RATING
168th/ 347
METRIC RANK
Peruvian 3 or more Vehicles in Household Correlation Chart
The statistical analysis conducted on geographies consisting of 362,865,457 people shows a mild positive correlation between the proportion of Peruvians and percentage of households with 3 or more vehicles available in the United States with a correlation coefficient (R) of 0.355 and weighted average of 19.6%. On average, for every 1% (one percent) increase in Peruvians within a typical geography, there is an increase of 0.41% in percentage of households with 3 or more vehicles available.
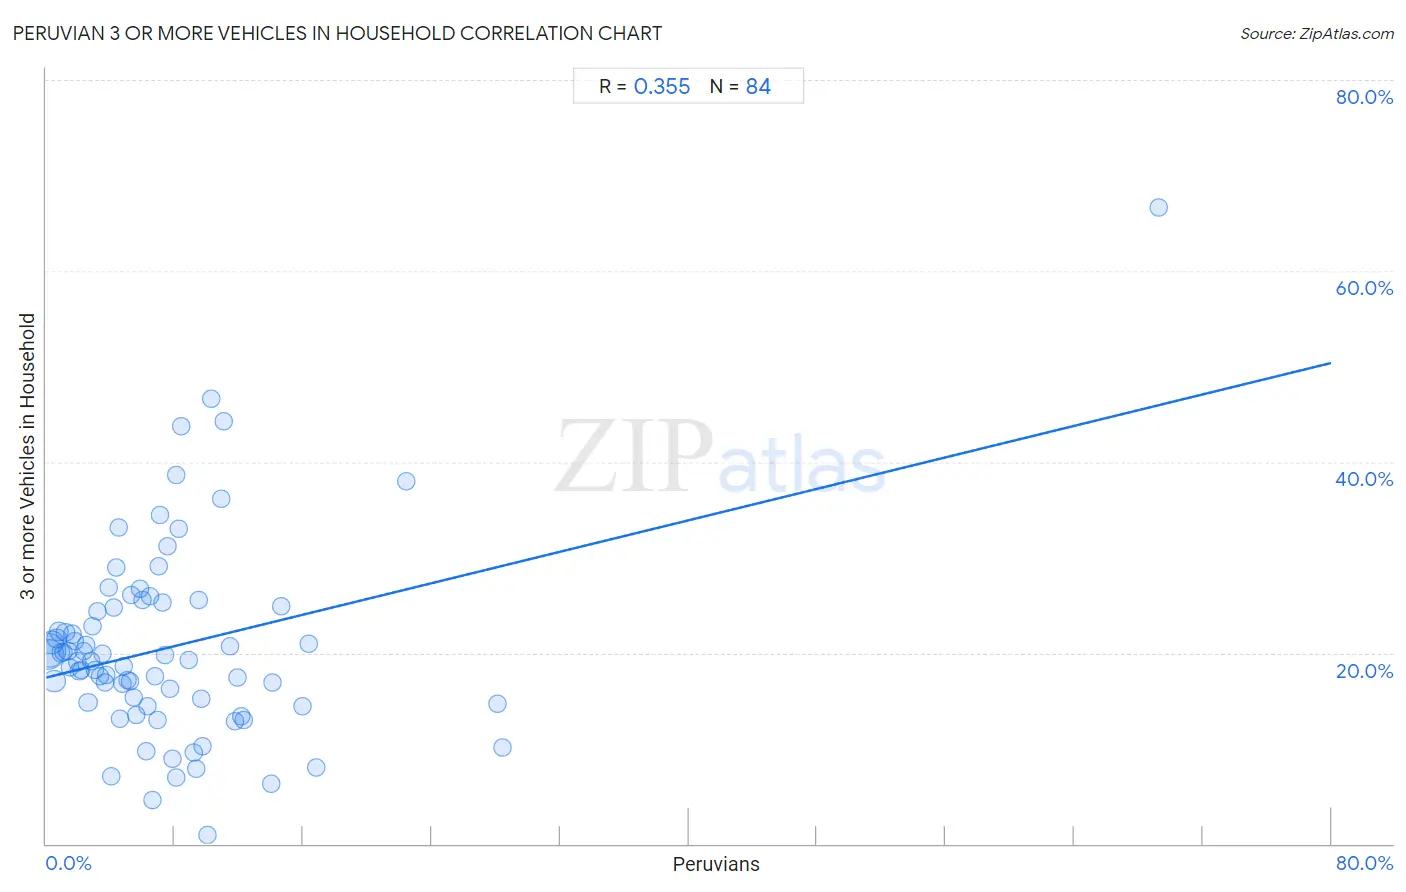
It is essential to understand that the correlation between the percentage of Peruvians and percentage of households with 3 or more vehicles available does not imply a direct cause-and-effect relationship. It remains uncertain whether the presence of Peruvians influences an upward or downward trend in the level of percentage of households with 3 or more vehicles available within an area, or if Peruvians simply ended up residing in those areas with higher or lower levels of percentage of households with 3 or more vehicles available due to other factors.
Demographics Similar to Peruvians by 3 or more Vehicles in Household
In terms of 3 or more vehicles in household, the demographic groups most similar to Peruvians are Ukrainian (19.6%, a difference of 0.010%), Immigrants from Denmark (19.6%, a difference of 0.090%), Immigrants from Cameroon (19.7%, a difference of 0.17%), Iraqi (19.6%, a difference of 0.21%), and Immigrants from Costa Rica (19.7%, a difference of 0.25%).
| Demographics | Rating | Rank | 3 or more Vehicles in Household |
| Immigrants from Guatemala | 65.6 /100 | #161 | Good 19.7% |
| Estonians | 63.2 /100 | #162 | Good 19.7% |
| Chileans | 63.0 /100 | #163 | Good 19.7% |
| Yugoslavians | 62.9 /100 | #164 | Good 19.7% |
| Immigrants from Costa Rica | 61.9 /100 | #165 | Good 19.7% |
| Immigrants from Cameroon | 60.9 /100 | #166 | Good 19.7% |
| Ukrainians | 58.9 /100 | #167 | Average 19.6% |
| Peruvians | 58.8 /100 | #168 | Average 19.6% |
| Immigrants from Denmark | 57.6 /100 | #169 | Average 19.6% |
| Iraqis | 56.0 /100 | #170 | Average 19.6% |
| Immigrants from Western Europe | 53.2 /100 | #171 | Average 19.5% |
| Kiowa | 50.9 /100 | #172 | Average 19.5% |
| Immigrants from Northern Europe | 50.2 /100 | #173 | Average 19.5% |
| Immigrants from South Africa | 50.0 /100 | #174 | Average 19.5% |
| Syrians | 47.0 /100 | #175 | Average 19.5% |
Peruvian 3 or more Vehicles in Household Correlation Summary
| Measurement | Peruvian Data | 3 or more Vehicles in Household Data |
| Minimum | 0.070% | 0.93% |
| Maximum | 69.3% | 66.7% |
| Range | 69.2% | 65.7% |
| Mean | 7.7% | 20.6% |
| Median | 6.1% | 19.2% |
| Interquartile 25% (IQ1) | 3.0% | 14.8% |
| Interquartile 75% (IQ3) | 9.6% | 24.8% |
| Interquartile Range (IQR) | 6.6% | 10.1% |
| Standard Deviation (Sample) | 8.8% | 10.2% |
| Standard Deviation (Population) | 8.7% | 10.1% |
Correlation Details
| Peruvian Percentile | Sample Size | 3 or more Vehicles in Household |
[ 0.0% - 0.5% ] 0.070% | 149,409,645 | 20.2% |
[ 0.0% - 0.5% ] 0.20% | 85,405,052 | 20.0% |
[ 0.0% - 0.5% ] 0.35% | 41,087,879 | 21.1% |
[ 0.0% - 0.5% ] 0.49% | 31,945,809 | 17.1% |
[ 0.5% - 1.0% ] 0.63% | 13,871,516 | 21.5% |
[ 0.5% - 1.0% ] 0.77% | 8,069,313 | 22.3% |
[ 0.5% - 1.0% ] 0.93% | 5,757,279 | 20.0% |
[ 1.0% - 1.5% ] 1.06% | 4,633,242 | 20.1% |
[ 1.0% - 1.5% ] 1.20% | 3,571,569 | 22.1% |
[ 1.0% - 1.5% ] 1.35% | 2,892,145 | 20.2% |
[ 1.0% - 1.5% ] 1.49% | 1,935,731 | 18.5% |
[ 1.5% - 2.0% ] 1.63% | 1,667,661 | 21.9% |
[ 1.5% - 2.0% ] 1.77% | 1,892,329 | 21.3% |
[ 1.5% - 2.0% ] 1.92% | 1,780,358 | 19.1% |
[ 2.0% - 2.5% ] 2.06% | 1,006,516 | 18.1% |
[ 2.0% - 2.5% ] 2.18% | 785,242 | 18.2% |
[ 2.0% - 2.5% ] 2.33% | 869,027 | 20.1% |
[ 2.0% - 2.5% ] 2.47% | 845,174 | 20.8% |
[ 2.5% - 3.0% ] 2.61% | 700,044 | 14.8% |
[ 2.5% - 3.0% ] 2.77% | 584,495 | 19.1% |
[ 2.5% - 3.0% ] 2.89% | 325,365 | 22.8% |
[ 3.0% - 3.5% ] 3.05% | 606,728 | 18.2% |
[ 3.0% - 3.5% ] 3.20% | 223,697 | 24.4% |
[ 3.0% - 3.5% ] 3.33% | 421,179 | 17.5% |
[ 3.0% - 3.5% ] 3.49% | 238,569 | 20.0% |
[ 3.5% - 4.0% ] 3.64% | 265,745 | 16.9% |
[ 3.5% - 4.0% ] 3.74% | 248,036 | 17.7% |
[ 3.5% - 4.0% ] 3.92% | 28,885 | 26.8% |
[ 4.0% - 4.5% ] 4.04% | 226,901 | 7.1% |
[ 4.0% - 4.5% ] 4.19% | 83,204 | 24.7% |
[ 4.0% - 4.5% ] 4.32% | 27,211 | 28.9% |
[ 4.0% - 4.5% ] 4.48% | 182,702 | 33.1% |
[ 4.5% - 5.0% ] 4.62% | 217,878 | 13.1% |
[ 4.5% - 5.0% ] 4.76% | 77,760 | 16.8% |
[ 4.5% - 5.0% ] 4.85% | 69,443 | 18.6% |
[ 5.0% - 5.5% ] 5.04% | 98,715 | 17.2% |
[ 5.0% - 5.5% ] 5.22% | 72,562 | 17.0% |
[ 5.0% - 5.5% ] 5.31% | 3,088 | 26.1% |
[ 5.0% - 5.5% ] 5.43% | 72,450 | 15.3% |
[ 5.5% - 6.0% ] 5.58% | 11,743 | 13.5% |
[ 5.5% - 6.0% ] 5.85% | 29,593 | 26.7% |
[ 5.5% - 6.0% ] 5.99% | 10,133 | 25.5% |
[ 6.0% - 6.5% ] 6.19% | 182,097 | 9.7% |
[ 6.0% - 6.5% ] 6.29% | 47,848 | 14.4% |
[ 6.0% - 6.5% ] 6.46% | 12,421 | 25.9% |
[ 6.5% - 7.0% ] 6.61% | 2,815 | 4.5% |
[ 6.5% - 7.0% ] 6.76% | 47,290 | 17.5% |
[ 6.5% - 7.0% ] 6.90% | 12,692 | 13.0% |
[ 7.0% - 7.5% ] 7.00% | 7,212 | 29.1% |
[ 7.0% - 7.5% ] 7.11% | 17,048 | 34.4% |
[ 7.0% - 7.5% ] 7.27% | 4,967 | 25.3% |
[ 7.0% - 7.5% ] 7.40% | 9,320 | 19.7% |
[ 7.5% - 8.0% ] 7.57% | 1,308 | 31.2% |
[ 7.5% - 8.0% ] 7.70% | 40,263 | 16.2% |
[ 7.5% - 8.0% ] 7.89% | 38,572 | 8.9% |
[ 8.0% - 8.5% ] 8.06% | 29,533 | 7.0% |
[ 8.0% - 8.5% ] 8.11% | 4,523 | 38.6% |
[ 8.0% - 8.5% ] 8.29% | 1,231 | 33.0% |
[ 8.0% - 8.5% ] 8.43% | 522 | 43.8% |
[ 8.5% - 9.0% ] 8.89% | 2,463 | 19.2% |
[ 9.0% - 9.5% ] 9.16% | 3,528 | 9.6% |
[ 9.0% - 9.5% ] 9.34% | 22,377 | 7.9% |
[ 9.5% - 10.0% ] 9.51% | 568 | 25.5% |
[ 9.5% - 10.0% ] 9.62% | 82,314 | 15.1% |
[ 9.5% - 10.0% ] 9.71% | 6,847 | 10.2% |
[ 10.0% - 10.5% ] 10.03% | 289 | 0.93% |
[ 10.0% - 10.5% ] 10.28% | 1,848 | 46.7% |
[ 10.5% - 11.0% ] 10.87% | 276 | 36.2% |
[ 11.0% - 11.5% ] 11.02% | 581 | 44.3% |
[ 11.0% - 11.5% ] 11.46% | 253 | 20.7% |
[ 11.5% - 12.0% ] 11.77% | 11,069 | 12.8% |
[ 11.5% - 12.0% ] 11.91% | 2,334 | 17.4% |
[ 12.0% - 12.5% ] 12.13% | 5,778 | 13.3% |
[ 12.0% - 12.5% ] 12.27% | 2,910 | 13.0% |
[ 14.0% - 14.5% ] 14.04% | 57 | 6.2% |
[ 14.0% - 14.5% ] 14.08% | 6,299 | 16.9% |
[ 14.5% - 15.0% ] 14.60% | 815 | 24.9% |
[ 15.5% - 16.0% ] 15.98% | 1,214 | 14.4% |
[ 16.0% - 16.5% ] 16.33% | 98 | 20.9% |
[ 16.5% - 17.0% ] 16.84% | 1,562 | 7.9% |
[ 22.0% - 22.5% ] 22.45% | 196 | 38.0% |
[ 28.0% - 28.5% ] 28.09% | 89 | 14.7% |
[ 28.0% - 28.5% ] 28.38% | 303 | 10.1% |
[ 69.0% - 69.5% ] 69.30% | 114 | 66.7% |