Peruvian Disability Age 5 to 17
COMPARE
Peruvian
Select to Compare
Disability Age 5 to 17
Peruvian Disability Age 5 to 17
5.3%
DISABILITY | AGE 5 TO 17
98.5/ 100
METRIC RATING
104th/ 347
METRIC RANK
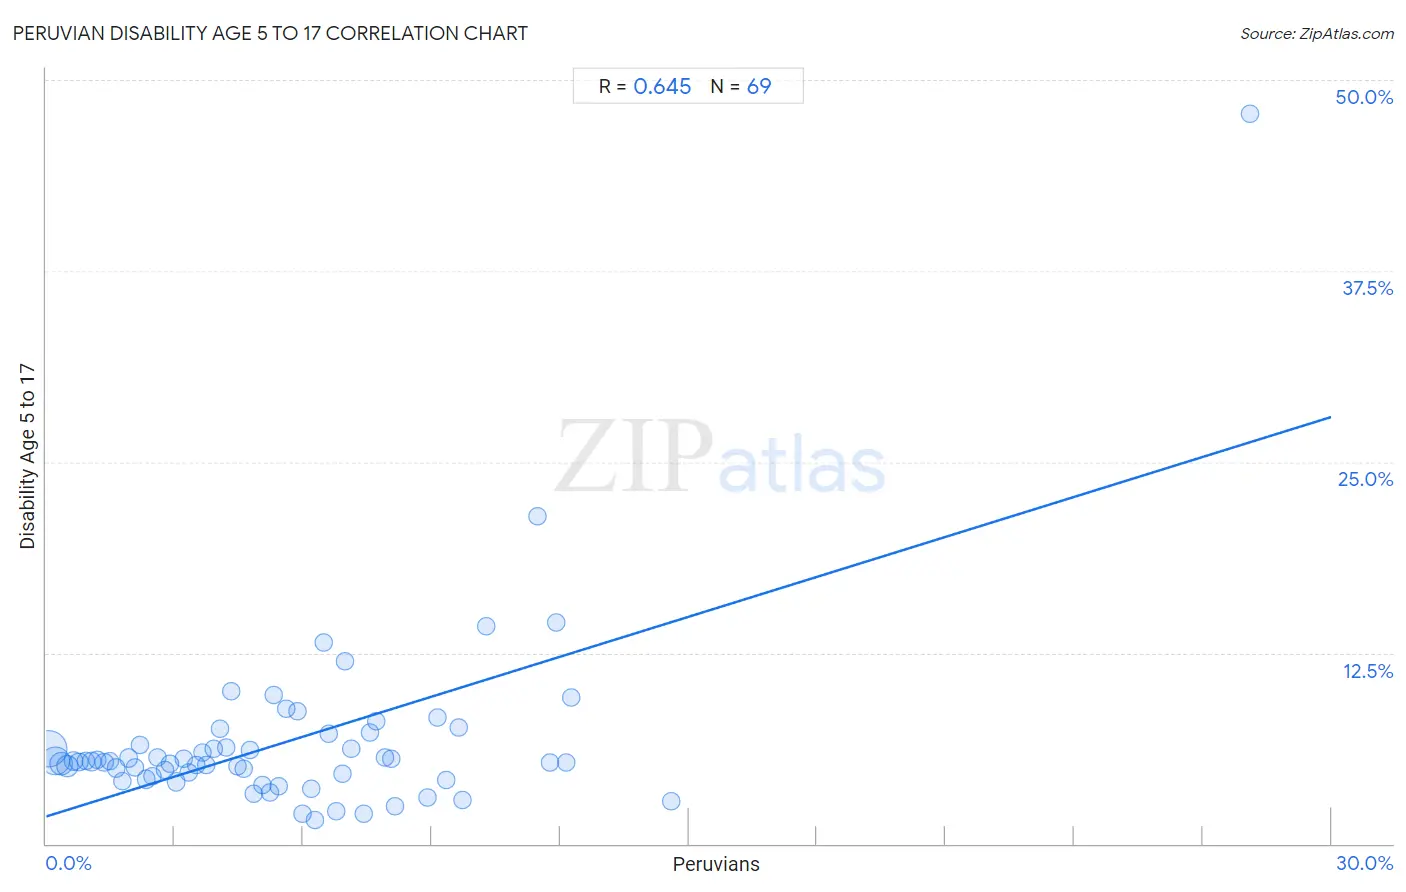
Peruvian Disability Age 5 to 17 Correlation Chart
The statistical analysis conducted on geographies consisting of 360,719,840 people shows a significant positive correlation between the proportion of Peruvians and percentage of population with a disability between the ages 5 and 17 in the United States with a correlation coefficient (R) of 0.645 and weighted average of 5.3%. On average, for every 1% (one percent) increase in Peruvians within a typical geography, there is an increase of 0.87% in percentage of population with a disability between the ages 5 and 17.
It is essential to understand that the correlation between the percentage of Peruvians and percentage of population with a disability between the ages 5 and 17 does not imply a direct cause-and-effect relationship. It remains uncertain whether the presence of Peruvians influences an upward or downward trend in the level of percentage of population with a disability between the ages 5 and 17 within an area, or if Peruvians simply ended up residing in those areas with higher or lower levels of percentage of population with a disability between the ages 5 and 17 due to other factors.
Demographics Similar to Peruvians by Disability Age 5 to 17
In terms of disability age 5 to 17, the demographic groups most similar to Peruvians are Salvadoran (5.3%, a difference of 0.070%), Immigrants from Italy (5.3%, a difference of 0.090%), Nicaraguan (5.3%, a difference of 0.10%), Menominee (5.3%, a difference of 0.18%), and Nepalese (5.3%, a difference of 0.20%).
| Demographics | Rating | Rank | Disability Age 5 to 17 |
| Immigrants from Europe | 99.0 /100 | #97 | Exceptional 5.3% |
| Immigrants from Austria | 98.9 /100 | #98 | Exceptional 5.3% |
| Cambodians | 98.8 /100 | #99 | Exceptional 5.3% |
| Nepalese | 98.7 /100 | #100 | Exceptional 5.3% |
| Menominee | 98.7 /100 | #101 | Exceptional 5.3% |
| Nicaraguans | 98.6 /100 | #102 | Exceptional 5.3% |
| Salvadorans | 98.6 /100 | #103 | Exceptional 5.3% |
| Peruvians | 98.5 /100 | #104 | Exceptional 5.3% |
| Immigrants from Italy | 98.4 /100 | #105 | Exceptional 5.3% |
| Immigrants from Yemen | 98.2 /100 | #106 | Exceptional 5.3% |
| Russians | 98.2 /100 | #107 | Exceptional 5.3% |
| Immigrants from South Africa | 98.1 /100 | #108 | Exceptional 5.3% |
| Immigrants from Northern Africa | 98.1 /100 | #109 | Exceptional 5.3% |
| Immigrants from Eritrea | 98.0 /100 | #110 | Exceptional 5.3% |
| Ethiopians | 97.9 /100 | #111 | Exceptional 5.3% |
Peruvian Disability Age 5 to 17 Correlation Summary
| Measurement | Peruvian Data | Disability Age 5 to 17 Data |
| Minimum | 0.070% | 1.6% |
| Maximum | 28.1% | 47.8% |
| Range | 28.0% | 46.2% |
| Mean | 5.6% | 6.6% |
| Median | 4.8% | 5.4% |
| Interquartile 25% (IQ1) | 2.4% | 4.3% |
| Interquartile 75% (IQ3) | 7.6% | 6.8% |
| Interquartile Range (IQR) | 5.2% | 2.5% |
| Standard Deviation (Sample) | 4.4% | 6.0% |
| Standard Deviation (Population) | 4.4% | 5.9% |
Correlation Details
| Peruvian Percentile | Sample Size | Disability Age 5 to 17 |
[ 0.0% - 0.5% ] 0.070% | 148,954,179 | 6.2% |
[ 0.0% - 0.5% ] 0.20% | 85,016,251 | 5.4% |
[ 0.0% - 0.5% ] 0.35% | 40,759,821 | 5.2% |
[ 0.0% - 0.5% ] 0.49% | 31,760,970 | 5.1% |
[ 0.5% - 1.0% ] 0.63% | 13,784,165 | 5.4% |
[ 0.5% - 1.0% ] 0.77% | 7,938,605 | 5.4% |
[ 0.5% - 1.0% ] 0.93% | 5,692,677 | 5.4% |
[ 1.0% - 1.5% ] 1.06% | 4,585,548 | 5.4% |
[ 1.0% - 1.5% ] 1.20% | 3,532,407 | 5.5% |
[ 1.0% - 1.5% ] 1.35% | 2,844,267 | 5.4% |
[ 1.0% - 1.5% ] 1.49% | 1,896,083 | 5.4% |
[ 1.5% - 2.0% ] 1.63% | 1,615,616 | 5.0% |
[ 1.5% - 2.0% ] 1.77% | 1,874,099 | 4.1% |
[ 1.5% - 2.0% ] 1.92% | 1,764,056 | 5.6% |
[ 2.0% - 2.5% ] 2.06% | 980,189 | 5.0% |
[ 2.0% - 2.5% ] 2.18% | 776,783 | 6.4% |
[ 2.0% - 2.5% ] 2.33% | 857,791 | 4.2% |
[ 2.0% - 2.5% ] 2.47% | 839,535 | 4.5% |
[ 2.5% - 3.0% ] 2.61% | 679,519 | 5.6% |
[ 2.5% - 3.0% ] 2.77% | 579,490 | 4.8% |
[ 2.5% - 3.0% ] 2.90% | 284,807 | 5.2% |
[ 3.0% - 3.5% ] 3.05% | 586,213 | 4.1% |
[ 3.0% - 3.5% ] 3.20% | 221,368 | 5.6% |
[ 3.0% - 3.5% ] 3.33% | 414,233 | 4.7% |
[ 3.0% - 3.5% ] 3.49% | 237,237 | 5.2% |
[ 3.5% - 4.0% ] 3.64% | 259,329 | 6.0% |
[ 3.5% - 4.0% ] 3.74% | 246,014 | 5.1% |
[ 3.5% - 4.0% ] 3.92% | 26,676 | 6.2% |
[ 4.0% - 4.5% ] 4.04% | 226,901 | 7.6% |
[ 4.0% - 4.5% ] 4.19% | 72,190 | 6.3% |
[ 4.0% - 4.5% ] 4.32% | 24,738 | 9.9% |
[ 4.0% - 4.5% ] 4.48% | 175,492 | 5.1% |
[ 4.5% - 5.0% ] 4.62% | 211,826 | 4.9% |
[ 4.5% - 5.0% ] 4.76% | 71,230 | 6.1% |
[ 4.5% - 5.0% ] 4.84% | 67,521 | 3.3% |
[ 5.0% - 5.5% ] 5.04% | 92,872 | 3.8% |
[ 5.0% - 5.5% ] 5.22% | 72,271 | 3.3% |
[ 5.0% - 5.5% ] 5.31% | 3,088 | 9.7% |
[ 5.0% - 5.5% ] 5.43% | 70,213 | 3.7% |
[ 5.5% - 6.0% ] 5.60% | 6,929 | 8.8% |
[ 5.5% - 6.0% ] 5.85% | 29,223 | 8.6% |
[ 5.5% - 6.0% ] 5.98% | 6,911 | 2.0% |
[ 6.0% - 6.5% ] 6.19% | 181,126 | 3.6% |
[ 6.0% - 6.5% ] 6.29% | 47,129 | 1.6% |
[ 6.0% - 6.5% ] 6.46% | 12,421 | 13.2% |
[ 6.5% - 7.0% ] 6.61% | 2,815 | 7.2% |
[ 6.5% - 7.0% ] 6.76% | 46,009 | 2.1% |
[ 6.5% - 7.0% ] 6.90% | 12,228 | 4.6% |
[ 6.5% - 7.0% ] 6.98% | 3,982 | 12.0% |
[ 7.0% - 7.5% ] 7.11% | 17,048 | 6.2% |
[ 7.0% - 7.5% ] 7.40% | 8,945 | 2.0% |
[ 7.5% - 8.0% ] 7.57% | 1,308 | 7.3% |
[ 7.5% - 8.0% ] 7.70% | 40,042 | 8.0% |
[ 7.5% - 8.0% ] 7.89% | 38,572 | 5.7% |
[ 8.0% - 8.5% ] 8.06% | 29,533 | 5.5% |
[ 8.0% - 8.5% ] 8.14% | 1,056 | 2.4% |
[ 8.5% - 9.0% ] 8.90% | 2,101 | 3.0% |
[ 9.0% - 9.5% ] 9.14% | 810 | 8.3% |
[ 9.0% - 9.5% ] 9.34% | 22,377 | 4.2% |
[ 9.5% - 10.0% ] 9.62% | 82,314 | 7.6% |
[ 9.5% - 10.0% ] 9.71% | 6,166 | 2.9% |
[ 10.0% - 10.5% ] 10.26% | 1,277 | 14.2% |
[ 11.0% - 11.5% ] 11.46% | 253 | 21.4% |
[ 11.5% - 12.0% ] 11.77% | 11,069 | 5.3% |
[ 11.5% - 12.0% ] 11.91% | 2,334 | 14.5% |
[ 12.0% - 12.5% ] 12.13% | 5,778 | 5.3% |
[ 12.0% - 12.5% ] 12.27% | 2,910 | 9.6% |
[ 14.5% - 15.0% ] 14.60% | 815 | 2.8% |
[ 28.0% - 28.5% ] 28.09% | 89 | 47.8% |