Norwegian vs Immigrants from Nigeria Married-Couple Family Poverty
COMPARE
Norwegian
Immigrants from Nigeria
Married-Couple Family Poverty
Married-Couple Family Poverty Comparison
Norwegians
Immigrants from Nigeria
3.7%
MARRIED-COUPLE FAMILY POVERTY
100.0/ 100
METRIC RATING
3rd/ 347
METRIC RANK
5.5%
MARRIED-COUPLE FAMILY POVERTY
11.3/ 100
METRIC RATING
217th/ 347
METRIC RANK
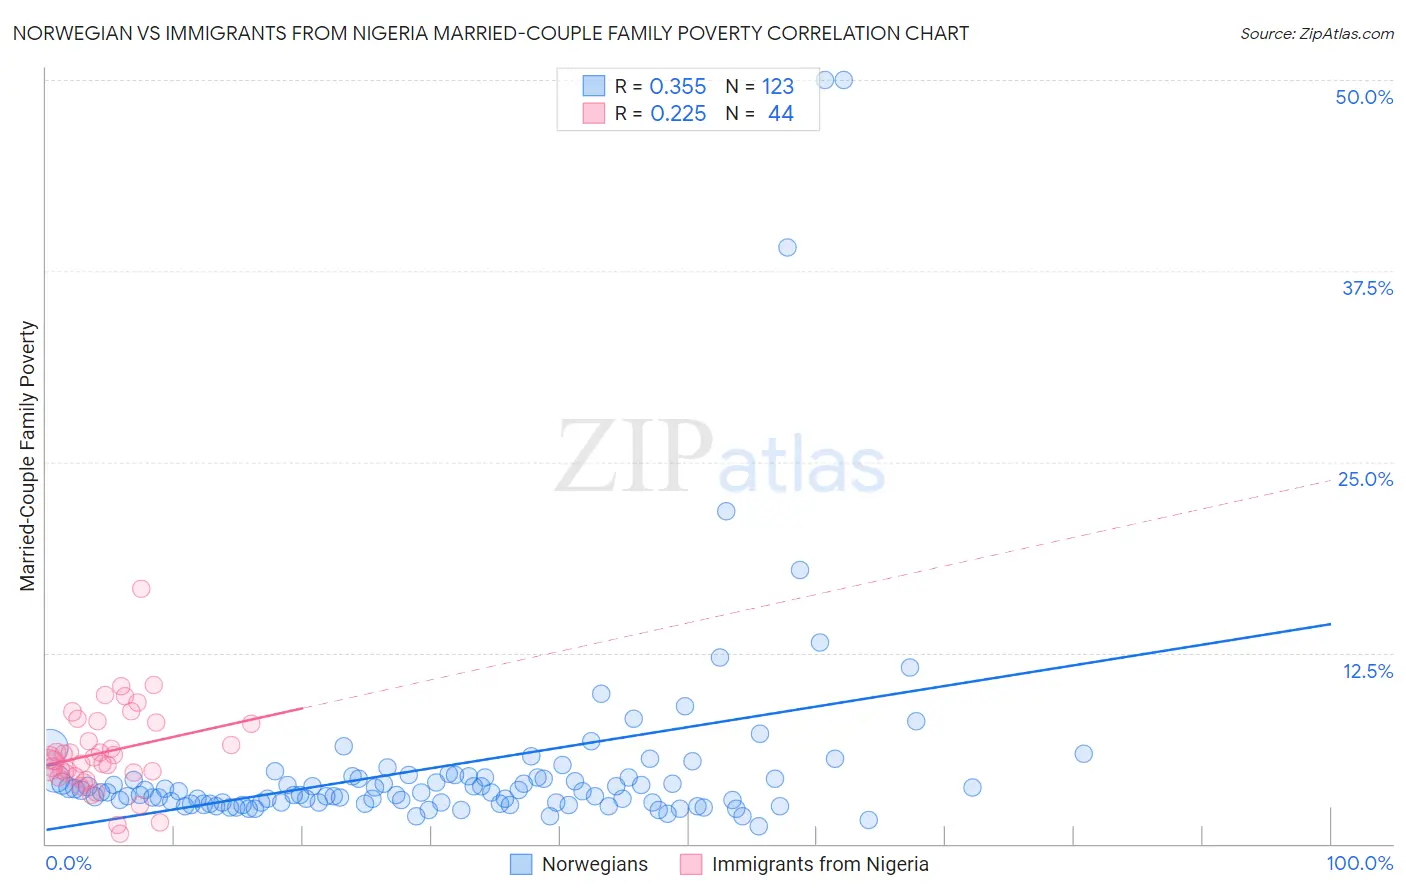
Norwegian vs Immigrants from Nigeria Married-Couple Family Poverty Correlation Chart
The statistical analysis conducted on geographies consisting of 522,229,251 people shows a mild positive correlation between the proportion of Norwegians and poverty level among married-couple families in the United States with a correlation coefficient (R) of 0.355 and weighted average of 3.7%. Similarly, the statistical analysis conducted on geographies consisting of 282,008,178 people shows a weak positive correlation between the proportion of Immigrants from Nigeria and poverty level among married-couple families in the United States with a correlation coefficient (R) of 0.225 and weighted average of 5.5%, a difference of 48.9%.
Married-Couple Family Poverty Correlation Summary
| Measurement | Norwegian | Immigrants from Nigeria |
| Minimum | 1.2% | 0.65% |
| Maximum | 50.0% | 16.7% |
| Range | 48.8% | 16.0% |
| Mean | 5.1% | 6.0% |
| Median | 3.4% | 5.5% |
| Interquartile 25% (IQ1) | 2.7% | 4.5% |
| Interquartile 75% (IQ3) | 4.4% | 7.9% |
| Interquartile Range (IQR) | 1.7% | 3.4% |
| Standard Deviation (Sample) | 7.2% | 2.8% |
| Standard Deviation (Population) | 7.1% | 2.8% |
Similar Demographics by Married-Couple Family Poverty
Demographics Similar to Norwegians by Married-Couple Family Poverty
In terms of married-couple family poverty, the demographic groups most similar to Norwegians are Chinese (3.6%, a difference of 1.9%), Immigrants from India (3.6%, a difference of 2.1%), Slovene (3.8%, a difference of 3.6%), Swedish (3.9%, a difference of 3.8%), and Luxembourger (3.9%, a difference of 4.4%).
| Demographics | Rating | Rank | Married-Couple Family Poverty |
| Immigrants | India | 100.0 /100 | #1 | Exceptional 3.6% |
| Chinese | 100.0 /100 | #2 | Exceptional 3.6% |
| Norwegians | 100.0 /100 | #3 | Exceptional 3.7% |
| Slovenes | 100.0 /100 | #4 | Exceptional 3.8% |
| Swedes | 100.0 /100 | #5 | Exceptional 3.9% |
| Luxembourgers | 100.0 /100 | #6 | Exceptional 3.9% |
| Latvians | 100.0 /100 | #7 | Exceptional 3.9% |
| Thais | 100.0 /100 | #8 | Exceptional 3.9% |
| Croatians | 100.0 /100 | #9 | Exceptional 3.9% |
| Carpatho Rusyns | 100.0 /100 | #10 | Exceptional 3.9% |
| Lithuanians | 100.0 /100 | #11 | Exceptional 4.0% |
| Bulgarians | 100.0 /100 | #12 | Exceptional 4.0% |
| Czechs | 100.0 /100 | #13 | Exceptional 4.0% |
| Slovaks | 100.0 /100 | #14 | Exceptional 4.0% |
| Poles | 100.0 /100 | #15 | Exceptional 4.0% |
Demographics Similar to Immigrants from Nigeria by Married-Couple Family Poverty
In terms of married-couple family poverty, the demographic groups most similar to Immigrants from Nigeria are Afghan (5.5%, a difference of 0.020%), Potawatomi (5.5%, a difference of 0.29%), Armenian (5.5%, a difference of 0.41%), Japanese (5.6%, a difference of 0.42%), and Iroquois (5.5%, a difference of 0.47%).
| Demographics | Rating | Rank | Married-Couple Family Poverty |
| Immigrants | Micronesia | 14.4 /100 | #210 | Poor 5.5% |
| Nigerians | 14.3 /100 | #211 | Poor 5.5% |
| Immigrants | Thailand | 14.0 /100 | #212 | Poor 5.5% |
| Immigrants | Liberia | 13.3 /100 | #213 | Poor 5.5% |
| Iroquois | 13.1 /100 | #214 | Poor 5.5% |
| Armenians | 12.8 /100 | #215 | Poor 5.5% |
| Potawatomi | 12.4 /100 | #216 | Poor 5.5% |
| Immigrants | Nigeria | 11.3 /100 | #217 | Poor 5.5% |
| Afghans | 11.2 /100 | #218 | Poor 5.5% |
| Japanese | 9.8 /100 | #219 | Tragic 5.6% |
| Colombians | 9.2 /100 | #220 | Tragic 5.6% |
| Panamanians | 9.2 /100 | #221 | Tragic 5.6% |
| Cajuns | 6.9 /100 | #222 | Tragic 5.6% |
| Immigrants | Fiji | 6.7 /100 | #223 | Tragic 5.6% |
| Sudanese | 6.4 /100 | #224 | Tragic 5.6% |