Norwegian Wage/Income Gap
COMPARE
Norwegian
Select to Compare
Wage/Income Gap
Norwegian Wage/Income Gap
29.0%
WAGE/INCOME GAP
0.1/ 100
METRIC RATING
323rd/ 347
METRIC RANK
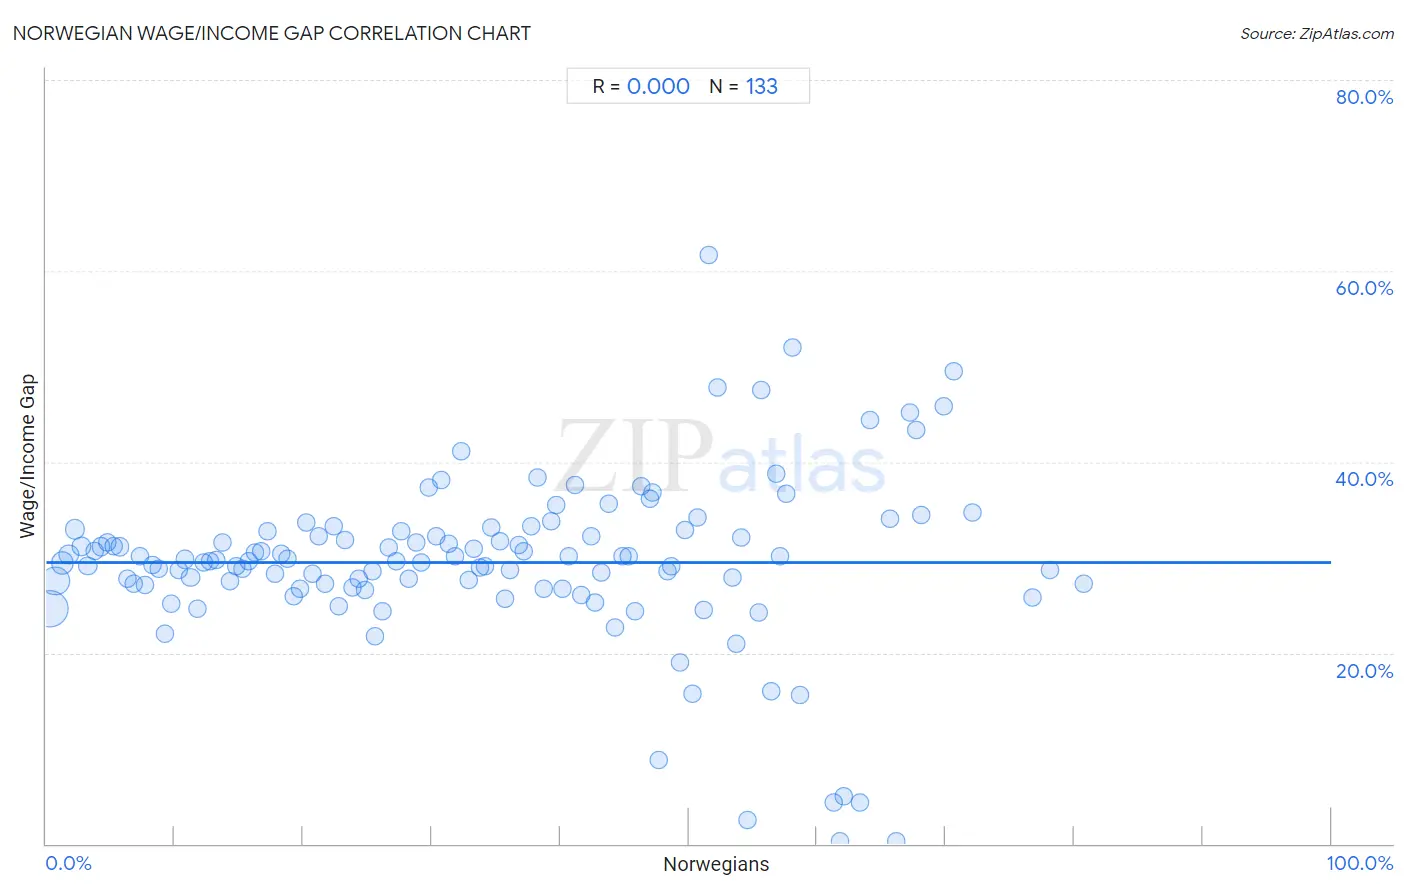
Norwegian Wage/Income Gap Correlation Chart
The statistical analysis conducted on geographies consisting of 531,696,723 people shows no correlation between the proportion of Norwegians and wage/income gap percentage in the United States with a correlation coefficient (R) of 0.000 and weighted average of 29.0%. On average, for every 1% (one percent) increase in Norwegians within a typical geography, there is an increase of 0.00004% in wage/income gap percentage.
It is essential to understand that the correlation between the percentage of Norwegians and wage/income gap percentage does not imply a direct cause-and-effect relationship. It remains uncertain whether the presence of Norwegians influences an upward or downward trend in the level of wage/income gap percentage within an area, or if Norwegians simply ended up residing in those areas with higher or lower levels of wage/income gap percentage due to other factors.
Demographics Similar to Norwegians by Wage/Income Gap
In terms of wage/income gap, the demographic groups most similar to Norwegians are Immigrants from Singapore (28.9%, a difference of 0.11%), Croatian (29.0%, a difference of 0.12%), Welsh (28.9%, a difference of 0.13%), British (28.9%, a difference of 0.19%), and Slovak (28.9%, a difference of 0.25%).
| Demographics | Rating | Rank | Wage/Income Gap |
| Lithuanians | 0.1 /100 | #316 | Tragic 28.7% |
| Belgians | 0.1 /100 | #317 | Tragic 28.8% |
| Basques | 0.1 /100 | #318 | Tragic 28.8% |
| Slovaks | 0.1 /100 | #319 | Tragic 28.9% |
| British | 0.1 /100 | #320 | Tragic 28.9% |
| Welsh | 0.1 /100 | #321 | Tragic 28.9% |
| Immigrants from Singapore | 0.1 /100 | #322 | Tragic 28.9% |
| Norwegians | 0.1 /100 | #323 | Tragic 29.0% |
| Croatians | 0.0 /100 | #324 | Tragic 29.0% |
| Hungarians | 0.0 /100 | #325 | Tragic 29.0% |
| Immigrants from Belgium | 0.0 /100 | #326 | Tragic 29.0% |
| Immigrants from Iran | 0.0 /100 | #327 | Tragic 29.1% |
| Scandinavians | 0.0 /100 | #328 | Tragic 29.1% |
| Scottish | 0.0 /100 | #329 | Tragic 29.1% |
| Germans | 0.0 /100 | #330 | Tragic 29.2% |
Norwegian Wage/Income Gap Correlation Summary
| Measurement | Norwegian Data | Wage/Income Gap Data |
| Minimum | 0.25% | 0.24% |
| Maximum | 80.7% | 61.7% |
| Range | 80.4% | 61.5% |
| Mean | 34.0% | 29.5% |
| Median | 33.3% | 29.7% |
| Interquartile 25% (IQ1) | 16.5% | 27.0% |
| Interquartile 75% (IQ3) | 50.0% | 32.7% |
| Interquartile Range (IQR) | 33.6% | 5.7% |
| Standard Deviation (Sample) | 20.6% | 9.0% |
| Standard Deviation (Population) | 20.5% | 8.9% |
Correlation Details
| Norwegian Percentile | Sample Size | Wage/Income Gap |
[ 0.0% - 0.5% ] 0.25% | 236,996,255 | 24.6% |
[ 0.5% - 1.0% ] 0.71% | 134,361,726 | 27.5% |
[ 1.0% - 1.5% ] 1.22% | 51,093,377 | 29.4% |
[ 1.5% - 2.0% ] 1.73% | 28,911,138 | 30.3% |
[ 2.0% - 2.5% ] 2.24% | 18,309,387 | 32.9% |
[ 2.5% - 3.0% ] 2.74% | 11,585,971 | 31.1% |
[ 3.0% - 3.5% ] 3.25% | 8,575,006 | 29.1% |
[ 3.5% - 4.0% ] 3.77% | 7,373,161 | 30.6% |
[ 4.0% - 4.5% ] 4.24% | 5,100,306 | 31.1% |
[ 4.5% - 5.0% ] 4.73% | 3,721,813 | 31.6% |
[ 5.0% - 5.5% ] 5.24% | 2,221,945 | 31.2% |
[ 5.5% - 6.0% ] 5.77% | 2,157,074 | 31.1% |
[ 6.0% - 6.5% ] 6.29% | 1,846,950 | 27.7% |
[ 6.5% - 7.0% ] 6.80% | 1,759,638 | 27.3% |
[ 7.0% - 7.5% ] 7.28% | 1,055,795 | 30.1% |
[ 7.5% - 8.0% ] 7.72% | 1,106,568 | 27.2% |
[ 8.0% - 8.5% ] 8.24% | 677,663 | 29.2% |
[ 8.5% - 9.0% ] 8.79% | 657,942 | 28.8% |
[ 9.0% - 9.5% ] 9.25% | 995,907 | 22.0% |
[ 9.5% - 10.0% ] 9.75% | 934,838 | 25.1% |
[ 10.0% - 10.5% ] 10.27% | 664,444 | 28.7% |
[ 10.5% - 11.0% ] 10.76% | 989,761 | 29.8% |
[ 11.0% - 11.5% ] 11.23% | 990,636 | 27.9% |
[ 11.5% - 12.0% ] 11.75% | 1,038,247 | 24.6% |
[ 12.0% - 12.5% ] 12.27% | 1,081,517 | 29.4% |
[ 12.5% - 13.0% ] 12.74% | 637,724 | 29.6% |
[ 13.0% - 13.5% ] 13.22% | 839,705 | 29.7% |
[ 13.5% - 14.0% ] 13.72% | 590,604 | 31.5% |
[ 14.0% - 14.5% ] 14.27% | 551,495 | 27.4% |
[ 14.5% - 15.0% ] 14.74% | 506,428 | 29.1% |
[ 15.0% - 15.5% ] 15.24% | 430,659 | 28.8% |
[ 15.5% - 16.0% ] 15.75% | 422,828 | 29.7% |
[ 16.0% - 16.5% ] 16.22% | 229,242 | 30.6% |
[ 16.5% - 17.0% ] 16.72% | 357,111 | 30.6% |
[ 17.0% - 17.5% ] 17.19% | 205,151 | 32.7% |
[ 17.5% - 18.0% ] 17.79% | 168,256 | 28.3% |
[ 18.0% - 18.5% ] 18.25% | 165,248 | 30.3% |
[ 18.5% - 19.0% ] 18.75% | 107,289 | 29.8% |
[ 19.0% - 19.5% ] 19.22% | 92,119 | 25.9% |
[ 19.5% - 20.0% ] 19.75% | 78,818 | 26.6% |
[ 20.0% - 20.5% ] 20.24% | 177,325 | 33.7% |
[ 20.5% - 21.0% ] 20.71% | 59,805 | 28.3% |
[ 21.0% - 21.5% ] 21.24% | 104,852 | 32.2% |
[ 21.5% - 22.0% ] 21.74% | 75,307 | 27.3% |
[ 22.0% - 22.5% ] 22.35% | 75,665 | 33.3% |
[ 22.5% - 23.0% ] 22.81% | 82,266 | 24.9% |
[ 23.0% - 23.5% ] 23.22% | 44,690 | 31.8% |
[ 23.5% - 24.0% ] 23.86% | 86,795 | 26.9% |
[ 24.0% - 24.5% ] 24.30% | 27,241 | 27.8% |
[ 24.5% - 25.0% ] 24.83% | 56,886 | 26.6% |
[ 25.0% - 25.5% ] 25.35% | 48,972 | 28.6% |
[ 25.5% - 26.0% ] 25.63% | 210,519 | 21.8% |
[ 26.0% - 26.5% ] 26.21% | 136,018 | 24.3% |
[ 26.5% - 27.0% ] 26.61% | 46,048 | 31.0% |
[ 27.0% - 27.5% ] 27.20% | 155,944 | 29.5% |
[ 27.5% - 28.0% ] 27.63% | 66,377 | 32.8% |
[ 28.0% - 28.5% ] 28.24% | 22,952 | 27.8% |
[ 28.5% - 29.0% ] 28.79% | 101,435 | 31.5% |
[ 29.0% - 29.5% ] 29.22% | 44,617 | 29.5% |
[ 29.5% - 30.0% ] 29.73% | 31,874 | 37.3% |
[ 30.0% - 30.5% ] 30.31% | 30,356 | 32.1% |
[ 30.5% - 31.0% ] 30.70% | 15,438 | 38.1% |
[ 31.0% - 31.5% ] 31.35% | 16,875 | 31.4% |
[ 31.5% - 32.0% ] 31.81% | 13,746 | 30.1% |
[ 32.0% - 32.5% ] 32.26% | 12,036 | 41.1% |
[ 32.5% - 33.0% ] 32.86% | 35,739 | 27.6% |
[ 33.0% - 33.5% ] 33.26% | 31,450 | 30.9% |
[ 33.5% - 34.0% ] 33.80% | 8,508 | 28.9% |
[ 34.0% - 34.5% ] 34.18% | 25,282 | 29.1% |
[ 34.5% - 35.0% ] 34.66% | 13,204 | 33.2% |
[ 35.0% - 35.5% ] 35.27% | 20,123 | 31.7% |
[ 35.5% - 36.0% ] 35.74% | 19,977 | 25.6% |
[ 36.0% - 36.5% ] 36.12% | 35,261 | 28.6% |
[ 36.5% - 37.0% ] 36.76% | 14,335 | 31.3% |
[ 37.0% - 37.5% ] 37.17% | 7,207 | 30.6% |
[ 37.5% - 38.0% ] 37.71% | 10,463 | 33.3% |
[ 38.0% - 38.5% ] 38.22% | 11,177 | 38.4% |
[ 38.5% - 39.0% ] 38.73% | 9,390 | 26.8% |
[ 39.0% - 39.5% ] 39.26% | 7,499 | 33.7% |
[ 39.5% - 40.0% ] 39.68% | 5,587 | 35.5% |
[ 40.0% - 40.5% ] 40.16% | 3,538 | 26.8% |
[ 40.5% - 41.0% ] 40.64% | 10,127 | 30.1% |
[ 41.0% - 41.5% ] 41.19% | 5,914 | 37.6% |
[ 41.5% - 42.0% ] 41.68% | 4,674 | 26.1% |
[ 42.0% - 42.5% ] 42.41% | 8,925 | 32.3% |
[ 42.5% - 43.0% ] 42.74% | 8,374 | 25.3% |
[ 43.0% - 43.5% ] 43.16% | 2,317 | 28.4% |
[ 43.5% - 44.0% ] 43.77% | 3,194 | 35.7% |
[ 44.0% - 44.5% ] 44.28% | 1,809 | 22.6% |
[ 44.5% - 45.0% ] 44.85% | 5,262 | 30.1% |
[ 45.0% - 45.5% ] 45.38% | 2,532 | 30.1% |
[ 45.5% - 46.0% ] 45.85% | 5,557 | 24.4% |
[ 46.0% - 46.5% ] 46.31% | 2,220 | 37.4% |
[ 46.5% - 47.0% ] 46.97% | 824 | 36.2% |
[ 47.0% - 47.5% ] 47.14% | 3,390 | 36.8% |
[ 47.5% - 48.0% ] 47.68% | 2,934 | 8.8% |
[ 48.0% - 48.5% ] 48.31% | 5,045 | 28.5% |
[ 48.5% - 49.0% ] 48.67% | 3,409 | 29.0% |
[ 49.0% - 49.5% ] 49.30% | 2,132 | 19.0% |
[ 49.5% - 50.0% ] 49.73% | 1,649 | 32.8% |
[ 50.0% - 50.5% ] 50.33% | 1,685 | 15.7% |
[ 50.5% - 51.0% ] 50.67% | 3,349 | 34.2% |
[ 51.0% - 51.5% ] 51.18% | 551 | 24.5% |
[ 51.5% - 52.0% ] 51.59% | 283 | 61.7% |
[ 52.0% - 52.5% ] 52.20% | 1,615 | 47.8% |
[ 53.0% - 53.5% ] 53.40% | 1,929 | 27.9% |
[ 53.5% - 54.0% ] 53.72% | 2,766 | 21.0% |
[ 54.0% - 54.5% ] 54.12% | 2,086 | 32.0% |
[ 54.5% - 55.0% ] 54.55% | 55 | 2.5% |
[ 55.0% - 55.5% ] 55.47% | 2,650 | 24.2% |
[ 55.5% - 56.0% ] 55.61% | 962 | 47.5% |
[ 56.0% - 56.5% ] 56.39% | 438 | 15.9% |
[ 56.5% - 57.0% ] 56.77% | 953 | 38.8% |
[ 57.0% - 57.5% ] 57.14% | 168 | 30.2% |
[ 57.5% - 58.0% ] 57.58% | 132 | 36.6% |
[ 58.0% - 58.5% ] 58.06% | 434 | 52.0% |
[ 58.5% - 59.0% ] 58.61% | 389 | 15.6% |
[ 61.0% - 61.5% ] 61.32% | 106 | 4.4% |
[ 61.5% - 62.0% ] 61.74% | 149 | 0.30% |
[ 62.0% - 62.5% ] 62.07% | 29 | 5.0% |
[ 63.0% - 63.5% ] 63.31% | 616 | 4.4% |
[ 64.0% - 64.5% ] 64.08% | 373 | 44.4% |
[ 65.5% - 66.0% ] 65.70% | 242 | 34.1% |
[ 66.0% - 66.5% ] 66.17% | 133 | 0.24% |
[ 67.0% - 67.5% ] 67.22% | 180 | 45.2% |
[ 67.5% - 68.0% ] 67.74% | 155 | 43.3% |
[ 68.0% - 68.5% ] 68.11% | 370 | 34.5% |
[ 69.5% - 70.0% ] 69.86% | 146 | 45.9% |
[ 70.5% - 71.0% ] 70.59% | 68 | 49.5% |
[ 72.0% - 72.5% ] 72.04% | 279 | 34.7% |
[ 76.5% - 77.0% ] 76.74% | 258 | 25.8% |
[ 78.0% - 78.5% ] 78.09% | 251 | 28.7% |
[ 80.5% - 81.0% ] 80.70% | 114 | 27.3% |