Norwegian 3 or more Vehicles in Household
COMPARE
Norwegian
Select to Compare
3 or more Vehicles in Household
Norwegian 3 or more Vehicles in Household
23.9%
3+ VEHICLES AVAILABLE
100.0/ 100
METRIC RATING
18th/ 347
METRIC RANK
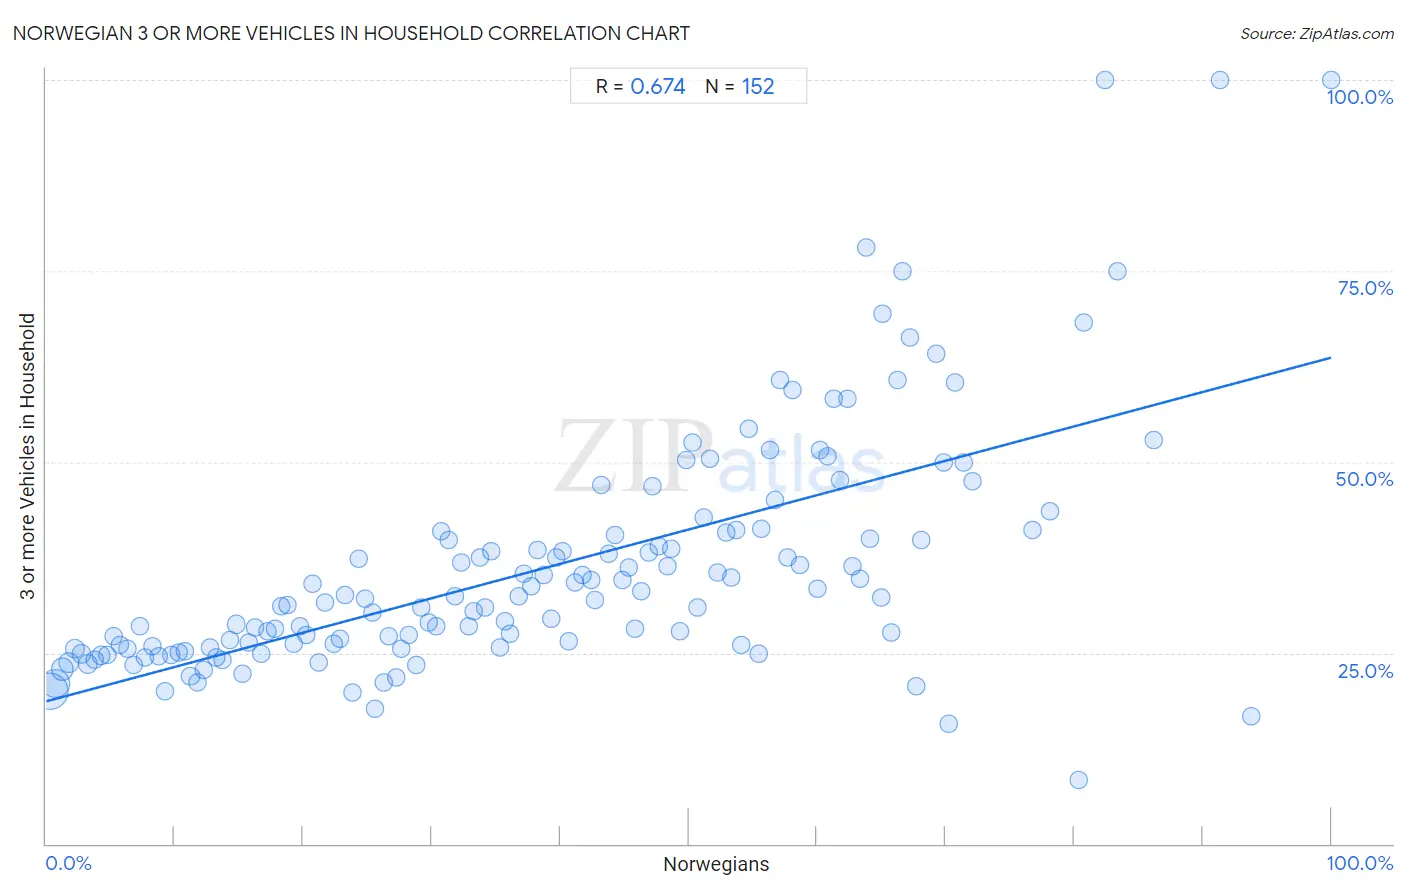
Norwegian 3 or more Vehicles in Household Correlation Chart
The statistical analysis conducted on geographies consisting of 532,701,273 people shows a significant positive correlation between the proportion of Norwegians and percentage of households with 3 or more vehicles available in the United States with a correlation coefficient (R) of 0.674 and weighted average of 23.9%. On average, for every 1% (one percent) increase in Norwegians within a typical geography, there is an increase of 0.45% in percentage of households with 3 or more vehicles available.
It is essential to understand that the correlation between the percentage of Norwegians and percentage of households with 3 or more vehicles available does not imply a direct cause-and-effect relationship. It remains uncertain whether the presence of Norwegians influences an upward or downward trend in the level of percentage of households with 3 or more vehicles available within an area, or if Norwegians simply ended up residing in those areas with higher or lower levels of percentage of households with 3 or more vehicles available due to other factors.
Demographics Similar to Norwegians by 3 or more Vehicles in Household
In terms of 3 or more vehicles in household, the demographic groups most similar to Norwegians are Chinese (23.9%, a difference of 0.030%), Paiute (23.8%, a difference of 0.33%), Immigrants from Vietnam (23.8%, a difference of 0.45%), Immigrants from Philippines (23.8%, a difference of 0.51%), and Korean (24.1%, a difference of 0.79%).
| Demographics | Rating | Rank | 3 or more Vehicles in Household |
| Shoshone | 100.0 /100 | #11 | Exceptional 24.9% |
| Danes | 100.0 /100 | #12 | Exceptional 24.7% |
| Mexicans | 100.0 /100 | #13 | Exceptional 24.7% |
| Immigrants from Mexico | 100.0 /100 | #14 | Exceptional 24.6% |
| Hawaiians | 100.0 /100 | #15 | Exceptional 24.3% |
| Basques | 100.0 /100 | #16 | Exceptional 24.3% |
| Koreans | 100.0 /100 | #17 | Exceptional 24.1% |
| Norwegians | 100.0 /100 | #18 | Exceptional 23.9% |
| Chinese | 100.0 /100 | #19 | Exceptional 23.9% |
| Paiute | 100.0 /100 | #20 | Exceptional 23.8% |
| Immigrants from Vietnam | 100.0 /100 | #21 | Exceptional 23.8% |
| Immigrants from Philippines | 100.0 /100 | #22 | Exceptional 23.8% |
| Scandinavians | 100.0 /100 | #23 | Exceptional 23.6% |
| Sri Lankans | 100.0 /100 | #24 | Exceptional 23.6% |
| Immigrants from Central America | 100.0 /100 | #25 | Exceptional 23.4% |
Norwegian 3 or more Vehicles in Household Correlation Summary
| Measurement | Norwegian Data | 3 or more Vehicles in Household Data |
| Minimum | 0.25% | 8.3% |
| Maximum | 100.0% | 100.0% |
| Range | 99.7% | 91.7% |
| Mean | 38.9% | 36.1% |
| Median | 38.0% | 32.0% |
| Interquartile 25% (IQ1) | 19.0% | 25.7% |
| Interquartile 75% (IQ3) | 56.9% | 40.6% |
| Interquartile Range (IQR) | 38.0% | 14.8% |
| Standard Deviation (Sample) | 23.6% | 15.8% |
| Standard Deviation (Population) | 23.5% | 15.7% |
Correlation Details
| Norwegian Percentile | Sample Size | 3 or more Vehicles in Household |
[ 0.0% - 0.5% ] 0.25% | 237,015,172 | 19.9% |
[ 0.5% - 1.0% ] 0.71% | 134,449,390 | 21.0% |
[ 1.0% - 1.5% ] 1.22% | 51,238,636 | 22.9% |
[ 1.5% - 2.0% ] 1.73% | 29,028,311 | 23.7% |
[ 2.0% - 2.5% ] 2.24% | 18,380,109 | 25.5% |
[ 2.5% - 3.0% ] 2.74% | 11,660,540 | 24.9% |
[ 3.0% - 3.5% ] 3.25% | 8,632,673 | 23.6% |
[ 3.5% - 4.0% ] 3.77% | 7,428,071 | 24.1% |
[ 4.0% - 4.5% ] 4.24% | 5,153,917 | 24.7% |
[ 4.5% - 5.0% ] 4.73% | 3,746,211 | 24.7% |
[ 5.0% - 5.5% ] 5.24% | 2,250,301 | 27.2% |
[ 5.5% - 6.0% ] 5.77% | 2,194,792 | 26.0% |
[ 6.0% - 6.5% ] 6.29% | 1,873,051 | 25.6% |
[ 6.5% - 7.0% ] 6.80% | 1,783,588 | 23.4% |
[ 7.0% - 7.5% ] 7.28% | 1,076,374 | 28.5% |
[ 7.5% - 8.0% ] 7.72% | 1,121,239 | 24.4% |
[ 8.0% - 8.5% ] 8.24% | 686,487 | 25.9% |
[ 8.5% - 9.0% ] 8.79% | 675,991 | 24.6% |
[ 9.0% - 9.5% ] 9.25% | 1,002,397 | 20.0% |
[ 9.5% - 10.0% ] 9.75% | 939,744 | 24.7% |
[ 10.0% - 10.5% ] 10.27% | 671,396 | 25.1% |
[ 10.5% - 11.0% ] 10.76% | 999,371 | 25.2% |
[ 11.0% - 11.5% ] 11.23% | 997,766 | 21.9% |
[ 11.5% - 12.0% ] 11.75% | 1,041,818 | 21.2% |
[ 12.0% - 12.5% ] 12.27% | 1,084,789 | 22.8% |
[ 12.5% - 13.0% ] 12.74% | 641,545 | 25.7% |
[ 13.0% - 13.5% ] 13.22% | 845,148 | 24.4% |
[ 13.5% - 14.0% ] 13.72% | 593,573 | 24.0% |
[ 14.0% - 14.5% ] 14.27% | 553,473 | 26.7% |
[ 14.5% - 15.0% ] 14.74% | 508,001 | 28.7% |
[ 15.0% - 15.5% ] 15.24% | 432,055 | 22.3% |
[ 15.5% - 16.0% ] 15.75% | 419,570 | 26.3% |
[ 16.0% - 16.5% ] 16.22% | 232,095 | 28.2% |
[ 16.5% - 17.0% ] 16.72% | 358,661 | 24.8% |
[ 17.0% - 17.5% ] 17.19% | 208,934 | 27.9% |
[ 17.5% - 18.0% ] 17.79% | 169,589 | 28.2% |
[ 18.0% - 18.5% ] 18.26% | 168,021 | 31.1% |
[ 18.5% - 19.0% ] 18.74% | 109,270 | 31.2% |
[ 19.0% - 19.5% ] 19.22% | 92,119 | 26.2% |
[ 19.5% - 20.0% ] 19.75% | 79,756 | 28.5% |
[ 20.0% - 20.5% ] 20.24% | 179,942 | 27.4% |
[ 20.5% - 21.0% ] 20.72% | 62,277 | 34.0% |
[ 21.0% - 21.5% ] 21.24% | 106,743 | 23.8% |
[ 21.5% - 22.0% ] 21.74% | 78,117 | 31.6% |
[ 22.0% - 22.5% ] 22.34% | 78,683 | 26.2% |
[ 22.5% - 23.0% ] 22.81% | 86,046 | 26.9% |
[ 23.0% - 23.5% ] 23.22% | 45,803 | 32.5% |
[ 23.5% - 24.0% ] 23.85% | 89,273 | 19.9% |
[ 24.0% - 24.5% ] 24.30% | 27,832 | 37.2% |
[ 24.5% - 25.0% ] 24.83% | 54,814 | 32.1% |
[ 25.0% - 25.5% ] 25.35% | 50,292 | 30.2% |
[ 25.5% - 26.0% ] 25.63% | 211,714 | 17.6% |
[ 26.0% - 26.5% ] 26.22% | 137,267 | 21.1% |
[ 26.5% - 27.0% ] 26.61% | 46,115 | 27.1% |
[ 27.0% - 27.5% ] 27.20% | 157,001 | 21.7% |
[ 27.5% - 28.0% ] 27.63% | 66,550 | 25.5% |
[ 28.0% - 28.5% ] 28.23% | 22,763 | 27.3% |
[ 28.5% - 29.0% ] 28.79% | 102,118 | 23.4% |
[ 29.0% - 29.5% ] 29.21% | 46,429 | 30.9% |
[ 29.5% - 30.0% ] 29.73% | 32,465 | 29.0% |
[ 30.0% - 30.5% ] 30.31% | 30,591 | 28.4% |
[ 30.5% - 31.0% ] 30.72% | 16,903 | 40.9% |
[ 31.0% - 31.5% ] 31.35% | 17,256 | 39.7% |
[ 31.5% - 32.0% ] 31.80% | 14,153 | 32.4% |
[ 32.0% - 32.5% ] 32.26% | 12,197 | 36.8% |
[ 32.5% - 33.0% ] 32.85% | 36,249 | 28.4% |
[ 33.0% - 33.5% ] 33.26% | 32,421 | 30.4% |
[ 33.5% - 34.0% ] 33.79% | 9,230 | 37.5% |
[ 34.0% - 34.5% ] 34.18% | 25,603 | 30.9% |
[ 34.5% - 35.0% ] 34.66% | 13,498 | 38.4% |
[ 35.0% - 35.5% ] 35.26% | 20,959 | 25.7% |
[ 35.5% - 36.0% ] 35.74% | 21,116 | 29.1% |
[ 36.0% - 36.5% ] 36.12% | 35,416 | 27.5% |
[ 36.5% - 37.0% ] 36.76% | 14,430 | 32.4% |
[ 37.0% - 37.5% ] 37.18% | 7,349 | 35.3% |
[ 37.5% - 38.0% ] 37.72% | 11,289 | 33.7% |
[ 38.0% - 38.5% ] 38.22% | 11,245 | 38.4% |
[ 38.5% - 39.0% ] 38.73% | 9,972 | 35.1% |
[ 39.0% - 39.5% ] 39.26% | 7,537 | 29.4% |
[ 39.5% - 40.0% ] 39.69% | 5,795 | 37.4% |
[ 40.0% - 40.5% ] 40.21% | 4,563 | 38.3% |
[ 40.5% - 41.0% ] 40.64% | 10,233 | 26.5% |
[ 41.0% - 41.5% ] 41.19% | 6,043 | 34.3% |
[ 41.5% - 42.0% ] 41.68% | 5,009 | 35.3% |
[ 42.0% - 42.5% ] 42.41% | 9,411 | 34.5% |
[ 42.5% - 43.0% ] 42.74% | 8,523 | 31.9% |
[ 43.0% - 43.5% ] 43.22% | 3,387 | 47.0% |
[ 43.5% - 44.0% ] 43.77% | 3,324 | 37.9% |
[ 44.0% - 44.5% ] 44.28% | 2,362 | 40.4% |
[ 44.5% - 45.0% ] 44.85% | 5,342 | 34.5% |
[ 45.0% - 45.5% ] 45.35% | 3,259 | 36.2% |
[ 45.5% - 46.0% ] 45.85% | 5,880 | 28.1% |
[ 46.0% - 46.5% ] 46.30% | 3,004 | 33.0% |
[ 46.5% - 47.0% ] 46.93% | 929 | 38.2% |
[ 47.0% - 47.5% ] 47.14% | 3,551 | 46.7% |
[ 47.5% - 48.0% ] 47.68% | 3,205 | 39.0% |
[ 48.0% - 48.5% ] 48.30% | 5,186 | 36.3% |
[ 48.5% - 49.0% ] 48.67% | 4,089 | 38.6% |
[ 49.0% - 49.5% ] 49.30% | 2,215 | 27.9% |
[ 49.5% - 50.0% ] 49.78% | 2,067 | 50.2% |
[ 50.0% - 50.5% ] 50.30% | 2,793 | 52.5% |
[ 50.5% - 51.0% ] 50.68% | 3,467 | 30.9% |
[ 51.0% - 51.5% ] 51.18% | 551 | 42.7% |
[ 51.5% - 52.0% ] 51.65% | 364 | 50.4% |
[ 52.0% - 52.5% ] 52.19% | 1,734 | 35.5% |
[ 52.5% - 53.0% ] 52.90% | 431 | 40.7% |
[ 53.0% - 53.5% ] 53.35% | 2,731 | 34.9% |
[ 53.5% - 54.0% ] 53.72% | 3,027 | 41.1% |
[ 54.0% - 54.5% ] 54.12% | 2,086 | 26.0% |
[ 54.5% - 55.0% ] 54.64% | 97 | 54.3% |
[ 55.0% - 55.5% ] 55.47% | 2,650 | 24.8% |
[ 55.5% - 56.0% ] 55.61% | 962 | 41.2% |
[ 56.0% - 56.5% ] 56.36% | 495 | 51.6% |
[ 56.5% - 57.0% ] 56.74% | 1,121 | 45.1% |
[ 57.0% - 57.5% ] 57.14% | 168 | 60.8% |
[ 57.5% - 58.0% ] 57.69% | 338 | 37.4% |
[ 58.0% - 58.5% ] 58.11% | 604 | 59.4% |
[ 58.5% - 59.0% ] 58.64% | 648 | 36.5% |
[ 60.0% - 60.5% ] 60.00% | 5 | 33.3% |
[ 60.0% - 60.5% ] 60.17% | 241 | 51.5% |
[ 60.5% - 61.0% ] 60.77% | 209 | 50.7% |
[ 61.0% - 61.5% ] 61.32% | 106 | 58.2% |
[ 61.5% - 62.0% ] 61.74% | 149 | 47.6% |
[ 62.0% - 62.5% ] 62.35% | 162 | 58.2% |
[ 62.5% - 63.0% ] 62.79% | 86 | 36.4% |
[ 63.0% - 63.5% ] 63.32% | 698 | 34.7% |
[ 63.5% - 64.0% ] 63.84% | 224 | 78.1% |
[ 64.0% - 64.5% ] 64.08% | 373 | 39.9% |
[ 64.5% - 65.0% ] 64.95% | 97 | 32.3% |
[ 65.0% - 65.5% ] 65.08% | 315 | 69.4% |
[ 65.5% - 66.0% ] 65.75% | 327 | 27.6% |
[ 66.0% - 66.5% ] 66.28% | 608 | 60.8% |
[ 66.5% - 67.0% ] 66.67% | 12 | 75.0% |
[ 67.0% - 67.5% ] 67.22% | 180 | 66.2% |
[ 67.5% - 68.0% ] 67.74% | 155 | 20.6% |
[ 68.0% - 68.5% ] 68.11% | 370 | 39.8% |
[ 69.0% - 69.5% ] 69.23% | 104 | 64.2% |
[ 69.5% - 70.0% ] 69.86% | 146 | 50.0% |
[ 70.0% - 70.5% ] 70.21% | 47 | 15.8% |
[ 70.5% - 71.0% ] 70.70% | 157 | 60.4% |
[ 71.0% - 71.5% ] 71.43% | 28 | 50.0% |
[ 72.0% - 72.5% ] 72.08% | 308 | 47.5% |
[ 76.5% - 77.0% ] 76.74% | 258 | 41.0% |
[ 78.0% - 78.5% ] 78.09% | 251 | 43.5% |
[ 80.0% - 80.5% ] 80.33% | 61 | 8.3% |
[ 80.5% - 81.0% ] 80.70% | 114 | 68.3% |
[ 82.0% - 82.5% ] 82.35% | 17 | 100.0% |
[ 83.0% - 83.5% ] 83.33% | 42 | 75.0% |
[ 86.0% - 86.5% ] 86.21% | 29 | 52.9% |
[ 91.0% - 91.5% ] 91.38% | 58 | 100.0% |
[ 93.5% - 94.0% ] 93.75% | 16 | 16.7% |
[ 99.5% - 100.0% ] 100.00% | 74 | 100.0% |