Immigrants from Peru Disability Age Under 5
COMPARE
Immigrants from Peru
Select to Compare
Disability Age Under 5
Immigrants from Peru Disability Age Under 5
1.2%
DISABILITY | AGE UNDER 5
43.7/ 100
METRIC RATING
181st/ 347
METRIC RANK
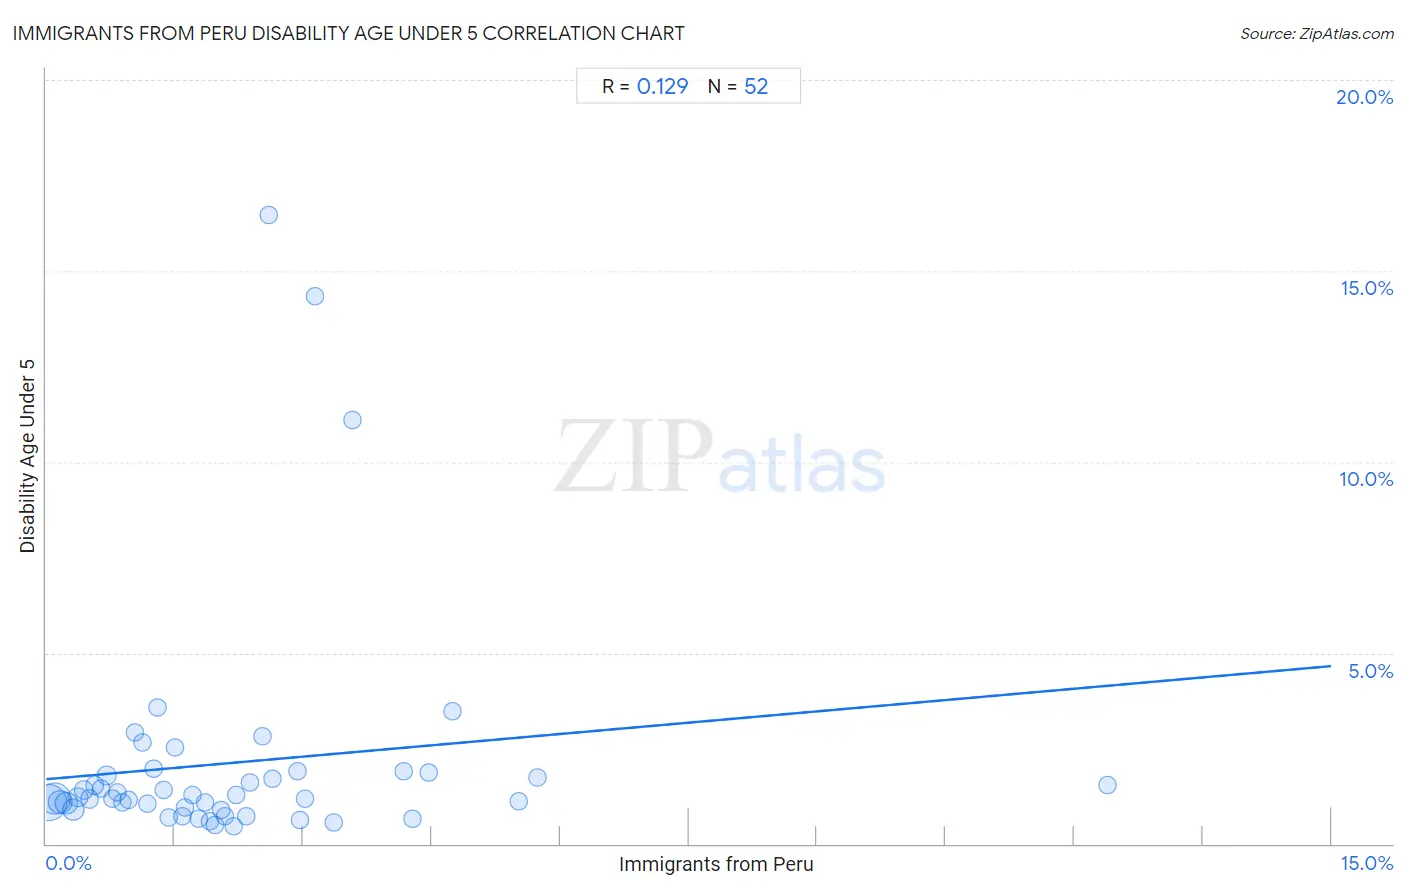
Immigrants from Peru Disability Age Under 5 Correlation Chart
The statistical analysis conducted on geographies consisting of 191,283,198 people shows a poor positive correlation between the proportion of Immigrants from Peru and percentage of population with a disability under the age of 5 in the United States with a correlation coefficient (R) of 0.129 and weighted average of 1.2%. On average, for every 1% (one percent) increase in Immigrants from Peru within a typical geography, there is an increase of 0.20% in percentage of population with a disability under the age of 5.
It is essential to understand that the correlation between the percentage of Immigrants from Peru and percentage of population with a disability under the age of 5 does not imply a direct cause-and-effect relationship. It remains uncertain whether the presence of Immigrants from Peru influences an upward or downward trend in the level of percentage of population with a disability under the age of 5 within an area, or if Immigrants from Peru simply ended up residing in those areas with higher or lower levels of percentage of population with a disability under the age of 5 due to other factors.
Demographics Similar to Immigrants from Peru by Disability Age Under 5
In terms of disability age under 5, the demographic groups most similar to Immigrants from Peru are Macedonian (1.2%, a difference of 0.0%), Immigrants from Saudi Arabia (1.2%, a difference of 0.040%), Palestinian (1.2%, a difference of 0.060%), Immigrants from Mexico (1.2%, a difference of 0.070%), and Immigrants from Western Africa (1.2%, a difference of 0.11%).
| Demographics | Rating | Rank | Disability Age Under 5 |
| Immigrants from Latvia | 50.0 /100 | #174 | Average 1.2% |
| Immigrants from Nigeria | 50.0 /100 | #175 | Average 1.2% |
| Immigrants from Kenya | 48.6 /100 | #176 | Average 1.2% |
| Comanche | 47.5 /100 | #177 | Average 1.2% |
| Venezuelans | 47.1 /100 | #178 | Average 1.2% |
| Immigrants from Bahamas | 45.2 /100 | #179 | Average 1.2% |
| Immigrants from Mexico | 44.4 /100 | #180 | Average 1.2% |
| Immigrants from Peru | 43.7 /100 | #181 | Average 1.2% |
| Macedonians | 43.7 /100 | #181 | Average 1.2% |
| Immigrants from Saudi Arabia | 43.3 /100 | #183 | Average 1.2% |
| Palestinians | 43.0 /100 | #184 | Average 1.2% |
| Immigrants from Western Africa | 42.5 /100 | #185 | Average 1.2% |
| Cubans | 42.5 /100 | #186 | Average 1.2% |
| Immigrants from Haiti | 40.2 /100 | #187 | Average 1.3% |
| Haitians | 39.9 /100 | #188 | Fair 1.3% |
Immigrants from Peru Disability Age Under 5 Correlation Summary
| Measurement | Immigrants from Peru Data | Disability Age Under 5 Data |
| Minimum | 0.036% | 0.47% |
| Maximum | 12.4% | 16.5% |
| Range | 12.4% | 16.0% |
| Mean | 2.1% | 2.1% |
| Median | 1.7% | 1.2% |
| Interquartile 25% (IQ1) | 0.86% | 0.92% |
| Interquartile 75% (IQ3) | 2.8% | 1.8% |
| Interquartile Range (IQR) | 1.9% | 0.90% |
| Standard Deviation (Sample) | 2.0% | 3.1% |
| Standard Deviation (Population) | 2.0% | 3.1% |
Correlation Details
| Immigrants from Peru Percentile | Sample Size | Disability Age Under 5 |
[ 0.0% - 0.5% ] 0.036% | 64,382,050 | 1.1% |
[ 0.0% - 0.5% ] 0.097% | 48,644,328 | 1.2% |
[ 0.0% - 0.5% ] 0.17% | 20,256,751 | 1.1% |
[ 0.0% - 0.5% ] 0.23% | 16,587,971 | 1.1% |
[ 0.0% - 0.5% ] 0.32% | 15,680,731 | 0.89% |
[ 0.0% - 0.5% ] 0.37% | 5,668,806 | 1.2% |
[ 0.0% - 0.5% ] 0.44% | 3,956,267 | 1.4% |
[ 0.5% - 1.0% ] 0.51% | 3,066,889 | 1.2% |
[ 0.5% - 1.0% ] 0.57% | 2,138,870 | 1.5% |
[ 0.5% - 1.0% ] 0.64% | 1,119,301 | 1.4% |
[ 0.5% - 1.0% ] 0.71% | 1,154,541 | 1.8% |
[ 0.5% - 1.0% ] 0.77% | 685,735 | 1.2% |
[ 0.5% - 1.0% ] 0.83% | 865,506 | 1.3% |
[ 0.5% - 1.0% ] 0.89% | 927,495 | 1.1% |
[ 0.5% - 1.0% ] 0.96% | 540,736 | 1.2% |
[ 1.0% - 1.5% ] 1.04% | 430,603 | 2.9% |
[ 1.0% - 1.5% ] 1.12% | 415,485 | 2.6% |
[ 1.0% - 1.5% ] 1.18% | 561,783 | 1.1% |
[ 1.0% - 1.5% ] 1.25% | 438,222 | 2.0% |
[ 1.0% - 1.5% ] 1.30% | 194,031 | 3.6% |
[ 1.0% - 1.5% ] 1.36% | 582,662 | 1.4% |
[ 1.0% - 1.5% ] 1.43% | 302,701 | 0.68% |
[ 1.5% - 2.0% ] 1.50% | 181,208 | 2.5% |
[ 1.5% - 2.0% ] 1.59% | 187,764 | 0.73% |
[ 1.5% - 2.0% ] 1.62% | 129,382 | 0.95% |
[ 1.5% - 2.0% ] 1.70% | 163,646 | 1.3% |
[ 1.5% - 2.0% ] 1.78% | 268,258 | 0.66% |
[ 1.5% - 2.0% ] 1.86% | 253,203 | 1.1% |
[ 1.5% - 2.0% ] 1.91% | 110,518 | 0.60% |
[ 1.5% - 2.0% ] 1.97% | 82,044 | 0.50% |
[ 2.0% - 2.5% ] 2.04% | 45,334 | 0.88% |
[ 2.0% - 2.5% ] 2.08% | 152,025 | 0.72% |
[ 2.0% - 2.5% ] 2.19% | 96,173 | 0.47% |
[ 2.0% - 2.5% ] 2.22% | 214,072 | 1.3% |
[ 2.0% - 2.5% ] 2.34% | 86,203 | 0.73% |
[ 2.0% - 2.5% ] 2.38% | 103,552 | 1.6% |
[ 2.5% - 3.0% ] 2.52% | 43,322 | 2.8% |
[ 2.5% - 3.0% ] 2.59% | 2,661 | 16.5% |
[ 2.5% - 3.0% ] 2.64% | 58,136 | 1.7% |
[ 2.5% - 3.0% ] 2.94% | 10,591 | 1.9% |
[ 2.5% - 3.0% ] 2.96% | 35,492 | 0.64% |
[ 3.0% - 3.5% ] 3.02% | 116,995 | 1.2% |
[ 3.0% - 3.5% ] 3.13% | 6,929 | 14.3% |
[ 3.0% - 3.5% ] 3.35% | 18,426 | 0.54% |
[ 3.5% - 4.0% ] 3.58% | 26,077 | 11.1% |
[ 4.0% - 4.5% ] 4.18% | 16,429 | 1.9% |
[ 4.0% - 4.5% ] 4.28% | 157,864 | 0.65% |
[ 4.0% - 4.5% ] 4.46% | 38,163 | 1.9% |
[ 4.5% - 5.0% ] 4.74% | 33,691 | 3.5% |
[ 5.5% - 6.0% ] 5.51% | 22,377 | 1.1% |
[ 5.5% - 6.0% ] 5.73% | 19,625 | 1.7% |
[ 12.0% - 12.5% ] 12.39% | 1,574 | 1.6% |