Immigrants from Peru Disability
COMPARE
Immigrants from Peru
Select to Compare
Disability
Immigrants from Peru Disability
10.8%
DISABILITY
99.9/ 100
METRIC RATING
45th/ 347
METRIC RANK
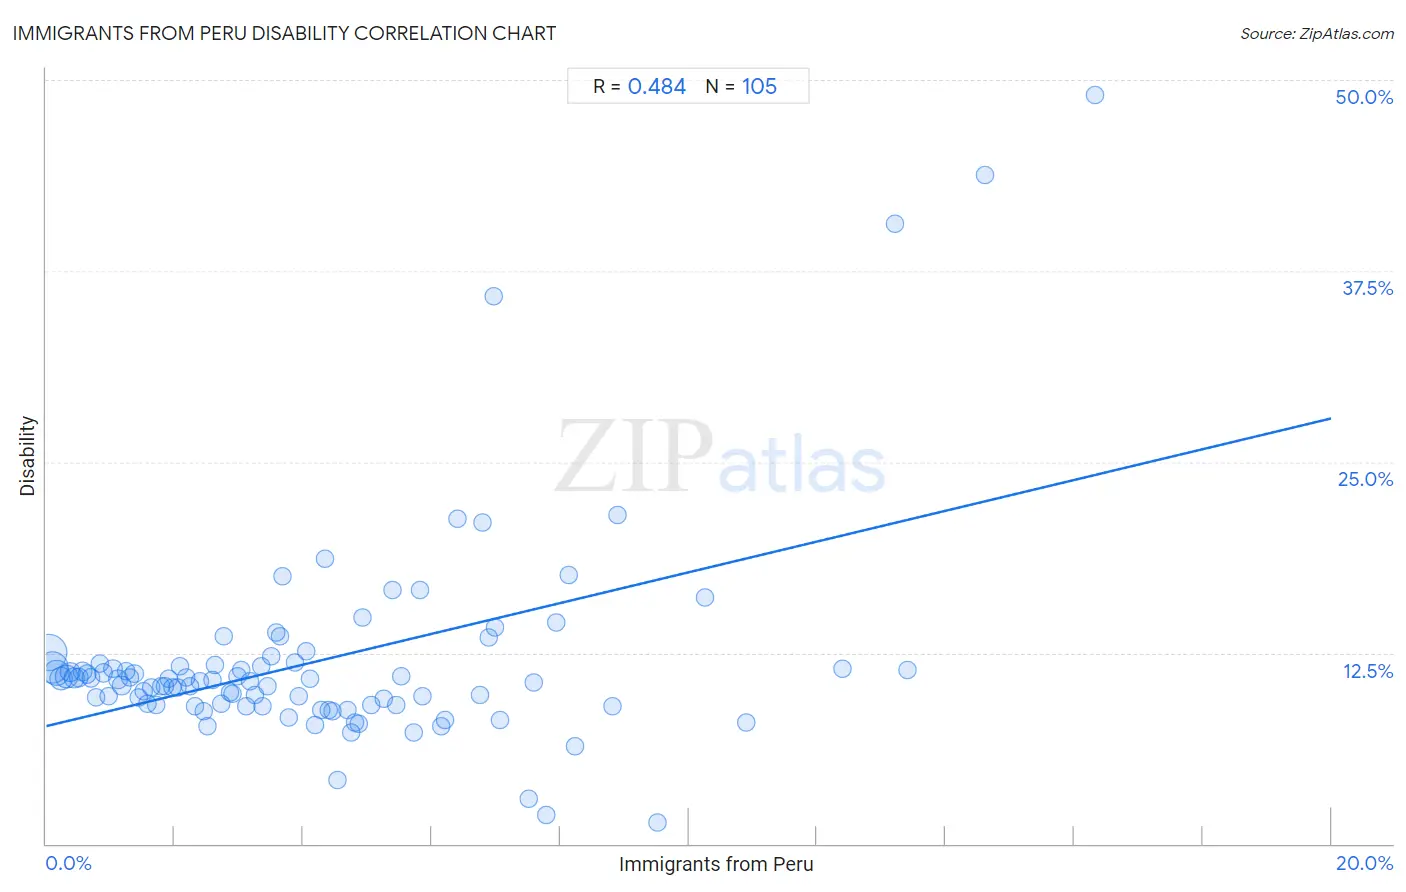
Immigrants from Peru Disability Correlation Chart
The statistical analysis conducted on geographies consisting of 328,839,266 people shows a moderate positive correlation between the proportion of Immigrants from Peru and percentage of population with a disability in the United States with a correlation coefficient (R) of 0.484 and weighted average of 10.8%. On average, for every 1% (one percent) increase in Immigrants from Peru within a typical geography, there is an increase of 1.0% in percentage of population with a disability.
It is essential to understand that the correlation between the percentage of Immigrants from Peru and percentage of population with a disability does not imply a direct cause-and-effect relationship. It remains uncertain whether the presence of Immigrants from Peru influences an upward or downward trend in the level of percentage of population with a disability within an area, or if Immigrants from Peru simply ended up residing in those areas with higher or lower levels of percentage of population with a disability due to other factors.
Demographics Similar to Immigrants from Peru by Disability
In terms of disability, the demographic groups most similar to Immigrants from Peru are Tongan (10.8%, a difference of 0.010%), Taiwanese (10.8%, a difference of 0.020%), Soviet Union (10.9%, a difference of 0.21%), Vietnamese (10.9%, a difference of 0.27%), and Immigrants from Saudi Arabia (10.9%, a difference of 0.27%).
| Demographics | Rating | Rank | Disability |
| Afghans | 99.9 /100 | #38 | Exceptional 10.8% |
| Cambodians | 99.9 /100 | #39 | Exceptional 10.8% |
| Mongolians | 99.9 /100 | #40 | Exceptional 10.8% |
| Immigrants from Australia | 99.9 /100 | #41 | Exceptional 10.8% |
| Immigrants from Nepal | 99.9 /100 | #42 | Exceptional 10.8% |
| Israelis | 99.9 /100 | #43 | Exceptional 10.8% |
| Immigrants from Japan | 99.9 /100 | #44 | Exceptional 10.8% |
| Immigrants from Peru | 99.9 /100 | #45 | Exceptional 10.8% |
| Tongans | 99.9 /100 | #46 | Exceptional 10.8% |
| Taiwanese | 99.9 /100 | #47 | Exceptional 10.8% |
| Soviet Union | 99.9 /100 | #48 | Exceptional 10.9% |
| Vietnamese | 99.9 /100 | #49 | Exceptional 10.9% |
| Immigrants from Saudi Arabia | 99.9 /100 | #50 | Exceptional 10.9% |
| Peruvians | 99.8 /100 | #51 | Exceptional 10.9% |
| South Americans | 99.8 /100 | #52 | Exceptional 10.9% |
Immigrants from Peru Disability Correlation Summary
| Measurement | Immigrants from Peru Data | Disability Data |
| Minimum | 0.036% | 1.4% |
| Maximum | 16.3% | 49.0% |
| Range | 16.3% | 47.6% |
| Mean | 4.2% | 12.0% |
| Median | 3.5% | 10.7% |
| Interquartile 25% (IQ1) | 1.7% | 9.1% |
| Interquartile 75% (IQ3) | 5.8% | 11.7% |
| Interquartile Range (IQR) | 4.1% | 2.6% |
| Standard Deviation (Sample) | 3.3% | 7.0% |
| Standard Deviation (Population) | 3.3% | 6.9% |
Correlation Details
| Immigrants from Peru Percentile | Sample Size | Disability |
[ 0.0% - 0.5% ] 0.036% | 101,666,808 | 12.5% |
[ 0.0% - 0.5% ] 0.097% | 75,125,441 | 11.6% |
[ 0.0% - 0.5% ] 0.17% | 37,303,734 | 11.2% |
[ 0.0% - 0.5% ] 0.23% | 28,637,348 | 10.8% |
[ 0.0% - 0.5% ] 0.31% | 23,887,860 | 11.0% |
[ 0.0% - 0.5% ] 0.37% | 11,587,291 | 11.2% |
[ 0.0% - 0.5% ] 0.44% | 8,825,810 | 10.9% |
[ 0.5% - 1.0% ] 0.50% | 6,191,283 | 10.9% |
[ 0.5% - 1.0% ] 0.57% | 5,325,675 | 11.3% |
[ 0.5% - 1.0% ] 0.64% | 3,626,934 | 11.1% |
[ 0.5% - 1.0% ] 0.70% | 2,998,172 | 10.9% |
[ 0.5% - 1.0% ] 0.77% | 1,802,016 | 9.6% |
[ 0.5% - 1.0% ] 0.83% | 1,705,435 | 11.8% |
[ 0.5% - 1.0% ] 0.90% | 2,534,127 | 11.2% |
[ 0.5% - 1.0% ] 0.97% | 1,493,366 | 9.7% |
[ 1.0% - 1.5% ] 1.04% | 1,250,429 | 11.5% |
[ 1.0% - 1.5% ] 1.12% | 1,064,583 | 10.8% |
[ 1.0% - 1.5% ] 1.18% | 1,203,031 | 10.4% |
[ 1.0% - 1.5% ] 1.25% | 1,250,442 | 11.3% |
[ 1.0% - 1.5% ] 1.31% | 654,748 | 10.9% |
[ 1.0% - 1.5% ] 1.37% | 1,376,560 | 11.2% |
[ 1.0% - 1.5% ] 1.44% | 614,614 | 9.6% |
[ 1.5% - 2.0% ] 1.51% | 672,290 | 10.0% |
[ 1.5% - 2.0% ] 1.58% | 636,973 | 9.2% |
[ 1.5% - 2.0% ] 1.64% | 556,745 | 10.2% |
[ 1.5% - 2.0% ] 1.71% | 493,483 | 9.1% |
[ 1.5% - 2.0% ] 1.78% | 508,504 | 10.3% |
[ 1.5% - 2.0% ] 1.85% | 618,215 | 10.3% |
[ 1.5% - 2.0% ] 1.91% | 459,745 | 10.8% |
[ 1.5% - 2.0% ] 1.97% | 310,486 | 10.2% |
[ 2.0% - 2.5% ] 2.04% | 253,350 | 10.3% |
[ 2.0% - 2.5% ] 2.08% | 267,070 | 11.6% |
[ 2.0% - 2.5% ] 2.18% | 368,706 | 10.9% |
[ 2.0% - 2.5% ] 2.24% | 422,672 | 10.3% |
[ 2.0% - 2.5% ] 2.32% | 202,593 | 9.0% |
[ 2.0% - 2.5% ] 2.38% | 192,219 | 10.6% |
[ 2.0% - 2.5% ] 2.45% | 68,432 | 8.7% |
[ 2.5% - 3.0% ] 2.51% | 201,498 | 7.7% |
[ 2.5% - 3.0% ] 2.58% | 38,080 | 10.7% |
[ 2.5% - 3.0% ] 2.64% | 230,973 | 11.7% |
[ 2.5% - 3.0% ] 2.73% | 299,710 | 9.2% |
[ 2.5% - 3.0% ] 2.77% | 11,699 | 13.5% |
[ 2.5% - 3.0% ] 2.86% | 66,752 | 9.9% |
[ 2.5% - 3.0% ] 2.91% | 94,252 | 9.8% |
[ 2.5% - 3.0% ] 2.97% | 239,202 | 11.0% |
[ 3.0% - 3.5% ] 3.04% | 155,207 | 11.4% |
[ 3.0% - 3.5% ] 3.11% | 12,264 | 9.0% |
[ 3.0% - 3.5% ] 3.18% | 125,467 | 10.6% |
[ 3.0% - 3.5% ] 3.26% | 48,470 | 9.8% |
[ 3.0% - 3.5% ] 3.34% | 4,098 | 11.6% |
[ 3.0% - 3.5% ] 3.36% | 19,482 | 9.0% |
[ 3.0% - 3.5% ] 3.44% | 88,575 | 10.3% |
[ 3.5% - 4.0% ] 3.50% | 12,071 | 12.3% |
[ 3.5% - 4.0% ] 3.58% | 26,299 | 13.8% |
[ 3.5% - 4.0% ] 3.64% | 2,498 | 13.6% |
[ 3.5% - 4.0% ] 3.69% | 217 | 17.5% |
[ 3.5% - 4.0% ] 3.77% | 41,139 | 8.3% |
[ 3.5% - 4.0% ] 3.86% | 14,570 | 11.9% |
[ 3.5% - 4.0% ] 3.93% | 175,118 | 9.7% |
[ 4.0% - 4.5% ] 4.04% | 1,534 | 12.6% |
[ 4.0% - 4.5% ] 4.10% | 38,759 | 10.8% |
[ 4.0% - 4.5% ] 4.18% | 16,429 | 7.8% |
[ 4.0% - 4.5% ] 4.27% | 202,257 | 8.8% |
[ 4.0% - 4.5% ] 4.34% | 2,302 | 18.7% |
[ 4.0% - 4.5% ] 4.40% | 15,139 | 8.8% |
[ 4.0% - 4.5% ] 4.46% | 38,163 | 8.7% |
[ 4.5% - 5.0% ] 4.53% | 17,546 | 4.2% |
[ 4.5% - 5.0% ] 4.69% | 43,269 | 8.7% |
[ 4.5% - 5.0% ] 4.74% | 34,597 | 7.3% |
[ 4.5% - 5.0% ] 4.81% | 37,169 | 8.0% |
[ 4.5% - 5.0% ] 4.86% | 7,598 | 7.9% |
[ 4.5% - 5.0% ] 4.93% | 345 | 14.8% |
[ 5.0% - 5.5% ] 5.07% | 25,988 | 9.1% |
[ 5.0% - 5.5% ] 5.25% | 1,258 | 9.5% |
[ 5.0% - 5.5% ] 5.38% | 2,025 | 16.6% |
[ 5.0% - 5.5% ] 5.44% | 7,185 | 9.1% |
[ 5.5% - 6.0% ] 5.52% | 62,419 | 11.0% |
[ 5.5% - 6.0% ] 5.73% | 20,409 | 7.3% |
[ 5.5% - 6.0% ] 5.82% | 8,104 | 16.6% |
[ 5.5% - 6.0% ] 5.85% | 6,601 | 9.7% |
[ 6.0% - 6.5% ] 6.14% | 2,718 | 7.7% |
[ 6.0% - 6.5% ] 6.20% | 44,394 | 8.1% |
[ 6.0% - 6.5% ] 6.41% | 2,217 | 21.2% |
[ 6.5% - 7.0% ] 6.74% | 11,584 | 9.7% |
[ 6.5% - 7.0% ] 6.79% | 2,929 | 21.1% |
[ 6.5% - 7.0% ] 6.90% | 464 | 13.5% |
[ 6.5% - 7.0% ] 6.97% | 201 | 35.8% |
[ 6.5% - 7.0% ] 6.99% | 8,373 | 14.2% |
[ 7.0% - 7.5% ] 7.06% | 82,314 | 8.1% |
[ 7.5% - 8.0% ] 7.50% | 2,533 | 3.0% |
[ 7.5% - 8.0% ] 7.58% | 963 | 10.6% |
[ 7.5% - 8.0% ] 7.78% | 681 | 1.9% |
[ 7.5% - 8.0% ] 7.94% | 2,910 | 14.5% |
[ 8.0% - 8.5% ] 8.14% | 467 | 17.6% |
[ 8.0% - 8.5% ] 8.22% | 11,069 | 6.4% |
[ 8.5% - 9.0% ] 8.82% | 5,309 | 9.0% |
[ 8.5% - 9.0% ] 8.90% | 2,101 | 21.6% |
[ 9.5% - 10.0% ] 9.51% | 568 | 1.4% |
[ 10.0% - 10.5% ] 10.26% | 1,277 | 16.2% |
[ 10.5% - 11.0% ] 10.89% | 303 | 7.9% |
[ 12.0% - 12.5% ] 12.39% | 1,574 | 11.4% |
[ 13.0% - 13.5% ] 13.21% | 106 | 40.6% |
[ 13.0% - 13.5% ] 13.40% | 97 | 11.3% |
[ 14.5% - 15.0% ] 14.61% | 89 | 43.8% |
[ 16.0% - 16.5% ] 16.33% | 98 | 49.0% |