Immigrants from Peru 4 or more Vehicles in Household
COMPARE
Immigrants from Peru
Select to Compare
4 or more Vehicles in Household
Immigrants from Peru 4 or more Vehicles in Household
6.4%
4+ VEHICLES AVAILABLE
59.8/ 100
METRIC RATING
165th/ 347
METRIC RANK
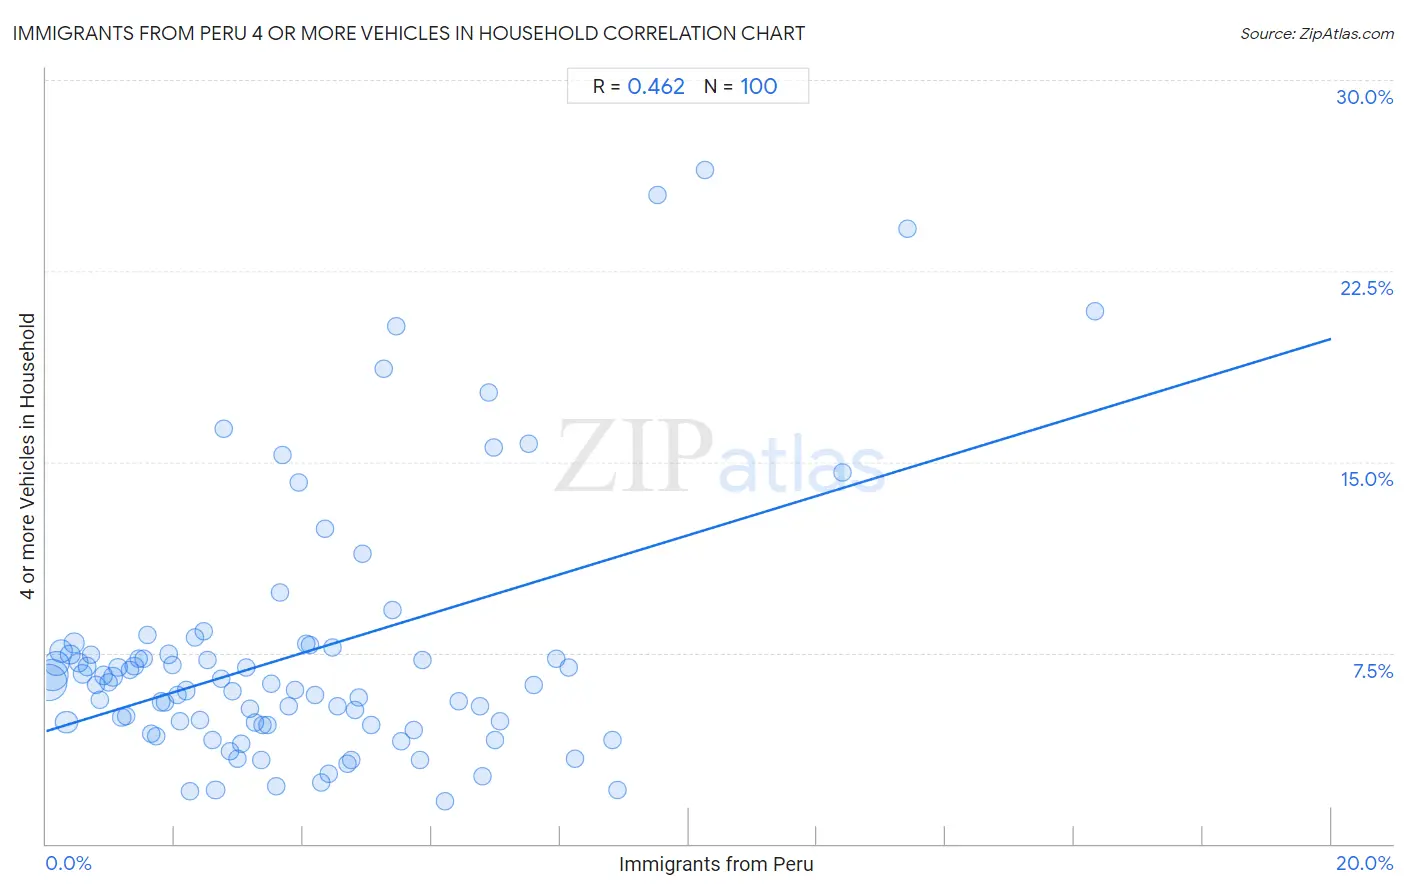
Immigrants from Peru 4 or more Vehicles in Household Correlation Chart
The statistical analysis conducted on geographies consisting of 327,444,573 people shows a moderate positive correlation between the proportion of Immigrants from Peru and percentage of households with 4 or more vehicles available in the United States with a correlation coefficient (R) of 0.462 and weighted average of 6.4%. On average, for every 1% (one percent) increase in Immigrants from Peru within a typical geography, there is an increase of 0.77% in percentage of households with 4 or more vehicles available.
It is essential to understand that the correlation between the percentage of Immigrants from Peru and percentage of households with 4 or more vehicles available does not imply a direct cause-and-effect relationship. It remains uncertain whether the presence of Immigrants from Peru influences an upward or downward trend in the level of percentage of households with 4 or more vehicles available within an area, or if Immigrants from Peru simply ended up residing in those areas with higher or lower levels of percentage of households with 4 or more vehicles available due to other factors.
Demographics Similar to Immigrants from Peru by 4 or more Vehicles in Household
In terms of 4 or more vehicles in household, the demographic groups most similar to Immigrants from Peru are Chilean (6.4%, a difference of 0.14%), Hungarian (6.4%, a difference of 0.14%), Immigrants from Denmark (6.4%, a difference of 0.21%), Polish (6.4%, a difference of 0.31%), and Immigrants from Pakistan (6.4%, a difference of 0.36%).
| Demographics | Rating | Rank | 4 or more Vehicles in Household |
| Zimbabweans | 67.1 /100 | #158 | Good 6.4% |
| Indians (Asian) | 66.3 /100 | #159 | Good 6.4% |
| Palestinians | 65.8 /100 | #160 | Good 6.4% |
| Immigrants from Cameroon | 64.4 /100 | #161 | Good 6.4% |
| Immigrants from Pakistan | 63.2 /100 | #162 | Good 6.4% |
| Chileans | 61.2 /100 | #163 | Good 6.4% |
| Hungarians | 61.1 /100 | #164 | Good 6.4% |
| Immigrants from Peru | 59.8 /100 | #165 | Average 6.4% |
| Immigrants from Denmark | 57.8 /100 | #166 | Average 6.4% |
| Poles | 56.9 /100 | #167 | Average 6.4% |
| Lebanese | 55.8 /100 | #168 | Average 6.4% |
| Estonians | 55.1 /100 | #169 | Average 6.4% |
| Immigrants from Syria | 52.8 /100 | #170 | Average 6.3% |
| Immigrants from India | 51.9 /100 | #171 | Average 6.3% |
| Immigrants from Lebanon | 51.7 /100 | #172 | Average 6.3% |
Immigrants from Peru 4 or more Vehicles in Household Correlation Summary
| Measurement | Immigrants from Peru Data | 4 or more Vehicles in Household Data |
| Minimum | 0.036% | 1.7% |
| Maximum | 16.3% | 26.5% |
| Range | 16.3% | 24.8% |
| Mean | 3.9% | 7.4% |
| Median | 3.4% | 6.3% |
| Interquartile 25% (IQ1) | 1.7% | 4.7% |
| Interquartile 75% (IQ3) | 5.4% | 7.5% |
| Interquartile Range (IQR) | 3.7% | 2.8% |
| Standard Deviation (Sample) | 3.0% | 5.0% |
| Standard Deviation (Population) | 3.0% | 5.0% |
Correlation Details
| Immigrants from Peru Percentile | Sample Size | 4 or more Vehicles in Household |
[ 0.0% - 0.5% ] 0.036% | 101,492,836 | 6.3% |
[ 0.0% - 0.5% ] 0.097% | 74,829,075 | 6.6% |
[ 0.0% - 0.5% ] 0.17% | 37,126,536 | 7.1% |
[ 0.0% - 0.5% ] 0.23% | 28,437,651 | 7.6% |
[ 0.0% - 0.5% ] 0.31% | 23,849,015 | 4.8% |
[ 0.0% - 0.5% ] 0.37% | 11,540,108 | 7.4% |
[ 0.0% - 0.5% ] 0.44% | 8,778,820 | 7.9% |
[ 0.5% - 1.0% ] 0.50% | 6,149,099 | 7.1% |
[ 0.5% - 1.0% ] 0.57% | 5,255,750 | 6.7% |
[ 0.5% - 1.0% ] 0.64% | 3,597,520 | 7.0% |
[ 0.5% - 1.0% ] 0.70% | 2,916,775 | 7.4% |
[ 0.5% - 1.0% ] 0.77% | 1,802,016 | 6.2% |
[ 0.5% - 1.0% ] 0.83% | 1,684,003 | 5.6% |
[ 0.5% - 1.0% ] 0.90% | 2,533,683 | 6.6% |
[ 0.5% - 1.0% ] 0.97% | 1,469,452 | 6.3% |
[ 1.0% - 1.5% ] 1.04% | 1,189,949 | 6.6% |
[ 1.0% - 1.5% ] 1.12% | 1,062,534 | 6.9% |
[ 1.0% - 1.5% ] 1.18% | 1,203,031 | 5.0% |
[ 1.0% - 1.5% ] 1.25% | 1,247,882 | 5.0% |
[ 1.0% - 1.5% ] 1.31% | 647,879 | 6.8% |
[ 1.0% - 1.5% ] 1.37% | 1,376,560 | 7.0% |
[ 1.0% - 1.5% ] 1.44% | 614,476 | 7.3% |
[ 1.5% - 2.0% ] 1.51% | 658,938 | 7.3% |
[ 1.5% - 2.0% ] 1.58% | 636,973 | 8.2% |
[ 1.5% - 2.0% ] 1.64% | 556,266 | 4.3% |
[ 1.5% - 2.0% ] 1.71% | 492,062 | 4.2% |
[ 1.5% - 2.0% ] 1.78% | 499,755 | 5.6% |
[ 1.5% - 2.0% ] 1.85% | 618,215 | 5.5% |
[ 1.5% - 2.0% ] 1.91% | 458,638 | 7.4% |
[ 1.5% - 2.0% ] 1.97% | 310,486 | 7.0% |
[ 2.0% - 2.5% ] 2.04% | 253,350 | 5.9% |
[ 2.0% - 2.5% ] 2.08% | 259,627 | 4.8% |
[ 2.0% - 2.5% ] 2.18% | 368,706 | 6.0% |
[ 2.0% - 2.5% ] 2.24% | 421,774 | 2.1% |
[ 2.0% - 2.5% ] 2.32% | 202,900 | 8.1% |
[ 2.0% - 2.5% ] 2.38% | 192,219 | 4.9% |
[ 2.0% - 2.5% ] 2.45% | 51,296 | 8.4% |
[ 2.5% - 3.0% ] 2.51% | 201,498 | 7.2% |
[ 2.5% - 3.0% ] 2.58% | 38,080 | 4.1% |
[ 2.5% - 3.0% ] 2.64% | 228,639 | 2.1% |
[ 2.5% - 3.0% ] 2.73% | 293,147 | 6.5% |
[ 2.5% - 3.0% ] 2.77% | 12,702 | 16.3% |
[ 2.5% - 3.0% ] 2.85% | 62,529 | 3.6% |
[ 2.5% - 3.0% ] 2.91% | 94,252 | 6.0% |
[ 2.5% - 3.0% ] 2.97% | 239,202 | 3.3% |
[ 3.0% - 3.5% ] 3.04% | 155,207 | 3.9% |
[ 3.0% - 3.5% ] 3.11% | 12,264 | 6.9% |
[ 3.0% - 3.5% ] 3.18% | 125,467 | 5.3% |
[ 3.0% - 3.5% ] 3.26% | 48,470 | 4.8% |
[ 3.0% - 3.5% ] 3.34% | 4,098 | 3.3% |
[ 3.0% - 3.5% ] 3.36% | 19,482 | 4.7% |
[ 3.0% - 3.5% ] 3.44% | 88,575 | 4.7% |
[ 3.5% - 4.0% ] 3.50% | 12,071 | 6.3% |
[ 3.5% - 4.0% ] 3.58% | 26,299 | 2.3% |
[ 3.5% - 4.0% ] 3.64% | 2,498 | 9.9% |
[ 3.5% - 4.0% ] 3.69% | 217 | 15.3% |
[ 3.5% - 4.0% ] 3.77% | 41,139 | 5.4% |
[ 3.5% - 4.0% ] 3.86% | 14,570 | 6.0% |
[ 3.5% - 4.0% ] 3.93% | 175,118 | 14.2% |
[ 4.0% - 4.5% ] 4.04% | 1,534 | 7.9% |
[ 4.0% - 4.5% ] 4.10% | 38,759 | 7.8% |
[ 4.0% - 4.5% ] 4.18% | 16,429 | 5.9% |
[ 4.0% - 4.5% ] 4.27% | 202,257 | 2.4% |
[ 4.0% - 4.5% ] 4.34% | 2,302 | 12.4% |
[ 4.0% - 4.5% ] 4.40% | 15,139 | 2.7% |
[ 4.0% - 4.5% ] 4.46% | 38,163 | 7.7% |
[ 4.5% - 5.0% ] 4.53% | 16,596 | 5.4% |
[ 4.5% - 5.0% ] 4.69% | 43,269 | 3.1% |
[ 4.5% - 5.0% ] 4.74% | 33,691 | 3.3% |
[ 4.5% - 5.0% ] 4.81% | 37,169 | 5.3% |
[ 4.5% - 5.0% ] 4.86% | 7,598 | 5.8% |
[ 4.5% - 5.0% ] 4.93% | 345 | 11.4% |
[ 5.0% - 5.5% ] 5.07% | 25,988 | 4.7% |
[ 5.0% - 5.5% ] 5.25% | 1,258 | 18.7% |
[ 5.0% - 5.5% ] 5.38% | 2,025 | 9.2% |
[ 5.0% - 5.5% ] 5.44% | 7,185 | 20.3% |
[ 5.5% - 6.0% ] 5.52% | 62,419 | 4.0% |
[ 5.5% - 6.0% ] 5.73% | 20,409 | 4.5% |
[ 5.5% - 6.0% ] 5.82% | 8,104 | 3.3% |
[ 5.5% - 6.0% ] 5.85% | 6,601 | 7.2% |
[ 6.0% - 6.5% ] 6.20% | 44,394 | 1.7% |
[ 6.0% - 6.5% ] 6.41% | 1,497 | 5.6% |
[ 6.5% - 7.0% ] 6.74% | 11,584 | 5.4% |
[ 6.5% - 7.0% ] 6.79% | 2,753 | 2.7% |
[ 6.5% - 7.0% ] 6.90% | 464 | 17.7% |
[ 6.5% - 7.0% ] 6.97% | 201 | 15.6% |
[ 6.5% - 7.0% ] 6.98% | 3,781 | 4.1% |
[ 7.0% - 7.5% ] 7.06% | 82,314 | 4.8% |
[ 7.5% - 8.0% ] 7.50% | 2,533 | 15.7% |
[ 7.5% - 8.0% ] 7.58% | 963 | 6.2% |
[ 7.5% - 8.0% ] 7.94% | 2,910 | 7.2% |
[ 8.0% - 8.5% ] 8.14% | 467 | 6.9% |
[ 8.0% - 8.5% ] 8.22% | 11,069 | 3.4% |
[ 8.5% - 9.0% ] 8.82% | 5,309 | 4.1% |
[ 8.5% - 9.0% ] 8.90% | 2,101 | 2.1% |
[ 9.5% - 10.0% ] 9.51% | 568 | 25.5% |
[ 10.0% - 10.5% ] 10.26% | 1,277 | 26.5% |
[ 12.0% - 12.5% ] 12.39% | 1,574 | 14.6% |
[ 13.0% - 13.5% ] 13.40% | 97 | 24.1% |
[ 16.0% - 16.5% ] 16.33% | 98 | 20.9% |