Immigrants from Peru Wage/Income Gap
COMPARE
Immigrants from Peru
Select to Compare
Wage/Income Gap
Immigrants from Peru Wage/Income Gap
25.1%
WAGE/INCOME GAP
82.6/ 100
METRIC RATING
149th/ 347
METRIC RANK
Immigrants from Peru Wage/Income Gap Correlation Chart
The statistical analysis conducted on geographies consisting of 328,741,739 people shows a mild positive correlation between the proportion of Immigrants from Peru and wage/income gap percentage in the United States with a correlation coefficient (R) of 0.325 and weighted average of 25.1%. On average, for every 1% (one percent) increase in Immigrants from Peru within a typical geography, there is an increase of 1.2% in wage/income gap percentage.
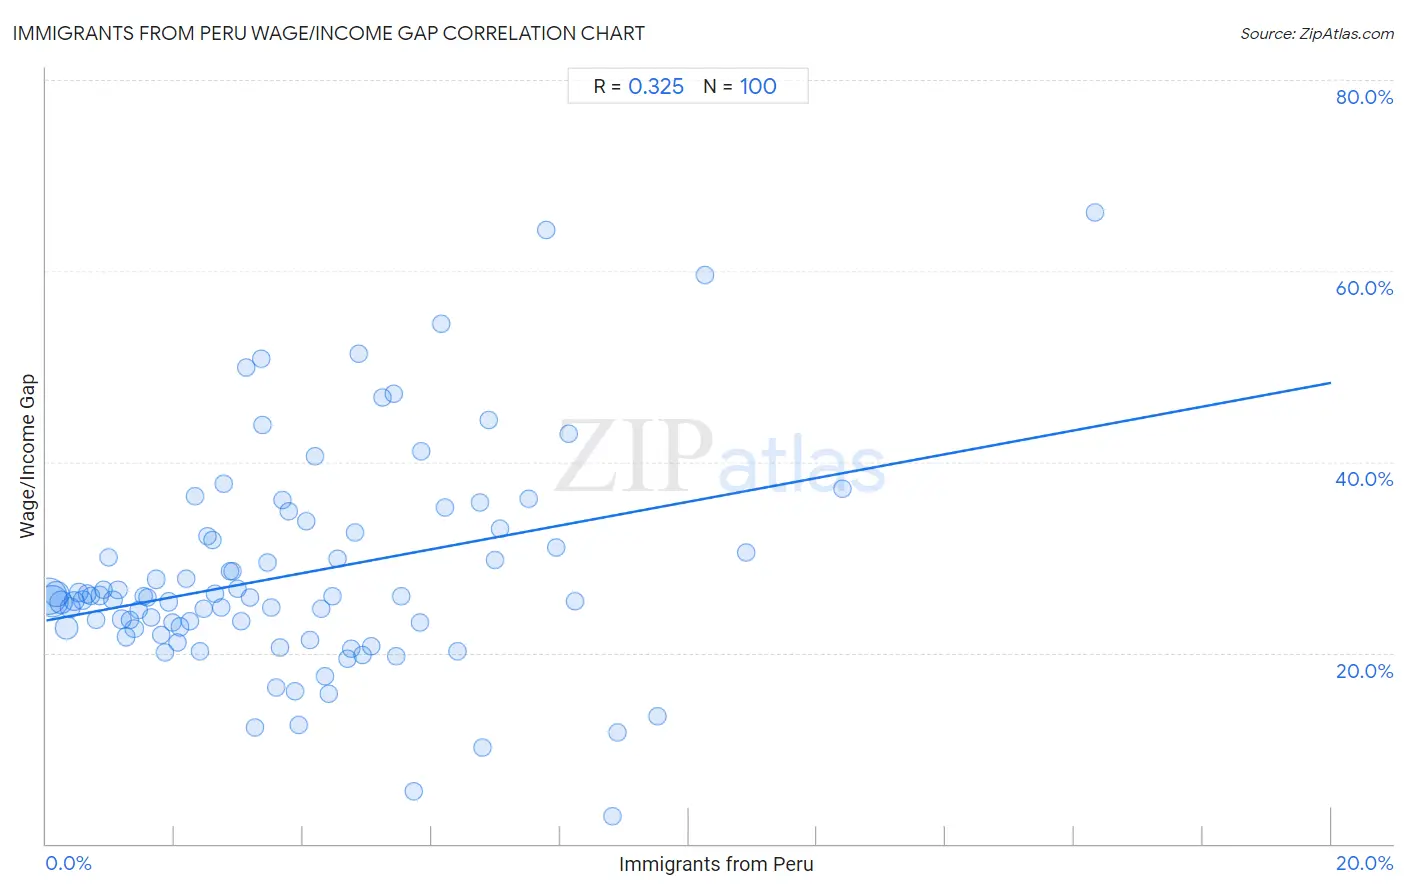
It is essential to understand that the correlation between the percentage of Immigrants from Peru and wage/income gap percentage does not imply a direct cause-and-effect relationship. It remains uncertain whether the presence of Immigrants from Peru influences an upward or downward trend in the level of wage/income gap percentage within an area, or if Immigrants from Peru simply ended up residing in those areas with higher or lower levels of wage/income gap percentage due to other factors.
Demographics Similar to Immigrants from Peru by Wage/Income Gap
In terms of wage/income gap, the demographic groups most similar to Immigrants from Peru are Immigrants (25.1%, a difference of 0.040%), Taiwanese (25.1%, a difference of 0.12%), Iroquois (25.1%, a difference of 0.15%), Uruguayan (25.2%, a difference of 0.16%), and Malaysian (25.0%, a difference of 0.28%).
| Demographics | Rating | Rank | Wage/Income Gap |
| Afghans | 88.1 /100 | #142 | Excellent 24.9% |
| Immigrants from Uganda | 88.0 /100 | #143 | Excellent 24.9% |
| Chippewa | 86.9 /100 | #144 | Excellent 25.0% |
| Comanche | 85.2 /100 | #145 | Excellent 25.0% |
| South Americans | 85.2 /100 | #146 | Excellent 25.0% |
| Malaysians | 84.9 /100 | #147 | Excellent 25.0% |
| Iroquois | 83.9 /100 | #148 | Excellent 25.1% |
| Immigrants from Peru | 82.6 /100 | #149 | Excellent 25.1% |
| Immigrants | 82.3 /100 | #150 | Excellent 25.1% |
| Taiwanese | 81.6 /100 | #151 | Excellent 25.1% |
| Uruguayans | 81.3 /100 | #152 | Excellent 25.2% |
| Blackfeet | 78.1 /100 | #153 | Good 25.2% |
| Immigrants from Northern Africa | 78.1 /100 | #154 | Good 25.2% |
| Immigrants from Vietnam | 77.7 /100 | #155 | Good 25.2% |
| Immigrants from Mexico | 76.4 /100 | #156 | Good 25.3% |
Immigrants from Peru Wage/Income Gap Correlation Summary
| Measurement | Immigrants from Peru Data | Wage/Income Gap Data |
| Minimum | 0.036% | 2.9% |
| Maximum | 16.3% | 66.2% |
| Range | 16.3% | 63.3% |
| Mean | 3.9% | 28.2% |
| Median | 3.4% | 25.8% |
| Interquartile 25% (IQ1) | 1.7% | 22.6% |
| Interquartile 75% (IQ3) | 5.4% | 32.4% |
| Interquartile Range (IQR) | 3.8% | 9.8% |
| Standard Deviation (Sample) | 2.9% | 11.3% |
| Standard Deviation (Population) | 2.9% | 11.2% |
Correlation Details
| Immigrants from Peru Percentile | Sample Size | Wage/Income Gap |
[ 0.0% - 0.5% ] 0.036% | 101,664,752 | 26.0% |
[ 0.0% - 0.5% ] 0.097% | 75,126,531 | 25.4% |
[ 0.0% - 0.5% ] 0.17% | 37,291,055 | 26.1% |
[ 0.0% - 0.5% ] 0.23% | 28,631,938 | 25.3% |
[ 0.0% - 0.5% ] 0.31% | 23,885,872 | 22.6% |
[ 0.0% - 0.5% ] 0.37% | 11,584,764 | 24.7% |
[ 0.0% - 0.5% ] 0.44% | 8,814,708 | 25.4% |
[ 0.5% - 1.0% ] 0.50% | 6,185,237 | 26.3% |
[ 0.5% - 1.0% ] 0.57% | 5,325,307 | 25.5% |
[ 0.5% - 1.0% ] 0.64% | 3,621,690 | 26.1% |
[ 0.5% - 1.0% ] 0.70% | 2,998,172 | 26.0% |
[ 0.5% - 1.0% ] 0.77% | 1,799,993 | 23.4% |
[ 0.5% - 1.0% ] 0.83% | 1,703,886 | 26.0% |
[ 0.5% - 1.0% ] 0.90% | 2,533,457 | 26.6% |
[ 0.5% - 1.0% ] 0.97% | 1,488,410 | 30.0% |
[ 1.0% - 1.5% ] 1.04% | 1,249,589 | 25.6% |
[ 1.0% - 1.5% ] 1.12% | 1,061,575 | 26.5% |
[ 1.0% - 1.5% ] 1.18% | 1,203,031 | 23.5% |
[ 1.0% - 1.5% ] 1.25% | 1,249,459 | 21.7% |
[ 1.0% - 1.5% ] 1.31% | 652,696 | 23.5% |
[ 1.0% - 1.5% ] 1.37% | 1,374,487 | 22.5% |
[ 1.0% - 1.5% ] 1.44% | 612,940 | 24.5% |
[ 1.5% - 2.0% ] 1.51% | 667,913 | 25.9% |
[ 1.5% - 2.0% ] 1.58% | 635,450 | 25.7% |
[ 1.5% - 2.0% ] 1.64% | 554,943 | 23.8% |
[ 1.5% - 2.0% ] 1.71% | 493,483 | 27.7% |
[ 1.5% - 2.0% ] 1.78% | 508,172 | 21.9% |
[ 1.5% - 2.0% ] 1.85% | 615,624 | 20.0% |
[ 1.5% - 2.0% ] 1.91% | 453,579 | 25.3% |
[ 1.5% - 2.0% ] 1.97% | 310,333 | 23.1% |
[ 2.0% - 2.5% ] 2.04% | 249,985 | 21.1% |
[ 2.0% - 2.5% ] 2.08% | 267,070 | 22.7% |
[ 2.0% - 2.5% ] 2.18% | 368,336 | 27.7% |
[ 2.0% - 2.5% ] 2.24% | 421,774 | 23.3% |
[ 2.0% - 2.5% ] 2.32% | 202,295 | 36.5% |
[ 2.0% - 2.5% ] 2.38% | 191,716 | 20.2% |
[ 2.0% - 2.5% ] 2.45% | 67,258 | 24.6% |
[ 2.5% - 3.0% ] 2.51% | 201,458 | 32.2% |
[ 2.5% - 3.0% ] 2.58% | 38,080 | 31.8% |
[ 2.5% - 3.0% ] 2.64% | 230,973 | 26.2% |
[ 2.5% - 3.0% ] 2.73% | 299,413 | 24.7% |
[ 2.5% - 3.0% ] 2.77% | 12,702 | 37.7% |
[ 2.5% - 3.0% ] 2.86% | 66,752 | 28.6% |
[ 2.5% - 3.0% ] 2.91% | 94,252 | 28.6% |
[ 2.5% - 3.0% ] 2.97% | 239,202 | 26.7% |
[ 3.0% - 3.5% ] 3.04% | 155,207 | 23.3% |
[ 3.0% - 3.5% ] 3.11% | 11,881 | 49.9% |
[ 3.0% - 3.5% ] 3.18% | 125,057 | 25.7% |
[ 3.0% - 3.5% ] 3.26% | 48,470 | 12.2% |
[ 3.0% - 3.5% ] 3.34% | 4,098 | 50.8% |
[ 3.0% - 3.5% ] 3.36% | 19,482 | 43.9% |
[ 3.0% - 3.5% ] 3.44% | 88,575 | 29.4% |
[ 3.5% - 4.0% ] 3.50% | 12,071 | 24.7% |
[ 3.5% - 4.0% ] 3.58% | 26,299 | 16.4% |
[ 3.5% - 4.0% ] 3.64% | 2,498 | 20.6% |
[ 3.5% - 4.0% ] 3.69% | 217 | 36.0% |
[ 3.5% - 4.0% ] 3.77% | 41,139 | 34.8% |
[ 3.5% - 4.0% ] 3.86% | 14,570 | 16.0% |
[ 3.5% - 4.0% ] 3.93% | 174,684 | 12.5% |
[ 4.0% - 4.5% ] 4.04% | 1,534 | 33.8% |
[ 4.0% - 4.5% ] 4.10% | 38,178 | 21.3% |
[ 4.0% - 4.5% ] 4.18% | 16,429 | 40.6% |
[ 4.0% - 4.5% ] 4.27% | 202,257 | 24.6% |
[ 4.0% - 4.5% ] 4.34% | 2,302 | 17.6% |
[ 4.0% - 4.5% ] 4.40% | 15,139 | 15.7% |
[ 4.0% - 4.5% ] 4.46% | 38,163 | 25.9% |
[ 4.5% - 5.0% ] 4.53% | 16,596 | 29.8% |
[ 4.5% - 5.0% ] 4.69% | 43,269 | 19.4% |
[ 4.5% - 5.0% ] 4.74% | 33,691 | 20.4% |
[ 4.5% - 5.0% ] 4.81% | 37,169 | 32.6% |
[ 4.5% - 5.0% ] 4.86% | 7,598 | 51.3% |
[ 4.5% - 5.0% ] 4.93% | 345 | 19.8% |
[ 5.0% - 5.5% ] 5.07% | 25,988 | 20.7% |
[ 5.0% - 5.5% ] 5.24% | 687 | 46.7% |
[ 5.0% - 5.5% ] 5.41% | 666 | 47.1% |
[ 5.0% - 5.5% ] 5.44% | 7,185 | 19.7% |
[ 5.5% - 6.0% ] 5.52% | 62,419 | 25.9% |
[ 5.5% - 6.0% ] 5.73% | 20,409 | 5.5% |
[ 5.5% - 6.0% ] 5.82% | 8,104 | 23.1% |
[ 5.5% - 6.0% ] 5.84% | 5,344 | 41.1% |
[ 6.0% - 6.5% ] 6.14% | 2,718 | 54.5% |
[ 6.0% - 6.5% ] 6.20% | 44,394 | 35.2% |
[ 6.0% - 6.5% ] 6.41% | 2,217 | 20.1% |
[ 6.5% - 7.0% ] 6.74% | 11,584 | 35.8% |
[ 6.5% - 7.0% ] 6.79% | 2,753 | 10.0% |
[ 6.5% - 7.0% ] 6.90% | 464 | 44.4% |
[ 6.5% - 7.0% ] 6.99% | 8,373 | 29.7% |
[ 7.0% - 7.5% ] 7.06% | 82,314 | 33.0% |
[ 7.5% - 8.0% ] 7.50% | 2,533 | 36.2% |
[ 7.5% - 8.0% ] 7.78% | 681 | 64.3% |
[ 7.5% - 8.0% ] 7.94% | 2,910 | 31.0% |
[ 8.0% - 8.5% ] 8.14% | 467 | 42.9% |
[ 8.0% - 8.5% ] 8.22% | 11,069 | 25.3% |
[ 8.5% - 9.0% ] 8.82% | 5,309 | 2.9% |
[ 8.5% - 9.0% ] 8.90% | 2,101 | 11.6% |
[ 9.5% - 10.0% ] 9.51% | 568 | 13.4% |
[ 10.0% - 10.5% ] 10.26% | 1,277 | 59.6% |
[ 10.5% - 11.0% ] 10.89% | 303 | 30.5% |
[ 12.0% - 12.5% ] 12.39% | 1,574 | 37.1% |
[ 16.0% - 16.5% ] 16.33% | 98 | 66.2% |