Immigrants from Oceania 3 or more Vehicles in Household

COMPARE

Immigrants from Oceania
Race
Ancestry
AfghanAfricanAlaska NativeAlaskan AthabascanAlbanianAleutAlsatianAmericanApacheArabArapahoArgentineanArmenianAssyrian/Chaldean/SyriacAustralianAustrianBahamianBangladeshiBarbadianBasqueBelgianBelizeanBermudanBhutaneseBlackfeetBolivianBrazilianBritishBritish West IndianBulgarianBurmeseCajunCambodianCanadianCape VerdeanCarpatho RusynCelticCentral AmericanCentral American IndianCherokeeCheyenneChickasawChileanChineseChippewaChoctawColombianColvilleComancheCosta RicanCreeCreekCroatianCrowCubanCypriotCzechCzechoslovakianDanishDelawareDominicanDutchDutch West IndianEastern EuropeanEcuadorianEgyptianEnglishEstonianEthiopianEuropeanFijianFilipinoFinnishFrenchFrench American IndianFrench CanadianGermanGerman RussianGhanaianGreekGuamanian/ChamorroGuatemalanGuyaneseHaitianHmongHonduranHopiHoumaHungarianIcelanderIndian (Asian)IndonesianInupiatIranianIraqiIrishIroquoisIsraeliItalianJamaicanJapaneseJordanianKenyanKiowaKoreanLaotianLatvianLebaneseLiberianLithuanianLumbeeLuxembourgerMacedonianMalaysianMalteseMarshalleseMenomineeMexicanMexican American IndianMongolianMoroccanNative HawaiianNavajoNepaleseNew ZealanderNicaraguanNigerianNorthern EuropeanNorwegianOkinawanOsageOttawaPaiutePakistaniPalestinianPanamanianParaguayanPennsylvania GermanPeruvianPimaPolishPortuguesePotawatomiPuebloPuerto RicanPuget Sound SalishRomanianRussianSalvadoranSamoanScandinavianScotch-IrishScottishSeminoleSenegaleseSerbianShoshoneSierra LeoneanSiouxSlavicSlovakSloveneSomaliSouth AfricanSouth AmericanSouth American IndianSoviet UnionSpaniardSpanishSpanish AmericanSpanish American IndianSri LankanSubsaharan AfricanSudaneseSwedishSwissSyrianTaiwaneseThaiTlingit-HaidaTohono O'OdhamTonganTrinidadian and TobagonianTsimshianTurkishU.S. Virgin IslanderUgandanUkrainianUruguayanUteVenezuelanVietnameseWelshWest IndianYakamaYaquiYugoslavianYumanYup'ikZimbabwean
Immigration
NonimmigrantsImmigrantsAfghanistanAfricaAlbaniaArgentinaArmeniaAsiaAustraliaAustriaBahamasBangladeshBarbadosBelarusBelgiumBelizeBoliviaBosnia and HerzegovinaBrazilBulgariaBurma/MyanmarCabo VerdeCambodiaCameroonCanadaCaribbeanCentral AmericaChileChinaColombiaCongoCosta RicaCroatiaCubaCzechoslovakiaDenmarkDominicaDominican RepublicEastern AfricaEastern AsiaEastern EuropeEcuadorEgyptEl SalvadorEnglandEritreaEthiopiaEuropeFijiFranceGermanyGhanaGreeceGrenadaGuatemalaGuyanaHaitiHondurasHong KongHungaryIndiaIndonesiaIranIraqIrelandIsraelItalyJamaicaJapanJordanKazakhstanKenyaKoreaKuwaitLaosLatin AmericaLatviaLebanonLiberiaLithuaniaMalaysiaMexicoMicronesiaMiddle AfricaMoldovaMoroccoNepalNetherlandsNicaraguaNigeriaNorth AmericaNorth MacedoniaNorthern AfricaNorthern EuropeNorwayOceaniaPakistanPanamaPeruPhilippinesPolandPortugalRomaniaRussiaSaudi ArabiaScotlandSenegalSerbiaSierra LeoneSingaporeSomaliaSouth AfricaSouth AmericaSouth Central AsiaSouth Eastern AsiaSouthern EuropeSpainSri LankaSt. Vincent and the GrenadinesSudanSwedenSwitzerlandSyriaTaiwanThailandTrinidad and TobagoTurkeyUgandaUkraineUruguayUzbekistanVenezuelaVietnamWest IndiesWestern AfricaWestern AsiaWestern EuropeYemenZaireZimbabweAzores
Select to Compare
Race
Ancestry
AfghanAfricanAlaska NativeAlaskan AthabascanAlbanianAleutAlsatianAmericanApacheArabArapahoArgentineanArmenianAssyrian/Chaldean/SyriacAustralianAustrianBahamianBangladeshiBarbadianBasqueBelgianBelizeanBermudanBhutaneseBlackfeetBolivianBrazilianBritishBritish West IndianBulgarianBurmeseCajunCambodianCanadianCape VerdeanCarpatho RusynCelticCentral AmericanCentral American IndianCherokeeCheyenneChickasawChileanChineseChippewaChoctawColombianColvilleComancheCosta RicanCreeCreekCroatianCrowCubanCypriotCzechCzechoslovakianDanishDelawareDominicanDutchDutch West IndianEastern EuropeanEcuadorianEgyptianEnglishEstonianEthiopianEuropeanFijianFilipinoFinnishFrenchFrench American IndianFrench CanadianGermanGerman RussianGhanaianGreekGuamanian/ChamorroGuatemalanGuyaneseHaitianHmongHonduranHopiHoumaHungarianIcelanderIndian (Asian)IndonesianInupiatIranianIraqiIrishIroquoisIsraeliItalianJamaicanJapaneseJordanianKenyanKiowaKoreanLaotianLatvianLebaneseLiberianLithuanianLumbeeLuxembourgerMacedonianMalaysianMalteseMarshalleseMenomineeMexicanMexican American IndianMongolianMoroccanNative HawaiianNavajoNepaleseNew ZealanderNicaraguanNigerianNorthern EuropeanNorwegianOkinawanOsageOttawaPaiutePakistaniPalestinianPanamanianParaguayanPennsylvania GermanPeruvianPimaPolishPortuguesePotawatomiPuebloPuerto RicanPuget Sound SalishRomanianRussianSalvadoranSamoanScandinavianScotch-IrishScottishSeminoleSenegaleseSerbianShoshoneSierra LeoneanSiouxSlavicSlovakSloveneSomaliSouth AfricanSouth AmericanSouth American IndianSoviet UnionSpaniardSpanishSpanish AmericanSpanish American IndianSri LankanSubsaharan AfricanSudaneseSwedishSwissSyrianTaiwaneseThaiTlingit-HaidaTohono O'OdhamTonganTrinidadian and TobagonianTsimshianTurkishU.S. Virgin IslanderUgandanUkrainianUruguayanUteVenezuelanVietnameseWelshWest IndianYakamaYaquiYugoslavianYumanYup'ikZimbabwean
Immigration
NonimmigrantsImmigrantsAfghanistanAfricaAlbaniaArgentinaArmeniaAsiaAustraliaAustriaBahamasBangladeshBarbadosBelarusBelgiumBelizeBoliviaBosnia and HerzegovinaBrazilBulgariaBurma/MyanmarCabo VerdeCambodiaCameroonCanadaCaribbeanCentral AmericaChileChinaColombiaCongoCosta RicaCroatiaCubaCzechoslovakiaDenmarkDominicaDominican RepublicEastern AfricaEastern AsiaEastern EuropeEcuadorEgyptEl SalvadorEnglandEritreaEthiopiaEuropeFijiFranceGermanyGhanaGreeceGrenadaGuatemalaGuyanaHaitiHondurasHong KongHungaryIndiaIndonesiaIranIraqIrelandIsraelItalyJamaicaJapanJordanKazakhstanKenyaKoreaKuwaitLaosLatin AmericaLatviaLebanonLiberiaLithuaniaMalaysiaMexicoMicronesiaMiddle AfricaMoldovaMoroccoNepalNetherlandsNicaraguaNigeriaNorth AmericaNorth MacedoniaNorthern AfricaNorthern EuropeNorwayPakistanPanamaPeruPhilippinesPolandPortugalRomaniaRussiaSaudi ArabiaScotlandSenegalSerbiaSierra LeoneSingaporeSomaliaSouth AfricaSouth AmericaSouth Central AsiaSouth Eastern AsiaSouthern EuropeSpainSri LankaSt. Vincent and the GrenadinesSudanSwedenSwitzerlandSyriaTaiwanThailandTrinidad and TobagoTurkeyUgandaUkraineUruguayUzbekistanVenezuelaVietnamWest IndiesWestern AfricaWestern AsiaWestern EuropeYemenZaireZimbabweAzores
3 or more Vehicles in Household
Income
Poverty
Unemployment
Labor Participation
Family Structure
Vehicle Availability
Education Level
Disability

Immigrants from Oceania 3 or more Vehicles in Household
Exceptional

21.8%
3+ VEHICLES AVAILABLE
99.8/ 100
METRIC RATING
74th/ 347
METRIC RANK

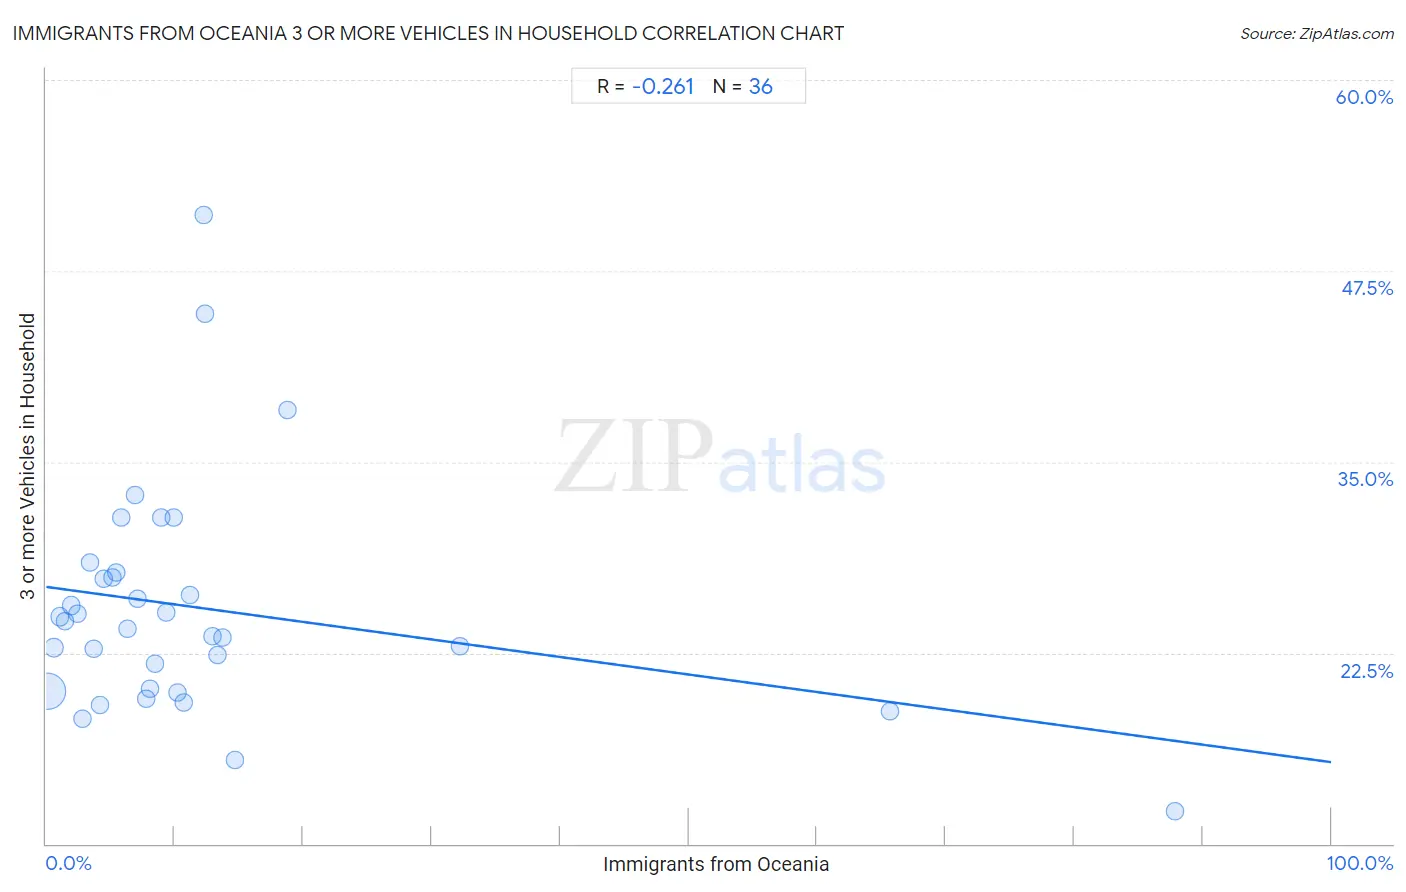
Immigrants from Oceania 3 or more Vehicles in Household Correlation Chart

The statistical analysis conducted on geographies consisting of 305,272,843 people shows a weak negative correlation between the proportion of Immigrants from Oceania and percentage of households with 3 or more vehicles available in the United States with a correlation coefficient (R) of -0.261 and weighted average of 21.8%. On average, for every 1% (one percent) increase in Immigrants from Oceania within a typical geography, there is a decrease of 0.11% in percentage of households with 3 or more vehicles available.
Immigrants from Oceania 3 or more Vehicles in Household
It is essential to understand that the correlation between the percentage of Immigrants from Oceania and percentage of households with 3 or more vehicles available does not imply a direct cause-and-effect relationship. It remains uncertain whether the presence of Immigrants from Oceania influences an upward or downward trend in the level of percentage of households with 3 or more vehicles available within an area, or if Immigrants from Oceania simply ended up residing in those areas with higher or lower levels of percentage of households with 3 or more vehicles available due to other factors.

Demographics Similar to Immigrants from Oceania by 3 or more Vehicles in Household

In terms of 3 or more vehicles in household, the demographic groups most similar to Immigrants from Oceania are Salvadoran (21.8%, a difference of 0.020%), Japanese (21.8%, a difference of 0.10%), Portuguese (21.8%, a difference of 0.11%), Nonimmigrants (21.8%, a difference of 0.15%), and Irish (21.8%, a difference of 0.22%).
DemographicsRating | Rank3 or more Vehicles in Household
Alaskan Athabascans
99.9
/100
|
#67
Exceptional
21.9%
British
99.9
/100
|
#68
Exceptional
21.9%
Creek
99.9
/100
|
#69
Exceptional
21.9%
Bangladeshis
99.8
/100
|
#70
Exceptional
21.9%
Potawatomi
99.8
/100
|
#71
Exceptional
21.9%
Portuguese
99.8
/100
|
#72
Exceptional
21.8%
Salvadorans
99.8
/100
|
#73
Exceptional
21.8%
Immigrants from Oceania
99.8
/100
|
#74
Exceptional
21.8%
Japanese
99.8
/100
|
#75
Exceptional
21.8%
Nonimmigrants
99.8
/100
|
#76
Exceptional
21.8%
Irish
99.8
/100
|
#77
Exceptional
21.8%
Czechoslovakians
99.8
/100
|
#78
Exceptional
21.7%
Assyrians/Chaldeans/Syriacs
99.8
/100
|
#79
Exceptional
21.7%
Afghans
99.7
/100
|
#80
Exceptional
21.7%
Celtics
99.7
/100
|
#81
Exceptional
21.7%

Immigrants from Oceania 3 or more Vehicles in Household Correlation Summary

MeasurementImmigrants from Oceania Data3 or more Vehicles in Household Data
Minimum0.11%12.2%
Maximum87.8%51.2%
Range87.7%39.0%
Mean12.0%25.4%
Median7.9%24.3%
Interquartile 25% (IQ1)3.9%20.1%
Interquartile 75% (IQ3)12.3%27.6%
Interquartile Range (IQR)8.4%7.6%
Standard Deviation (Sample)17.3%7.6%
Standard Deviation (Population)17.0%7.5%

Correlation Details

Immigrants from Oceania PercentileSample Size3 or more Vehicles in Household
[
0.0%
-
0.5%
]
0.11%
281,161,01120.0%
[
0.5%
-
1.0%
]
0.60%
14,156,67022.8%
[
1.0%
-
1.5%
]
1.06%
4,767,15624.9%
[
1.0%
-
1.5%
]
1.49%
2,237,74924.6%
[
1.5%
-
2.0%
]
1.97%
808,88025.6%
[
2.0%
-
2.5%
]
2.42%
510,69725.0%
[
2.5%
-
3.0%
]
2.84%
635,76018.2%
[
3.0%
-
3.5%
]
3.36%
184,13128.5%
[
3.5%
-
4.0%
]
3.65%
261,84622.8%
[
4.0%
-
4.5%
]
4.16%
83,22719.1%
[
4.0%
-
4.5%
]
4.50%
81,30327.4%
[
5.0%
-
5.5%
]
5.17%
208,93727.5%
[
5.0%
-
5.5%
]
5.43%
42,81427.8%
[
5.5%
-
6.0%
]
5.88%
4,28631.4%
[
6.0%
-
6.5%
]
6.32%
6,90124.1%
[
6.5%
-
7.0%
]
6.94%
5,78132.8%
[
7.0%
-
7.5%
]
7.12%
63,45526.0%
[
7.5%
-
8.0%
]
7.82%
15,34219.5%
[
8.0%
-
8.5%
]
8.06%
6,60220.1%
[
8.0%
-
8.5%
]
8.45%
5,22121.8%
[
8.5%
-
9.0%
]
8.97%
62431.3%
[
9.0%
-
9.5%
]
9.32%
71925.2%
[
9.5%
-
10.0%
]
9.89%
2,17431.4%
[
10.0%
-
10.5%
]
10.25%
4,18519.9%
[
10.5%
-
11.0%
]
10.67%
1,05919.2%
[
11.0%
-
11.5%
]
11.19%
1,85826.3%
[
12.0%
-
12.5%
]
12.28%
17151.2%
[
12.0%
-
12.5%
]
12.33%
7344.7%
[
12.5%
-
13.0%
]
12.94%
7,23623.6%
[
13.0%
-
13.5%
]
13.36%
5,41122.3%
[
13.5%
-
14.0%
]
13.73%
10223.5%
[
14.5%
-
15.0%
]
14.65%
19815.5%
[
18.5%
-
19.0%
]
18.76%
69338.4%
[
32.0%
-
32.5%
]
32.16%
39823.0%
[
65.5%
-
66.0%
]
65.66%
9918.7%
[
87.5%
-
88.0%
]
87.84%
7412.2%