Immigrants from Mexico GED/Equivalency
COMPARE
Immigrants from Mexico
Select to Compare
GED/Equivalency
Immigrants from Mexico GED/Equivalency
75.7%
GED/EQUIVALENCY
0.0/ 100
METRIC RATING
345th/ 347
METRIC RANK
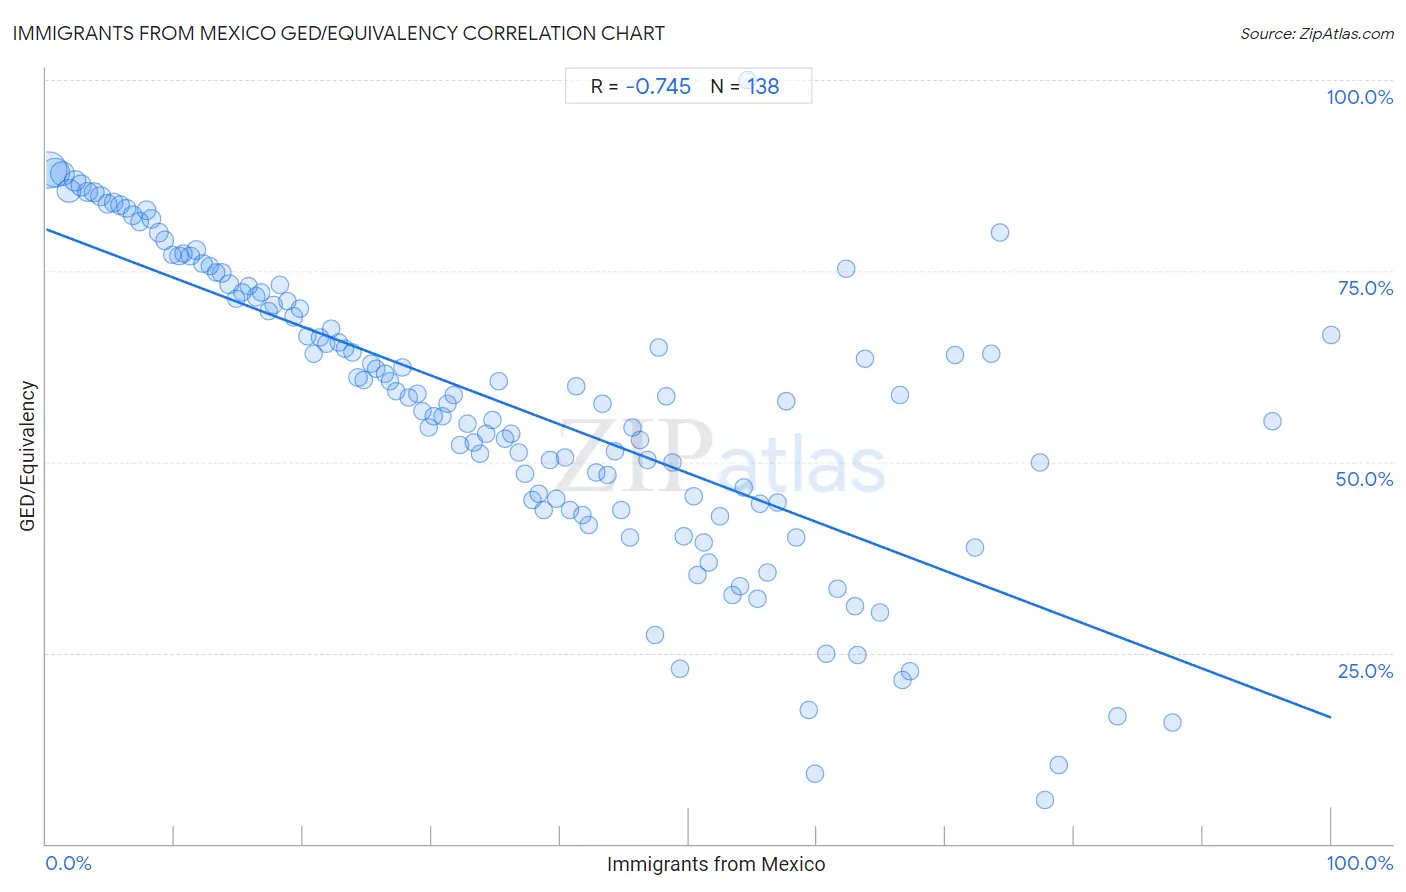
Immigrants from Mexico GED/Equivalency Correlation Chart
The statistical analysis conducted on geographies consisting of 513,765,067 people shows a strong negative correlation between the proportion of Immigrants from Mexico and percentage of population with at least ged/equivalency education in the United States with a correlation coefficient (R) of -0.745 and weighted average of 75.7%. On average, for every 1% (one percent) increase in Immigrants from Mexico within a typical geography, there is a decrease of 0.64% in percentage of population with at least ged/equivalency education.
It is essential to understand that the correlation between the percentage of Immigrants from Mexico and percentage of population with at least ged/equivalency education does not imply a direct cause-and-effect relationship. It remains uncertain whether the presence of Immigrants from Mexico influences an upward or downward trend in the level of percentage of population with at least ged/equivalency education within an area, or if Immigrants from Mexico simply ended up residing in those areas with higher or lower levels of percentage of population with at least ged/equivalency education due to other factors.
Demographics Similar to Immigrants from Mexico by GED/Equivalency
In terms of ged/equivalency, the demographic groups most similar to Immigrants from Mexico are Spanish American Indian (76.3%, a difference of 0.89%), Immigrants from Central America (76.4%, a difference of 0.92%), Houma (75.0%, a difference of 0.94%), Pima (76.4%, a difference of 1.0%), and Yakama (74.5%, a difference of 1.6%).
| Demographics | Rating | Rank | GED/Equivalency |
| Salvadorans | 0.0 /100 | #333 | Tragic 78.6% |
| Guatemalans | 0.0 /100 | #334 | Tragic 78.5% |
| Immigrants from Latin America | 0.0 /100 | #335 | Tragic 78.5% |
| Immigrants from Dominican Republic | 0.0 /100 | #336 | Tragic 78.0% |
| Immigrants from Yemen | 0.0 /100 | #337 | Tragic 77.9% |
| Immigrants from Guatemala | 0.0 /100 | #338 | Tragic 77.9% |
| Immigrants from El Salvador | 0.0 /100 | #339 | Tragic 77.6% |
| Tohono O'odham | 0.0 /100 | #340 | Tragic 77.5% |
| Mexicans | 0.0 /100 | #341 | Tragic 77.4% |
| Pima | 0.0 /100 | #342 | Tragic 76.4% |
| Immigrants from Central America | 0.0 /100 | #343 | Tragic 76.4% |
| Spanish American Indians | 0.0 /100 | #344 | Tragic 76.3% |
| Immigrants from Mexico | 0.0 /100 | #345 | Tragic 75.7% |
| Houma | 0.0 /100 | #346 | Tragic 75.0% |
| Yakama | 0.0 /100 | #347 | Tragic 74.5% |
Immigrants from Mexico GED/Equivalency Correlation Summary
| Measurement | Immigrants from Mexico Data | GED/Equivalency Data |
| Minimum | 0.24% | 5.7% |
| Maximum | 100.0% | 100.0% |
| Range | 99.8% | 94.3% |
| Mean | 36.0% | 57.5% |
| Median | 34.5% | 58.6% |
| Interquartile 25% (IQ1) | 17.3% | 45.0% |
| Interquartile 75% (IQ3) | 51.5% | 72.2% |
| Interquartile Range (IQR) | 34.3% | 27.3% |
| Standard Deviation (Sample) | 22.6% | 19.4% |
| Standard Deviation (Population) | 22.5% | 19.4% |
Correlation Details
| Immigrants from Mexico Percentile | Sample Size | GED/Equivalency |
[ 0.0% - 0.5% ] 0.24% | 134,311,714 | 88.2% |
[ 0.5% - 1.0% ] 0.73% | 77,724,769 | 87.9% |
[ 1.0% - 1.5% ] 1.22% | 46,354,353 | 87.7% |
[ 1.5% - 2.0% ] 1.77% | 41,512,103 | 85.5% |
[ 2.0% - 2.5% ] 2.24% | 24,184,941 | 86.8% |
[ 2.5% - 3.0% ] 2.75% | 19,719,389 | 86.2% |
[ 3.0% - 3.5% ] 3.24% | 16,605,647 | 85.3% |
[ 3.5% - 4.0% ] 3.73% | 11,389,743 | 85.3% |
[ 4.0% - 4.5% ] 4.23% | 9,992,042 | 84.8% |
[ 4.5% - 5.0% ] 4.74% | 8,678,242 | 83.7% |
[ 5.0% - 5.5% ] 5.22% | 9,160,012 | 83.9% |
[ 5.5% - 6.0% ] 5.75% | 7,641,284 | 83.7% |
[ 6.0% - 6.5% ] 6.23% | 6,276,953 | 83.2% |
[ 6.5% - 7.0% ] 6.75% | 5,838,775 | 82.2% |
[ 7.0% - 7.5% ] 7.27% | 4,495,897 | 81.5% |
[ 7.5% - 8.0% ] 7.82% | 5,464,638 | 83.0% |
[ 8.0% - 8.5% ] 8.20% | 7,145,923 | 81.8% |
[ 8.5% - 9.0% ] 8.79% | 7,202,996 | 80.0% |
[ 9.0% - 9.5% ] 9.21% | 3,881,224 | 79.0% |
[ 9.5% - 10.0% ] 9.79% | 2,649,317 | 77.1% |
[ 10.0% - 10.5% ] 10.32% | 4,579,091 | 77.0% |
[ 10.5% - 11.0% ] 10.71% | 2,728,460 | 77.2% |
[ 11.0% - 11.5% ] 11.23% | 3,318,187 | 76.9% |
[ 11.5% - 12.0% ] 11.69% | 8,267,010 | 77.7% |
[ 12.0% - 12.5% ] 12.20% | 2,803,797 | 76.0% |
[ 12.5% - 13.0% ] 12.73% | 2,233,551 | 75.7% |
[ 13.0% - 13.5% ] 13.26% | 1,679,319 | 74.9% |
[ 13.5% - 14.0% ] 13.65% | 2,729,440 | 74.7% |
[ 14.0% - 14.5% ] 14.23% | 2,406,695 | 73.3% |
[ 14.5% - 15.0% ] 14.76% | 1,576,675 | 71.3% |
[ 15.0% - 15.5% ] 15.28% | 1,806,065 | 72.2% |
[ 15.5% - 16.0% ] 15.74% | 1,480,211 | 73.0% |
[ 16.0% - 16.5% ] 16.30% | 1,611,832 | 71.6% |
[ 16.5% - 17.0% ] 16.73% | 2,376,047 | 72.1% |
[ 17.0% - 17.5% ] 17.28% | 1,369,348 | 69.8% |
[ 17.5% - 18.0% ] 17.73% | 1,145,978 | 70.6% |
[ 18.0% - 18.5% ] 18.21% | 1,139,202 | 73.2% |
[ 18.5% - 19.0% ] 18.74% | 1,261,219 | 71.0% |
[ 19.0% - 19.5% ] 19.24% | 748,762 | 69.0% |
[ 19.5% - 20.0% ] 19.77% | 1,847,679 | 70.1% |
[ 20.0% - 20.5% ] 20.29% | 1,050,528 | 66.4% |
[ 20.5% - 21.0% ] 20.78% | 585,764 | 64.2% |
[ 21.0% - 21.5% ] 21.30% | 830,210 | 66.3% |
[ 21.5% - 22.0% ] 21.75% | 676,791 | 65.5% |
[ 22.0% - 22.5% ] 22.21% | 735,183 | 67.4% |
[ 22.5% - 23.0% ] 22.75% | 896,714 | 65.7% |
[ 23.0% - 23.5% ] 23.27% | 1,169,951 | 64.9% |
[ 23.5% - 24.0% ] 23.79% | 602,070 | 64.3% |
[ 24.0% - 24.5% ] 24.27% | 463,085 | 61.1% |
[ 24.5% - 25.0% ] 24.72% | 329,806 | 60.7% |
[ 25.0% - 25.5% ] 25.30% | 715,305 | 62.8% |
[ 25.5% - 26.0% ] 25.69% | 673,805 | 62.2% |
[ 26.0% - 26.5% ] 26.35% | 335,554 | 61.5% |
[ 26.5% - 27.0% ] 26.78% | 527,961 | 60.6% |
[ 27.0% - 27.5% ] 27.22% | 727,586 | 59.3% |
[ 27.5% - 28.0% ] 27.70% | 468,186 | 62.4% |
[ 28.0% - 28.5% ] 28.20% | 383,598 | 58.5% |
[ 28.5% - 29.0% ] 28.85% | 699,148 | 58.9% |
[ 29.0% - 29.5% ] 29.24% | 777,952 | 56.6% |
[ 29.5% - 30.0% ] 29.72% | 264,656 | 54.5% |
[ 30.0% - 30.5% ] 30.14% | 283,570 | 56.0% |
[ 30.5% - 31.0% ] 30.80% | 271,477 | 55.9% |
[ 31.0% - 31.5% ] 31.26% | 134,230 | 57.6% |
[ 31.5% - 32.0% ] 31.74% | 263,123 | 58.7% |
[ 32.0% - 32.5% ] 32.20% | 189,445 | 52.3% |
[ 32.5% - 33.0% ] 32.81% | 537,815 | 55.0% |
[ 33.0% - 33.5% ] 33.22% | 128,125 | 52.5% |
[ 33.5% - 34.0% ] 33.72% | 51,606 | 51.0% |
[ 34.0% - 34.5% ] 34.26% | 239,833 | 53.7% |
[ 34.5% - 35.0% ] 34.76% | 403,710 | 55.5% |
[ 35.0% - 35.5% ] 35.19% | 60,102 | 60.6% |
[ 35.5% - 36.0% ] 35.66% | 9,846 | 53.1% |
[ 36.0% - 36.5% ] 36.21% | 82,578 | 53.7% |
[ 36.5% - 37.0% ] 36.73% | 51,841 | 51.3% |
[ 37.0% - 37.5% ] 37.26% | 5,920 | 48.4% |
[ 37.5% - 38.0% ] 37.86% | 43,338 | 45.0% |
[ 38.0% - 38.5% ] 38.29% | 93,778 | 45.8% |
[ 38.5% - 39.0% ] 38.70% | 9,867 | 43.7% |
[ 39.0% - 39.5% ] 39.22% | 116,740 | 50.3% |
[ 39.5% - 40.0% ] 39.72% | 56,013 | 45.1% |
[ 40.0% - 40.5% ] 40.35% | 8,337 | 50.6% |
[ 40.5% - 41.0% ] 40.79% | 98,502 | 43.7% |
[ 41.0% - 41.5% ] 41.27% | 82,355 | 59.8% |
[ 41.5% - 42.0% ] 41.74% | 4,332 | 43.1% |
[ 42.0% - 42.5% ] 42.22% | 14,497 | 41.8% |
[ 42.5% - 43.0% ] 42.83% | 31,892 | 48.7% |
[ 43.0% - 43.5% ] 43.31% | 28,942 | 57.6% |
[ 43.5% - 44.0% ] 43.68% | 6,262 | 48.2% |
[ 44.0% - 44.5% ] 44.29% | 63,429 | 51.4% |
[ 44.5% - 45.0% ] 44.71% | 4,974 | 43.7% |
[ 45.0% - 45.5% ] 45.40% | 23,736 | 40.1% |
[ 45.5% - 46.0% ] 45.58% | 29,650 | 54.4% |
[ 46.0% - 46.5% ] 46.16% | 1,575 | 52.9% |
[ 46.5% - 47.0% ] 46.78% | 9,560 | 50.3% |
[ 47.0% - 47.5% ] 47.36% | 6,710 | 27.4% |
[ 47.5% - 48.0% ] 47.62% | 504 | 65.0% |
[ 48.0% - 48.5% ] 48.26% | 1,061 | 58.5% |
[ 48.5% - 49.0% ] 48.71% | 10,108 | 50.0% |
[ 49.0% - 49.5% ] 49.30% | 1,150 | 23.0% |
[ 49.5% - 50.0% ] 49.61% | 3,241 | 40.2% |
[ 50.0% - 50.5% ] 50.37% | 3,480 | 45.5% |
[ 50.5% - 51.0% ] 50.68% | 1,543 | 35.1% |
[ 51.0% - 51.5% ] 51.16% | 2,416 | 39.5% |
[ 51.5% - 52.0% ] 51.53% | 1,238 | 36.8% |
[ 52.0% - 52.5% ] 52.40% | 1,540 | 42.8% |
[ 53.0% - 53.5% ] 53.45% | 3,422 | 32.6% |
[ 53.5% - 54.0% ] 53.99% | 9,970 | 33.8% |
[ 54.0% - 54.5% ] 54.31% | 1,414 | 46.7% |
[ 54.5% - 55.0% ] 54.55% | 132 | 100.0% |
[ 55.0% - 55.5% ] 55.33% | 13,346 | 32.1% |
[ 55.5% - 56.0% ] 55.56% | 9 | 44.4% |
[ 56.0% - 56.5% ] 56.14% | 1,532 | 35.5% |
[ 56.5% - 57.0% ] 56.94% | 497 | 44.6% |
[ 57.5% - 58.0% ] 57.58% | 1,023 | 57.9% |
[ 58.0% - 58.5% ] 58.35% | 922 | 40.1% |
[ 59.0% - 59.5% ] 59.29% | 113 | 17.6% |
[ 59.5% - 60.0% ] 59.83% | 117 | 9.1% |
[ 60.5% - 61.0% ] 60.71% | 425 | 24.9% |
[ 61.5% - 62.0% ] 61.59% | 164 | 33.5% |
[ 62.0% - 62.5% ] 62.25% | 347 | 75.2% |
[ 62.5% - 63.0% ] 62.93% | 1,748 | 31.1% |
[ 63.0% - 63.5% ] 63.13% | 358 | 24.7% |
[ 63.5% - 64.0% ] 63.71% | 248 | 63.5% |
[ 64.5% - 65.0% ] 64.85% | 1,101 | 30.2% |
[ 66.0% - 66.5% ] 66.47% | 173 | 58.8% |
[ 66.5% - 67.0% ] 66.67% | 114 | 21.4% |
[ 67.0% - 67.5% ] 67.19% | 128 | 22.5% |
[ 70.5% - 71.0% ] 70.71% | 140 | 63.9% |
[ 72.0% - 72.5% ] 72.32% | 289 | 38.7% |
[ 73.5% - 74.0% ] 73.58% | 53 | 64.2% |
[ 74.0% - 74.5% ] 74.19% | 31 | 80.0% |
[ 77.0% - 77.5% ] 77.38% | 84 | 50.0% |
[ 77.5% - 78.0% ] 77.68% | 112 | 5.7% |
[ 78.5% - 79.0% ] 78.79% | 33 | 10.3% |
[ 83.0% - 83.5% ] 83.33% | 72 | 16.7% |
[ 87.5% - 88.0% ] 87.63% | 97 | 16.0% |
[ 95.0% - 95.5% ] 95.43% | 197 | 55.3% |
[ 99.5% - 100.0% ] 100.00% | 282 | 66.7% |