Immigrants from Mexico vs Polish Married-Couple Family Poverty
COMPARE
Immigrants from Mexico
Polish
Married-Couple Family Poverty
Married-Couple Family Poverty Comparison
Immigrants from Mexico
Poles
7.6%
MARRIED-COUPLE FAMILY POVERTY
0.0/ 100
METRIC RATING
328th/ 347
METRIC RANK
4.0%
MARRIED-COUPLE FAMILY POVERTY
100.0/ 100
METRIC RATING
15th/ 347
METRIC RANK
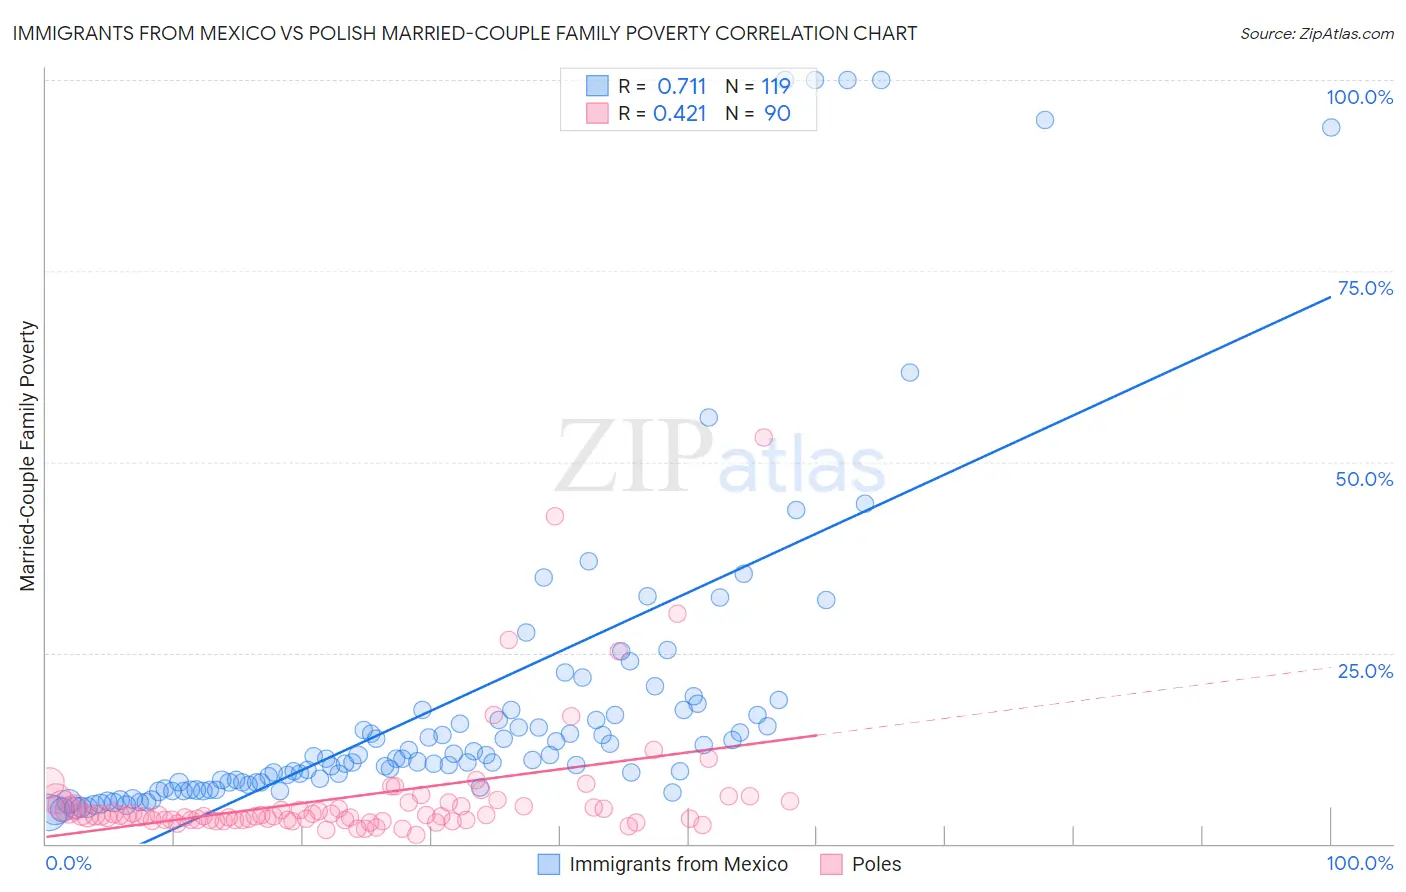
Immigrants from Mexico vs Polish Married-Couple Family Poverty Correlation Chart
The statistical analysis conducted on geographies consisting of 506,470,232 people shows a strong positive correlation between the proportion of Immigrants from Mexico and poverty level among married-couple families in the United States with a correlation coefficient (R) of 0.711 and weighted average of 7.6%. Similarly, the statistical analysis conducted on geographies consisting of 546,544,798 people shows a moderate positive correlation between the proportion of Poles and poverty level among married-couple families in the United States with a correlation coefficient (R) of 0.421 and weighted average of 4.0%, a difference of 88.3%.
Married-Couple Family Poverty Correlation Summary
| Measurement | Immigrants from Mexico | Polish |
| Minimum | 4.1% | 1.1% |
| Maximum | 100.0% | 53.2% |
| Range | 95.9% | 52.1% |
| Mean | 18.1% | 6.2% |
| Median | 11.1% | 3.7% |
| Interquartile 25% (IQ1) | 7.8% | 3.1% |
| Interquartile 75% (IQ3) | 16.8% | 5.4% |
| Interquartile Range (IQR) | 9.1% | 2.3% |
| Standard Deviation (Sample) | 21.0% | 8.1% |
| Standard Deviation (Population) | 21.0% | 8.0% |
Similar Demographics by Married-Couple Family Poverty
Demographics Similar to Immigrants from Mexico by Married-Couple Family Poverty
In terms of married-couple family poverty, the demographic groups most similar to Immigrants from Mexico are Immigrants from Bangladesh (7.5%, a difference of 1.2%), Hispanic or Latino (7.5%, a difference of 1.2%), Immigrants from Cuba (7.5%, a difference of 1.4%), Immigrants from Central America (7.4%, a difference of 2.0%), and Vietnamese (7.4%, a difference of 2.1%).
| Demographics | Rating | Rank | Married-Couple Family Poverty |
| Immigrants | Caribbean | 0.0 /100 | #321 | Tragic 7.3% |
| Immigrants | Honduras | 0.0 /100 | #322 | Tragic 7.3% |
| Vietnamese | 0.0 /100 | #323 | Tragic 7.4% |
| Immigrants | Central America | 0.0 /100 | #324 | Tragic 7.4% |
| Immigrants | Cuba | 0.0 /100 | #325 | Tragic 7.5% |
| Immigrants | Bangladesh | 0.0 /100 | #326 | Tragic 7.5% |
| Hispanics or Latinos | 0.0 /100 | #327 | Tragic 7.5% |
| Immigrants | Mexico | 0.0 /100 | #328 | Tragic 7.6% |
| Natives/Alaskans | 0.0 /100 | #329 | Tragic 8.2% |
| Paiute | 0.0 /100 | #330 | Tragic 8.3% |
| Central American Indians | 0.0 /100 | #331 | Tragic 8.3% |
| Dominicans | 0.0 /100 | #332 | Tragic 8.3% |
| Lumbee | 0.0 /100 | #333 | Tragic 8.3% |
| Immigrants | Dominican Republic | 0.0 /100 | #334 | Tragic 8.4% |
| Sioux | 0.0 /100 | #335 | Tragic 8.7% |
Demographics Similar to Poles by Married-Couple Family Poverty
In terms of married-couple family poverty, the demographic groups most similar to Poles are Slovak (4.0%, a difference of 0.030%), Czech (4.0%, a difference of 0.070%), German (4.0%, a difference of 0.27%), Filipino (4.0%, a difference of 0.30%), and Italian (4.0%, a difference of 0.31%).
| Demographics | Rating | Rank | Married-Couple Family Poverty |
| Thais | 100.0 /100 | #8 | Exceptional 3.9% |
| Croatians | 100.0 /100 | #9 | Exceptional 3.9% |
| Carpatho Rusyns | 100.0 /100 | #10 | Exceptional 3.9% |
| Lithuanians | 100.0 /100 | #11 | Exceptional 4.0% |
| Bulgarians | 100.0 /100 | #12 | Exceptional 4.0% |
| Czechs | 100.0 /100 | #13 | Exceptional 4.0% |
| Slovaks | 100.0 /100 | #14 | Exceptional 4.0% |
| Poles | 100.0 /100 | #15 | Exceptional 4.0% |
| Germans | 100.0 /100 | #16 | Exceptional 4.0% |
| Filipinos | 100.0 /100 | #17 | Exceptional 4.0% |
| Italians | 100.0 /100 | #18 | Exceptional 4.0% |
| Immigrants | Ireland | 99.9 /100 | #19 | Exceptional 4.1% |
| Maltese | 99.9 /100 | #20 | Exceptional 4.1% |
| Zimbabweans | 99.9 /100 | #21 | Exceptional 4.1% |
| Immigrants | Singapore | 99.9 /100 | #22 | Exceptional 4.1% |