Immigrants from Mexico Self-Care Disability
COMPARE
Immigrants from Mexico
Select to Compare
Self-Care Disability
Immigrants from Mexico Self-Care Disability
2.7%
SELF-CARE DISABILITY
0.1/ 100
METRIC RATING
268th/ 347
METRIC RANK
Immigrants from Mexico Self-Care Disability Correlation Chart
The statistical analysis conducted on geographies consisting of 512,428,426 people shows a moderate positive correlation between the proportion of Immigrants from Mexico and percentage of population with self-care disability in the United States with a correlation coefficient (R) of 0.413 and weighted average of 2.7%. On average, for every 1% (one percent) increase in Immigrants from Mexico within a typical geography, there is an increase of 0.056% in percentage of population with self-care disability.
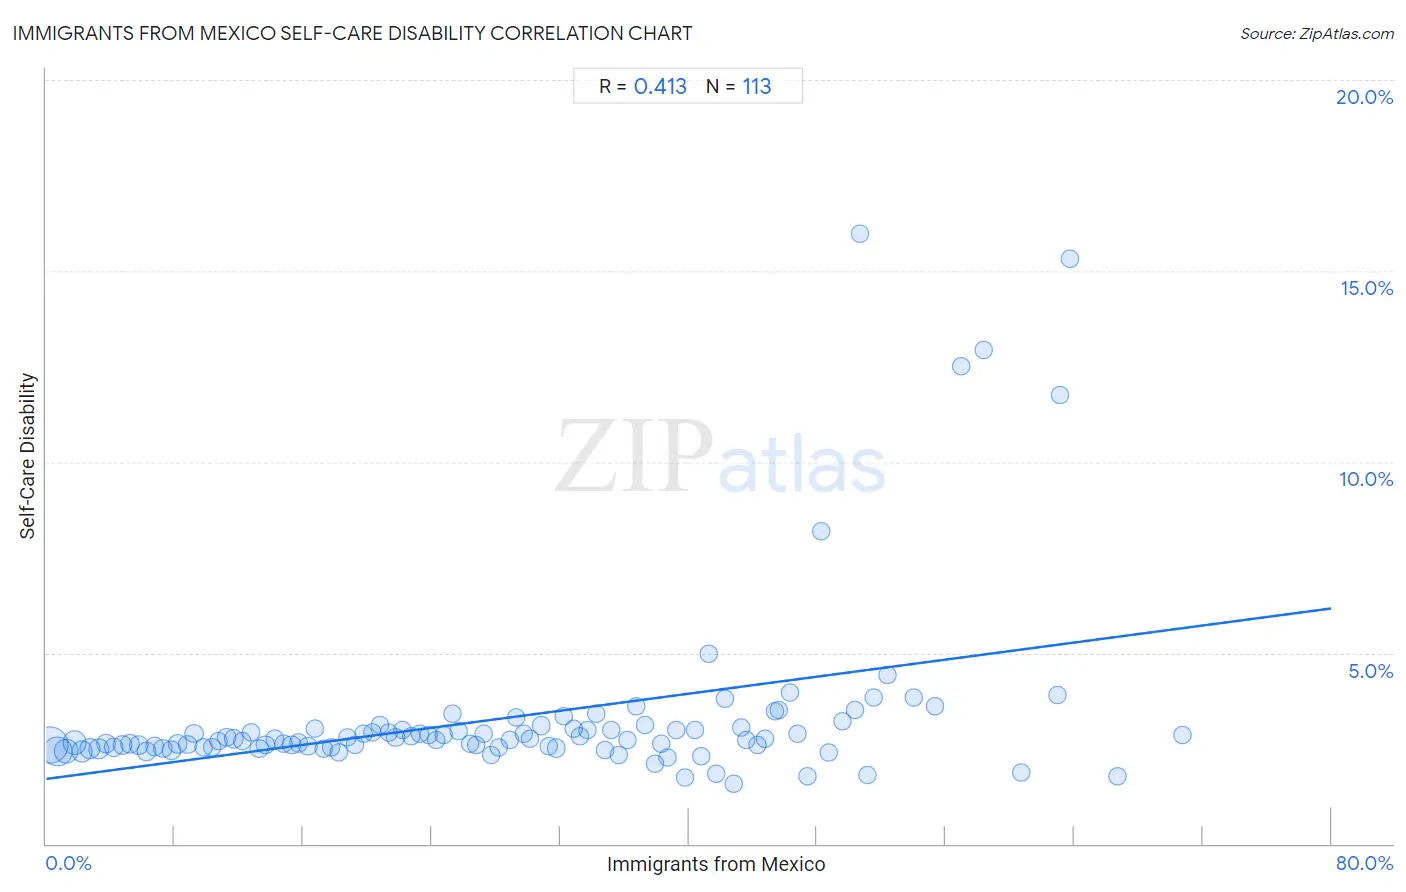
It is essential to understand that the correlation between the percentage of Immigrants from Mexico and percentage of population with self-care disability does not imply a direct cause-and-effect relationship. It remains uncertain whether the presence of Immigrants from Mexico influences an upward or downward trend in the level of percentage of population with self-care disability within an area, or if Immigrants from Mexico simply ended up residing in those areas with higher or lower levels of percentage of population with self-care disability due to other factors.
Demographics Similar to Immigrants from Mexico by Self-Care Disability
In terms of self-care disability, the demographic groups most similar to Immigrants from Mexico are Yaqui (2.7%, a difference of 0.050%), U.S. Virgin Islander (2.7%, a difference of 0.17%), Immigrants from Micronesia (2.7%, a difference of 0.21%), Immigrants from Cambodia (2.7%, a difference of 0.24%), and Trinidadian and Tobagonian (2.7%, a difference of 0.27%).
| Demographics | Rating | Rank | Self-Care Disability |
| Arapaho | 0.2 /100 | #261 | Tragic 2.6% |
| Shoshone | 0.2 /100 | #262 | Tragic 2.7% |
| Immigrants from Latin America | 0.2 /100 | #263 | Tragic 2.7% |
| Immigrants from Iran | 0.2 /100 | #264 | Tragic 2.7% |
| Immigrants from Nicaragua | 0.2 /100 | #265 | Tragic 2.7% |
| Immigrants from Cambodia | 0.1 /100 | #266 | Tragic 2.7% |
| Yaqui | 0.1 /100 | #267 | Tragic 2.7% |
| Immigrants from Mexico | 0.1 /100 | #268 | Tragic 2.7% |
| U.S. Virgin Islanders | 0.1 /100 | #269 | Tragic 2.7% |
| Immigrants from Micronesia | 0.1 /100 | #270 | Tragic 2.7% |
| Trinidadians and Tobagonians | 0.1 /100 | #271 | Tragic 2.7% |
| Immigrants from Laos | 0.1 /100 | #272 | Tragic 2.7% |
| Mexicans | 0.1 /100 | #273 | Tragic 2.7% |
| Yakama | 0.1 /100 | #274 | Tragic 2.7% |
| Immigrants from Trinidad and Tobago | 0.1 /100 | #275 | Tragic 2.7% |
Immigrants from Mexico Self-Care Disability Correlation Summary
| Measurement | Immigrants from Mexico Data | Self-Care Disability Data |
| Minimum | 0.24% | 1.6% |
| Maximum | 70.7% | 16.0% |
| Range | 70.5% | 14.4% |
| Mean | 29.0% | 3.3% |
| Median | 28.2% | 2.7% |
| Interquartile 25% (IQ1) | 13.9% | 2.5% |
| Interquartile 75% (IQ3) | 42.5% | 3.0% |
| Interquartile Range (IQR) | 28.6% | 0.48% |
| Standard Deviation (Sample) | 17.6% | 2.4% |
| Standard Deviation (Population) | 17.5% | 2.4% |
Correlation Details
| Immigrants from Mexico Percentile | Sample Size | Self-Care Disability |
[ 0.0% - 0.5% ] 0.24% | 133,952,826 | 2.6% |
[ 0.5% - 1.0% ] 0.73% | 77,562,556 | 2.4% |
[ 1.0% - 1.5% ] 1.22% | 46,191,785 | 2.4% |
[ 1.5% - 2.0% ] 1.77% | 41,459,203 | 2.6% |
[ 2.0% - 2.5% ] 2.24% | 24,109,552 | 2.4% |
[ 2.5% - 3.0% ] 2.75% | 19,686,835 | 2.5% |
[ 3.0% - 3.5% ] 3.24% | 16,571,842 | 2.5% |
[ 3.5% - 4.0% ] 3.73% | 11,364,398 | 2.6% |
[ 4.0% - 4.5% ] 4.23% | 9,962,262 | 2.5% |
[ 4.5% - 5.0% ] 4.74% | 8,659,590 | 2.6% |
[ 5.0% - 5.5% ] 5.22% | 9,138,188 | 2.6% |
[ 5.5% - 6.0% ] 5.75% | 7,621,442 | 2.6% |
[ 6.0% - 6.5% ] 6.23% | 6,253,115 | 2.4% |
[ 6.5% - 7.0% ] 6.75% | 5,832,531 | 2.5% |
[ 7.0% - 7.5% ] 7.27% | 4,473,414 | 2.5% |
[ 7.5% - 8.0% ] 7.82% | 5,440,463 | 2.5% |
[ 8.0% - 8.5% ] 8.20% | 7,129,789 | 2.6% |
[ 8.5% - 9.0% ] 8.79% | 7,198,035 | 2.6% |
[ 9.0% - 9.5% ] 9.21% | 3,870,534 | 2.9% |
[ 9.5% - 10.0% ] 9.79% | 2,630,371 | 2.5% |
[ 10.0% - 10.5% ] 10.32% | 4,572,599 | 2.5% |
[ 10.5% - 11.0% ] 10.71% | 2,723,791 | 2.7% |
[ 11.0% - 11.5% ] 11.23% | 3,314,434 | 2.8% |
[ 11.5% - 12.0% ] 11.69% | 8,253,029 | 2.8% |
[ 12.0% - 12.5% ] 12.20% | 2,789,771 | 2.7% |
[ 12.5% - 13.0% ] 12.73% | 2,226,392 | 2.9% |
[ 13.0% - 13.5% ] 13.26% | 1,678,672 | 2.5% |
[ 13.5% - 14.0% ] 13.65% | 2,725,491 | 2.6% |
[ 14.0% - 14.5% ] 14.23% | 2,402,704 | 2.7% |
[ 14.5% - 15.0% ] 14.76% | 1,571,619 | 2.6% |
[ 15.0% - 15.5% ] 15.28% | 1,795,571 | 2.6% |
[ 15.5% - 16.0% ] 15.74% | 1,478,484 | 2.6% |
[ 16.0% - 16.5% ] 16.30% | 1,607,989 | 2.6% |
[ 16.5% - 17.0% ] 16.73% | 2,374,396 | 3.0% |
[ 17.0% - 17.5% ] 17.28% | 1,366,676 | 2.5% |
[ 17.5% - 18.0% ] 17.73% | 1,140,943 | 2.5% |
[ 18.0% - 18.5% ] 18.21% | 1,138,666 | 2.4% |
[ 18.5% - 19.0% ] 18.73% | 1,259,820 | 2.8% |
[ 19.0% - 19.5% ] 19.24% | 747,552 | 2.6% |
[ 19.5% - 20.0% ] 19.77% | 1,844,979 | 2.9% |
[ 20.0% - 20.5% ] 20.29% | 1,047,686 | 2.9% |
[ 20.5% - 21.0% ] 20.78% | 582,303 | 3.1% |
[ 21.0% - 21.5% ] 21.30% | 824,034 | 2.9% |
[ 21.5% - 22.0% ] 21.75% | 667,208 | 2.8% |
[ 22.0% - 22.5% ] 22.21% | 728,613 | 3.0% |
[ 22.5% - 23.0% ] 22.75% | 894,715 | 2.8% |
[ 23.0% - 23.5% ] 23.27% | 1,169,002 | 2.9% |
[ 23.5% - 24.0% ] 23.79% | 600,812 | 2.9% |
[ 24.0% - 24.5% ] 24.27% | 462,409 | 2.7% |
[ 24.5% - 25.0% ] 24.72% | 326,752 | 2.9% |
[ 25.0% - 25.5% ] 25.30% | 713,707 | 3.4% |
[ 25.5% - 26.0% ] 25.69% | 670,572 | 3.0% |
[ 26.0% - 26.5% ] 26.35% | 333,440 | 2.6% |
[ 26.5% - 27.0% ] 26.78% | 526,492 | 2.6% |
[ 27.0% - 27.5% ] 27.22% | 724,342 | 2.9% |
[ 27.5% - 28.0% ] 27.70% | 464,554 | 2.3% |
[ 28.0% - 28.5% ] 28.20% | 382,623 | 2.5% |
[ 28.5% - 29.0% ] 28.85% | 698,953 | 2.7% |
[ 29.0% - 29.5% ] 29.24% | 771,207 | 3.3% |
[ 29.5% - 30.0% ] 29.72% | 263,175 | 2.9% |
[ 30.0% - 30.5% ] 30.14% | 282,533 | 2.7% |
[ 30.5% - 31.0% ] 30.79% | 270,410 | 3.1% |
[ 31.0% - 31.5% ] 31.26% | 133,824 | 2.5% |
[ 31.5% - 32.0% ] 31.74% | 262,087 | 2.5% |
[ 32.0% - 32.5% ] 32.19% | 187,555 | 3.3% |
[ 32.5% - 33.0% ] 32.81% | 536,129 | 3.0% |
[ 33.0% - 33.5% ] 33.22% | 127,873 | 2.8% |
[ 33.5% - 34.0% ] 33.71% | 50,361 | 3.0% |
[ 34.0% - 34.5% ] 34.26% | 239,486 | 3.4% |
[ 34.5% - 35.0% ] 34.76% | 402,423 | 2.5% |
[ 35.0% - 35.5% ] 35.19% | 59,412 | 3.0% |
[ 35.5% - 36.0% ] 35.66% | 8,757 | 2.3% |
[ 36.0% - 36.5% ] 36.21% | 82,170 | 2.7% |
[ 36.5% - 37.0% ] 36.73% | 51,792 | 3.6% |
[ 37.0% - 37.5% ] 37.30% | 4,327 | 3.1% |
[ 37.5% - 38.0% ] 37.86% | 43,224 | 2.1% |
[ 38.0% - 38.5% ] 38.29% | 93,203 | 2.6% |
[ 38.5% - 39.0% ] 38.67% | 7,514 | 2.3% |
[ 39.0% - 39.5% ] 39.22% | 115,942 | 3.0% |
[ 39.5% - 40.0% ] 39.73% | 42,893 | 1.7% |
[ 40.0% - 40.5% ] 40.37% | 7,669 | 3.0% |
[ 40.5% - 41.0% ] 40.79% | 97,185 | 2.3% |
[ 41.0% - 41.5% ] 41.27% | 81,050 | 5.0% |
[ 41.5% - 42.0% ] 41.73% | 3,702 | 1.8% |
[ 42.0% - 42.5% ] 42.22% | 13,176 | 3.8% |
[ 42.5% - 43.0% ] 42.83% | 31,507 | 1.6% |
[ 43.0% - 43.5% ] 43.31% | 27,188 | 3.0% |
[ 43.5% - 44.0% ] 43.58% | 3,639 | 2.7% |
[ 44.0% - 44.5% ] 44.29% | 63,316 | 2.6% |
[ 44.5% - 45.0% ] 44.73% | 4,552 | 2.7% |
[ 45.0% - 45.5% ] 45.40% | 23,551 | 3.5% |
[ 45.5% - 46.0% ] 45.57% | 28,609 | 3.5% |
[ 46.0% - 46.5% ] 46.28% | 430 | 4.0% |
[ 46.5% - 47.0% ] 46.79% | 8,963 | 2.9% |
[ 47.0% - 47.5% ] 47.36% | 6,676 | 1.8% |
[ 48.0% - 48.5% ] 48.26% | 1,061 | 8.2% |
[ 48.5% - 49.0% ] 48.71% | 10,108 | 2.4% |
[ 49.5% - 50.0% ] 49.59% | 3,017 | 3.2% |
[ 50.0% - 50.5% ] 50.37% | 3,480 | 3.5% |
[ 50.5% - 51.0% ] 50.67% | 1,352 | 16.0% |
[ 51.0% - 51.5% ] 51.16% | 2,416 | 1.8% |
[ 51.5% - 52.0% ] 51.53% | 1,238 | 3.8% |
[ 52.0% - 52.5% ] 52.40% | 1,540 | 4.4% |
[ 53.5% - 54.0% ] 53.99% | 9,362 | 3.8% |
[ 55.0% - 55.5% ] 55.33% | 13,279 | 3.6% |
[ 56.5% - 57.0% ] 56.94% | 497 | 12.5% |
[ 58.0% - 58.5% ] 58.38% | 185 | 12.9% |
[ 60.5% - 61.0% ] 60.71% | 425 | 1.9% |
[ 62.5% - 63.0% ] 62.93% | 1,570 | 3.9% |
[ 63.0% - 63.5% ] 63.13% | 358 | 11.7% |
[ 63.5% - 64.0% ] 63.71% | 248 | 15.3% |
[ 66.5% - 67.0% ] 66.67% | 114 | 1.8% |
[ 70.5% - 71.0% ] 70.71% | 140 | 2.9% |