Immigrants from Mexico Wage/Income Gap
COMPARE
Immigrants from Mexico
Select to Compare
Wage/Income Gap
Immigrants from Mexico Wage/Income Gap
25.3%
WAGE/INCOME GAP
76.4/ 100
METRIC RATING
156th/ 347
METRIC RANK
Immigrants from Mexico Wage/Income Gap Correlation Chart
The statistical analysis conducted on geographies consisting of 512,302,630 people shows a mild positive correlation between the proportion of Immigrants from Mexico and wage/income gap percentage in the United States with a correlation coefficient (R) of 0.310 and weighted average of 25.3%. On average, for every 1% (one percent) increase in Immigrants from Mexico within a typical geography, there is an increase of 0.15% in wage/income gap percentage.
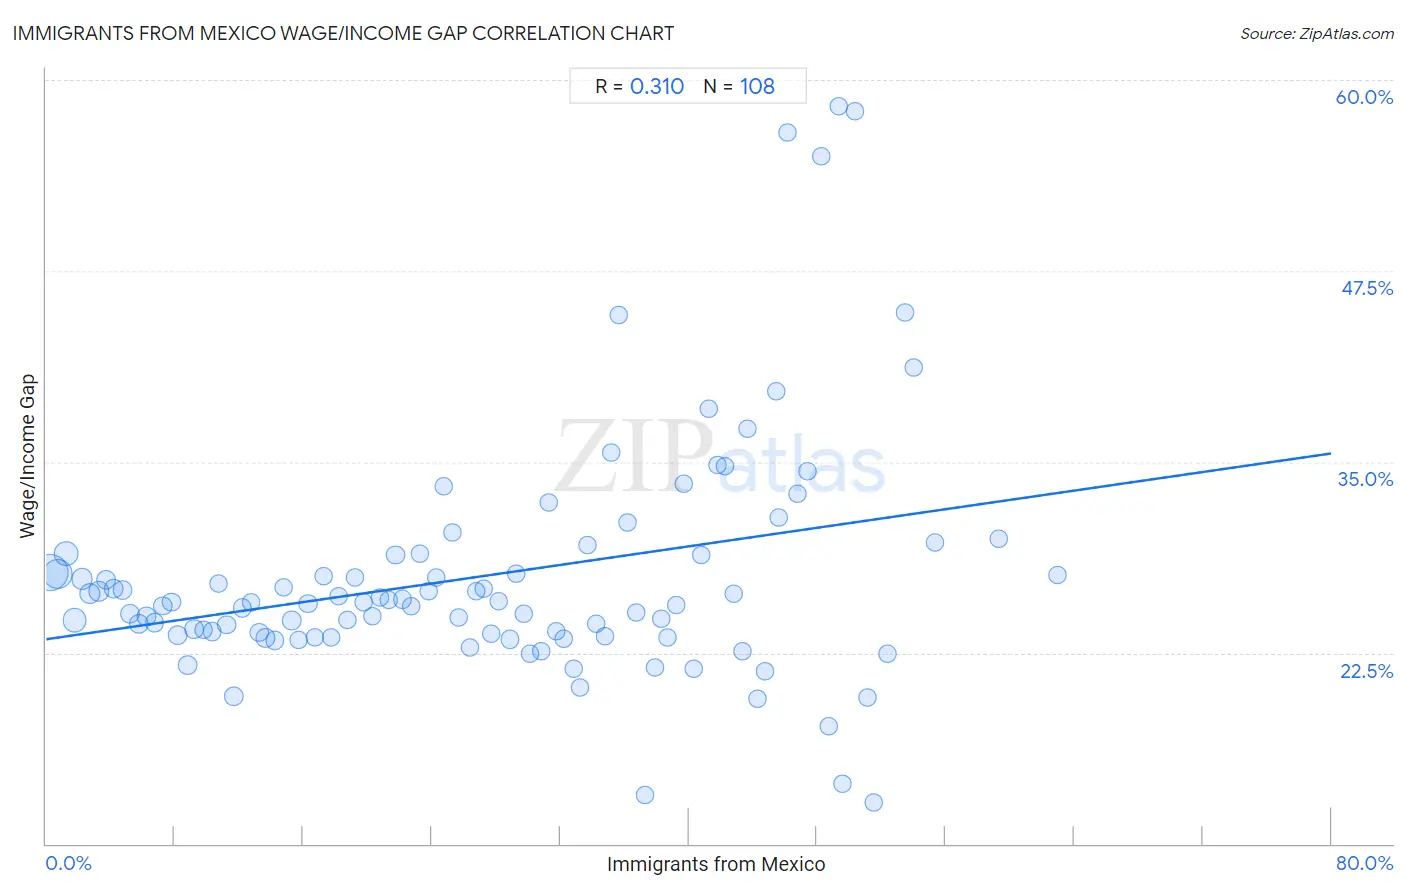
It is essential to understand that the correlation between the percentage of Immigrants from Mexico and wage/income gap percentage does not imply a direct cause-and-effect relationship. It remains uncertain whether the presence of Immigrants from Mexico influences an upward or downward trend in the level of wage/income gap percentage within an area, or if Immigrants from Mexico simply ended up residing in those areas with higher or lower levels of wage/income gap percentage due to other factors.
Demographics Similar to Immigrants from Mexico by Wage/Income Gap
In terms of wage/income gap, the demographic groups most similar to Immigrants from Mexico are Costa Rican (25.3%, a difference of 0.060%), Immigrants from Vietnam (25.2%, a difference of 0.12%), Blackfeet (25.2%, a difference of 0.16%), Immigrants from Northern Africa (25.2%, a difference of 0.16%), and Immigrants from Zimbabwe (25.3%, a difference of 0.24%).
| Demographics | Rating | Rank | Wage/Income Gap |
| Immigrants from Peru | 82.6 /100 | #149 | Excellent 25.1% |
| Immigrants | 82.3 /100 | #150 | Excellent 25.1% |
| Taiwanese | 81.6 /100 | #151 | Excellent 25.1% |
| Uruguayans | 81.3 /100 | #152 | Excellent 25.2% |
| Blackfeet | 78.1 /100 | #153 | Good 25.2% |
| Immigrants from Northern Africa | 78.1 /100 | #154 | Good 25.2% |
| Immigrants from Vietnam | 77.7 /100 | #155 | Good 25.2% |
| Immigrants from Mexico | 76.4 /100 | #156 | Good 25.3% |
| Costa Ricans | 75.8 /100 | #157 | Good 25.3% |
| Immigrants from Zimbabwe | 73.7 /100 | #158 | Good 25.3% |
| Puget Sound Salish | 73.0 /100 | #159 | Good 25.3% |
| French American Indians | 72.5 /100 | #160 | Good 25.4% |
| Albanians | 69.4 /100 | #161 | Good 25.4% |
| Shoshone | 69.0 /100 | #162 | Good 25.4% |
| Native Hawaiians | 69.0 /100 | #163 | Good 25.4% |
Immigrants from Mexico Wage/Income Gap Correlation Summary
| Measurement | Immigrants from Mexico Data | Wage/Income Gap Data |
| Minimum | 0.24% | 12.7% |
| Maximum | 62.9% | 58.3% |
| Range | 62.7% | 45.6% |
| Mean | 27.2% | 27.5% |
| Median | 27.0% | 25.8% |
| Interquartile 25% (IQ1) | 13.5% | 23.6% |
| Interquartile 75% (IQ3) | 40.6% | 28.9% |
| Interquartile Range (IQR) | 27.1% | 5.3% |
| Standard Deviation (Sample) | 16.1% | 7.9% |
| Standard Deviation (Population) | 16.0% | 7.9% |
Correlation Details
| Immigrants from Mexico Percentile | Sample Size | Wage/Income Gap |
[ 0.0% - 0.5% ] 0.24% | 134,096,465 | 27.7% |
[ 0.5% - 1.0% ] 0.73% | 77,561,728 | 27.7% |
[ 1.0% - 1.5% ] 1.22% | 46,204,820 | 29.0% |
[ 1.5% - 2.0% ] 1.77% | 41,410,426 | 24.6% |
[ 2.0% - 2.5% ] 2.24% | 24,099,364 | 27.3% |
[ 2.5% - 3.0% ] 2.75% | 19,660,283 | 26.3% |
[ 3.0% - 3.5% ] 3.24% | 16,548,217 | 26.5% |
[ 3.5% - 4.0% ] 3.73% | 11,342,873 | 27.3% |
[ 4.0% - 4.5% ] 4.23% | 9,960,144 | 26.7% |
[ 4.5% - 5.0% ] 4.74% | 8,629,109 | 26.6% |
[ 5.0% - 5.5% ] 5.22% | 9,125,332 | 25.1% |
[ 5.5% - 6.0% ] 5.75% | 7,610,330 | 24.4% |
[ 6.0% - 6.5% ] 6.23% | 6,257,510 | 24.9% |
[ 6.5% - 7.0% ] 6.75% | 5,818,685 | 24.5% |
[ 7.0% - 7.5% ] 7.27% | 4,466,313 | 25.6% |
[ 7.5% - 8.0% ] 7.82% | 5,447,208 | 25.8% |
[ 8.0% - 8.5% ] 8.20% | 7,131,153 | 23.6% |
[ 8.5% - 9.0% ] 8.79% | 7,190,376 | 21.7% |
[ 9.0% - 9.5% ] 9.21% | 3,868,181 | 24.0% |
[ 9.5% - 10.0% ] 9.79% | 2,632,462 | 24.0% |
[ 10.0% - 10.5% ] 10.32% | 4,565,298 | 23.9% |
[ 10.5% - 11.0% ] 10.71% | 2,716,329 | 27.1% |
[ 11.0% - 11.5% ] 11.23% | 3,313,754 | 24.3% |
[ 11.5% - 12.0% ] 11.69% | 8,258,802 | 19.7% |
[ 12.0% - 12.5% ] 12.20% | 2,787,168 | 25.4% |
[ 12.5% - 13.0% ] 12.73% | 2,226,737 | 25.8% |
[ 13.0% - 13.5% ] 13.26% | 1,672,361 | 23.8% |
[ 13.5% - 14.0% ] 13.65% | 2,717,074 | 23.5% |
[ 14.0% - 14.5% ] 14.23% | 2,392,148 | 23.3% |
[ 14.5% - 15.0% ] 14.76% | 1,567,926 | 26.8% |
[ 15.0% - 15.5% ] 15.28% | 1,800,113 | 24.6% |
[ 15.5% - 16.0% ] 15.74% | 1,476,814 | 23.4% |
[ 16.0% - 16.5% ] 16.30% | 1,608,851 | 25.7% |
[ 16.5% - 17.0% ] 16.73% | 2,368,901 | 23.5% |
[ 17.0% - 17.5% ] 17.28% | 1,362,210 | 27.5% |
[ 17.5% - 18.0% ] 17.73% | 1,137,433 | 23.5% |
[ 18.0% - 18.5% ] 18.21% | 1,135,932 | 26.2% |
[ 18.5% - 19.0% ] 18.73% | 1,255,704 | 24.6% |
[ 19.0% - 19.5% ] 19.24% | 743,645 | 27.4% |
[ 19.5% - 20.0% ] 19.77% | 1,842,851 | 25.8% |
[ 20.0% - 20.5% ] 20.29% | 1,047,735 | 24.9% |
[ 20.5% - 21.0% ] 20.78% | 583,438 | 26.1% |
[ 21.0% - 21.5% ] 21.30% | 827,279 | 26.0% |
[ 21.5% - 22.0% ] 21.75% | 673,112 | 28.9% |
[ 22.0% - 22.5% ] 22.21% | 726,288 | 26.0% |
[ 22.5% - 23.0% ] 22.75% | 893,945 | 25.6% |
[ 23.0% - 23.5% ] 23.27% | 1,167,752 | 29.0% |
[ 23.5% - 24.0% ] 23.79% | 599,023 | 26.5% |
[ 24.0% - 24.5% ] 24.27% | 461,687 | 27.5% |
[ 24.5% - 25.0% ] 24.72% | 323,864 | 33.4% |
[ 25.0% - 25.5% ] 25.30% | 713,475 | 30.4% |
[ 25.5% - 26.0% ] 25.69% | 673,079 | 24.8% |
[ 26.0% - 26.5% ] 26.35% | 332,434 | 22.9% |
[ 26.5% - 27.0% ] 26.78% | 518,464 | 26.5% |
[ 27.0% - 27.5% ] 27.22% | 726,019 | 26.7% |
[ 27.5% - 28.0% ] 27.70% | 464,878 | 23.7% |
[ 28.0% - 28.5% ] 28.20% | 381,999 | 25.8% |
[ 28.5% - 29.0% ] 28.85% | 692,936 | 23.4% |
[ 29.0% - 29.5% ] 29.24% | 777,589 | 27.7% |
[ 29.5% - 30.0% ] 29.72% | 262,499 | 25.0% |
[ 30.0% - 30.5% ] 30.14% | 282,878 | 22.5% |
[ 30.5% - 31.0% ] 30.79% | 270,708 | 22.6% |
[ 31.0% - 31.5% ] 31.26% | 132,816 | 32.4% |
[ 31.5% - 32.0% ] 31.73% | 255,262 | 23.9% |
[ 32.0% - 32.5% ] 32.19% | 186,244 | 23.4% |
[ 32.5% - 33.0% ] 32.81% | 536,722 | 21.4% |
[ 33.0% - 33.5% ] 33.22% | 127,873 | 20.3% |
[ 33.5% - 34.0% ] 33.71% | 49,832 | 29.6% |
[ 34.0% - 34.5% ] 34.26% | 239,335 | 24.4% |
[ 34.5% - 35.0% ] 34.76% | 401,030 | 23.6% |
[ 35.0% - 35.5% ] 35.19% | 58,530 | 35.6% |
[ 35.5% - 36.0% ] 35.66% | 8,757 | 44.6% |
[ 36.0% - 36.5% ] 36.21% | 82,170 | 31.0% |
[ 36.5% - 37.0% ] 36.73% | 51,792 | 25.2% |
[ 37.0% - 37.5% ] 37.29% | 5,125 | 13.2% |
[ 37.5% - 38.0% ] 37.87% | 41,135 | 21.5% |
[ 38.0% - 38.5% ] 38.31% | 88,424 | 24.7% |
[ 38.5% - 39.0% ] 38.65% | 7,474 | 23.5% |
[ 39.0% - 39.5% ] 39.22% | 115,716 | 25.7% |
[ 39.5% - 40.0% ] 39.71% | 52,942 | 33.6% |
[ 40.0% - 40.5% ] 40.32% | 6,585 | 21.4% |
[ 40.5% - 41.0% ] 40.79% | 97,185 | 28.9% |
[ 41.0% - 41.5% ] 41.27% | 81,403 | 38.5% |
[ 41.5% - 42.0% ] 41.78% | 2,159 | 34.8% |
[ 42.0% - 42.5% ] 42.23% | 14,188 | 34.7% |
[ 42.5% - 43.0% ] 42.84% | 31,316 | 26.3% |
[ 43.0% - 43.5% ] 43.31% | 28,942 | 22.6% |
[ 43.5% - 44.0% ] 43.66% | 5,483 | 37.1% |
[ 44.0% - 44.5% ] 44.29% | 62,244 | 19.5% |
[ 44.5% - 45.0% ] 44.73% | 4,552 | 21.3% |
[ 45.0% - 45.5% ] 45.41% | 21,892 | 39.7% |
[ 45.5% - 46.0% ] 45.57% | 29,477 | 31.4% |
[ 46.0% - 46.5% ] 46.17% | 1,369 | 56.5% |
[ 46.5% - 47.0% ] 46.81% | 6,251 | 32.9% |
[ 47.0% - 47.5% ] 47.36% | 6,676 | 34.4% |
[ 48.0% - 48.5% ] 48.26% | 1,061 | 55.0% |
[ 48.5% - 49.0% ] 48.71% | 10,034 | 17.7% |
[ 49.0% - 49.5% ] 49.33% | 892 | 58.3% |
[ 49.5% - 50.0% ] 49.57% | 2,223 | 13.9% |
[ 50.0% - 50.5% ] 50.37% | 3,480 | 57.9% |
[ 51.0% - 51.5% ] 51.16% | 2,416 | 19.6% |
[ 51.5% - 52.0% ] 51.51% | 860 | 12.7% |
[ 52.0% - 52.5% ] 52.40% | 1,540 | 22.4% |
[ 53.0% - 53.5% ] 53.49% | 2,610 | 44.8% |
[ 53.5% - 54.0% ] 53.99% | 9,362 | 41.2% |
[ 55.0% - 55.5% ] 55.33% | 13,279 | 29.7% |
[ 59.0% - 59.5% ] 59.29% | 113 | 30.0% |
[ 62.5% - 63.0% ] 62.93% | 1,748 | 27.6% |