Immigrants from Europe vs Immigrants from Laos Married-Couple Family Poverty

COMPARE

Immigrants from Europe
Race
Ancestry
AfghanAfricanAlaska NativeAlaskan AthabascanAlbanianAleutAlsatianAmericanApacheArabArapahoArgentineanArmenianAssyrian/Chaldean/SyriacAustralianAustrianBahamianBangladeshiBarbadianBasqueBelgianBelizeanBermudanBhutaneseBlackfeetBolivianBrazilianBritishBritish West IndianBulgarianBurmeseCajunCambodianCanadianCape VerdeanCarpatho RusynCelticCentral AmericanCentral American IndianCherokeeCheyenneChickasawChileanChineseChippewaChoctawColombianColvilleComancheCosta RicanCreeCreekCroatianCrowCubanCypriotCzechCzechoslovakianDanishDelawareDominicanDutchDutch West IndianEastern EuropeanEcuadorianEgyptianEnglishEstonianEthiopianEuropeanFijianFilipinoFinnishFrenchFrench American IndianFrench CanadianGermanGerman RussianGhanaianGreekGuamanian/ChamorroGuatemalanGuyaneseHaitianHmongHonduranHopiHoumaHungarianIcelanderIndian (Asian)IndonesianInupiatIranianIraqiIrishIroquoisIsraeliItalianJamaicanJapaneseJordanianKenyanKiowaKoreanLaotianLatvianLebaneseLiberianLithuanianLumbeeLuxembourgerMacedonianMalaysianMalteseMarshalleseMenomineeMexicanMexican American IndianMongolianMoroccanNative HawaiianNavajoNepaleseNew ZealanderNicaraguanNigerianNorthern EuropeanNorwegianOkinawanOsageOttawaPaiutePakistaniPalestinianPanamanianParaguayanPennsylvania GermanPeruvianPimaPolishPortuguesePotawatomiPuebloPuerto RicanPuget Sound SalishRomanianRussianSalvadoranSamoanScandinavianScotch-IrishScottishSeminoleSenegaleseSerbianShoshoneSierra LeoneanSiouxSlavicSlovakSloveneSomaliSouth AfricanSouth AmericanSouth American IndianSoviet UnionSpaniardSpanishSpanish AmericanSpanish American IndianSri LankanSubsaharan AfricanSudaneseSwedishSwissSyrianTaiwaneseThaiTlingit-HaidaTohono O'OdhamTonganTrinidadian and TobagonianTsimshianTurkishU.S. Virgin IslanderUgandanUkrainianUruguayanUteVenezuelanVietnameseWelshWest IndianYakamaYaquiYugoslavianYumanYup'ikZimbabwean
Immigration
NonimmigrantsImmigrantsAfghanistanAfricaAlbaniaArgentinaArmeniaAsiaAustraliaAustriaBahamasBangladeshBarbadosBelarusBelgiumBelizeBoliviaBosnia and HerzegovinaBrazilBulgariaBurma/MyanmarCabo VerdeCambodiaCameroonCanadaCaribbeanCentral AmericaChileChinaColombiaCongoCosta RicaCroatiaCubaCzechoslovakiaDenmarkDominicaDominican RepublicEastern AfricaEastern AsiaEastern EuropeEcuadorEgyptEl SalvadorEnglandEritreaEthiopiaEuropeFijiFranceGermanyGhanaGreeceGrenadaGuatemalaGuyanaHaitiHondurasHong KongHungaryIndiaIndonesiaIranIraqIrelandIsraelItalyJamaicaJapanJordanKazakhstanKenyaKoreaKuwaitLatin AmericaLatviaLebanonLiberiaLithuaniaMalaysiaMexicoMicronesiaMiddle AfricaMoldovaMoroccoNepalNetherlandsNicaraguaNigeriaNorth AmericaNorth MacedoniaNorthern AfricaNorthern EuropeNorwayOceaniaPakistanPanamaPeruPhilippinesPolandPortugalRomaniaRussiaSaudi ArabiaScotlandSenegalSerbiaSierra LeoneSingaporeSomaliaSouth AfricaSouth AmericaSouth Central AsiaSouth Eastern AsiaSouthern EuropeSpainSri LankaSt. Vincent and the GrenadinesSudanSwedenSwitzerlandSyriaTaiwanThailandTrinidad and TobagoTurkeyUgandaUkraineUruguayUzbekistanVenezuelaVietnamWest IndiesWestern AfricaWestern AsiaWestern EuropeYemenZaireZimbabweAzores
Immigrants from Laos
Race
Ancestry
AfghanAfricanAlaska NativeAlaskan AthabascanAlbanianAleutAlsatianAmericanApacheArabArapahoArgentineanArmenianAssyrian/Chaldean/SyriacAustralianAustrianBahamianBangladeshiBarbadianBasqueBelgianBelizeanBermudanBhutaneseBlackfeetBolivianBrazilianBritishBritish West IndianBulgarianBurmeseCajunCambodianCanadianCape VerdeanCarpatho RusynCelticCentral AmericanCentral American IndianCherokeeCheyenneChickasawChileanChineseChippewaChoctawColombianColvilleComancheCosta RicanCreeCreekCroatianCrowCubanCypriotCzechCzechoslovakianDanishDelawareDominicanDutchDutch West IndianEastern EuropeanEcuadorianEgyptianEnglishEstonianEthiopianEuropeanFijianFilipinoFinnishFrenchFrench American IndianFrench CanadianGermanGerman RussianGhanaianGreekGuamanian/ChamorroGuatemalanGuyaneseHaitianHmongHonduranHopiHoumaHungarianIcelanderIndian (Asian)IndonesianInupiatIranianIraqiIrishIroquoisIsraeliItalianJamaicanJapaneseJordanianKenyanKiowaKoreanLaotianLatvianLebaneseLiberianLithuanianLumbeeLuxembourgerMacedonianMalaysianMalteseMarshalleseMenomineeMexicanMexican American IndianMongolianMoroccanNative HawaiianNavajoNepaleseNew ZealanderNicaraguanNigerianNorthern EuropeanNorwegianOkinawanOsageOttawaPaiutePakistaniPalestinianPanamanianParaguayanPennsylvania GermanPeruvianPimaPolishPortuguesePotawatomiPuebloPuerto RicanPuget Sound SalishRomanianRussianSalvadoranSamoanScandinavianScotch-IrishScottishSeminoleSenegaleseSerbianShoshoneSierra LeoneanSiouxSlavicSlovakSloveneSomaliSouth AfricanSouth AmericanSouth American IndianSoviet UnionSpaniardSpanishSpanish AmericanSpanish American IndianSri LankanSubsaharan AfricanSudaneseSwedishSwissSyrianTaiwaneseThaiTlingit-HaidaTohono O'OdhamTonganTrinidadian and TobagonianTsimshianTurkishU.S. Virgin IslanderUgandanUkrainianUruguayanUteVenezuelanVietnameseWelshWest IndianYakamaYaquiYugoslavianYumanYup'ikZimbabwean
Immigration
NonimmigrantsImmigrantsAfghanistanAfricaAlbaniaArgentinaArmeniaAsiaAustraliaAustriaBahamasBangladeshBarbadosBelarusBelgiumBelizeBoliviaBosnia and HerzegovinaBrazilBulgariaBurma/MyanmarCabo VerdeCambodiaCameroonCanadaCaribbeanCentral AmericaChileChinaColombiaCongoCosta RicaCroatiaCubaCzechoslovakiaDenmarkDominicaDominican RepublicEastern AfricaEastern AsiaEastern EuropeEcuadorEgyptEl SalvadorEnglandEritreaEthiopiaFijiFranceGermanyGhanaGreeceGrenadaGuatemalaGuyanaHaitiHondurasHong KongHungaryIndiaIndonesiaIranIraqIrelandIsraelItalyJamaicaJapanJordanKazakhstanKenyaKoreaKuwaitLaosLatin AmericaLatviaLebanonLiberiaLithuaniaMalaysiaMexicoMicronesiaMiddle AfricaMoldovaMoroccoNepalNetherlandsNicaraguaNigeriaNorth AmericaNorth MacedoniaNorthern AfricaNorthern EuropeNorwayOceaniaPakistanPanamaPeruPhilippinesPolandPortugalRomaniaRussiaSaudi ArabiaScotlandSenegalSerbiaSierra LeoneSingaporeSomaliaSouth AfricaSouth AmericaSouth Central AsiaSouth Eastern AsiaSouthern EuropeSpainSri LankaSt. Vincent and the GrenadinesSudanSwedenSwitzerlandSyriaTaiwanThailandTrinidad and TobagoTurkeyUgandaUkraineUruguayUzbekistanVenezuelaVietnamWest IndiesWestern AfricaWestern AsiaWestern EuropeYemenZaireZimbabweAzores
Married-Couple Family Poverty
Income
Poverty
Unemployment
Labor Participation
Family Structure
Vehicle Availability
Education Level
Disability

Married-Couple Family Poverty Comparison

Immigrants from Europe

Immigrants from Laos

Exceptional
Tragic
4.6%
MARRIED-COUPLE FAMILY POVERTY
97.9/ 100
METRIC RATING
99th/ 347
METRIC RANK
5.7%
MARRIED-COUPLE FAMILY POVERTY
4.4/ 100
METRIC RATING
232nd/ 347
METRIC RANK

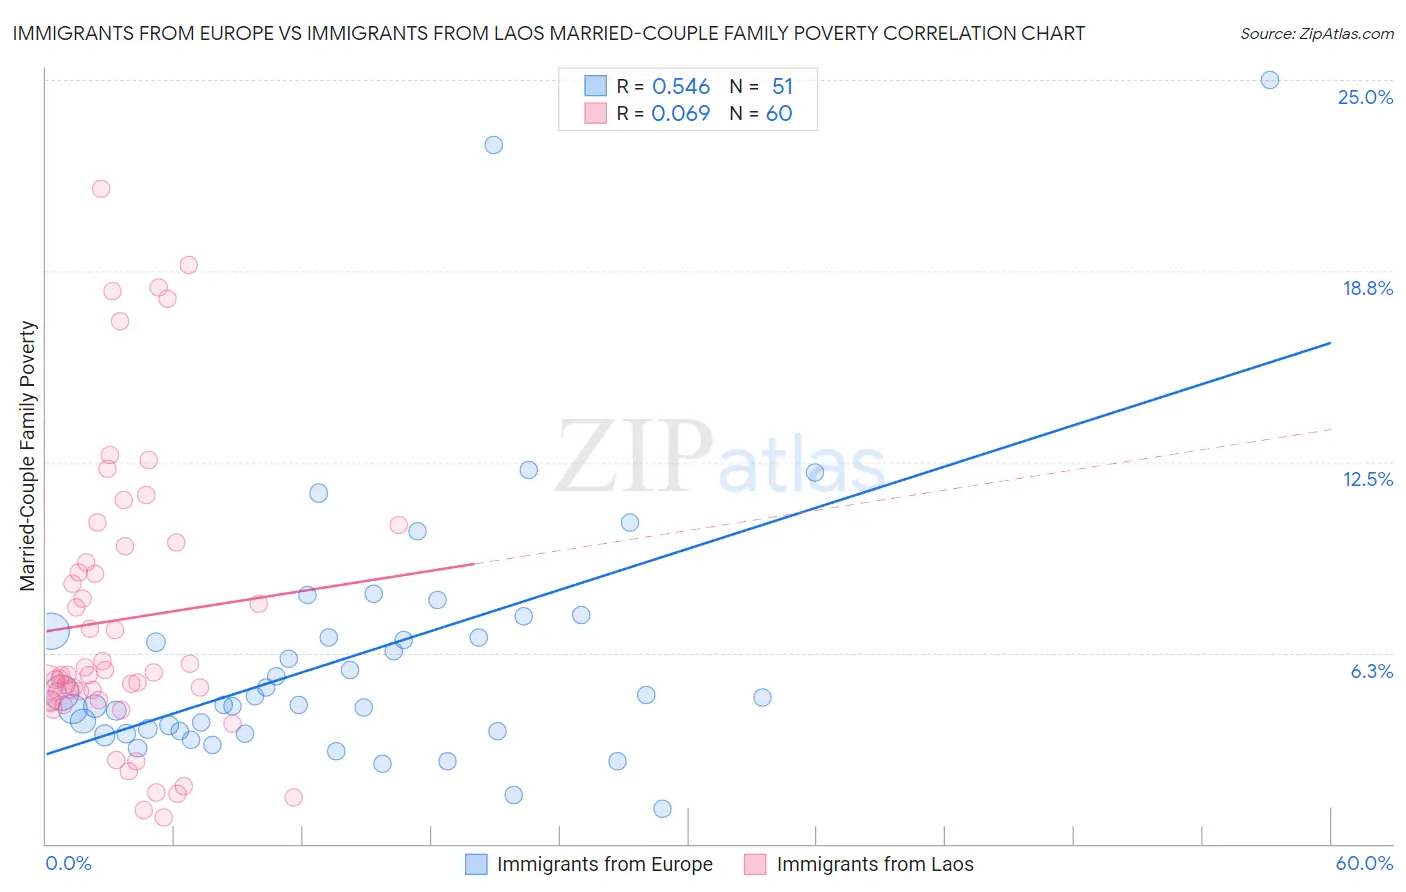
Immigrants from Europe vs Immigrants from Laos Married-Couple Family Poverty Correlation Chart

The statistical analysis conducted on geographies consisting of 535,803,847 people shows a substantial positive correlation between the proportion of Immigrants from Europe and poverty level among married-couple families in the United States with a correlation coefficient (R) of 0.546 and weighted average of 4.6%. Similarly, the statistical analysis conducted on geographies consisting of 200,657,338 people shows a slight positive correlation between the proportion of Immigrants from Laos and poverty level among married-couple families in the United States with a correlation coefficient (R) of 0.069 and weighted average of 5.7%, a difference of 22.7%.
Immigrants from Europe vs Immigrants from Laos Married-Couple Family Poverty

Married-Couple Family Poverty Correlation Summary

MeasurementImmigrants from EuropeImmigrants from Laos
Minimum1.2%0.85%
Maximum25.0%21.4%
Range23.8%20.6%
Mean6.2%7.3%
Median4.8%5.5%
Interquartile 25% (IQ1)3.7%4.7%
Interquartile 75% (IQ3)7.0%9.5%
Interquartile Range (IQR)3.3%4.8%
Standard Deviation (Sample)4.4%4.8%
Standard Deviation (Population)4.4%4.7%

Similar Demographics by Married-Couple Family Poverty

Demographics Similar to Immigrants from Europe by Married-Couple Family Poverty

In terms of married-couple family poverty, the demographic groups most similar to Immigrants from Europe are Immigrants from Western Europe (4.6%, a difference of 0.11%), Native Hawaiian (4.6%, a difference of 0.12%), Yugoslavian (4.6%, a difference of 0.13%), Asian (4.7%, a difference of 0.53%), and Immigrants from Belgium (4.6%, a difference of 0.54%).
DemographicsRating | RankMarried-Couple Family Poverty
Immigrants | Norway
98.4
/100
|
#92
Exceptional
4.6%
Koreans
98.3
/100
|
#93
Exceptional
4.6%
Immigrants | Italy
98.3
/100
|
#94
Exceptional
4.6%
Portuguese
98.3
/100
|
#95
Exceptional
4.6%
Immigrants | Poland
98.3
/100
|
#96
Exceptional
4.6%
Immigrants | Belgium
98.2
/100
|
#97
Exceptional
4.6%
Native Hawaiians
98.0
/100
|
#98
Exceptional
4.6%
Immigrants | Europe
97.9
/100
|
#99
Exceptional
4.6%
Immigrants | Western Europe
97.9
/100
|
#100
Exceptional
4.6%
Yugoslavians
97.8
/100
|
#101
Exceptional
4.6%
Asians
97.6
/100
|
#102
Exceptional
4.7%
Immigrants | Romania
97.3
/100
|
#103
Exceptional
4.7%
Immigrants | Moldova
97.1
/100
|
#104
Exceptional
4.7%
Aleuts
97.0
/100
|
#105
Exceptional
4.7%
Immigrants | France
96.9
/100
|
#106
Exceptional
4.7%

Demographics Similar to Immigrants from Laos by Married-Couple Family Poverty

In terms of married-couple family poverty, the demographic groups most similar to Immigrants from Laos are Immigrants from Iraq (5.7%, a difference of 0.060%), Moroccan (5.7%, a difference of 0.32%), Subsaharan African (5.7%, a difference of 0.35%), Immigrants from Colombia (5.7%, a difference of 0.44%), and Immigrants from Uruguay (5.7%, a difference of 0.44%).
DemographicsRating | RankMarried-Couple Family Poverty
Immigrants | Cambodia
6.1
/100
|
#225
Tragic
5.6%
South Americans
5.7
/100
|
#226
Tragic
5.6%
Immigrants | Zaire
5.6
/100
|
#227
Tragic
5.6%
Arabs
5.4
/100
|
#228
Tragic
5.7%
Sub-Saharan Africans
4.9
/100
|
#229
Tragic
5.7%
Moroccans
4.9
/100
|
#230
Tragic
5.7%
Immigrants | Iraq
4.4
/100
|
#231
Tragic
5.7%
Immigrants | Laos
4.4
/100
|
#232
Tragic
5.7%
Immigrants | Colombia
3.7
/100
|
#233
Tragic
5.7%
Immigrants | Uruguay
3.7
/100
|
#234
Tragic
5.7%
Immigrants | Sudan
3.5
/100
|
#235
Tragic
5.7%
Ghanaians
3.3
/100
|
#236
Tragic
5.7%
Immigrants | South America
3.1
/100
|
#237
Tragic
5.7%
Cherokee
2.7
/100
|
#238
Tragic
5.8%
Venezuelans
2.7
/100
|
#239
Tragic
5.8%