Immigrants from Europe 2 or more Vehicles in Household
COMPARE
Immigrants from Europe
Select to Compare
2 or more Vehicles in Household
Immigrants from Europe 2 or more Vehicles in Household
53.2%
2+ VEHICLES AVAILABLE
2.1/ 100
METRIC RATING
240th/ 347
METRIC RANK
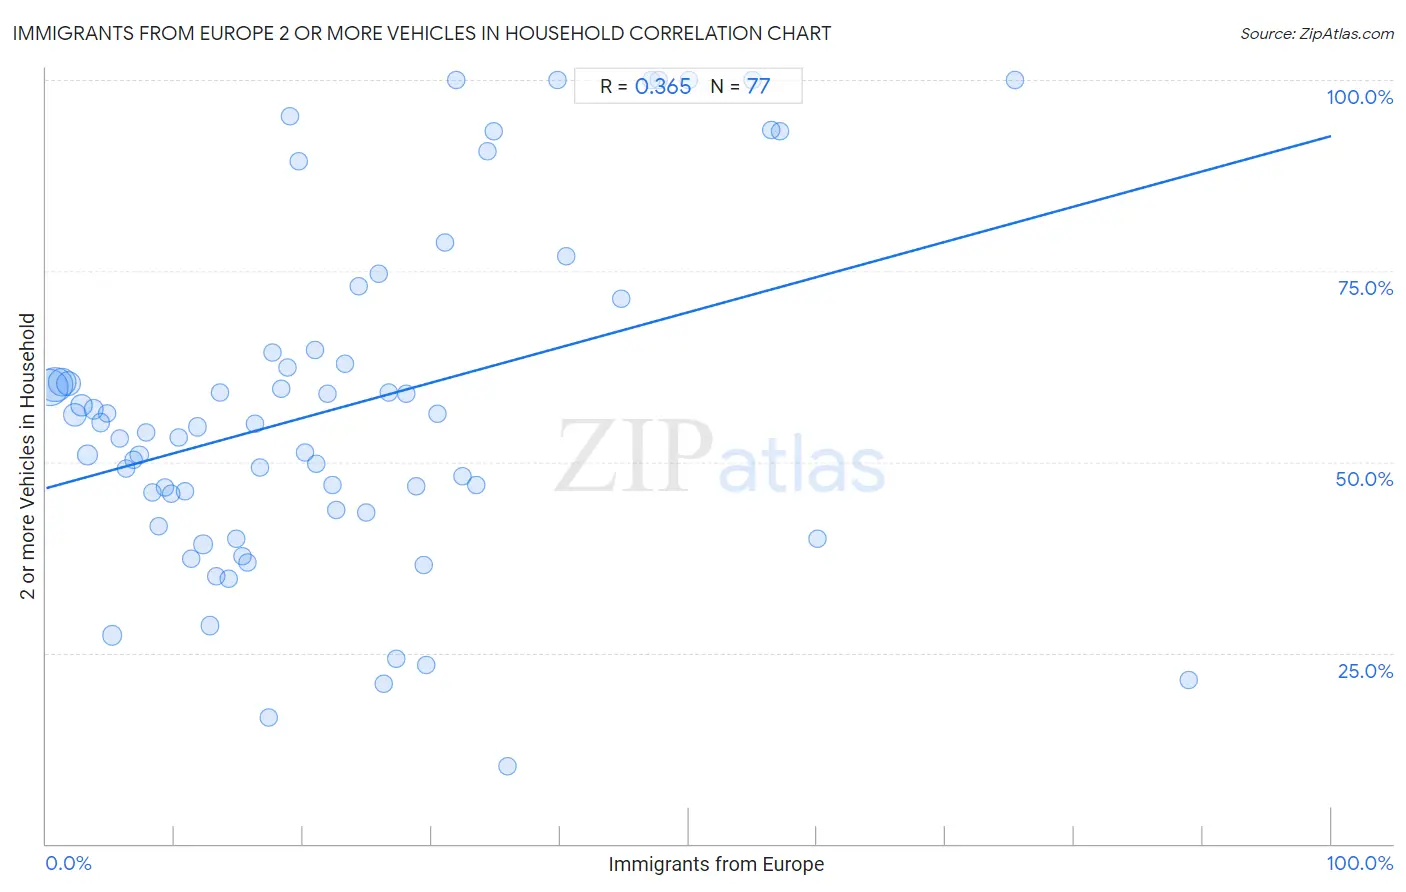
Immigrants from Europe 2 or more Vehicles in Household Correlation Chart
The statistical analysis conducted on geographies consisting of 546,948,405 people shows a mild positive correlation between the proportion of Immigrants from Europe and percentage of households with 2 or more vehicles available in the United States with a correlation coefficient (R) of 0.365 and weighted average of 53.2%. On average, for every 1% (one percent) increase in Immigrants from Europe within a typical geography, there is an increase of 0.46% in percentage of households with 2 or more vehicles available.
It is essential to understand that the correlation between the percentage of Immigrants from Europe and percentage of households with 2 or more vehicles available does not imply a direct cause-and-effect relationship. It remains uncertain whether the presence of Immigrants from Europe influences an upward or downward trend in the level of percentage of households with 2 or more vehicles available within an area, or if Immigrants from Europe simply ended up residing in those areas with higher or lower levels of percentage of households with 2 or more vehicles available due to other factors.
Demographics Similar to Immigrants from Europe by 2 or more Vehicles in Household
In terms of 2 or more vehicles in household, the demographic groups most similar to Immigrants from Europe are Immigrants from Sierra Leone (53.2%, a difference of 0.030%), Immigrants from Eastern Asia (53.2%, a difference of 0.030%), Immigrants from Armenia (53.3%, a difference of 0.070%), Cambodian (53.3%, a difference of 0.070%), and Macedonian (53.3%, a difference of 0.14%).
| Demographics | Rating | Rank | 2 or more Vehicles in Household |
| Ugandans | 3.2 /100 | #233 | Tragic 53.5% |
| Immigrants from Switzerland | 3.0 /100 | #234 | Tragic 53.4% |
| Immigrants from Middle Africa | 3.0 /100 | #235 | Tragic 53.4% |
| Indonesians | 2.7 /100 | #236 | Tragic 53.4% |
| Macedonians | 2.4 /100 | #237 | Tragic 53.3% |
| Immigrants from Armenia | 2.3 /100 | #238 | Tragic 53.3% |
| Cambodians | 2.3 /100 | #239 | Tragic 53.3% |
| Immigrants from Europe | 2.1 /100 | #240 | Tragic 53.2% |
| Immigrants from Sierra Leone | 2.1 /100 | #241 | Tragic 53.2% |
| Immigrants from Eastern Asia | 2.1 /100 | #242 | Tragic 53.2% |
| Ethiopians | 1.7 /100 | #243 | Tragic 53.1% |
| Indians (Asian) | 1.7 /100 | #244 | Tragic 53.1% |
| Immigrants from Ethiopia | 1.5 /100 | #245 | Tragic 53.0% |
| Immigrants from Nigeria | 1.2 /100 | #246 | Tragic 52.9% |
| Sierra Leoneans | 1.2 /100 | #247 | Tragic 52.9% |
Immigrants from Europe 2 or more Vehicles in Household Correlation Summary
| Measurement | Immigrants from Europe Data | 2 or more Vehicles in Household Data |
| Minimum | 0.26% | 10.1% |
| Maximum | 88.9% | 100.0% |
| Range | 88.6% | 89.9% |
| Mean | 22.7% | 57.0% |
| Median | 19.0% | 54.6% |
| Interquartile 25% (IQ1) | 9.5% | 43.6% |
| Interquartile 75% (IQ3) | 30.7% | 64.5% |
| Interquartile Range (IQR) | 21.2% | 20.9% |
| Standard Deviation (Sample) | 17.7% | 22.4% |
| Standard Deviation (Population) | 17.6% | 22.2% |
Correlation Details
| Immigrants from Europe Percentile | Sample Size | 2 or more Vehicles in Household |
[ 0.0% - 0.5% ] 0.26% | 142,997,370 | 59.7% |
[ 0.5% - 1.0% ] 0.72% | 129,892,873 | 60.1% |
[ 1.0% - 1.5% ] 1.24% | 81,391,996 | 60.5% |
[ 1.5% - 2.0% ] 1.72% | 51,010,698 | 60.2% |
[ 2.0% - 2.5% ] 2.25% | 40,427,174 | 56.1% |
[ 2.5% - 3.0% ] 2.74% | 23,851,879 | 57.4% |
[ 3.0% - 3.5% ] 3.25% | 18,886,305 | 51.0% |
[ 3.5% - 4.0% ] 3.73% | 10,719,060 | 56.9% |
[ 4.0% - 4.5% ] 4.24% | 8,543,081 | 55.1% |
[ 4.5% - 5.0% ] 4.73% | 5,705,815 | 56.4% |
[ 5.0% - 5.5% ] 5.13% | 14,321,900 | 27.3% |
[ 5.5% - 6.0% ] 5.74% | 4,169,943 | 53.1% |
[ 6.0% - 6.5% ] 6.24% | 2,766,550 | 49.1% |
[ 6.5% - 7.0% ] 6.76% | 2,542,207 | 50.2% |
[ 7.0% - 7.5% ] 7.23% | 1,481,977 | 51.0% |
[ 7.5% - 8.0% ] 7.74% | 1,272,401 | 53.8% |
[ 8.0% - 8.5% ] 8.27% | 956,612 | 46.0% |
[ 8.5% - 9.0% ] 8.71% | 840,020 | 41.6% |
[ 9.0% - 9.5% ] 9.26% | 806,746 | 46.7% |
[ 9.5% - 10.0% ] 9.75% | 493,983 | 45.8% |
[ 10.0% - 10.5% ] 10.28% | 643,437 | 53.3% |
[ 10.5% - 11.0% ] 10.76% | 112,543 | 46.1% |
[ 11.0% - 11.5% ] 11.30% | 312,655 | 37.4% |
[ 11.5% - 12.0% ] 11.77% | 493,330 | 54.6% |
[ 12.0% - 12.5% ] 12.21% | 407,372 | 39.2% |
[ 12.5% - 13.0% ] 12.73% | 181,419 | 28.6% |
[ 13.0% - 13.5% ] 13.21% | 289,387 | 35.1% |
[ 13.5% - 14.0% ] 13.55% | 125,399 | 59.0% |
[ 14.0% - 14.5% ] 14.19% | 237,268 | 34.7% |
[ 14.5% - 15.0% ] 14.80% | 140,327 | 39.9% |
[ 15.0% - 15.5% ] 15.30% | 237,814 | 37.6% |
[ 15.5% - 16.0% ] 15.71% | 39,842 | 36.8% |
[ 16.0% - 16.5% ] 16.25% | 58,439 | 54.9% |
[ 16.5% - 17.0% ] 16.68% | 122,288 | 49.2% |
[ 17.0% - 17.5% ] 17.35% | 83,241 | 16.6% |
[ 17.5% - 18.0% ] 17.64% | 2,869 | 64.3% |
[ 18.0% - 18.5% ] 18.24% | 37,688 | 59.6% |
[ 18.5% - 19.0% ] 18.77% | 3,911 | 62.3% |
[ 19.0% - 19.5% ] 19.01% | 142 | 95.2% |
[ 19.5% - 20.0% ] 19.66% | 2,431 | 89.4% |
[ 20.0% - 20.5% ] 20.18% | 65,907 | 51.2% |
[ 20.5% - 21.0% ] 20.87% | 436 | 64.7% |
[ 21.0% - 21.5% ] 21.06% | 30,714 | 49.7% |
[ 21.5% - 22.0% ] 21.84% | 2,289 | 58.9% |
[ 22.0% - 22.5% ] 22.30% | 2,049 | 47.0% |
[ 22.5% - 23.0% ] 22.53% | 648 | 43.7% |
[ 23.0% - 23.5% ] 23.28% | 799 | 62.8% |
[ 24.0% - 24.5% ] 24.31% | 469 | 73.0% |
[ 24.5% - 25.0% ] 24.95% | 473 | 43.4% |
[ 25.5% - 26.0% ] 25.83% | 391 | 74.7% |
[ 26.0% - 26.5% ] 26.24% | 202 | 20.9% |
[ 26.5% - 27.0% ] 26.65% | 17,166 | 59.0% |
[ 27.0% - 27.5% ] 27.26% | 72,291 | 24.2% |
[ 28.0% - 28.5% ] 28.03% | 23,200 | 58.9% |
[ 28.5% - 29.0% ] 28.80% | 8,942 | 46.9% |
[ 29.0% - 29.5% ] 29.41% | 238 | 36.5% |
[ 29.5% - 30.0% ] 29.60% | 402 | 23.4% |
[ 30.0% - 30.5% ] 30.43% | 46 | 56.2% |
[ 31.0% - 31.5% ] 31.06% | 483 | 78.6% |
[ 31.5% - 32.0% ] 31.88% | 69 | 100.0% |
[ 32.0% - 32.5% ] 32.43% | 37 | 48.1% |
[ 33.0% - 33.5% ] 33.42% | 25,808 | 46.9% |
[ 34.0% - 34.5% ] 34.34% | 332 | 90.7% |
[ 34.5% - 35.0% ] 34.78% | 207 | 93.4% |
[ 35.5% - 36.0% ] 35.90% | 83,069 | 10.1% |
[ 39.5% - 40.0% ] 39.78% | 93 | 100.0% |
[ 40.5% - 41.0% ] 40.51% | 274 | 76.9% |
[ 44.5% - 45.0% ] 44.74% | 38 | 71.4% |
[ 47.0% - 47.5% ] 47.06% | 68 | 100.0% |
[ 47.5% - 48.0% ] 47.69% | 65 | 100.0% |
[ 50.0% - 50.5% ] 50.00% | 42 | 100.0% |
[ 55.0% - 55.5% ] 55.00% | 20 | 100.0% |
[ 56.0% - 56.5% ] 56.39% | 321 | 93.5% |
[ 57.0% - 57.5% ] 57.14% | 133 | 93.3% |
[ 60.0% - 60.5% ] 60.00% | 25 | 40.0% |
[ 75.0% - 75.5% ] 75.42% | 240 | 100.0% |
[ 88.5% - 89.0% ] 88.89% | 27 | 21.4% |