Immigrants from Europe Disability Age Under 5
COMPARE
Immigrants from Europe
Select to Compare
Disability Age Under 5
Immigrants from Europe Disability Age Under 5
1.3%
DISABILITY | AGE UNDER 5
23.6/ 100
METRIC RATING
204th/ 347
METRIC RANK
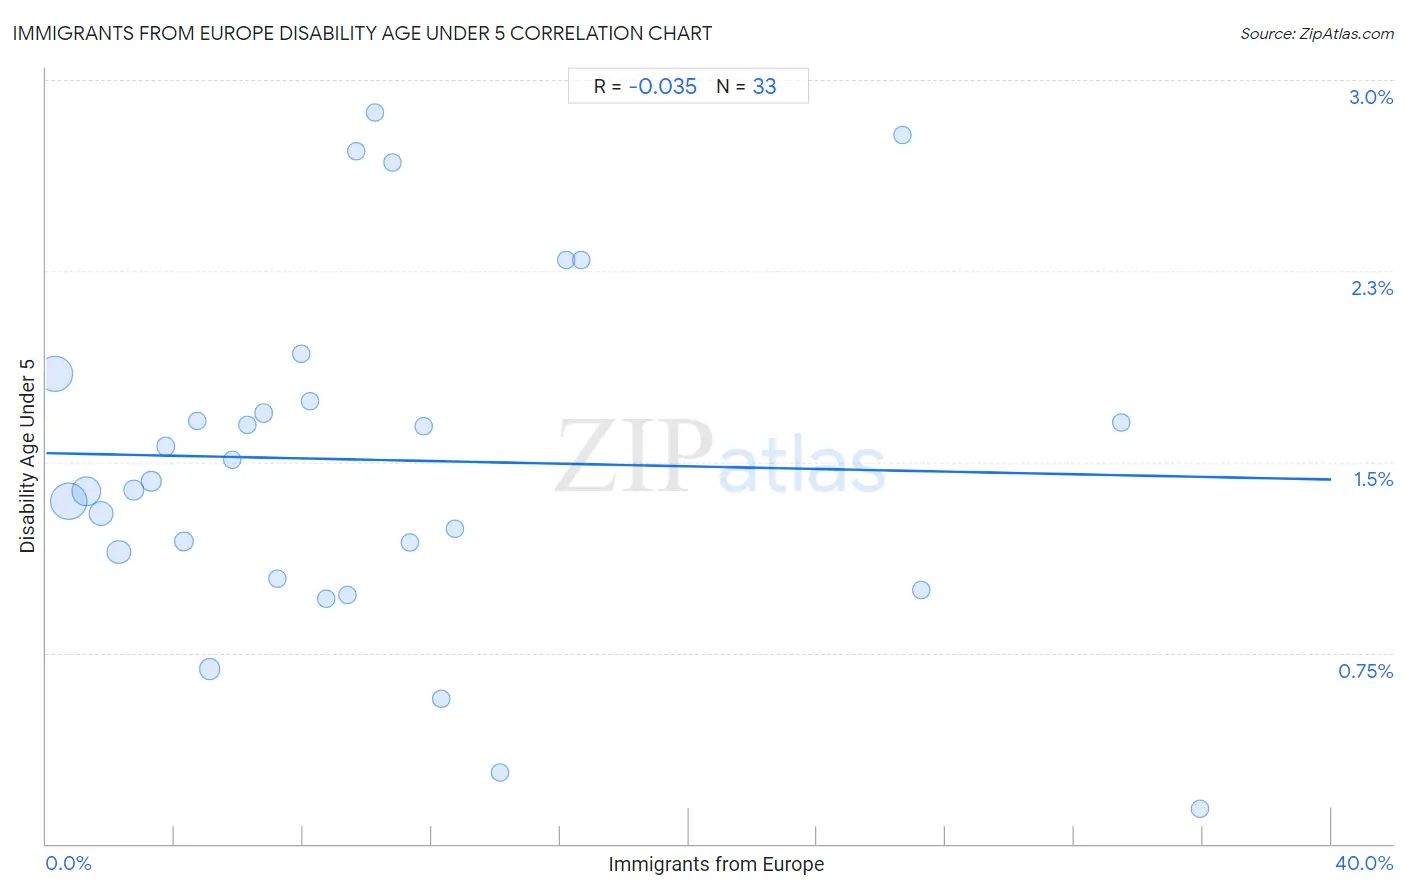
Immigrants from Europe Disability Age Under 5 Correlation Chart
The statistical analysis conducted on geographies consisting of 257,665,237 people shows no correlation between the proportion of Immigrants from Europe and percentage of population with a disability under the age of 5 in the United States with a correlation coefficient (R) of -0.035 and weighted average of 1.3%. On average, for every 1% (one percent) increase in Immigrants from Europe within a typical geography, there is a decrease of 0.0026% in percentage of population with a disability under the age of 5.
It is essential to understand that the correlation between the percentage of Immigrants from Europe and percentage of population with a disability under the age of 5 does not imply a direct cause-and-effect relationship. It remains uncertain whether the presence of Immigrants from Europe influences an upward or downward trend in the level of percentage of population with a disability under the age of 5 within an area, or if Immigrants from Europe simply ended up residing in those areas with higher or lower levels of percentage of population with a disability under the age of 5 due to other factors.
Demographics Similar to Immigrants from Europe by Disability Age Under 5
In terms of disability age under 5, the demographic groups most similar to Immigrants from Europe are Liberian (1.3%, a difference of 0.050%), Arapaho (1.3%, a difference of 0.060%), Romanian (1.3%, a difference of 0.14%), Immigrants from Poland (1.3%, a difference of 0.16%), and Immigrants from Italy (1.3%, a difference of 0.21%).
| Demographics | Rating | Rank | Disability Age Under 5 |
| Immigrants from Somalia | 31.3 /100 | #197 | Fair 1.3% |
| Immigrants from Norway | 31.1 /100 | #198 | Fair 1.3% |
| Jamaicans | 30.7 /100 | #199 | Fair 1.3% |
| Immigrants from Lithuania | 27.2 /100 | #200 | Fair 1.3% |
| Immigrants from Italy | 25.4 /100 | #201 | Fair 1.3% |
| Arapaho | 24.1 /100 | #202 | Fair 1.3% |
| Liberians | 24.0 /100 | #203 | Fair 1.3% |
| Immigrants from Europe | 23.6 /100 | #204 | Fair 1.3% |
| Romanians | 22.5 /100 | #205 | Fair 1.3% |
| Immigrants from Poland | 22.4 /100 | #206 | Fair 1.3% |
| Nigerians | 21.2 /100 | #207 | Fair 1.3% |
| Mexicans | 20.8 /100 | #208 | Fair 1.3% |
| Bulgarians | 19.5 /100 | #209 | Poor 1.3% |
| Pakistanis | 19.4 /100 | #210 | Poor 1.3% |
| Immigrants from Greece | 19.1 /100 | #211 | Poor 1.3% |
Immigrants from Europe Disability Age Under 5 Correlation Summary
| Measurement | Immigrants from Europe Data | Disability Age Under 5 Data |
| Minimum | 0.27% | 0.14% |
| Maximum | 35.9% | 2.9% |
| Range | 35.6% | 2.7% |
| Mean | 10.3% | 1.5% |
| Median | 8.2% | 1.4% |
| Interquartile 25% (IQ1) | 4.0% | 1.1% |
| Interquartile 75% (IQ3) | 12.5% | 1.8% |
| Interquartile Range (IQR) | 8.5% | 0.70% |
| Standard Deviation (Sample) | 9.0% | 0.67% |
| Standard Deviation (Population) | 8.8% | 0.66% |
Correlation Details
| Immigrants from Europe Percentile | Sample Size | Disability Age Under 5 |
[ 0.0% - 0.5% ] 0.27% | 62,223,668 | 1.8% |
[ 0.5% - 1.0% ] 0.72% | 67,349,046 | 1.3% |
[ 1.0% - 1.5% ] 1.25% | 39,986,187 | 1.4% |
[ 1.5% - 2.0% ] 1.72% | 23,973,895 | 1.3% |
[ 2.0% - 2.5% ] 2.27% | 21,372,355 | 1.1% |
[ 2.5% - 3.0% ] 2.73% | 8,591,461 | 1.4% |
[ 3.0% - 3.5% ] 3.26% | 8,926,687 | 1.4% |
[ 3.5% - 4.0% ] 3.72% | 3,380,926 | 1.6% |
[ 4.0% - 4.5% ] 4.27% | 3,308,476 | 1.2% |
[ 4.5% - 5.0% ] 4.69% | 1,640,888 | 1.7% |
[ 5.0% - 5.5% ] 5.10% | 10,958,195 | 0.69% |
[ 5.5% - 6.0% ] 5.78% | 1,442,833 | 1.5% |
[ 6.0% - 6.5% ] 6.25% | 842,173 | 1.6% |
[ 6.5% - 7.0% ] 6.77% | 719,114 | 1.7% |
[ 7.0% - 7.5% ] 7.19% | 613,459 | 1.0% |
[ 7.5% - 8.0% ] 7.95% | 222,834 | 1.9% |
[ 8.0% - 8.5% ] 8.19% | 217,917 | 1.7% |
[ 8.5% - 9.0% ] 8.72% | 154,048 | 0.96% |
[ 9.0% - 9.5% ] 9.37% | 253,372 | 0.98% |
[ 9.5% - 10.0% ] 9.67% | 173,497 | 2.7% |
[ 10.0% - 10.5% ] 10.25% | 146,874 | 2.9% |
[ 10.5% - 11.0% ] 10.78% | 19,072 | 2.7% |
[ 11.0% - 11.5% ] 11.32% | 226,942 | 1.2% |
[ 11.5% - 12.0% ] 11.73% | 240,130 | 1.6% |
[ 12.0% - 12.5% ] 12.28% | 171,698 | 0.57% |
[ 12.5% - 13.0% ] 12.74% | 148,313 | 1.2% |
[ 14.0% - 14.5% ] 14.11% | 105,521 | 0.28% |
[ 16.0% - 16.5% ] 16.18% | 30,637 | 2.3% |
[ 16.5% - 17.0% ] 16.65% | 30,857 | 2.3% |
[ 26.5% - 27.0% ] 26.66% | 15,291 | 2.8% |
[ 27.0% - 27.5% ] 27.26% | 72,126 | 1.00% |
[ 33.0% - 33.5% ] 33.45% | 23,676 | 1.7% |
[ 35.5% - 36.0% ] 35.90% | 83,069 | 0.14% |