Immigrants from Australia vs Peruvian Married-Couple Family Poverty
COMPARE
Immigrants from Australia
Peruvian
Married-Couple Family Poverty
Married-Couple Family Poverty Comparison
Immigrants from Australia
Peruvians
4.4%
MARRIED-COUPLE FAMILY POVERTY
99.6/ 100
METRIC RATING
62nd/ 347
METRIC RANK
5.3%
MARRIED-COUPLE FAMILY POVERTY
37.6/ 100
METRIC RATING
183rd/ 347
METRIC RANK
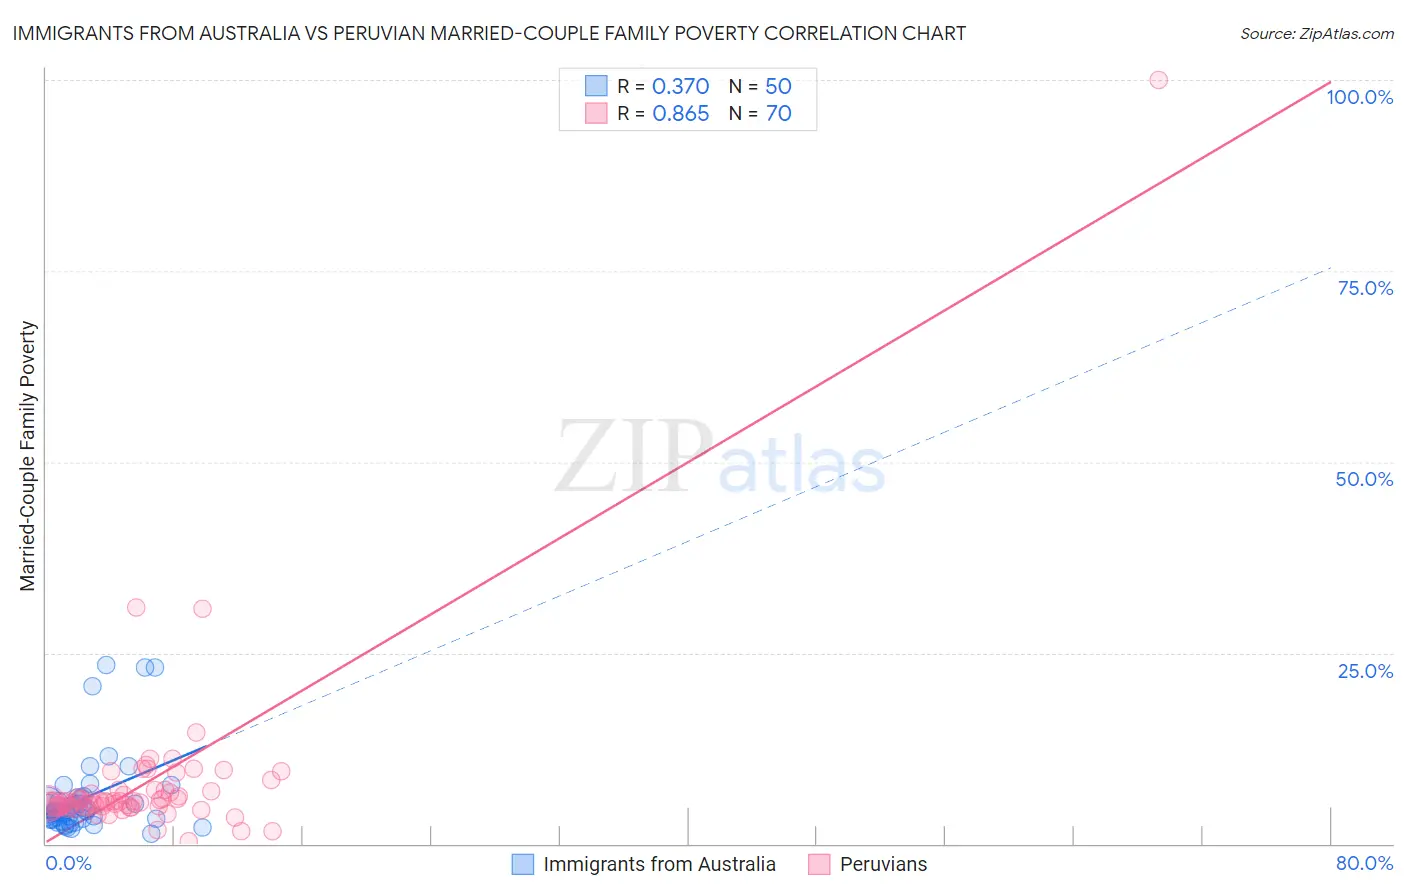
Immigrants from Australia vs Peruvian Married-Couple Family Poverty Correlation Chart
The statistical analysis conducted on geographies consisting of 225,813,318 people shows a mild positive correlation between the proportion of Immigrants from Australia and poverty level among married-couple families in the United States with a correlation coefficient (R) of 0.370 and weighted average of 4.4%. Similarly, the statistical analysis conducted on geographies consisting of 360,614,929 people shows a very strong positive correlation between the proportion of Peruvians and poverty level among married-couple families in the United States with a correlation coefficient (R) of 0.865 and weighted average of 5.3%, a difference of 20.8%.
Married-Couple Family Poverty Correlation Summary
| Measurement | Immigrants from Australia | Peruvian |
| Minimum | 1.3% | 0.26% |
| Maximum | 23.4% | 100.0% |
| Range | 22.1% | 99.7% |
| Mean | 6.0% | 8.0% |
| Median | 4.3% | 5.5% |
| Interquartile 25% (IQ1) | 3.2% | 4.9% |
| Interquartile 75% (IQ3) | 6.0% | 7.0% |
| Interquartile Range (IQR) | 2.8% | 2.2% |
| Standard Deviation (Sample) | 5.4% | 12.1% |
| Standard Deviation (Population) | 5.3% | 12.1% |
Similar Demographics by Married-Couple Family Poverty
Demographics Similar to Immigrants from Australia by Married-Couple Family Poverty
In terms of married-couple family poverty, the demographic groups most similar to Immigrants from Australia are Okinawan (4.4%, a difference of 0.010%), Tlingit-Haida (4.4%, a difference of 0.12%), Immigrants from Sweden (4.4%, a difference of 0.19%), Immigrants from Sri Lanka (4.4%, a difference of 0.36%), and Czechoslovakian (4.4%, a difference of 0.74%).
| Demographics | Rating | Rank | Married-Couple Family Poverty |
| French | 99.7 /100 | #55 | Exceptional 4.3% |
| Immigrants | Zimbabwe | 99.7 /100 | #56 | Exceptional 4.3% |
| Immigrants | Netherlands | 99.7 /100 | #57 | Exceptional 4.3% |
| Czechoslovakians | 99.7 /100 | #58 | Exceptional 4.4% |
| Immigrants | Sweden | 99.6 /100 | #59 | Exceptional 4.4% |
| Tlingit-Haida | 99.6 /100 | #60 | Exceptional 4.4% |
| Okinawans | 99.6 /100 | #61 | Exceptional 4.4% |
| Immigrants | Australia | 99.6 /100 | #62 | Exceptional 4.4% |
| Immigrants | Sri Lanka | 99.6 /100 | #63 | Exceptional 4.4% |
| Immigrants | Bulgaria | 99.5 /100 | #64 | Exceptional 4.4% |
| Macedonians | 99.4 /100 | #65 | Exceptional 4.4% |
| Immigrants | Serbia | 99.4 /100 | #66 | Exceptional 4.4% |
| Immigrants | Canada | 99.4 /100 | #67 | Exceptional 4.4% |
| Slavs | 99.4 /100 | #68 | Exceptional 4.4% |
| New Zealanders | 99.4 /100 | #69 | Exceptional 4.4% |
Demographics Similar to Peruvians by Married-Couple Family Poverty
In terms of married-couple family poverty, the demographic groups most similar to Peruvians are Immigrants from Vietnam (5.3%, a difference of 0.010%), Immigrants from Chile (5.3%, a difference of 0.14%), Immigrants from Sierra Leone (5.3%, a difference of 0.20%), Nonimmigrants (5.3%, a difference of 0.22%), and American (5.3%, a difference of 0.28%).
| Demographics | Rating | Rank | Married-Couple Family Poverty |
| Menominee | 47.8 /100 | #176 | Average 5.2% |
| Immigrants | Kazakhstan | 45.1 /100 | #177 | Average 5.2% |
| Immigrants | Ukraine | 44.9 /100 | #178 | Average 5.2% |
| Spanish | 41.4 /100 | #179 | Average 5.3% |
| Immigrants | Sierra Leone | 39.3 /100 | #180 | Fair 5.3% |
| Immigrants | Chile | 38.8 /100 | #181 | Fair 5.3% |
| Immigrants | Vietnam | 37.7 /100 | #182 | Fair 5.3% |
| Peruvians | 37.6 /100 | #183 | Fair 5.3% |
| Immigrants | Nonimmigrants | 35.8 /100 | #184 | Fair 5.3% |
| Americans | 35.4 /100 | #185 | Fair 5.3% |
| Hungarians | 34.7 /100 | #186 | Fair 5.3% |
| Immigrants | Albania | 33.8 /100 | #187 | Fair 5.3% |
| Israelis | 33.1 /100 | #188 | Fair 5.3% |
| South American Indians | 32.5 /100 | #189 | Fair 5.3% |
| Ugandans | 31.6 /100 | #190 | Fair 5.3% |